Article

An Early Fault Diagnosis Method for Ball Bearings of Electric Vehicles Based on Integrated Subband Averaging and Enhanced Kurtogram Method

1
Korea Institute of Industrial Technology, Electric Vehicle Diagnostic Technology Center, 102, Jejudaehak-ro, Jeju-si 63243, Jeju-do, Korea
2
Department of Mechanical Engineering, Jeju National University, 102, Jejudaehak-ro, Jeju-si 63243, Jeju-do, Korea
*
Author to whom correspondence should be addressed.
Energies 2022, 15(15), 5510; https://doi.org/10.3390/en15155510
Submission received: 28 June 2022 / Revised: 22 July 2022 / Accepted: 26 July 2022 / Published: 29 July 2022

Abstract

:
Faults of mechanical transmission systems generally occur in the rotating bearing part at high speeds, which causes problems such as performance degradation of transmission, generation of noise or vibration, and additional damage to connected adjacent systems. In this way, faults cause adverse effects to the entire system, such as deterioration and damage. The early detection and correction of bearing problems allows for improved system safety and the reduction of maintenance costs, resulting in efficient system operation. As a result, a variety of methods have been developed by many researchers in order to diagnose bearing mechanical defects, and one of the most representative methods is applying various signal processing techniques to vibration data. Wavelet packet transform (WPT) and kurtogram were used in this study to identify the frequency band that contained the fault component, and the enhanced kurtogram technique was used to analyze the fault. A technique for minimizing the effect of intermittent abnormal peak components caused by noise and external influences has been presented using sub-band averaging to detect early fault frequency component detection and fault development. Using the technique proposed in this study, the state of the bearing based on the degree of fault was evaluated quantitatively, and it was demonstrated experimentally that the bearing fault frequency could be detected at an early stage by the filtered data. In a situation where it is difficult to accept all the detailed design specifications and operating conditions of the complex mechanical systems at industrial sites, determining the degree of fault with simple time-series data and detecting fault components at an early stage is a practical analysis technique for fault diagnosis in the industrial field using various rotating bodies.

1. Introduction

Since many governments pledged to increase the share of vehicle electrification to achieve their net-zero target, more than 10 million electric vehicles (EV) have been registered on the roads globally [1]. It is well-known that EV which have two-to four-times higher efficiency than internal combustion engines (ICE) can help reducing greenhouse gas emissions as well as dependency on fossil-based fuel in the transportation sector [2,3].
Bearings are a crucial component that ensures all types vehicles will perform well. By carrying the load and facilitating the transfer of torque, bearings enhance the performance of all rotating parts in systems [4]. Moreover, bearings can achieve their performance by selecting the right materials, using the right manufacturing technology, and optimizing the geometry, sealing, and lubrication [5]. However, due to the harsh working conditions that bearings are subjected to, ranging from high speeds and alternating speeds to heavy loads and alternating loads, and they are susceptible to a wide range of damages, including fatigue pitting, wear, spalling, and cracking [6].
In comparison with conventional internal combustion engine vehicles, electric vehicles have significantly higher mechanical stresses due to their high output power, high RPM, and heavier weight [7]. Since increasing passenger comfort and reducing system noise are key concerns in electric vehicles, in the case of damaged bearings rotating at high speeds, noise and vibration caused by damage degrade stability and quality, thereby degrading the user’s safety and satisfaction [8]. To compensate for this, for fault diagnosis and prediction of rotating bodies, a technique to improve the diagnosis performance according to the sensor position [9] and the prediction accuracy using artificial intelligence techniques was proposed [10]. In addition, studies such as a Bayesian network-based data-based early fault diagnosis method of PMSM are proposed using vibration and acoustic emission data [11], or the Takagi-Sugeno fuzzy model was applied to develop a sensor fault diagnosis of an EV [12].
There have been numerous academic studies to diagnose bearing problems for example, by using Spectral Kurtosis (SK) technique with vibration data. A variety of fault diagnosis techniques have been developed based on kurtosis, which is used to quantify the degree of tailedness of probability distributions of a real-valued random variable [13,14,15]. J. Zhong et al. demonstrated improvement in the fault diagnosis performance through weighted residual regression in the existing kurtosis to diagnose fault at an early stage and provided a clear degradation assessment [16]. Additionally, the SK, which is a kurtosis value in the frequency domain, plays a vital role in fault diagnosis because it allows selection of a hidden fault frequency band by analyzing the kurtosis value [13,17,18,19,20]. Several studies involving rotating bodies such as gearboxes have been published based on SK [21,22,23]. A number of research studies have investigated the use of current signals as diagnostic tools to diagnose faults in motor bearings or gearboxes [24,25,26]. Furthermore, the importance of average kurtosis values is increasingly highlighted as a means to minimize the effect of noise and to facilitate accurate diagnosis by enabling the detection of fault frequency components. As a result, those studies show that techniques using spectral kurtosis are effective for diagnosing bearing faults, mainly because they can quantitatively find the band containing the fault frequency component. Moreover, in time-frequency analysis, the WPT that has high resolution in both time and frequency domain is shown to be more effective for fault diagnosis than the conventional Short-time Fourier Transform (STFT). However, it has not yet been sufficiently investigated how to reliably diagnose early signs of fault, and in particular, how to quantitatively track the extent of fault with its development.
Using an adaptive analysis technique, Z. Liu et al. demonstrated improved fault diagnosis efficiency by removing fault components from multiple band regions without fixing the carving panel of the conventional kurtogram, and finally the multi-period impulse component was effectively extracted [27]. In addition, Y. Hu et al. selected the optimal frequency band including the fault component through the morphological filter using the maxima distribution plane to select the optimum fault frequency by combining the adaptive band region [28]. However, in this case, it was not possible to prevent all malfunctions of the spectral kurtosis-based diagnostic method, which has an excessively large value due to the influence of external noise and the introduction of abnormal peak components. To address this deficiency, a technique for more effectively evaluating periodic fault components through analysis based on average values has recently been investigated. By maximizing the average kurtosis of the filtered signal, as proposed by K. Liang et al., the fault of the bearing was diagnosed by maximizing the extraction of the impulse fault signature. Here, it was confirmed that the robustness to external noise was excellent, and it was also shown that it is possible to detect the fault frequency component even when the rotation speed changes [29]. In addition, L. Wang showed that it is possible to detect the fault frequency of a gearbox through the WPT-based kurtogram and the sub-band averaging kurtogram [30].
Although the above studies show the performance of the fault diagnosis of the mechanical system based on the kurtogram, the consistent tendency according to the level of development of the fault has not been sufficiently verified and whether it is possible to distinguish according to the level of fault. This is an essential requirement at industrial sites for cost reduction through rapid maintenance of the mechanical system and continuous and stable operation of the system. In this study, it was confirmed that effective fault diagnosis is possible with the enhanced kurtogram based on WPT. Furthermore, by using the subband averaging technique to extract the incipient fault frequency component, an effective diagnostic algorithm was developed that can detect anomalies at an early stage was developed. This provides time to establish sufficient maintenance strategies through early detection for system faults and anomalies in advance and can be evaluated as an effective method that can be directly applied to mechanical systems in many industries.
In this study, it was experimentally verified that early fault diagnosis can be achieved by applying the sub-band averaging enhanced kurtogram method for diagnosing incipient faults of bearings. Through Intermediate Shaft (IMS) bearing data, the occurrence of fault symptoms in the life cycle data was observed to show a tendency of gradual increase, and it was confirmed that the performance of fault frequency detection was excellent as a result of actual frequency analysis. In addition, by verifying the results of discriminating the level faults such as normal, incipient, and severe through bearing experimental data from the Air Handling Unit (AHU), a large air circulation equipment for ships, it was verified that the diagnostic algorithm proposed in this study was reliable in discriminating performance based on the fault level. Section 2 explains the theoretical background of the kurtogram, WPT, and sub-band averaging method proposed in this study, and explains the fault diagnosis technique using these methods. In Section 3, the experiment and configuration for the application of the proposed algorithm and the verification of the results are presented. Finally, Section 4 verifies the significance and importance of the proposed approach.

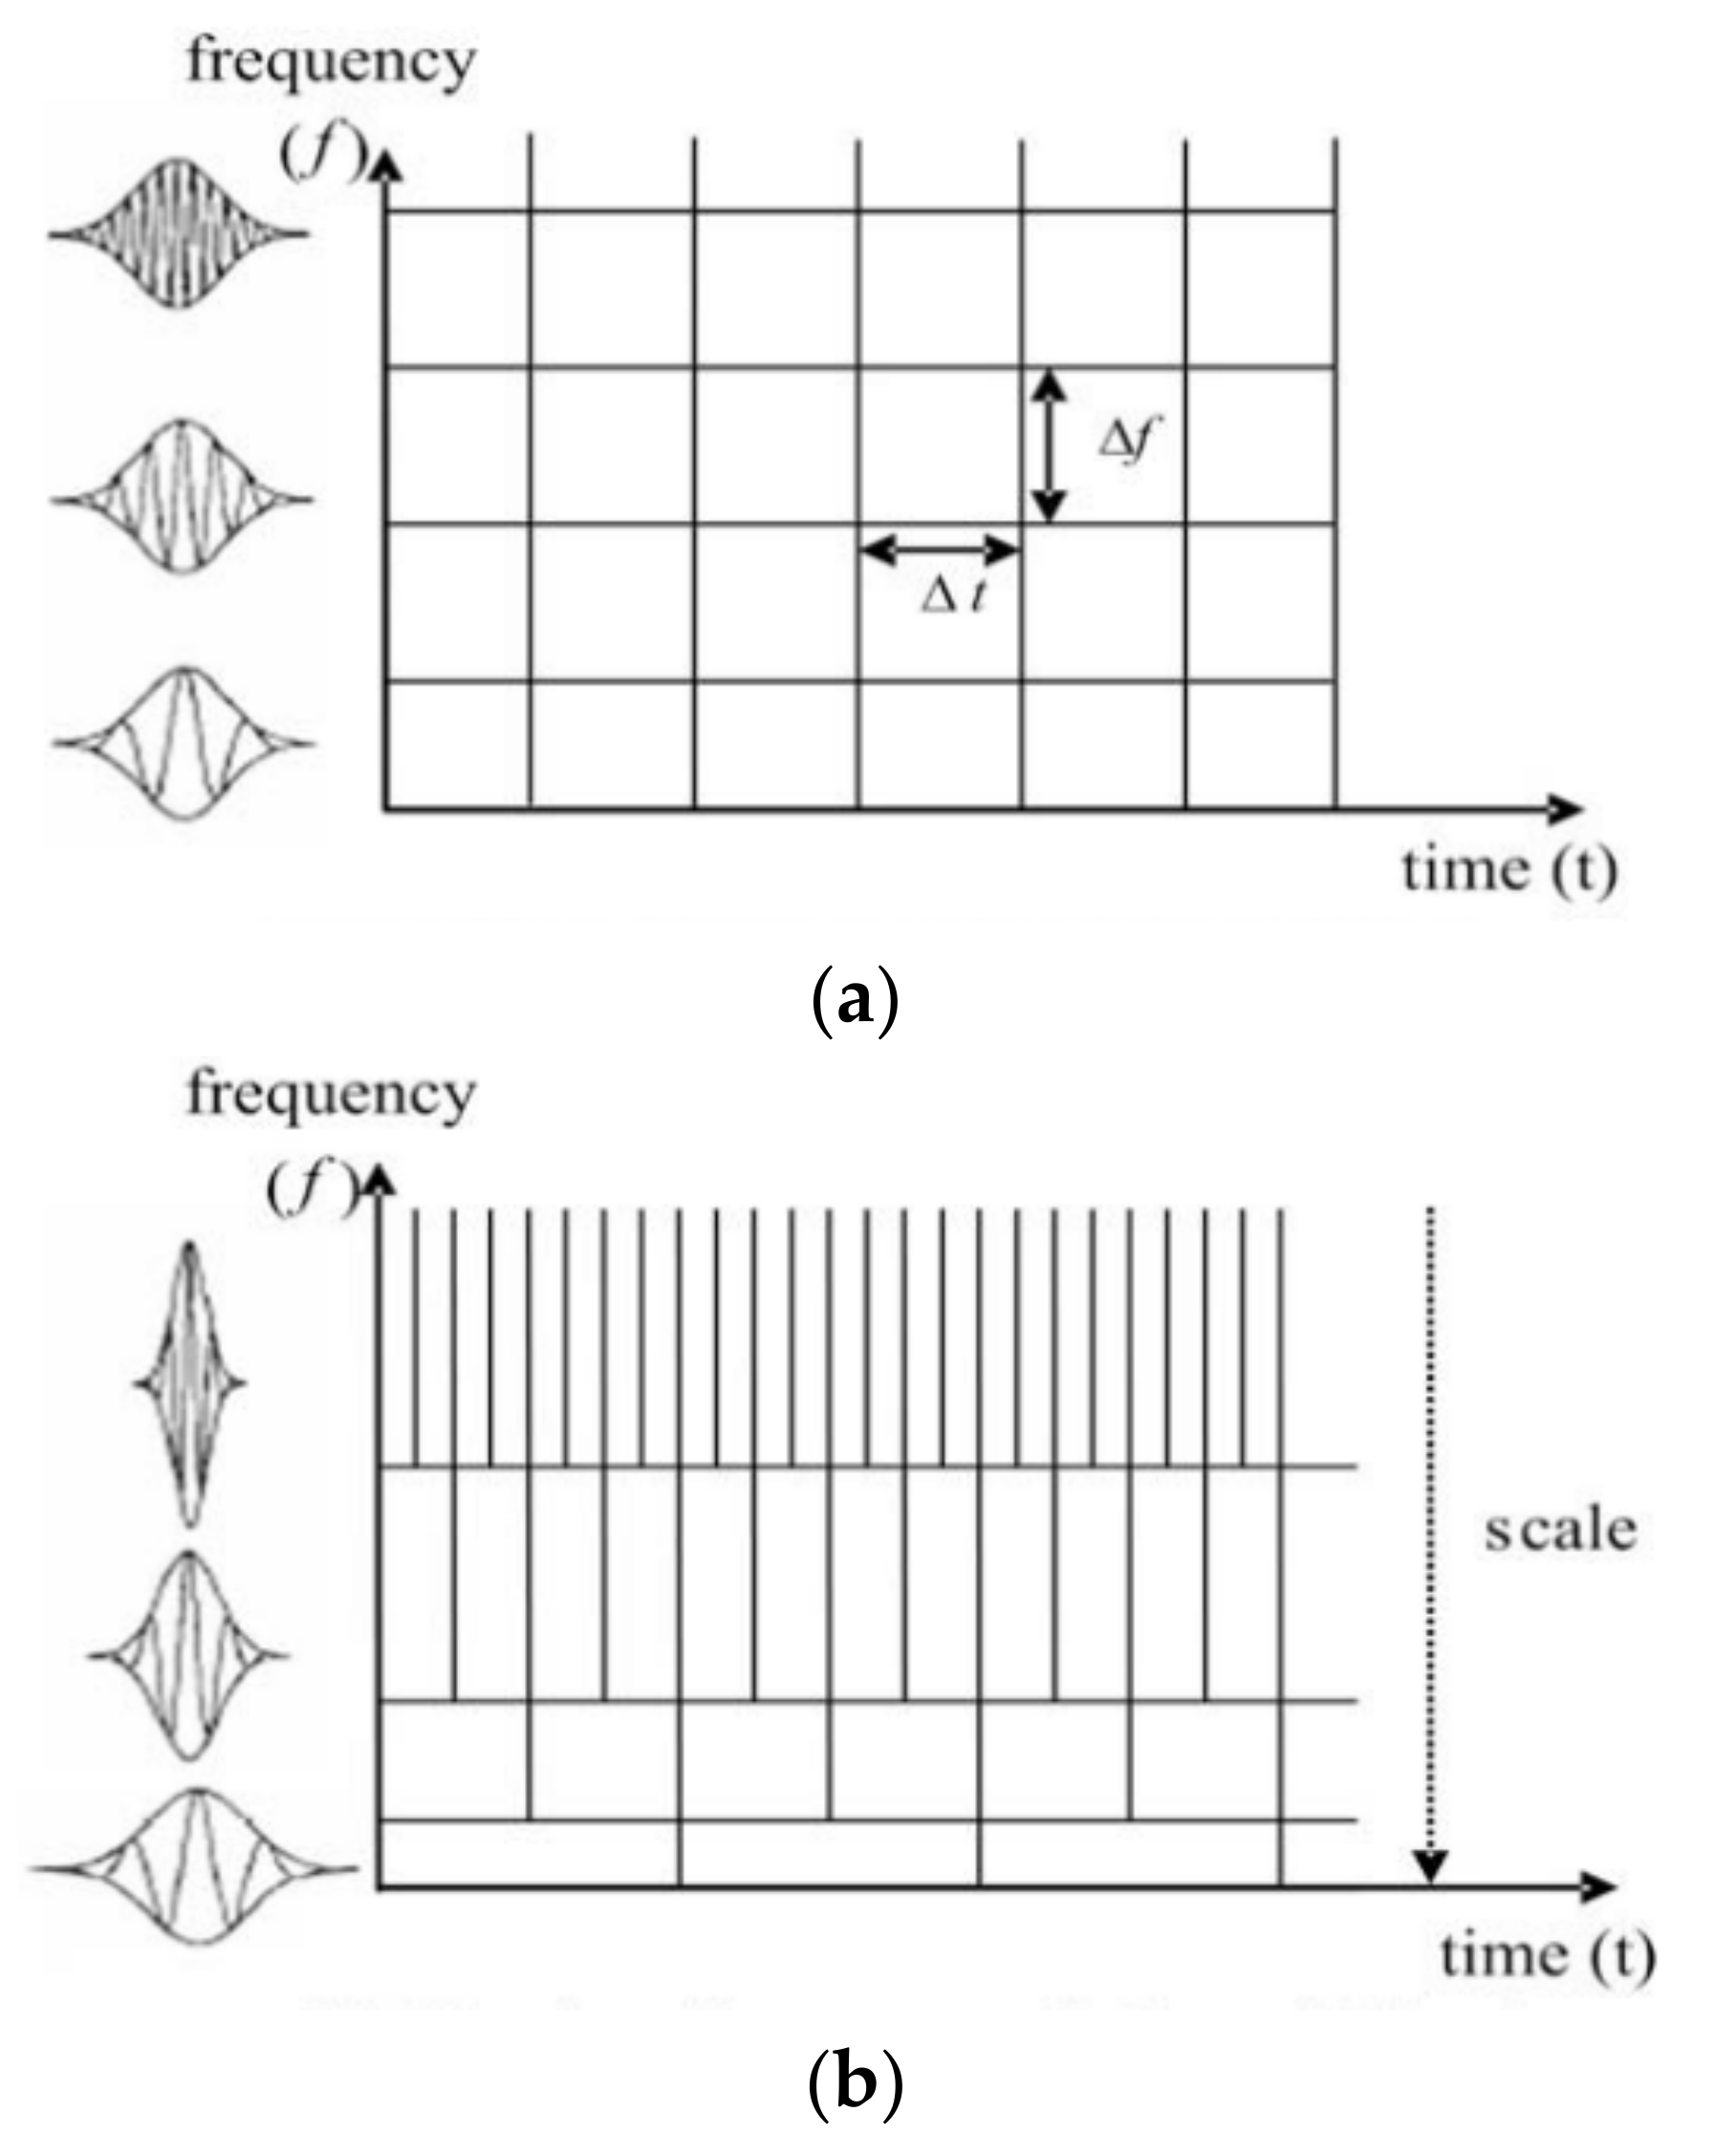
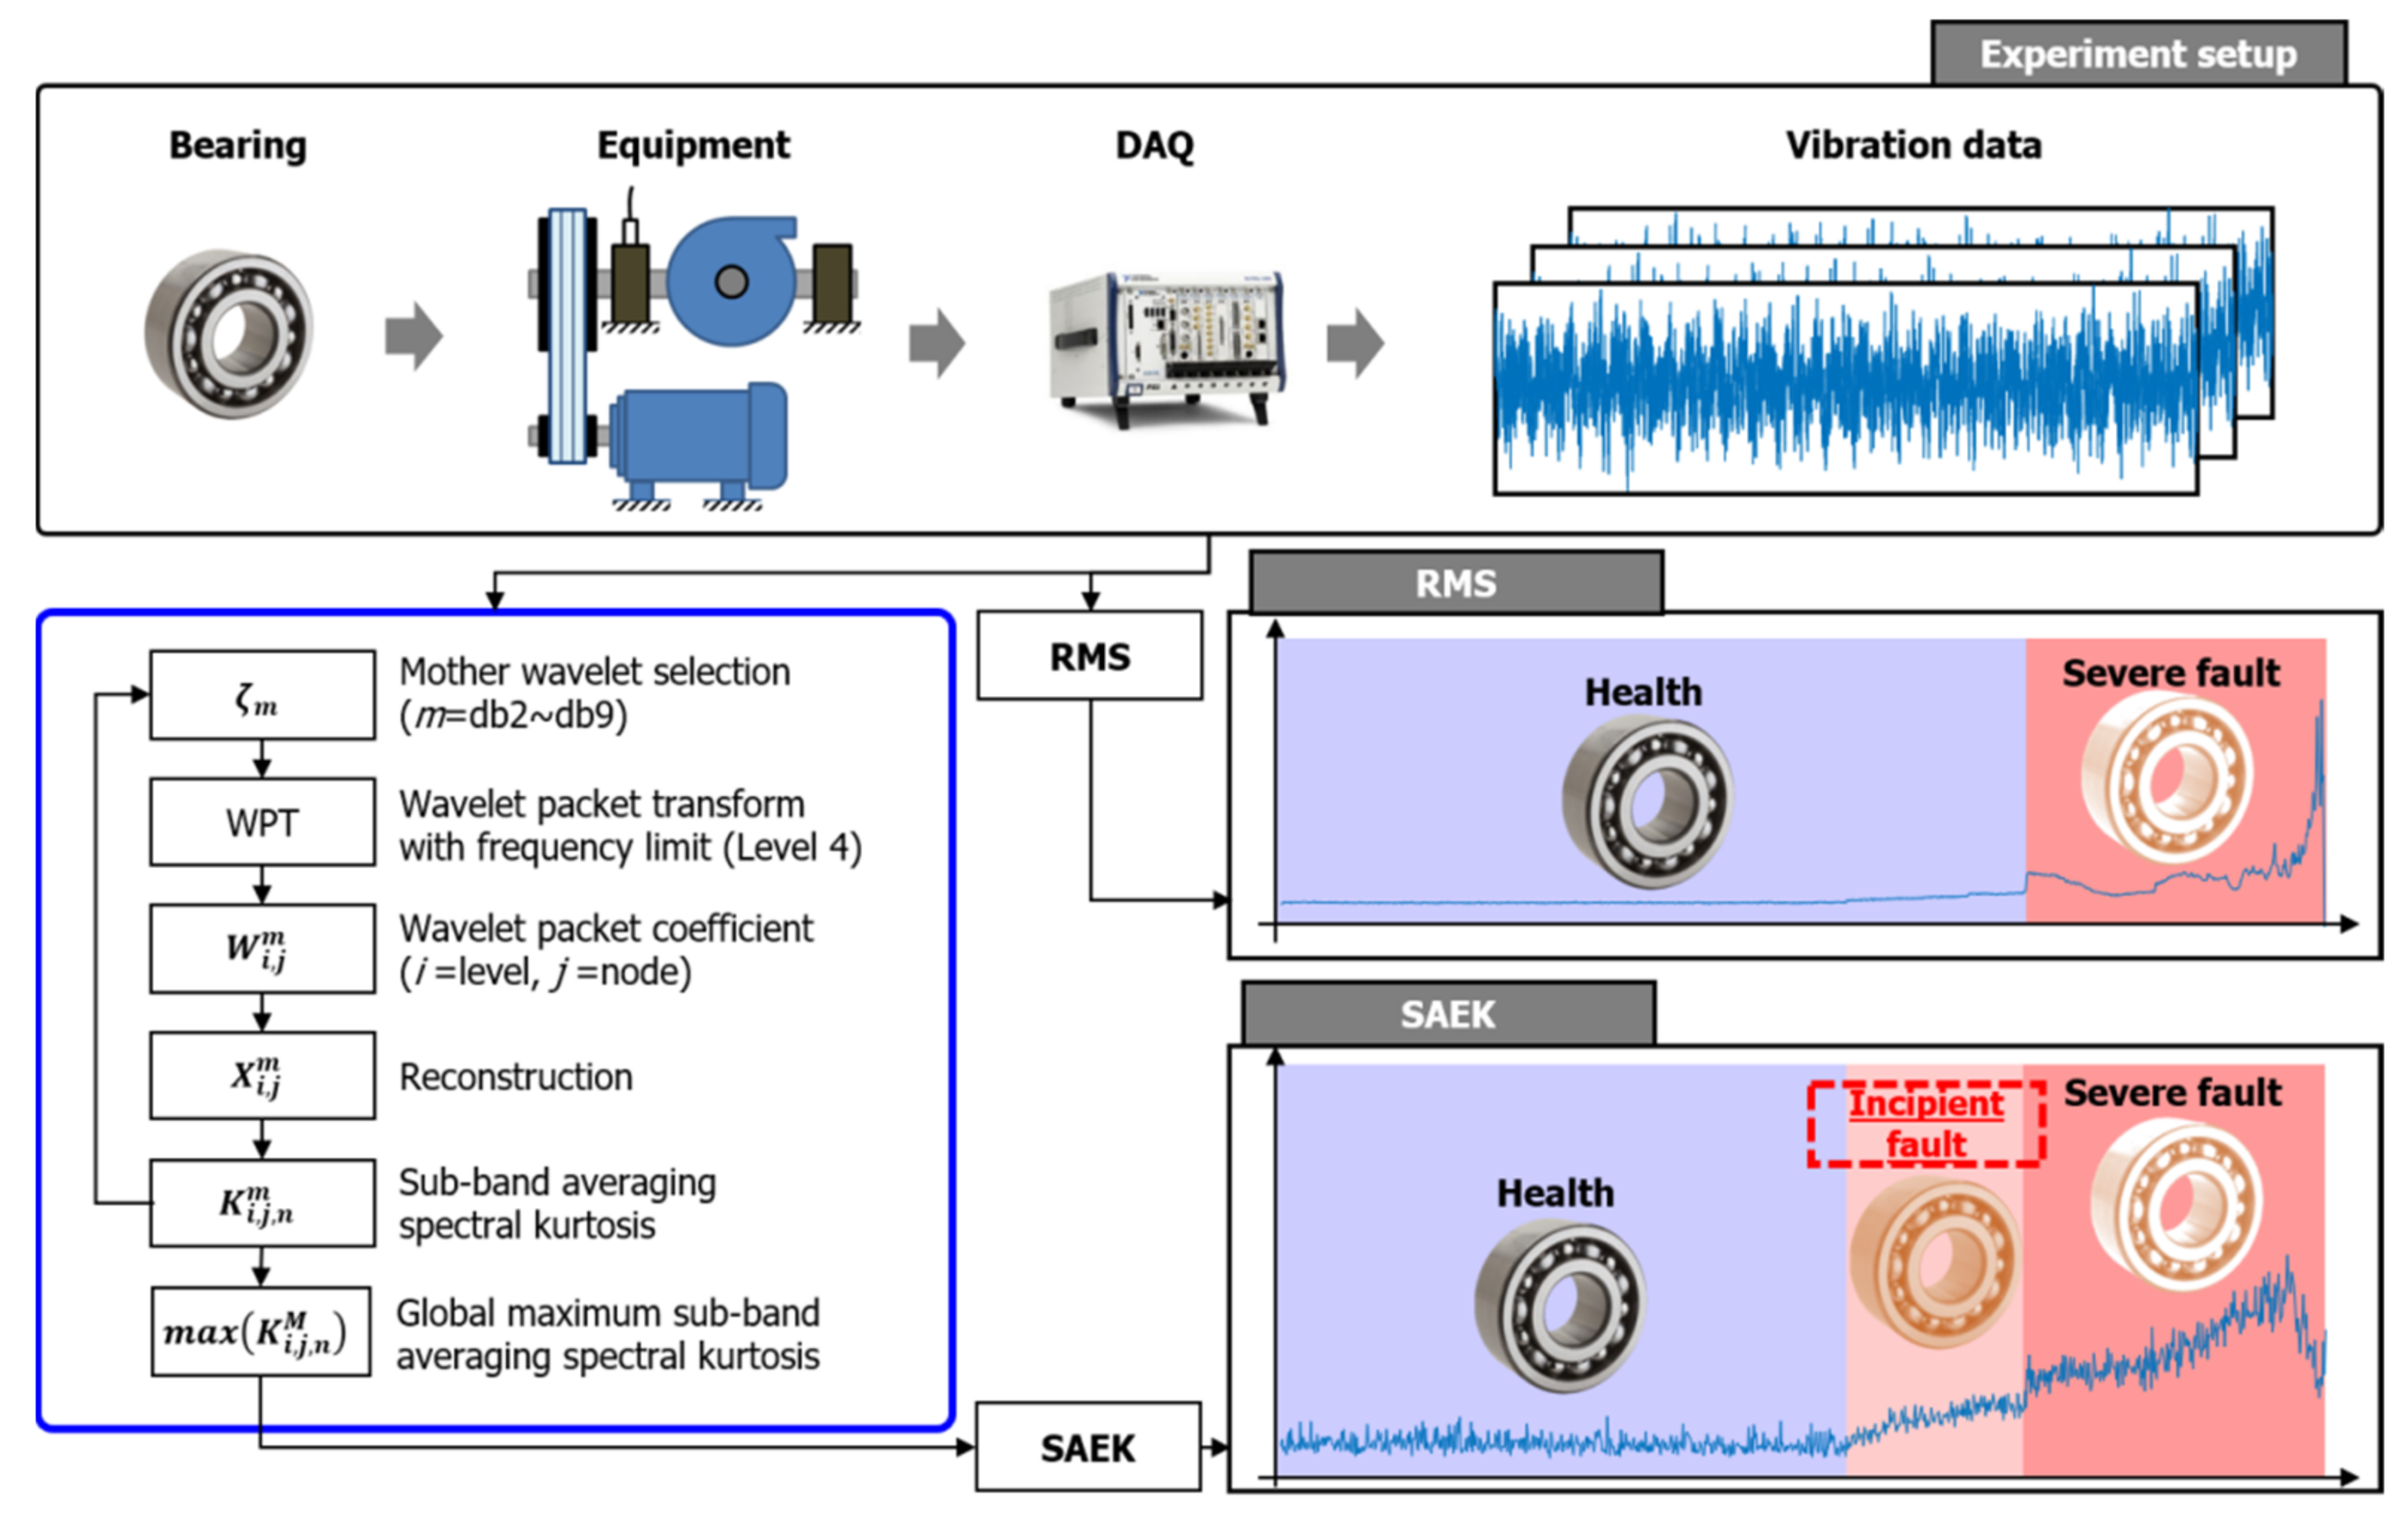
2. Theoretical Background

Kurtosis quantitatively measures the peakedness of time series data and is used as a good evaluation factor to detect fault components hidden in signals, and is expressed as the following formula.
K u r t o s i s x = E x μ 4 σ 4 3
where μ and σ are the mean and standard deviation, and E{⋅} is the expected value. Subtracting 3 from the Equation (1) is done to make the normal distribution of kurtosis equal to zero. Here, the optimal region including the fault frequency is selected and analyzed through the kurtogram, a map that derives the kurtosis value for each frequency section in the time-frequency plane based on STFT. By considering the process Y t with an analysis window w n of length N w and a given temporal stepsize P , the STFT is written as
Y w k P , f = n = Y n w n k P e j 2 π n f
S ^ 2 n Y f = Y w k P , f 2 n k
K ^ Y f = S ^ 4 Y f S ^ 4 Y 2 f 2 ,   f m o d 1 / 2 > N w 1
Time-frequency super-resolution with superlets.
As mentioned above, the construction of a time-frequency map based on the STFT-based SK value is called a kurtogram; the fault frequency component is concentrated in the section where the STFT-based SK is maximum and a filtered signal is obtained through reconstruction based on the factors of the corresponding area, and the fault frequency can be detected through this [20].
Kurtogram uses STFT for time-frequency analysis in the process of dividing by frequency band, but STFT has fixed frequency resolution but its temporal precision relative to period decreases with increasing frequency. On the contrary, the Continuous-wavelet Transform (CWT) provides good relative temporal localization by compression/dilation of a mother wavelet as a function of frequency. This is suitable for deriving more reliable analysis results by selecting an adaptive basis for the fault signal [31].
WPT is one of the representative time-frequency analysis techniques that can simultaneously check the frequency domain and time domain information of a vibration signal [32,33]. WPT divides and analyzes the signal for each frequency band according to the mother wavelet and level so that the regions containing the main fault component can be identified. Unlike the short Time Fourier Transform (STFT) with a fixed window function, the WPT involves a varied time-frequency window and can provide good localization properties in both time and frequency domains, which yield good performance in detecting fault frequency component [34,35]. The time-frequency titling map as shown in the Figure 1 shows better results in various frequency analyses [34].
Average windowed kurtosis has better robustness to noise than kurtosis, and is a method that can improve diagnostic performance by minimizing faults in the derivation of fault frequencies due to the influence of some noise components in the conventional kurtogram. This is a simple and practical method that minimizes the influence of temporary external noise to better find fault frequencies with periodic peakedness, deriving the spectral kurtosis of each sub-band as in Equation (5), and selecting an average value based on it as the representative factor. This method is used to derive a sub-band averaging-based kurtogram and analyze it based on the filtered signal in the regions where the fault signal components are concentrated as in Equation (6) [30].
u b b a n d   k u r t o s i s = K k , r m = d k , r m n 4 d k , r m n 2 2 2  
S u b b a n d   a v e r a g e d   k u r t o s i s = K ¯ k , r = 1 M m = 1 M K k , r m
In this study, we proposed an algorithm for extracting fault information more accurately through kurtogram based on WPT and Subband Averaging Enhanced Kurtogram (SAEK) applied with sub-band averaging technique for vibration data, as shown in Figure 2.
Basically, among the Daubechies series, which are mother wavelets mainly used in fault diagnosis, db2 to db9 were applied sequentially, and each analysis was performed up to level 4. This can be flexibly changed according to the sampling rate. The restructuring was performed based on the mother wavelet and the wavelet packet coefficient derived according to the level to generate time series data filtered in each frequency section according to the mother wavelet. Based on this, a kurtogram was generated grounded on the sub-band averaging spectral kurtosis value according to each frequency domain, and the SAEK value of the section with the highest value was selected as the local maximum SAEK as the region containing the most fault frequency components in the corresponding mother wavelet. This process was repeated from db2 to db9, and the maximum value among local maximum values according to all mother wavelet candidates is defined as the global maximum SAEK. Through the global maximum SAEK, it is possible to detect the fault frequency component that indicates the incipient fault of the bearing, and it is possible to derive an effective factor with a consistent tendency according to the fault development. Since this study aimed to detect fault signals and discriminate according to the level of faults to supplement the fault diagnosis performance additionally, only the frequency domain showing the dynamic characteristics of ±5% were included in the analysis by reflecting the dynamic characteristics of the vibration sensor. Hence, the fault diagnosis due to the inflow of sensor noise components in the high-frequency region was prevented and the reliability of the diagnosis result was improved [36,37].
Therefore, SAEK can provide more effective and clearer results for early fault diagnosis than the performance of existing mechanical systems. The first strong point is early fault detection. Incipient fault information can be extracted, thereby enabling efficient management such as maintenance and maintaining the schedule in advance. The second one is high discovery performance. A more clearly distinguished fault level and recognizable diagnosis are possible. The third one is consistent condition trend. Continuous evaluation is possible to consistently observe the tendency of fault symptoms, and it is possible to evaluate tendency that was difficult to perform with RMS and SK techniques due to noise input, through the limitation of analysis frequency region considering the sub-band averaging technique and sensor dynamic characteristics.

3. Experimental Verification

The reliability of the sub-band averaging enhanced kurtogram proposed in this study was verified through two test data. First, early fault diagnosis and fault tendency were identified through the run-to-failure data of the IMS, and the diagnosis was confirmed based on the fault level through the AHU-bearing test data.

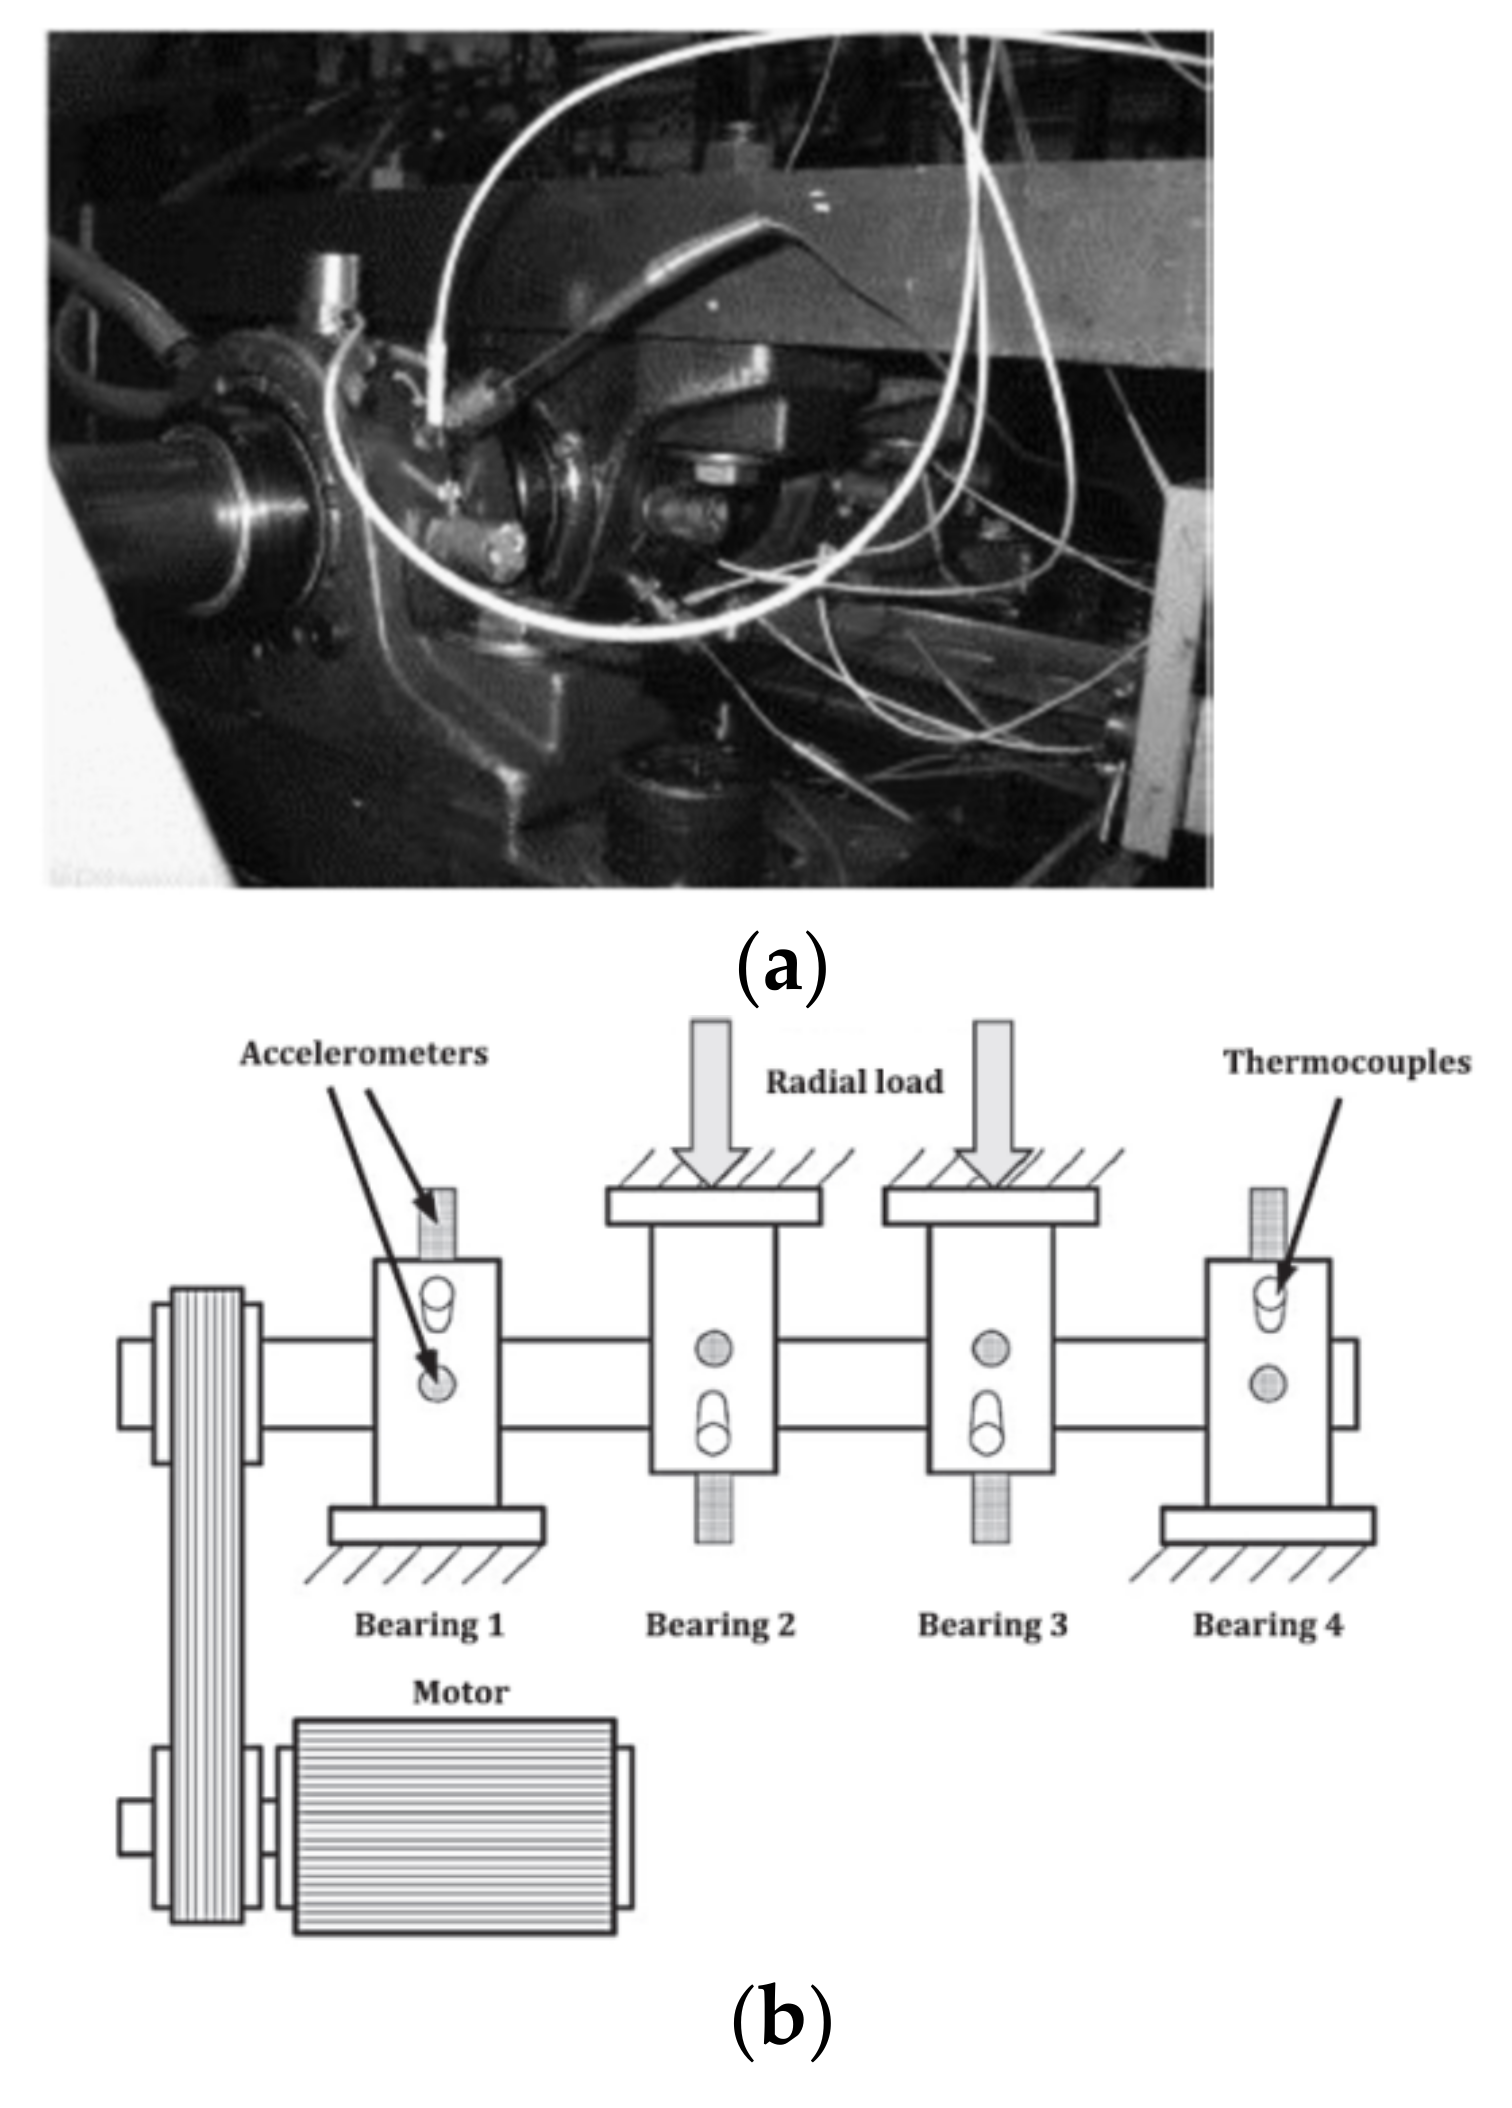
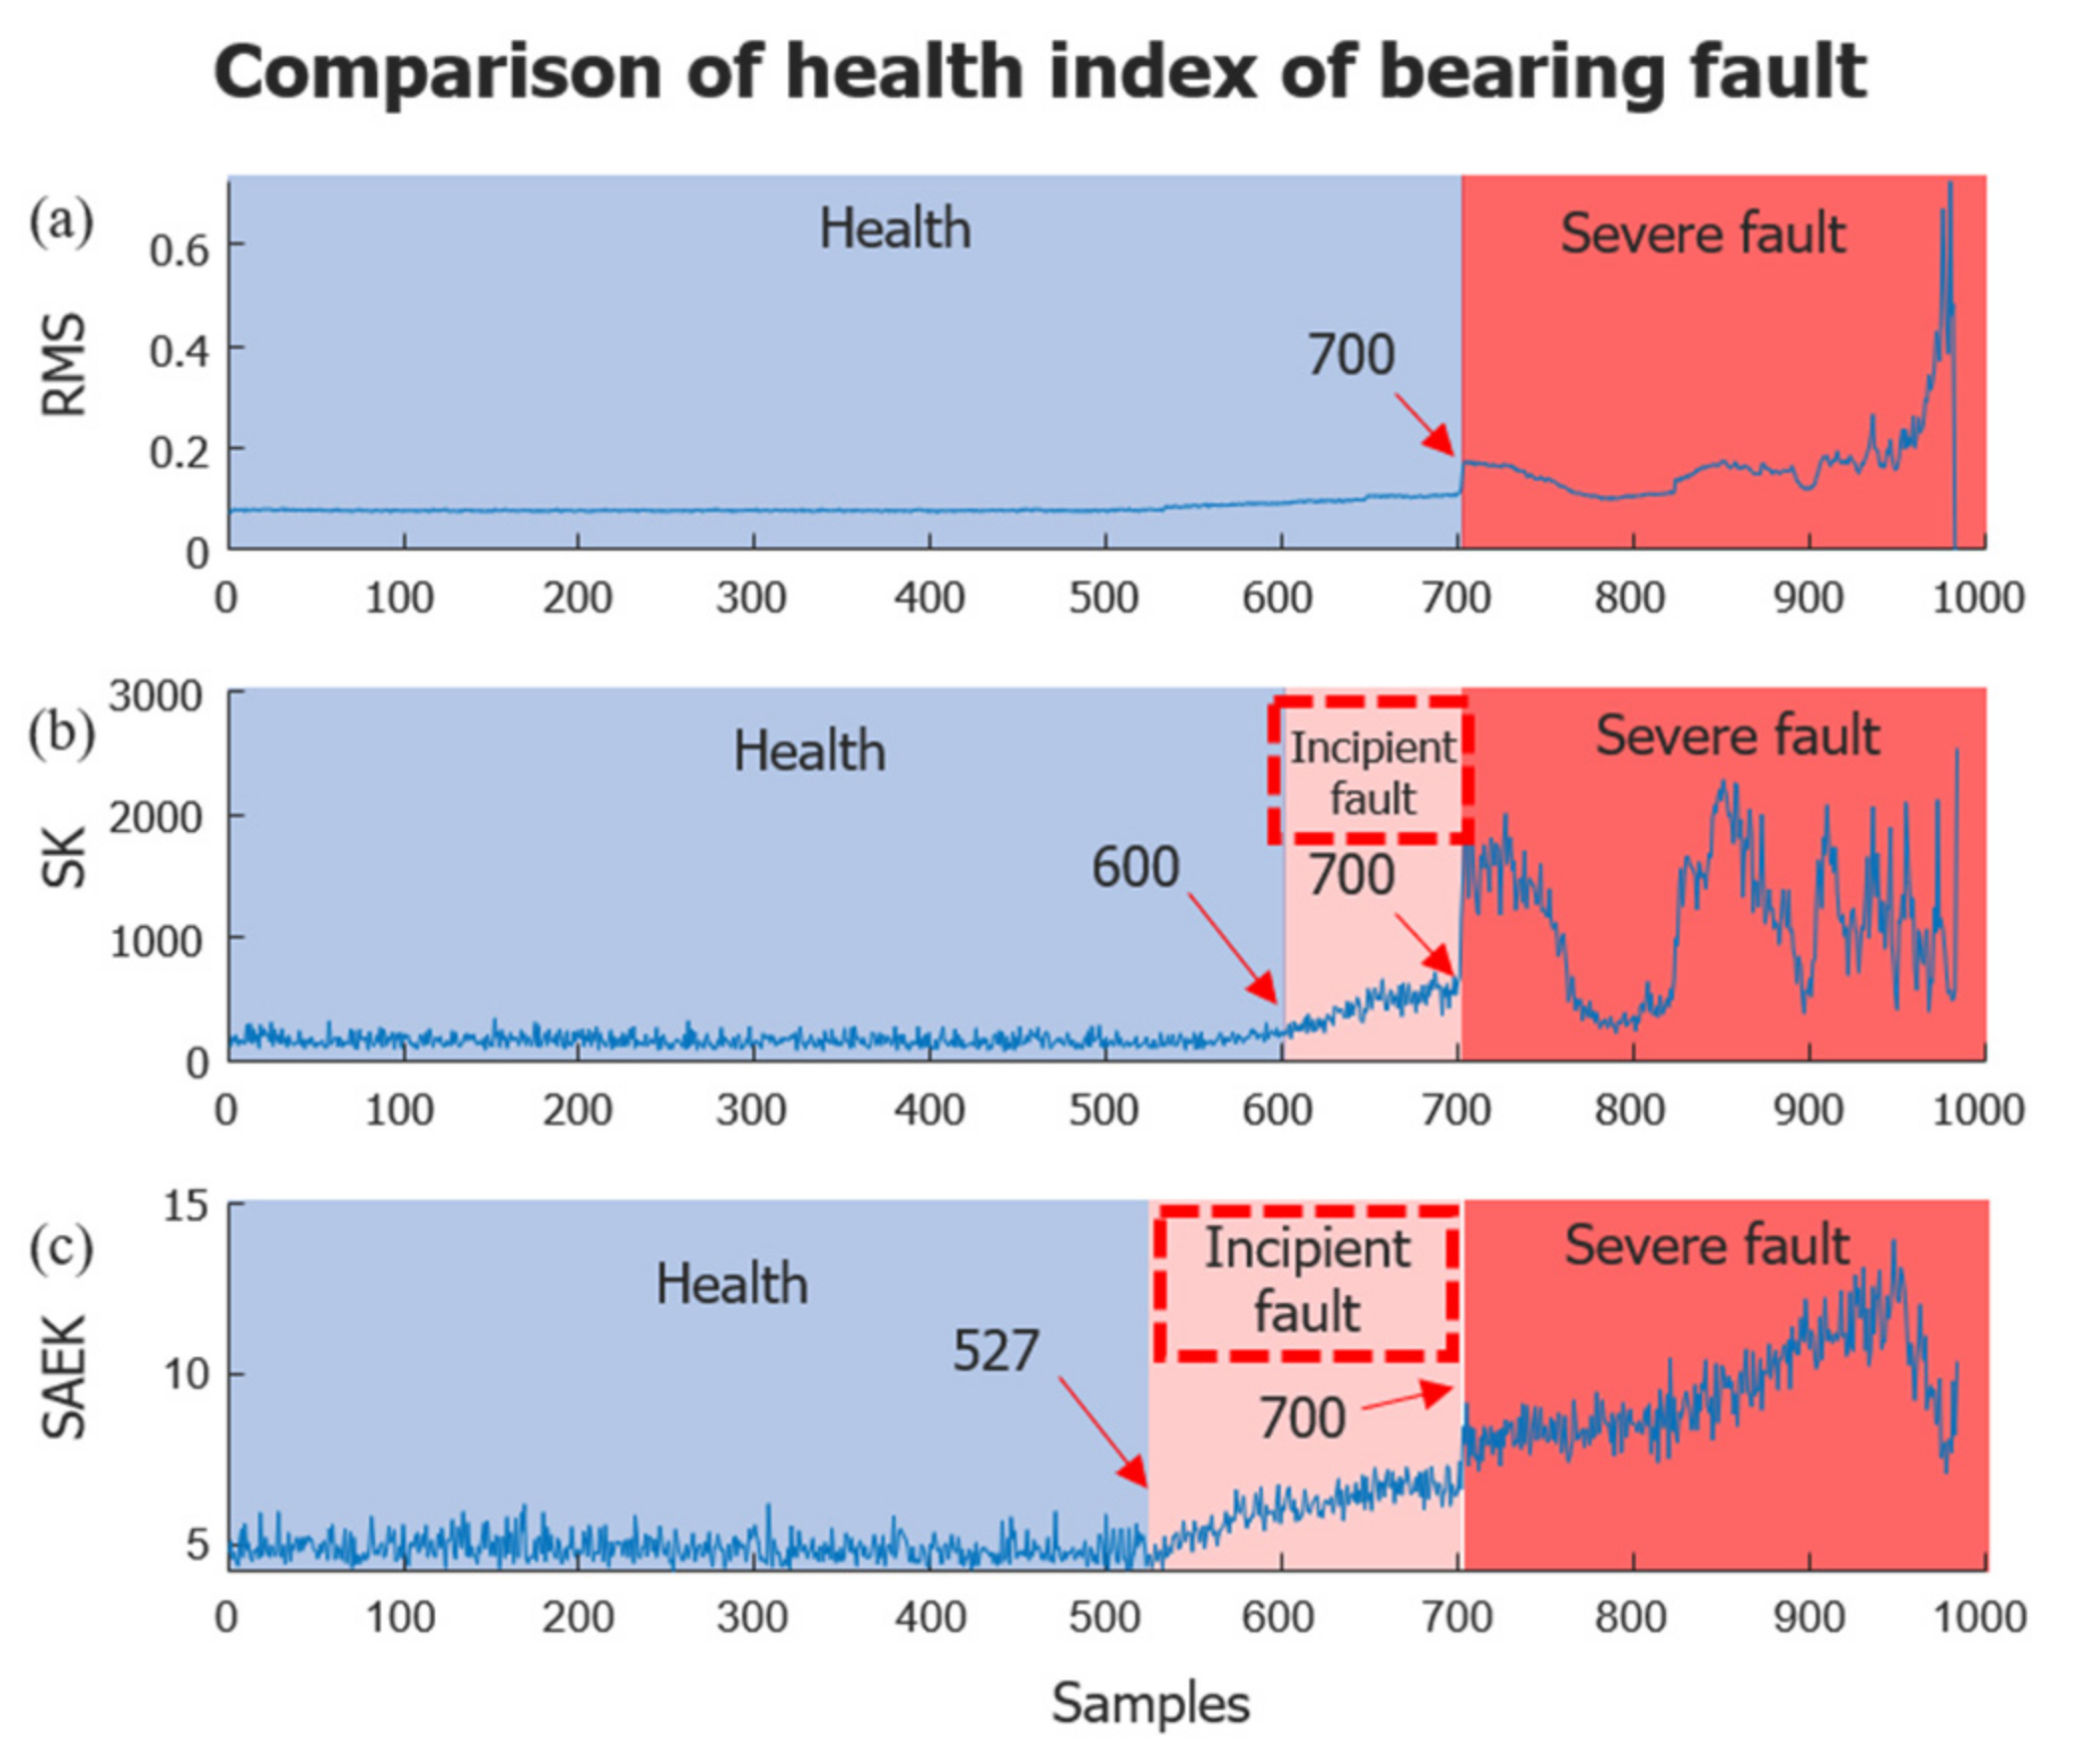
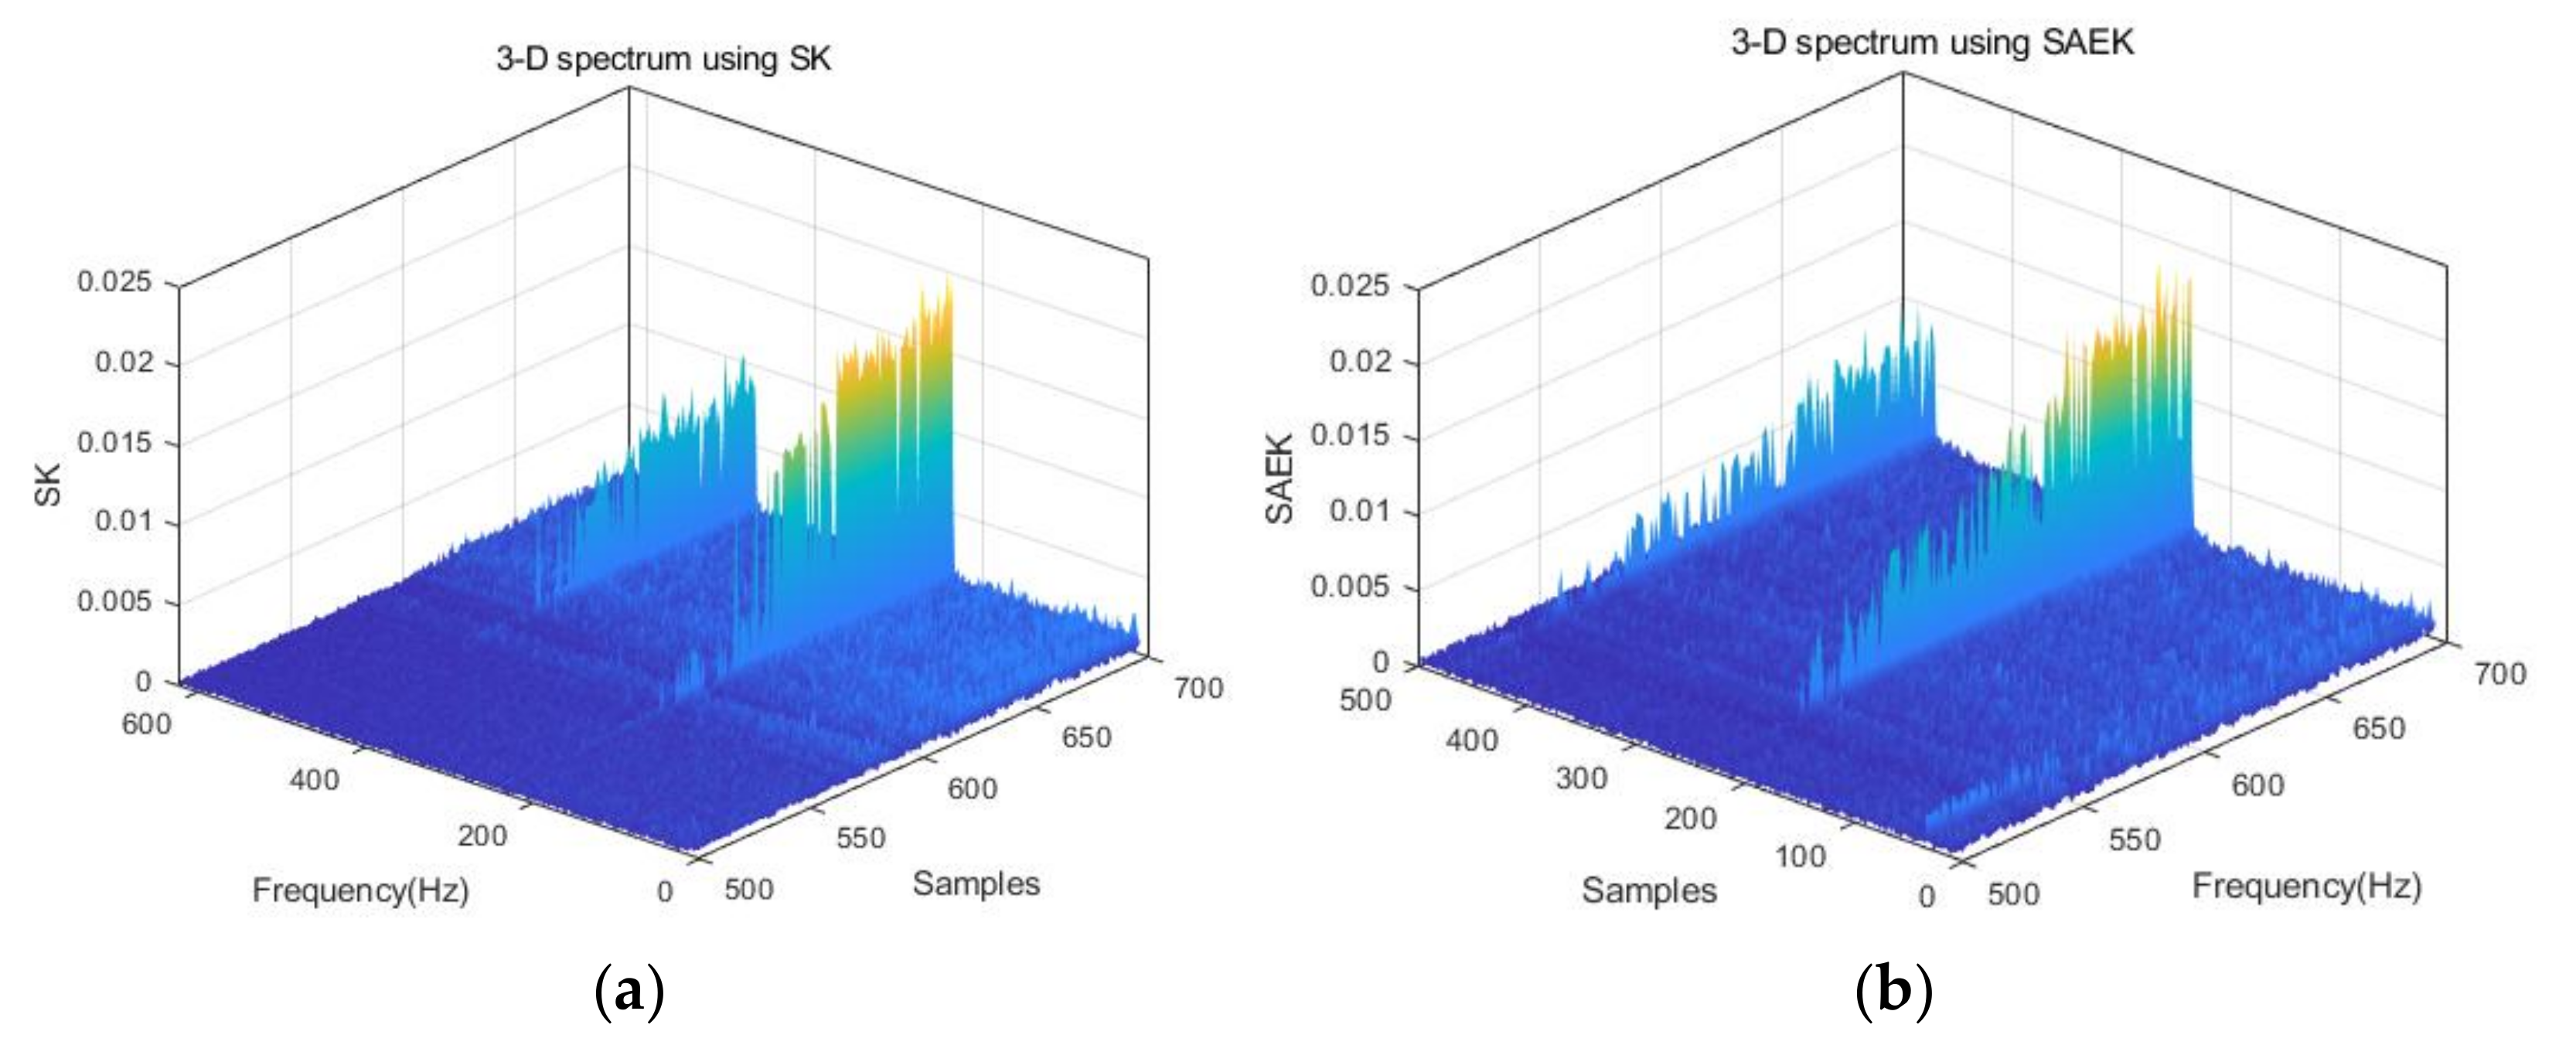
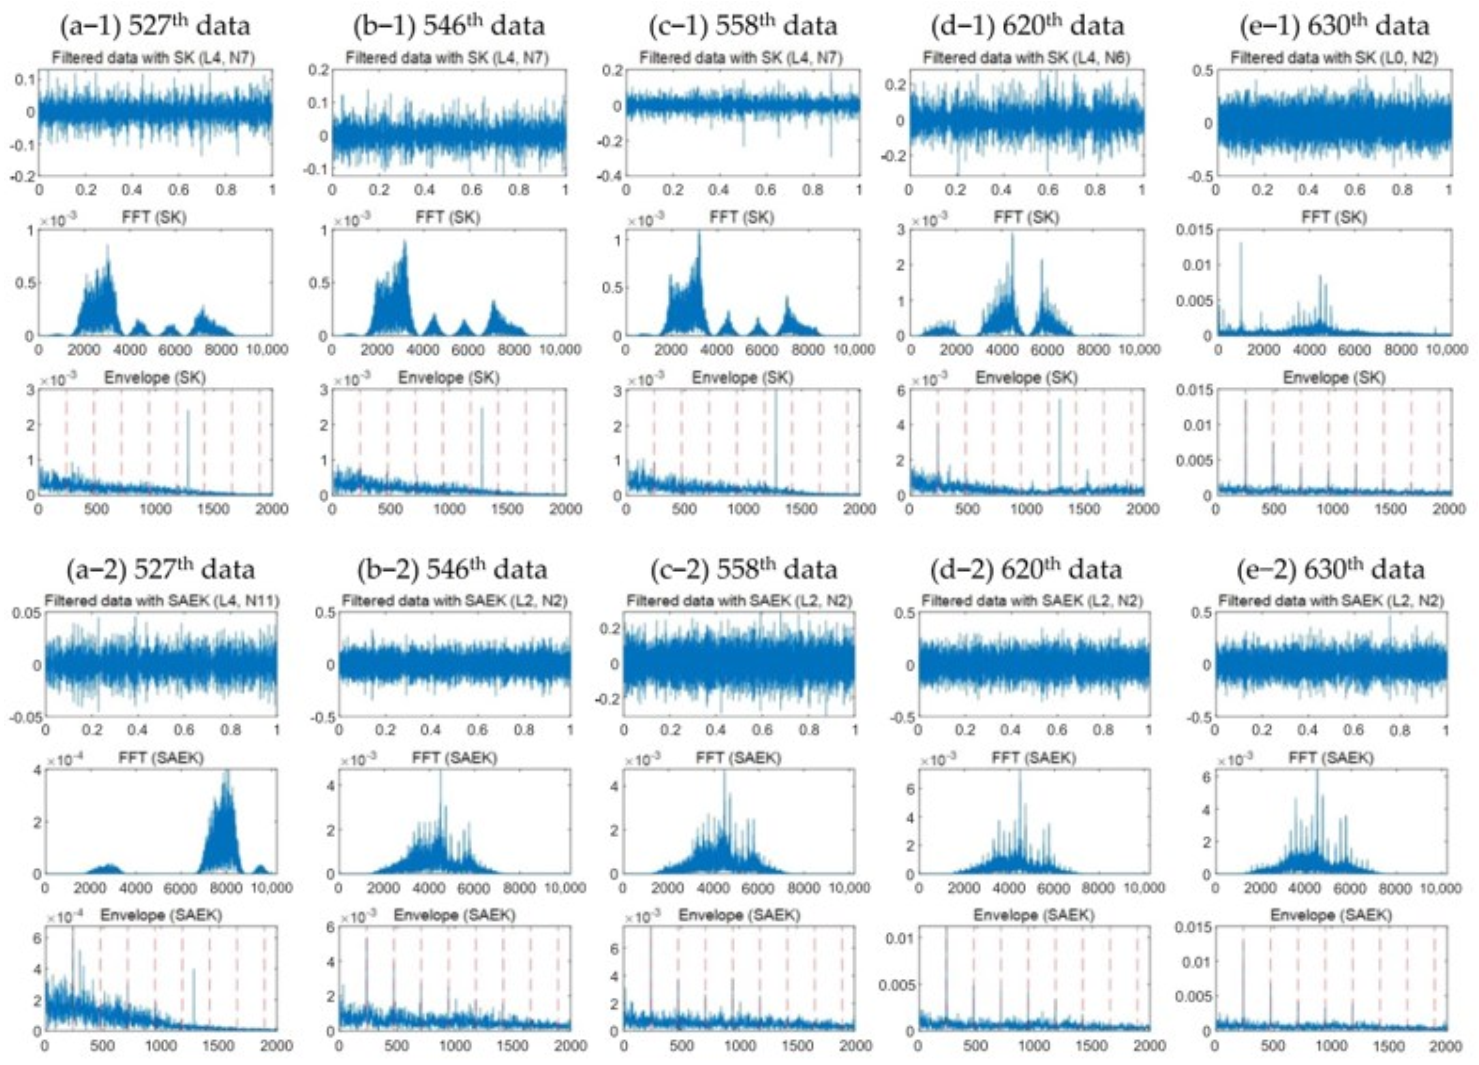
3.1. Case I–Accelerated Lifetime Test Data

The performance of the algorithm proposed in this paper was verified using the accelerated life-bearing data provided from the IMS center. The test equipment is shown in the Figure 3. The run-to-failure data obtained by collecting vibration signals until the steady-state bearing was damaged under severe operating conditions were used. The sampling frequency was 20,480 Hz, and data were collected for 1 s every 10 min; the rotational speed was 33.3 Hz, and the load was 6000 lbs. As a result of the test, the outer ring was damaged in bearing No. 1, and the final data collection was performed until the 984th (7 days 21 h).
Table 1 shows the basic fault frequency specifications of the bearings used in this experiment. In this experiment, PCB 353B33 high sensitivity quartz ICP accelerometer was used, and the dynamic characteristics were ±3 dB up to 12,000 Hz, ±10% up to 6500 Hz, and ±5% up to 4000 Hz. Figure 4 below shows the 4-level WPT tree structure and the frequency range of each packet in the case of data sampled at 20,480 Hz.
According to the Nyquist theory, the available frequency range was 10,240 Hz, which is half of the sampling frequency. To maximize sensor sensitivity, the detection of incipient fault frequency components with fine sizes was made more clearly by limiting the sensor’s dynamic section ±5% to 4000 Hz. The results of the accelerated life data in this study are shown in Figure 5. In the case of general vibration data RMS, the vibration increased rapidly from the 700th, thereby enabling the prediction that a fault occurred. In the case of the spectral kurtosis analysis result, the vibration showed a gradually increasing trend from the 600th data earlier than the RMS result and showed a sharp increase from the 700th data, thereby indicating an obvious fault symptom. Consequently, SK shows that it is possible to diagnose a fault 41 h and 40 min earlier than RMS, which is equivalent to 1000 min, which is further equivalent to about 100 data collection times. This result shows that early fault diagnosis is possible. However, in the case of SAEK analysis, it showed an upward trend from the 527th data, thereby providing the basis for judging the signs of fault 183 times (55 h 30 min) faster than RMS and 73 times (37 h 10 min) faster than SK. Furthermore, the upward trend of the incipient fault section was much clearer than that of SK, thereby providing sufficient fault information to accurately identify the fault and development at an early stage. This result is superior to SK results in terms of early diagnosis performance and provides clearer fault information compared to the normal. Compared with RMS results, SK diagnoses faulted 14% faster and SAEK diagnoses faulted 25% faster. In the case of SAEK, the other two analysis results showed that the upward trend was also the most prominent and showed a consistent increase with the fault development. In the case of RMS, it is impossible to diagnose early because the fault factor is possible from the momentary amplitude jump, and in the case of SK, it is possible to check the incipient fault section which thereby shows the gradual increase in the fault component. However, in the case of SAEK, the gradual increase in fault components was identified more clearly and earlier, so fault diagnosis was possible earlier than SK. In addition, it showed a consistent tendency for fault components to increase in most sections, thereby providing the basis for evaluating the information and level of continuous aging of bearings, and confirming that the reliability of the diagnosis results is sufficient. Finally, in the results of the accelerated life test, it can be seen that SAEK provided effective and reliable information as a health index.
The detection results of the hidden fault frequency component in the vibration signal through SAEK are shown in Figure 6. First, in the 3D spectrum plot, it can be seen that the fault frequency component appears earlier in SAEK than in SK. Here again, in SK, Figure 6 shows that if the fault frequency component is clearly shown from the 600th sample, it actually appeared prominently after the 600th sample. Meanwhile, the SAEK result shows that the fault frequency component appeared from the 527th, which is faster than SK (in the 3D spectrum plot), directly illustrating that the influence of external noise is minimized and better detection of the fault frequency component through SAEK is achieved. The result can be seen in the frequency spectrum in the Figure 7. At the top, the reconstruction waveform is shown by SK in the incipient fault section along with the frequency component and the envelope analysis result. The ball pass frequency of outer race (BPFO), which is an outer race fault frequency component, is shown with a red dotted line. In SAEK, the primary fault frequency component was detected from the 527th data more clearly and periodically thereafter. On the other hand, in SK, it can be seen that sufficient fault information was identified only after about 630 times beyond the 600th. This result shows that SAEK was more effective than SK in the early detection of fault frequency components.

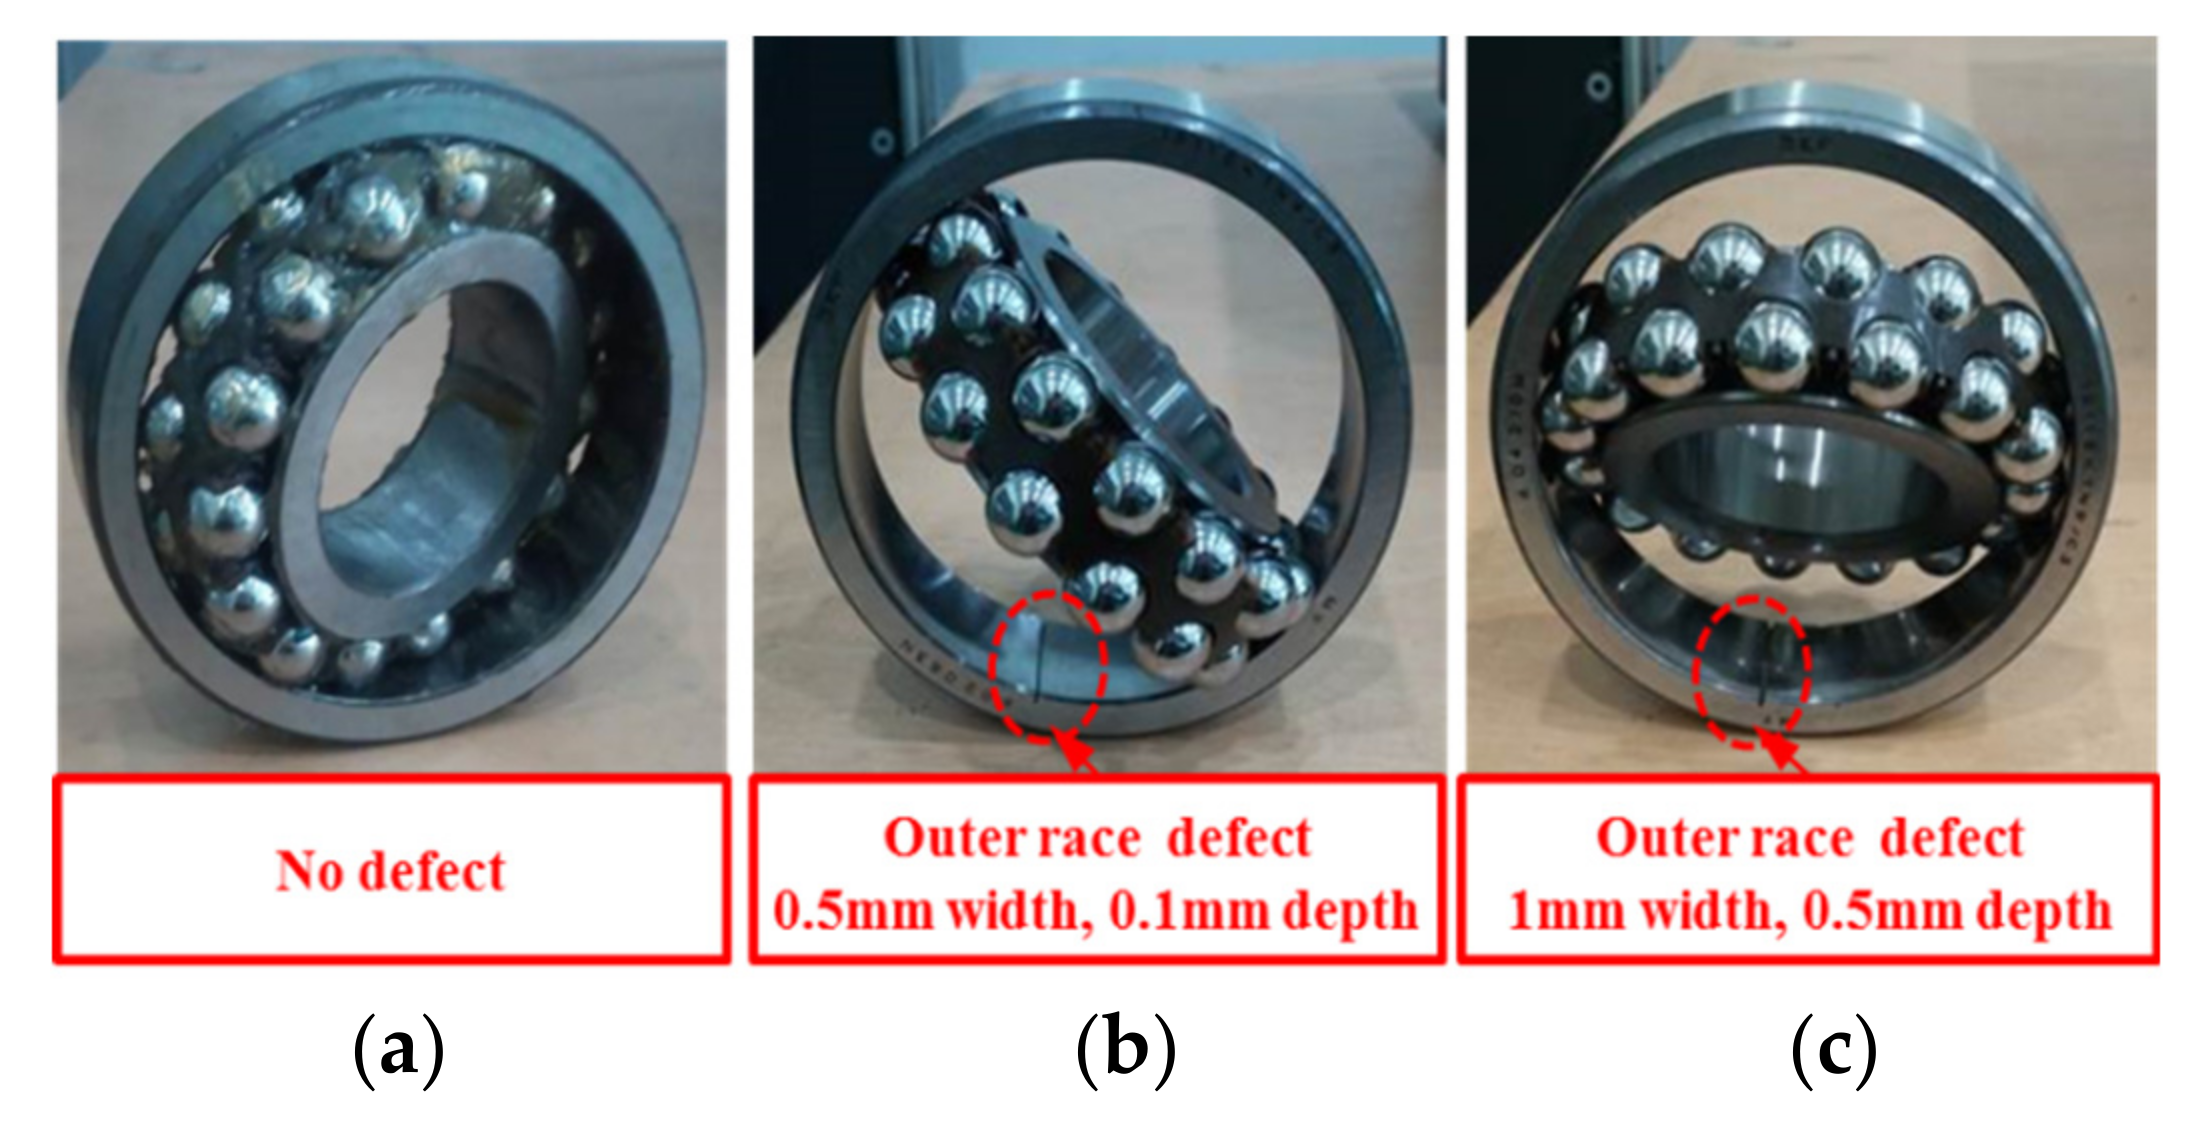
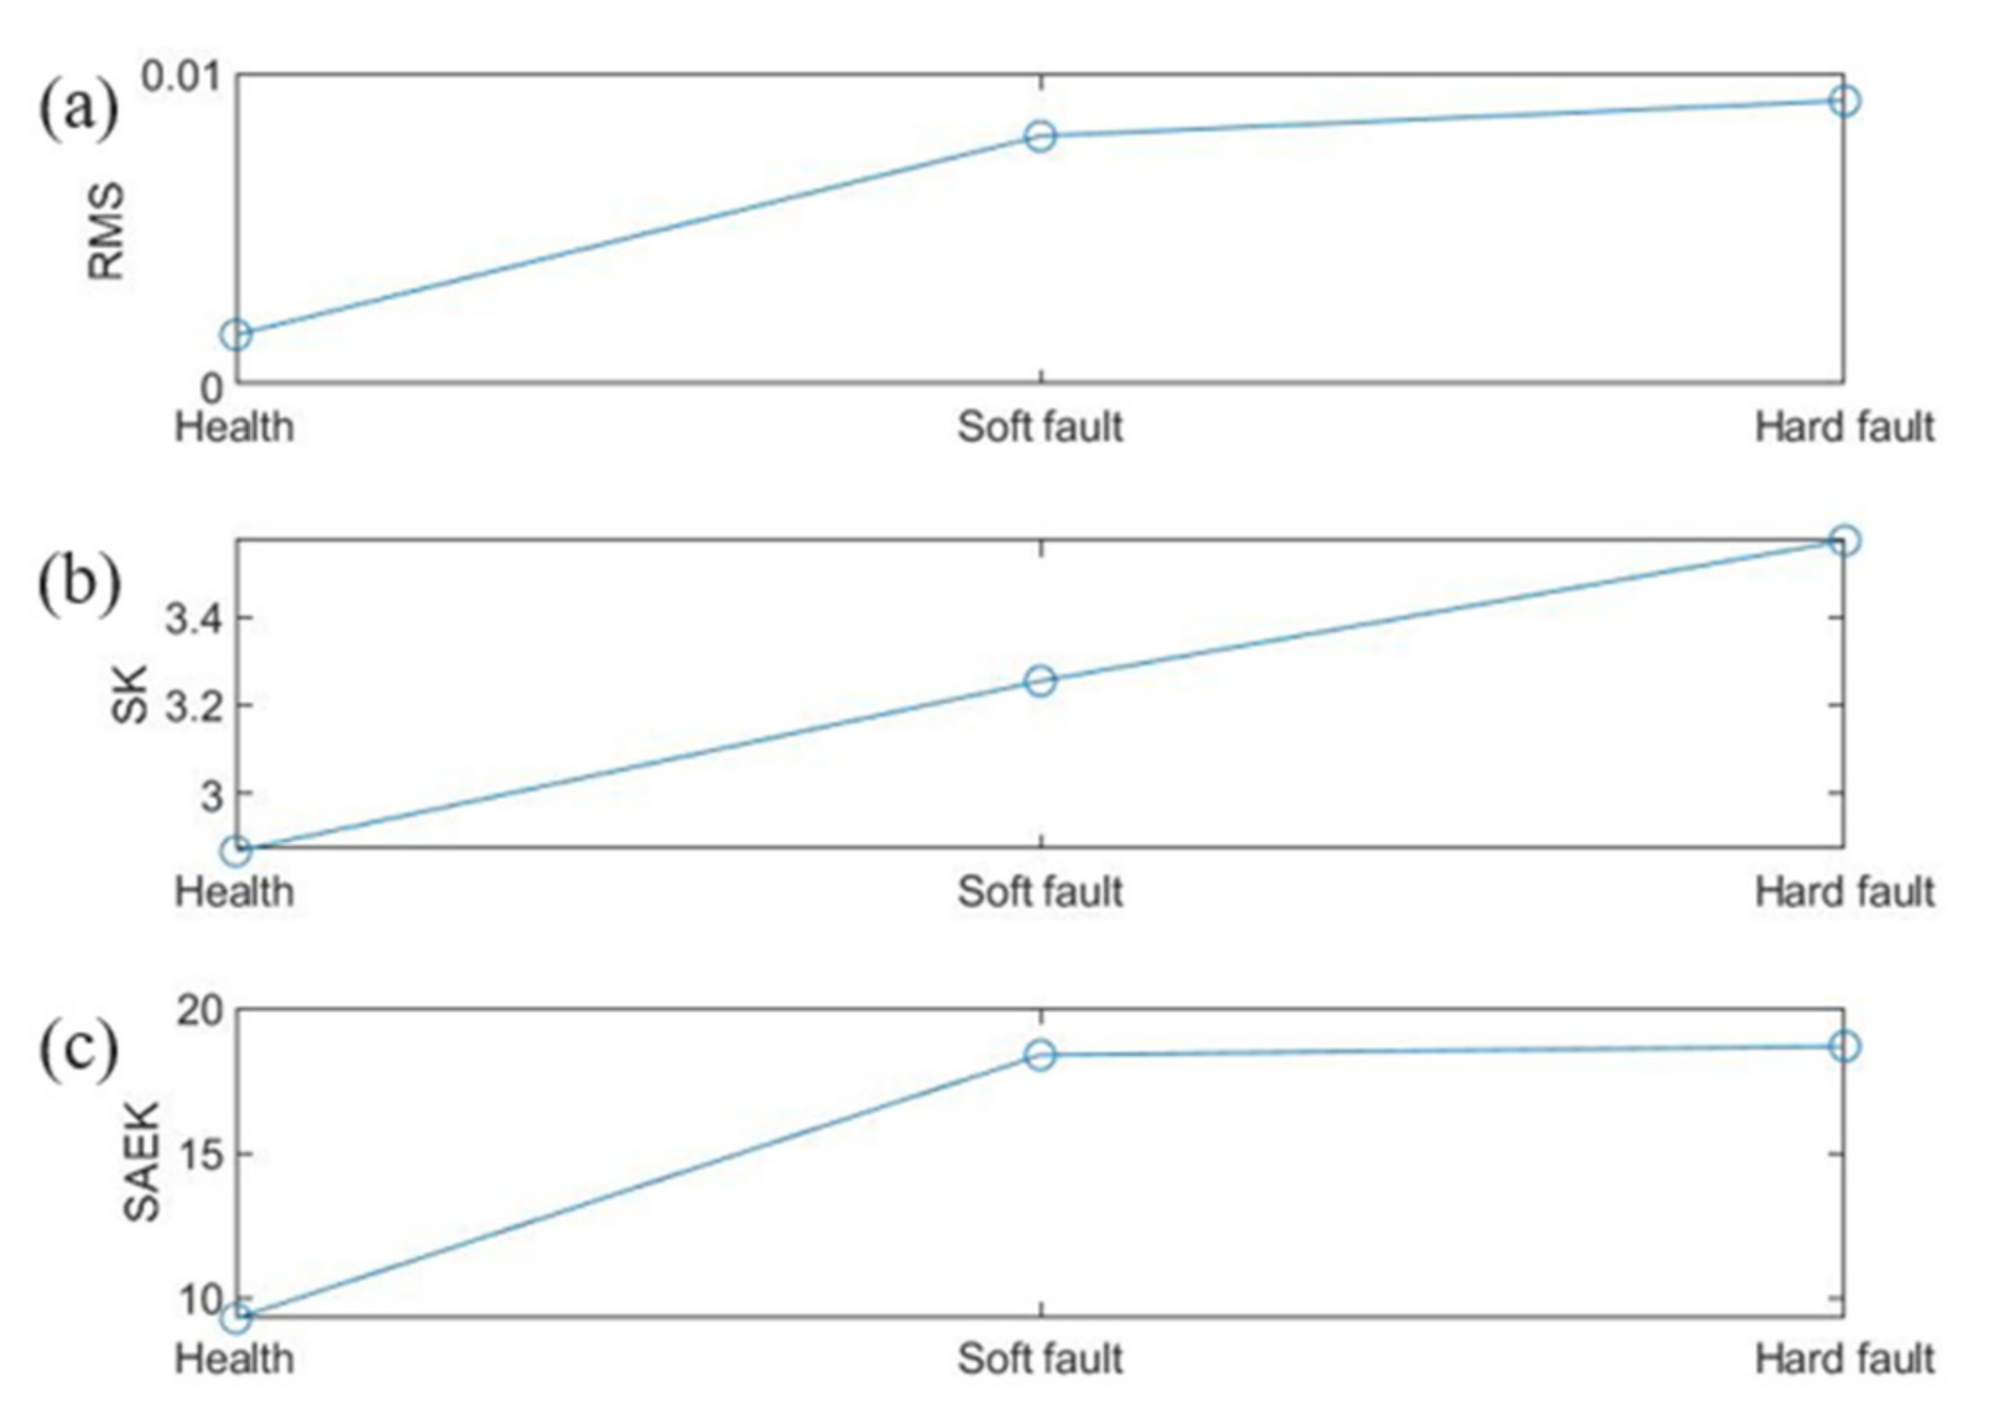
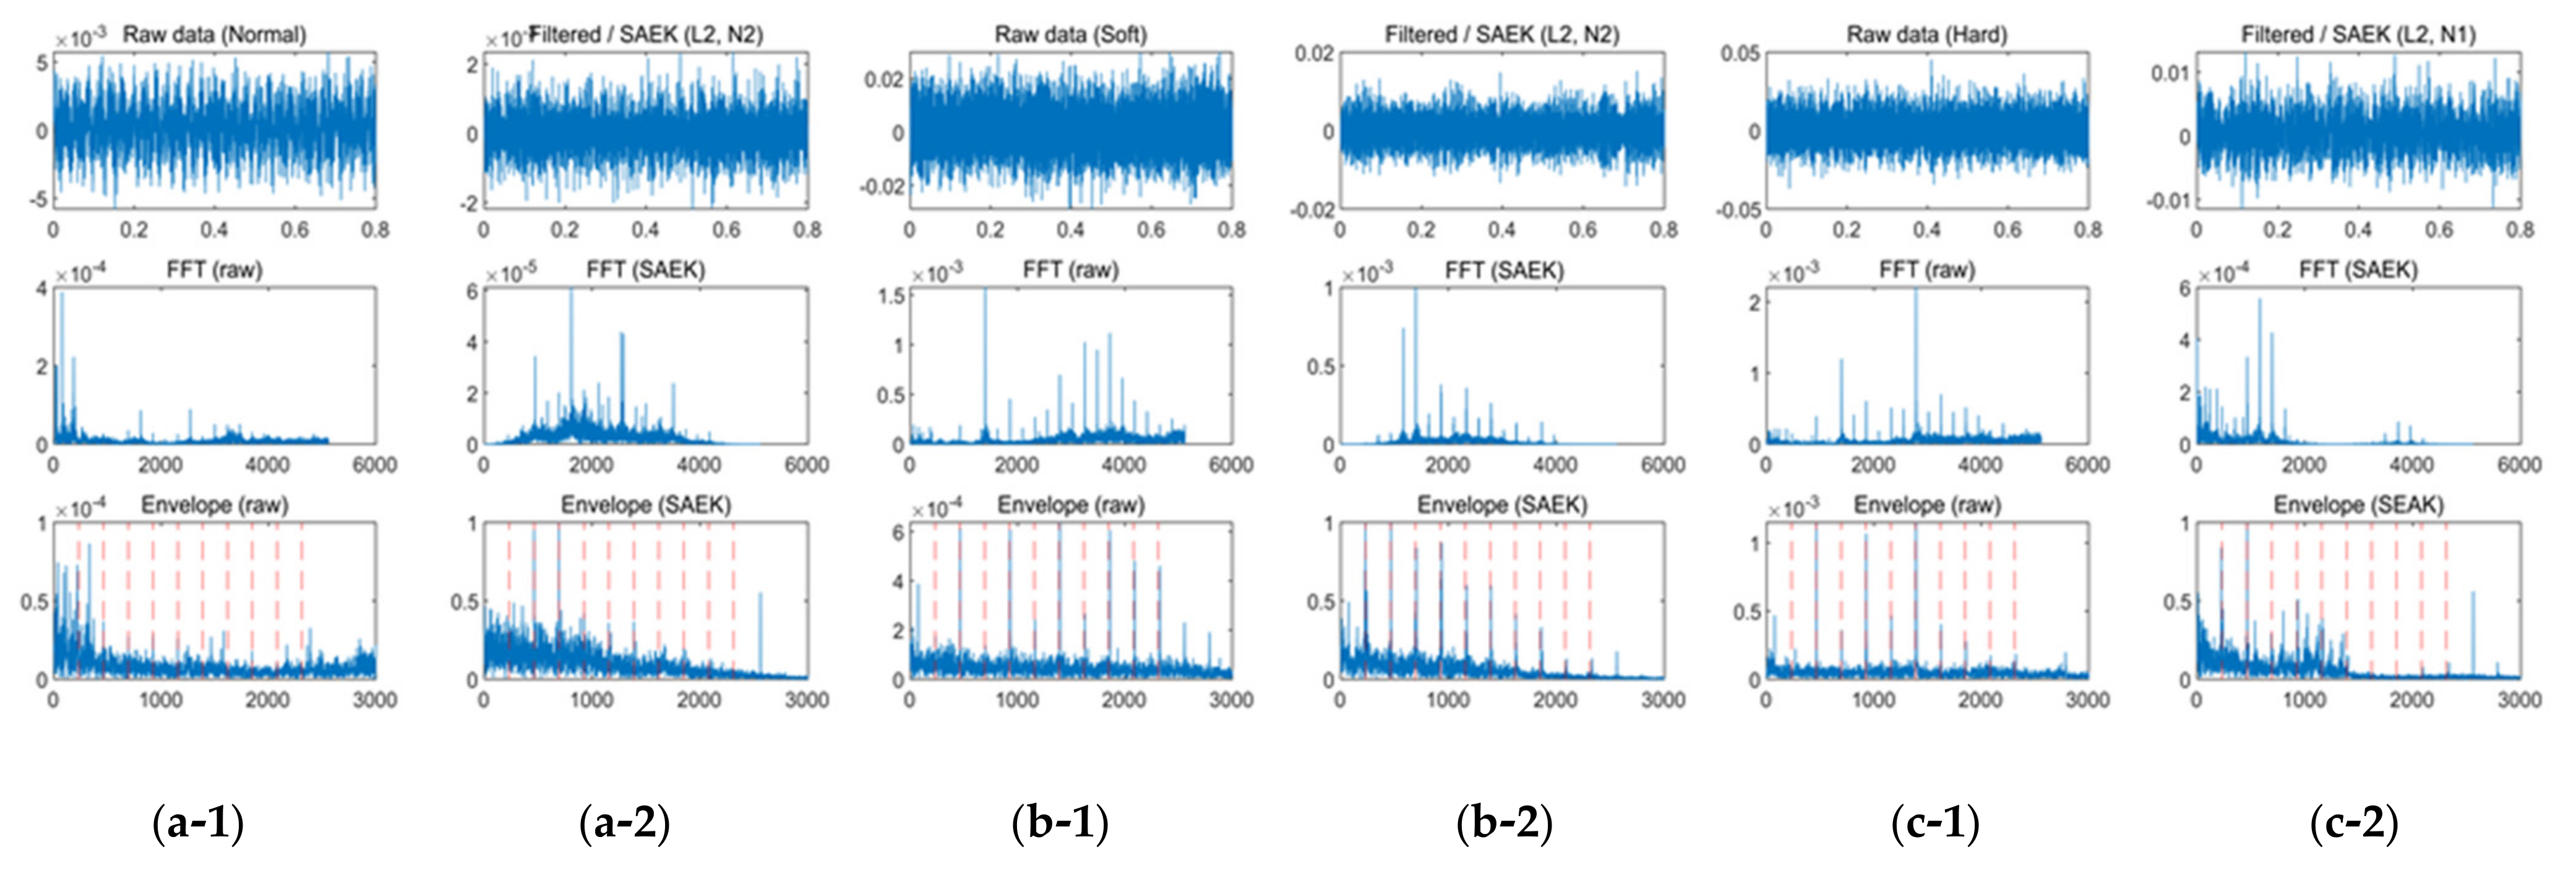
3.2. Case II–Fault Level Test Data

An AHU is equipment that circulates air for air conditioning in large ships. The bearing supporting the flywheel has harsh operating conditions with a humid environment and high rotational speed. AHU photos and brief schematics are shown in Figure 8. In this study, the performance of the fault diagnosis algorithm was verified through bearing vibration data measured in the AHU of the air conditioning room of a 10,000 twenty-foot equivalent units (TEUs) container ship, where the AHU data were the vibration data measured by replacing the bearings in the three states of the outer ring, including normal, soft, and hard fault states. Figure 9 shows the normal and faulty conditions of the bearings.
It was verified that the algorithm proposed in this study can discriminate the fault level along with the fault of normal, incipient fault, and serious fault. As for the fault state of individual outer rings, as shown in the Figure 9, the soft fault was damaged at 0.5 mm width and 0.1 mm depth for the outer ring, and the hard fault was damaged in the outer ring at 1 mm width and 0.5 mm depth. The bearing model is SKF’s self-aligning double-layer ball bearing (SKF 1311 EKTN9) and the detailed bearing specifications are shown in Table 2. The sampling frequency of this experiment was 10,240 Hz, a CTC AC104-2C accelerometer was used, and cRIO-9030 with the NI-9234 module was used for DAQ. The sampling frequency of this experiment was 10,240 Hz, and a CTC AC104-2C accelerometer was used. The dynamic characteristic of the vibration sensor is ±3 dB up to 10,000 Hz and ±10% up to 7000 Hz. Considering the sampling frequency and the frequency response range of the vibration sensor, the dynamic characteristics of the sensor were identified to be sufficiently higher than the Nyquist sampling frequency, so the analysis was limited to 5120 Hz.
The analysis result of the diagnostic algorithm is shown in Figure 10. In the case of RMS, as it develops into the normal and soft and hard faults, the RMS value increased proportionally, but the difference in the amount of change depending on the level of fault occurrence and fault development was not large, so it is difficult to diagnose the fault state. However, in the case of SK, as RMS, it showed an increasing trend with the occurrence and increase of faults, and it showed that it is possible to distinguish between soft fault and hard fault according to the level of fault development. On the other hand, SAEK has already increased significantly from the normal level in soft fault, thereby clearly showing information on fault occurrence, and it can be seen that the increase was somewhat dull and saturated as it decreased into a hard fault. This shows the level of change and that SAEK is sensitive to changes due to incipient fault. Hence, the fault diagnosis algorithm proposed in this study is suitable for the early diagnosis of incipient fault. Of course, by showing a partial increase in distinguishing soft fault and hard fault, the judgment according to the level of fault development is sufficiently possible.
Figure 11 shows the frequency analysis result and envelope analysis result for normal, soft, and hard faults. The periodicity of the fault frequency component was clearly shown in the diagnostic results of SAEK rather than in the frequency analysis of the existing raw data in the three states. This proves that the fault frequency component detection performance of the diagnostic algorithm proposed in this study is effective.

4. Conclusions

In this paper, for early fault diagnosis of bearings, the enhanced kurtogram, and sub-band averaging techniques were combined to diagnose the initial fault of bearings, and a technique for state management of the mechanical system was proposed by using it as a health index in proportion to the level of fault development. Using the sub-band averaging technique minimized the influence of abnormal peaks on the spectral kurtosis and maximized the detection efficiency of periodic fault components. This approach can be used to diagnose initial faults in conjunction with the existing kurtogram technique, where some abnormal peaks affect SK excessively and make accurate diagnosis and analysis difficult.
In this way, diagnostic malfunctions can be minimized and incipient faults can be detected. It can be used to diagnose faults at industrial sites and can be viewed as a reliable diagnostic method. A variety of mother wavelets were also used in order to demonstrate that the outer ring of the bearing can be reliably diagnosed under various operating conditions. Based on the results of this paper, it can be determined that the proposed methods are suitable to diagnose a variety of bearing faults.
Similarly, the results clearly demonstrated mechanical damage-induced aging as well as the ability to detect periodic appearances of fault frequency components in an early stage through filtered signals. It is expected that the data from this study will be useful for the actual management and maintenance of the mechanical system as it provides data regarding the faults of the mechanical system.

Author Contributions

Conceptualization, W.K. and Y.-S.H.; methodology, S.-J.P. and B.-S.K.; software, S.-J.P. and S.-H.J.; validation, W.K. and M.L.; formal analysis, W.K.; investigation, S.-J.P. and S.-H.J.; resources, W.K. and Y.-S.H.; data curation, M.L. and B.-S.K.; writing—original draft preparation, W.K., S.-J.P. and B.-S.K.; writing—review and editing, M.L. and N.K.; visualization, S.-H.J. and B.-S.K.; supervision, Y.-S.H.; project administration, Y.-S.H.; funding acquisition, Y.-S.H. All authors have read and agreed to the published version of the manuscript.

Funding

This work was supported by the Korea Ministry of Trade, Industry, and Energy (MOTIE), under the grant “Development of electric power-net optimization technology using digital twin for improving energy use efficiency of vehicle power-net (No. 20018501)”.

Institutional Review Board Statement

Not applicable.

Informed Consent Statement

Not applicable.

Data Availability Statement

Not applicable.

Conflicts of Interest

The authors declare no conflict of interest.

References

  1. United Nations (UN). United Nations Framework Convention on Climate Change Annual Report 2021. 2021. Available online: https://unfccc.int/sites/default/files/resource/UNFCCC_Annual_Report_2021.pdf (accessed on 31 May 2022).
  2. International Energy Agency. Global EV Outlook 2021; IEA: Paris, France, 2021; Available online: https://www.iea.org/reports/global-ev-outlook-2021/introduction (accessed on 30 April 2021).
  3. International Energy Agency. Global EV Outlook 2022; IEA: Paris, France, 2022; Available online: https://www.iea.org/reports/global-ev-outlook-2022 (accessed on 31 May 2022).
  4. He, F.; Xie, G.; Luo, J. Electrical bearing failures in electric vehicles. Friction 2020, 8, 4–28. [Google Scholar] [CrossRef] [Green Version]
  5. Shah, R.; Tung, S.; Chen, R.; Miller, R. Grease performance requirements and future perspectives for electric and hybrid vehicle applications. Lubricants 2021, 9, 40. [Google Scholar] [CrossRef]
  6. Wang, X.; Lu, S.; Chen, K.; Wang, Q.; Zhang, S. Bearing Fault Diagnosis of Switched Reluctance Motor in Electric Vehicle Powertrain via Multisensor Data Fusion. IEEE Trans. Ind. Inform. 2021, 18, 2452–2464. [Google Scholar] [CrossRef]
  7. Sanguesa, J.A.; Torres-Sanz, V.; Garrido, P.; Martinez, F.J.; Marquez-Barja, J.M. A Review on Electric Vehicles: Technologies and Challenges. Smart Cities 2021, 4, 372–404. [Google Scholar] [CrossRef]
  8. Upadhyay, R.K.; Kumaraswamidhas, L.A.; Azam, M.S. Rolling element bearing failure analysis: A case study. Case Stud. Eng. Fail. Anal. 2013, 1, 15–17. [Google Scholar] [CrossRef] [Green Version]
  9. Kong, K.; Cai, B.; Liu, Y.; Zhu, H.; Liu, Y.; Shao, H.; Yang, C.; Li, H.; Mo, T. Optimal sensor placement methodology of hydraulic control system for fault diagnosis. Mech. Syst. Signal Process. 2022, 174, 109069. [Google Scholar] [CrossRef]
  10. Cai, B.; Wang, Z.; Zhu, H.; Liu, Y.; Hao, K.; Yang, Z.; Ren, Y.; Feng, Q.; Liu, Z. Artificial Intelligence Enhanced Two-Stage Hybrid Fault Prognosis Methodology of PMSM. IEEE Trans. Ind. Inform. 2021, 18, 7262–7273. [Google Scholar] [CrossRef]
  11. Cai, B.; Hao, K.; Wang, Z.; Yang, C.; Kong, X.; Liu, Z.; Ji, R.; Liu, Y. Data-driven early fault diagnostic methodology of permanent magnet synchronous motor. Expert Syst. Appl. 2021, 177, 115000. [Google Scholar] [CrossRef]
  12. Gómez-Peñate, S.; López-Estrada, F.R.; Valencia-Palomo, G.; Osornio-Ríos, R.; Zepeda-Hernández, J.A.; Rios-Rojas, C.; Camas-Anzueto, J. Camas-Anzueto. Sensor Fault Diagnosis Observer for an Electric Vehicle Modeled as a Takagi-Sugeno System. J. Sens. 2018, 2018, 9. [Google Scholar] [CrossRef] [Green Version]
  13. Antoni, J.; Randall, R.B. The spectral kurtosis: Application to the vibratory surveillance and diagnostics of rotating machines. Mech. Syst. Signal Proces. 2006, 20, 308–331. [Google Scholar] [CrossRef]
  14. Sawalhi, N.; Randall, R.B.; Endo, H. The enhancement of fault detection and diagnosis in rolling element bearings using minimum entropy deconvolution combined with spectral kurtosis. Mech. Syst. Signal Process. 2007, 21, 2616–2633. [Google Scholar] [CrossRef]
  15. Smith, W.A.; Fan, Z.; Peng, Z.; Li, H.; Randall, R.B. Optimised Spectral Kurtosis for bearing diagnostics under electromagnetic interference. Mech. Syst. Signal Process. 2016, 75, 371–394. [Google Scholar] [CrossRef] [Green Version]
  16. Zhong, J.; Wang, D.; Guo, J.E.; Cabrera, D.; Li, C. Theoretical investigations on kurtosis and entropy and their improvements for system health monitoring. IEEE Trans. Instrum. Meas. 2020, 70, 3503710. [Google Scholar] [CrossRef]
  17. Barszcz, T.; Randall, R.B. Application of spectral kurtosis for detection of a tooth crack in the planetary gear of a wind turbine. Mech. Syst. Signal Process. 2009, 23, 1352–1365. [Google Scholar] [CrossRef]
  18. Wang, L.; Cai, G.; Wang, J.; Jiang, X.; Zhu, Z. Dual-enhanced sparse decomposition for wind turbine gearbox fault diagnosis. IEEE Trans. Instrum. Meas. 2018, 68, 450–461. [Google Scholar] [CrossRef]
  19. Hong, Y.; Kim, M.; Lee, H.; Park, J.J.; Lee, D. Early Fault Diagnosis and Classification of Ball Bearing Using Enhanced Kurtogram and Gaussian Mixture Model. IEEE Trans. Instrum. Meas. 2019, 68, 4746–4755. [Google Scholar] [CrossRef]
  20. Wang, Y.; Xiang, J.; Markert, R.; Liang, M. Spectral kurtosis for fault detection, diagnosis and prognostics of rotating machines: A review with applications. Mech. Syst. Signal Process. 2016, 66, 679–698. [Google Scholar] [CrossRef]
  21. Luo, C.; Mo, Z.; Miao, Q. Cyclic harmonic ratio defined in squared envelope spectrum and log-envelope spectrum for gearbox fault diagnosis. IEEE Trans. Instrum. Meas. 2020, 69, 9568–9577. [Google Scholar] [CrossRef]
  22. Li, N.; Huang, W.; Guo, W.; Gao, G.; Zhu, Z. Multiple enhanced sparse decomposition for gearbox compound fault diagnosis. IEEE Trans. Instrum. Meas. 2019, 69, 770–781. [Google Scholar] [CrossRef]
  23. Wang, Z.; Zhou, J.; Wang, J.; Du, W.; Wang, J.; Han, X.; He, G.; Du, W. A novel fault diagnosis method of gearbox based on maximum kurtosis spectral entropy deconvolution. IEEE Access. 2019, 7, 29520–29532. [Google Scholar] [CrossRef]
  24. Dalvand, F.; Kang, M.; Dalvand, S.; Pecht, M. Detection of generalized-roughness and single-point bearing faults using linear prediction-based current noise cancellation. IEEE Trans. Ind. Electron. 2018, 65, 9728–9738. [Google Scholar] [CrossRef]
  25. Leite, V.C.M.N.; Borges Da Silva, J.G.; Veloso, G.F.C.; Borges Da Silva, L.E.; Lambert-Torres, G.; Bonaldi, E.L.; De Lacerda De Oliveira, L.E. Detection of Localized Bearing Faults in Induction Machines by Spectral Kurtosis and Envelope Analysis of Stator Current. IEEE Trans. Ind. Electron. 2015, 62, 1855–1865. [Google Scholar] [CrossRef]
  26. Mohamed, Z.; Chemseddine, R.; Djamel, B.; Azeddine, R. Automatic condition monitoring of electromechanical system based on MCSA, spectral kurtosis and SOM neural network. J. Vibroengineering 2019, 21, 2082–2095. [Google Scholar]
  27. Liu, Z.; Yang, S.; Liu, Y.; Lin, J.; Gu, X. Adaptive correlated Kurtogram and its applications in wheelset-bearing system fault diagnosis. Mech. Syst. Signal Process. 2021, 154, 107511. [Google Scholar] [CrossRef]
  28. Hu, Y.; Bao, W.; Tu, X.; Li, F.; Li, K. An Adaptive Spectral Kurtosis Method and its Application to Fault Detection of Rolling Element Bearings. IEEE Trans. Instrum. Meas. 2020, 69, 739–750. [Google Scholar] [CrossRef]
  29. Liang, K.; Zhao, M.; Lin, J.; Jiao, J.; Ding, C. Maximum average kurtosis deconvolution and its application for the impulsive fault feature enhancement of rotating machinery. Mech. Syst. Signal Process. 2021, 149, 107323. [Google Scholar] [CrossRef]
  30. Wang, L.; Liu, Z.; Cao, H.; Zhang, X. Subband averaging kurtogram with dual-tree complex wavelet packet transform for rotating machinery fault diagnosis. Mech. Syst. Signal Process. 2020, 142, 106755. [Google Scholar] [CrossRef]
  31. Moca, V.V.; Bârzan, H.; Nagy-Dăbâcan, A.; Mureșan, R.C. Time-frequency super-resolution with superlets. Nat. Commun. 2021, 12, 337. [Google Scholar] [CrossRef]
  32. Mallat, S. A Wavelet Tour of Signal Processing; Elsevier: Amsterdam, The Netherlands, 1999. [Google Scholar]
  33. Yan, R.; Gao, R.X.; Chen, X. Wavelets for fault diagnosis of rotary machines: A review with applications. Signal Process. 2014, 96, 1–15. [Google Scholar] [CrossRef]
  34. He, H.; Shen, X.; Starzyk, J.A. Power quality disturbances analysis based on EDMRA method. Int. J. Electr. Power Energy Syst. 2009, 31, 258–268. [Google Scholar] [CrossRef]
  35. Poisson, O.; Rioual, P.; Meunier, M. New signal processing tools applied to power quality analysis. IEEE Trans. Power Deliv. 1999, 14, 561–566. [Google Scholar] [CrossRef]
  36. Plaza, E.G.; Núñez López, P.J. Application of the wavelet packet transform to vibration signals for surface roughness monitoring in CNC turning operations. Mech. Syst. Signal Process. 2018, 98, 902–919. [Google Scholar] [CrossRef]
  37. Plaza, E.G.; López, P.N. Analysis of cutting force signals by wavelet packet transform for surface roughness monitoring in CNC turning. Mech. Syst. Signal Process. 2018, 98, 634–651. [Google Scholar] [CrossRef]
Figure 1. The time-frequency paving planes (a) short time Fourier transform and (b) WPT.
Energies 15 05510 g001
Figure 2. Data acquisition process and comparison of diagnostic results using SAEK and Root Mean Square (RMS).
Energies 15 05510 g002
Figure 3. Accelerated lifetime test data: (a) experimental set up and (b) schematic of IMS test rig.
Energies 15 05510 g003
Figure 4. WPT tree structure and frequency range due to levels and nodes.
Energies 15 05510 g004
Figure 5. Comparison of health index of bearing fault: (a) RMS, (b) SK, and (c) SAEK.
Energies 15 05510 g005
Figure 6. 3D spectrum analysis result using (a) SK and (b) SAEK.
Energies 15 05510 g006
Figure 7. The filtered data by SK and SAEK during the incipient fault period, and FFT and envelope analysis results.
Energies 15 05510 g007
Figure 8. Fault level test data: (a) experimental set up and (b) schematic of AHU.
Energies 15 05510 g008
Figure 9. Bearing conditions: (a) healthy, (b) infant fault bearing and, (c) sever fault bearing.
Energies 15 05510 g009
Figure 10. Comparison of health index changes according to bearing conditions (health, soft fault, hard fault) using (a) RMS, (b) SK, and (c) SAEK.
Energies 15 05510 g010
Figure 11. Results of envelope according to the bearing conditions: (a-1) normal condition, (a-2) normal data with SAEK analysis, (b-1) soft fault condition, (b-2) soft fault data with SAEK analysis, (c-1) hard fault condition, (c-2) hard fault data with SAEK.
Energies 15 05510 g011
Table 1. Bearing characteristic frequency of IMS data.
Bearing Characteristic FrequencyValue
Shaft frequency33.3 Hz
Ball pass frequency outer race (BPFO)236 Hz
Ball pass frequency inner race (BPFI)297 Hz
Ball spin frequency (BSF)278 Hz
(2 × 139 Hz)
Fundamental train frequency (FTF)15 Hz
Table 2. Bearing specification of AHU.
Bearing SpecificationsValues
Pitch diameter101.4 mm
Rolling element diameter15 mm
Number of rolling elements per row15
Contact angle
Publisher’s Note: MDPI stays neutral with regard to jurisdictional claims in published maps and institutional affiliations.

