
Global Progress in Oil and Gas Well Research Using Bibliometric Analysis Based on VOSviewer and CiteSpace


Abstract
:1. Introduction
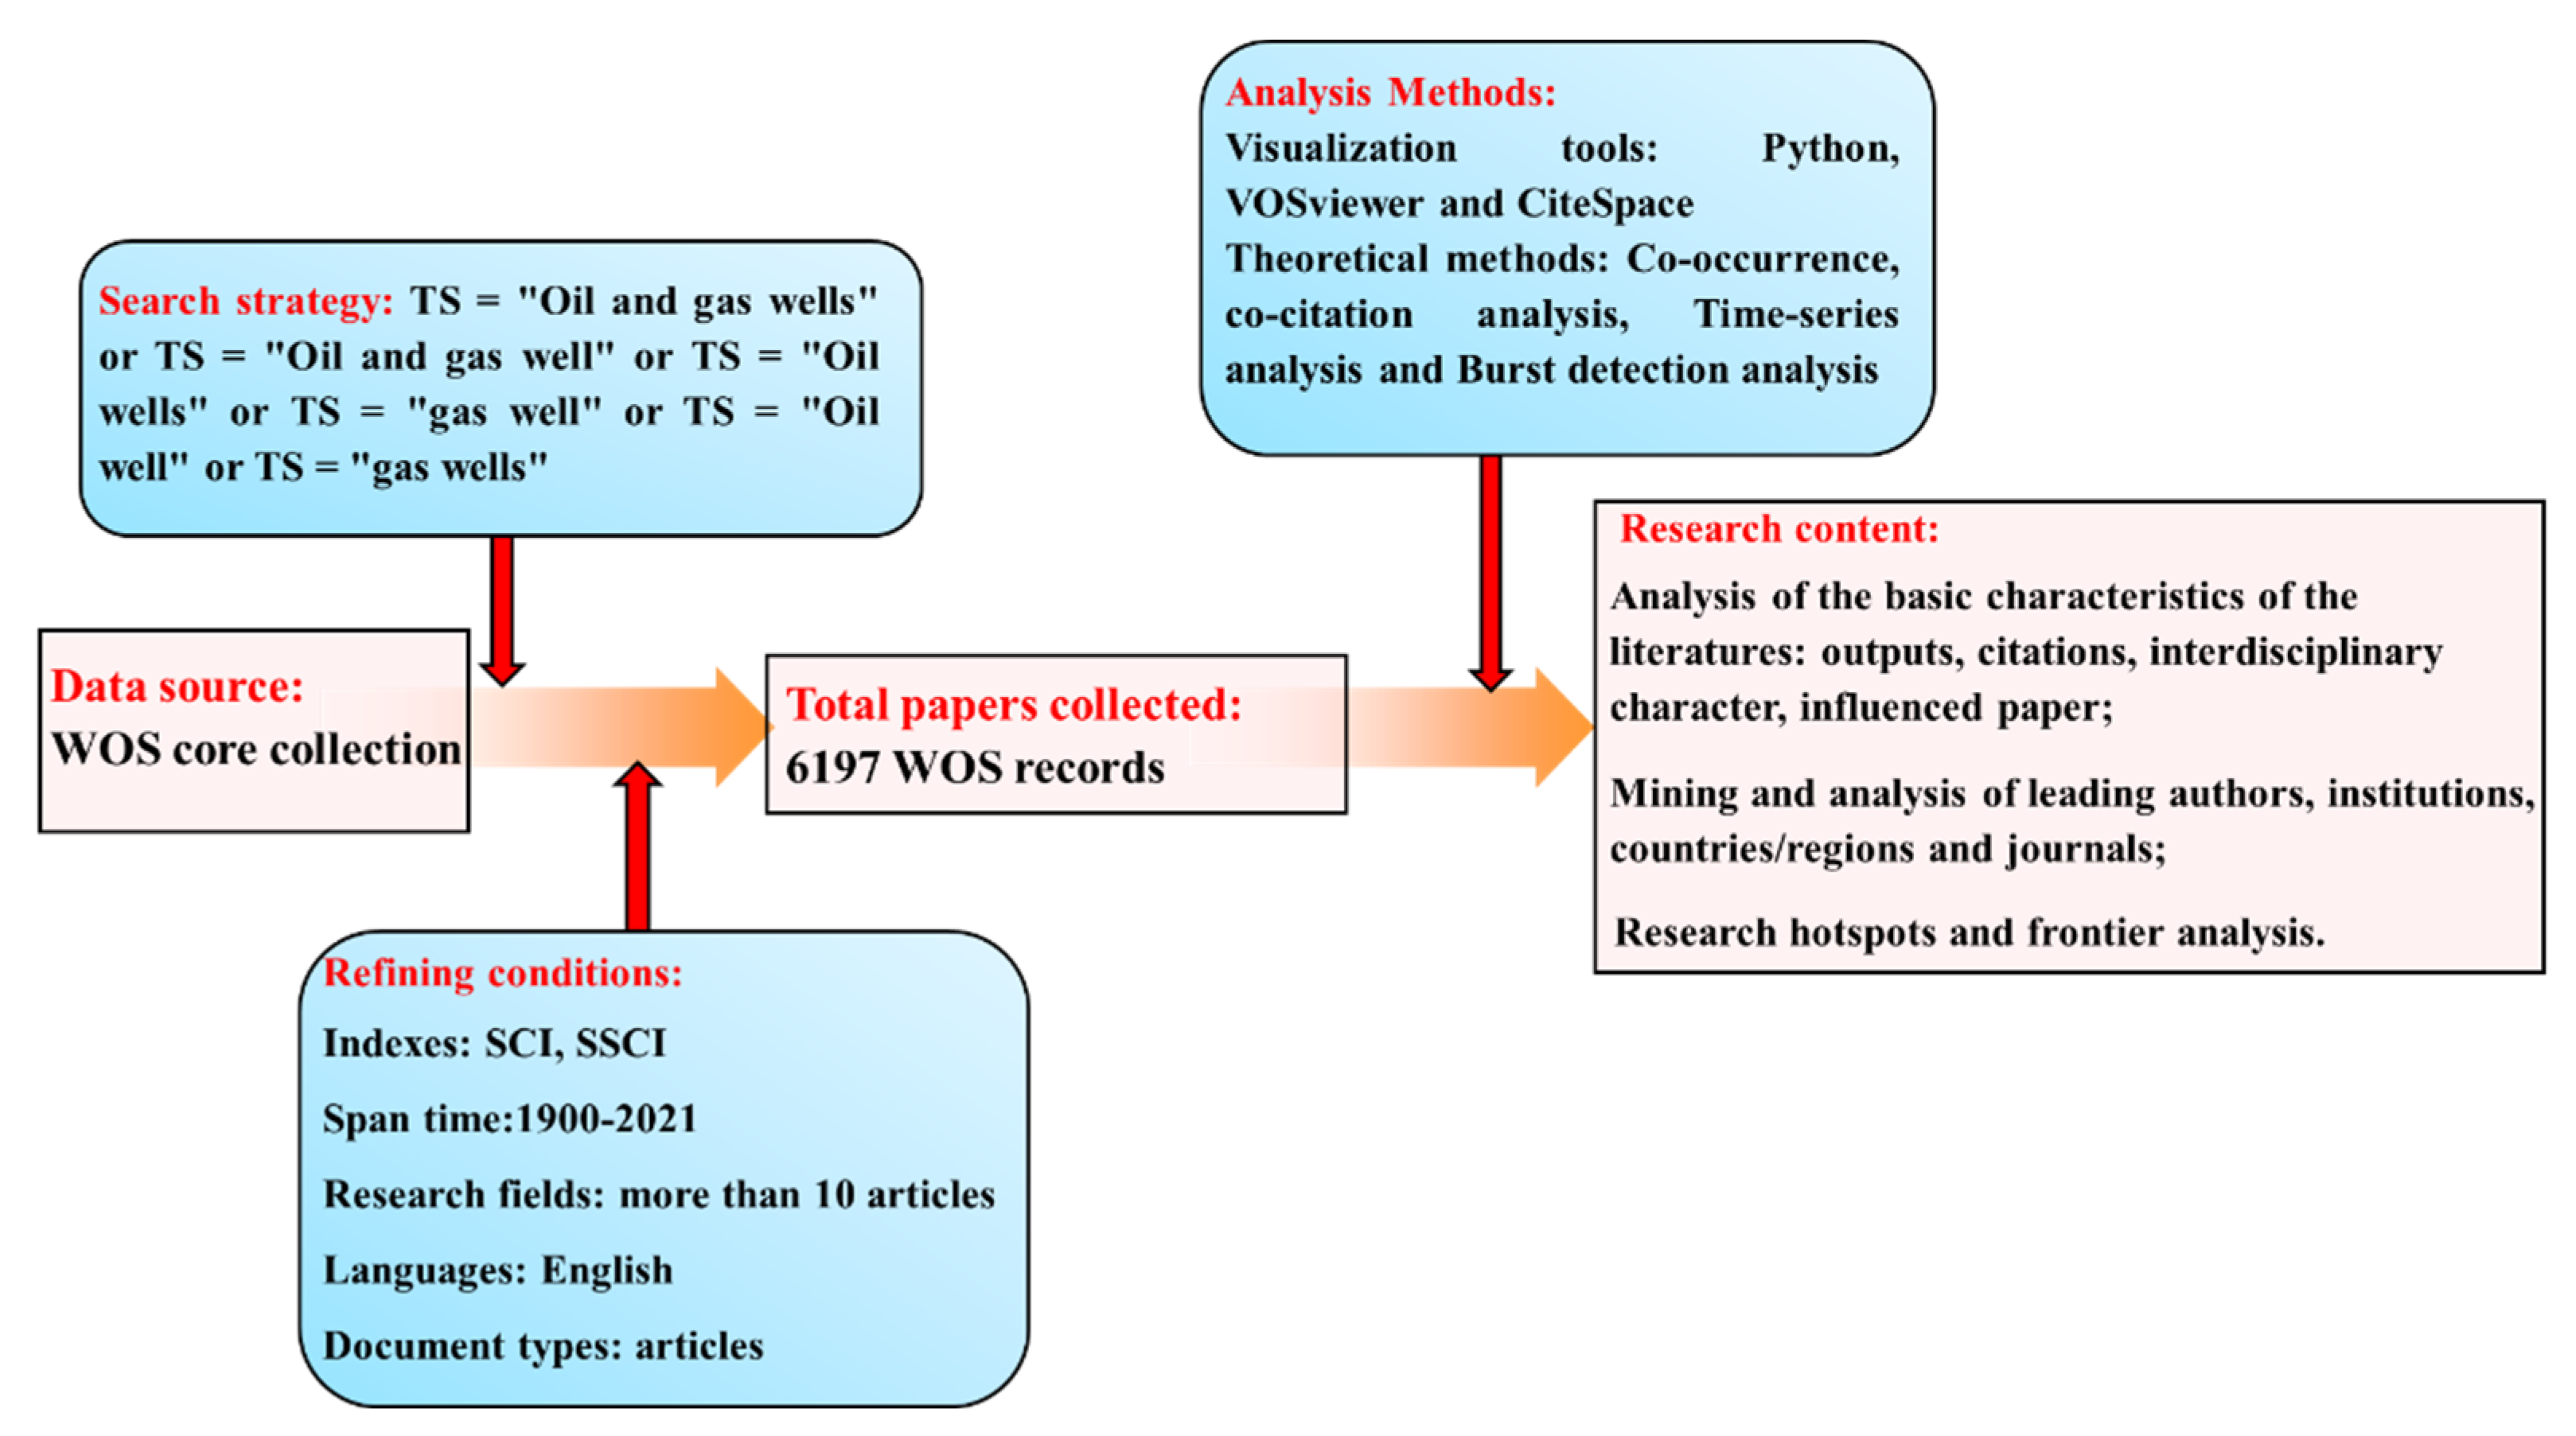
2. Data Source and Methods
2.1. Data
2.2. Methods
3. Analysis of the Basic Characteristics of the Literature
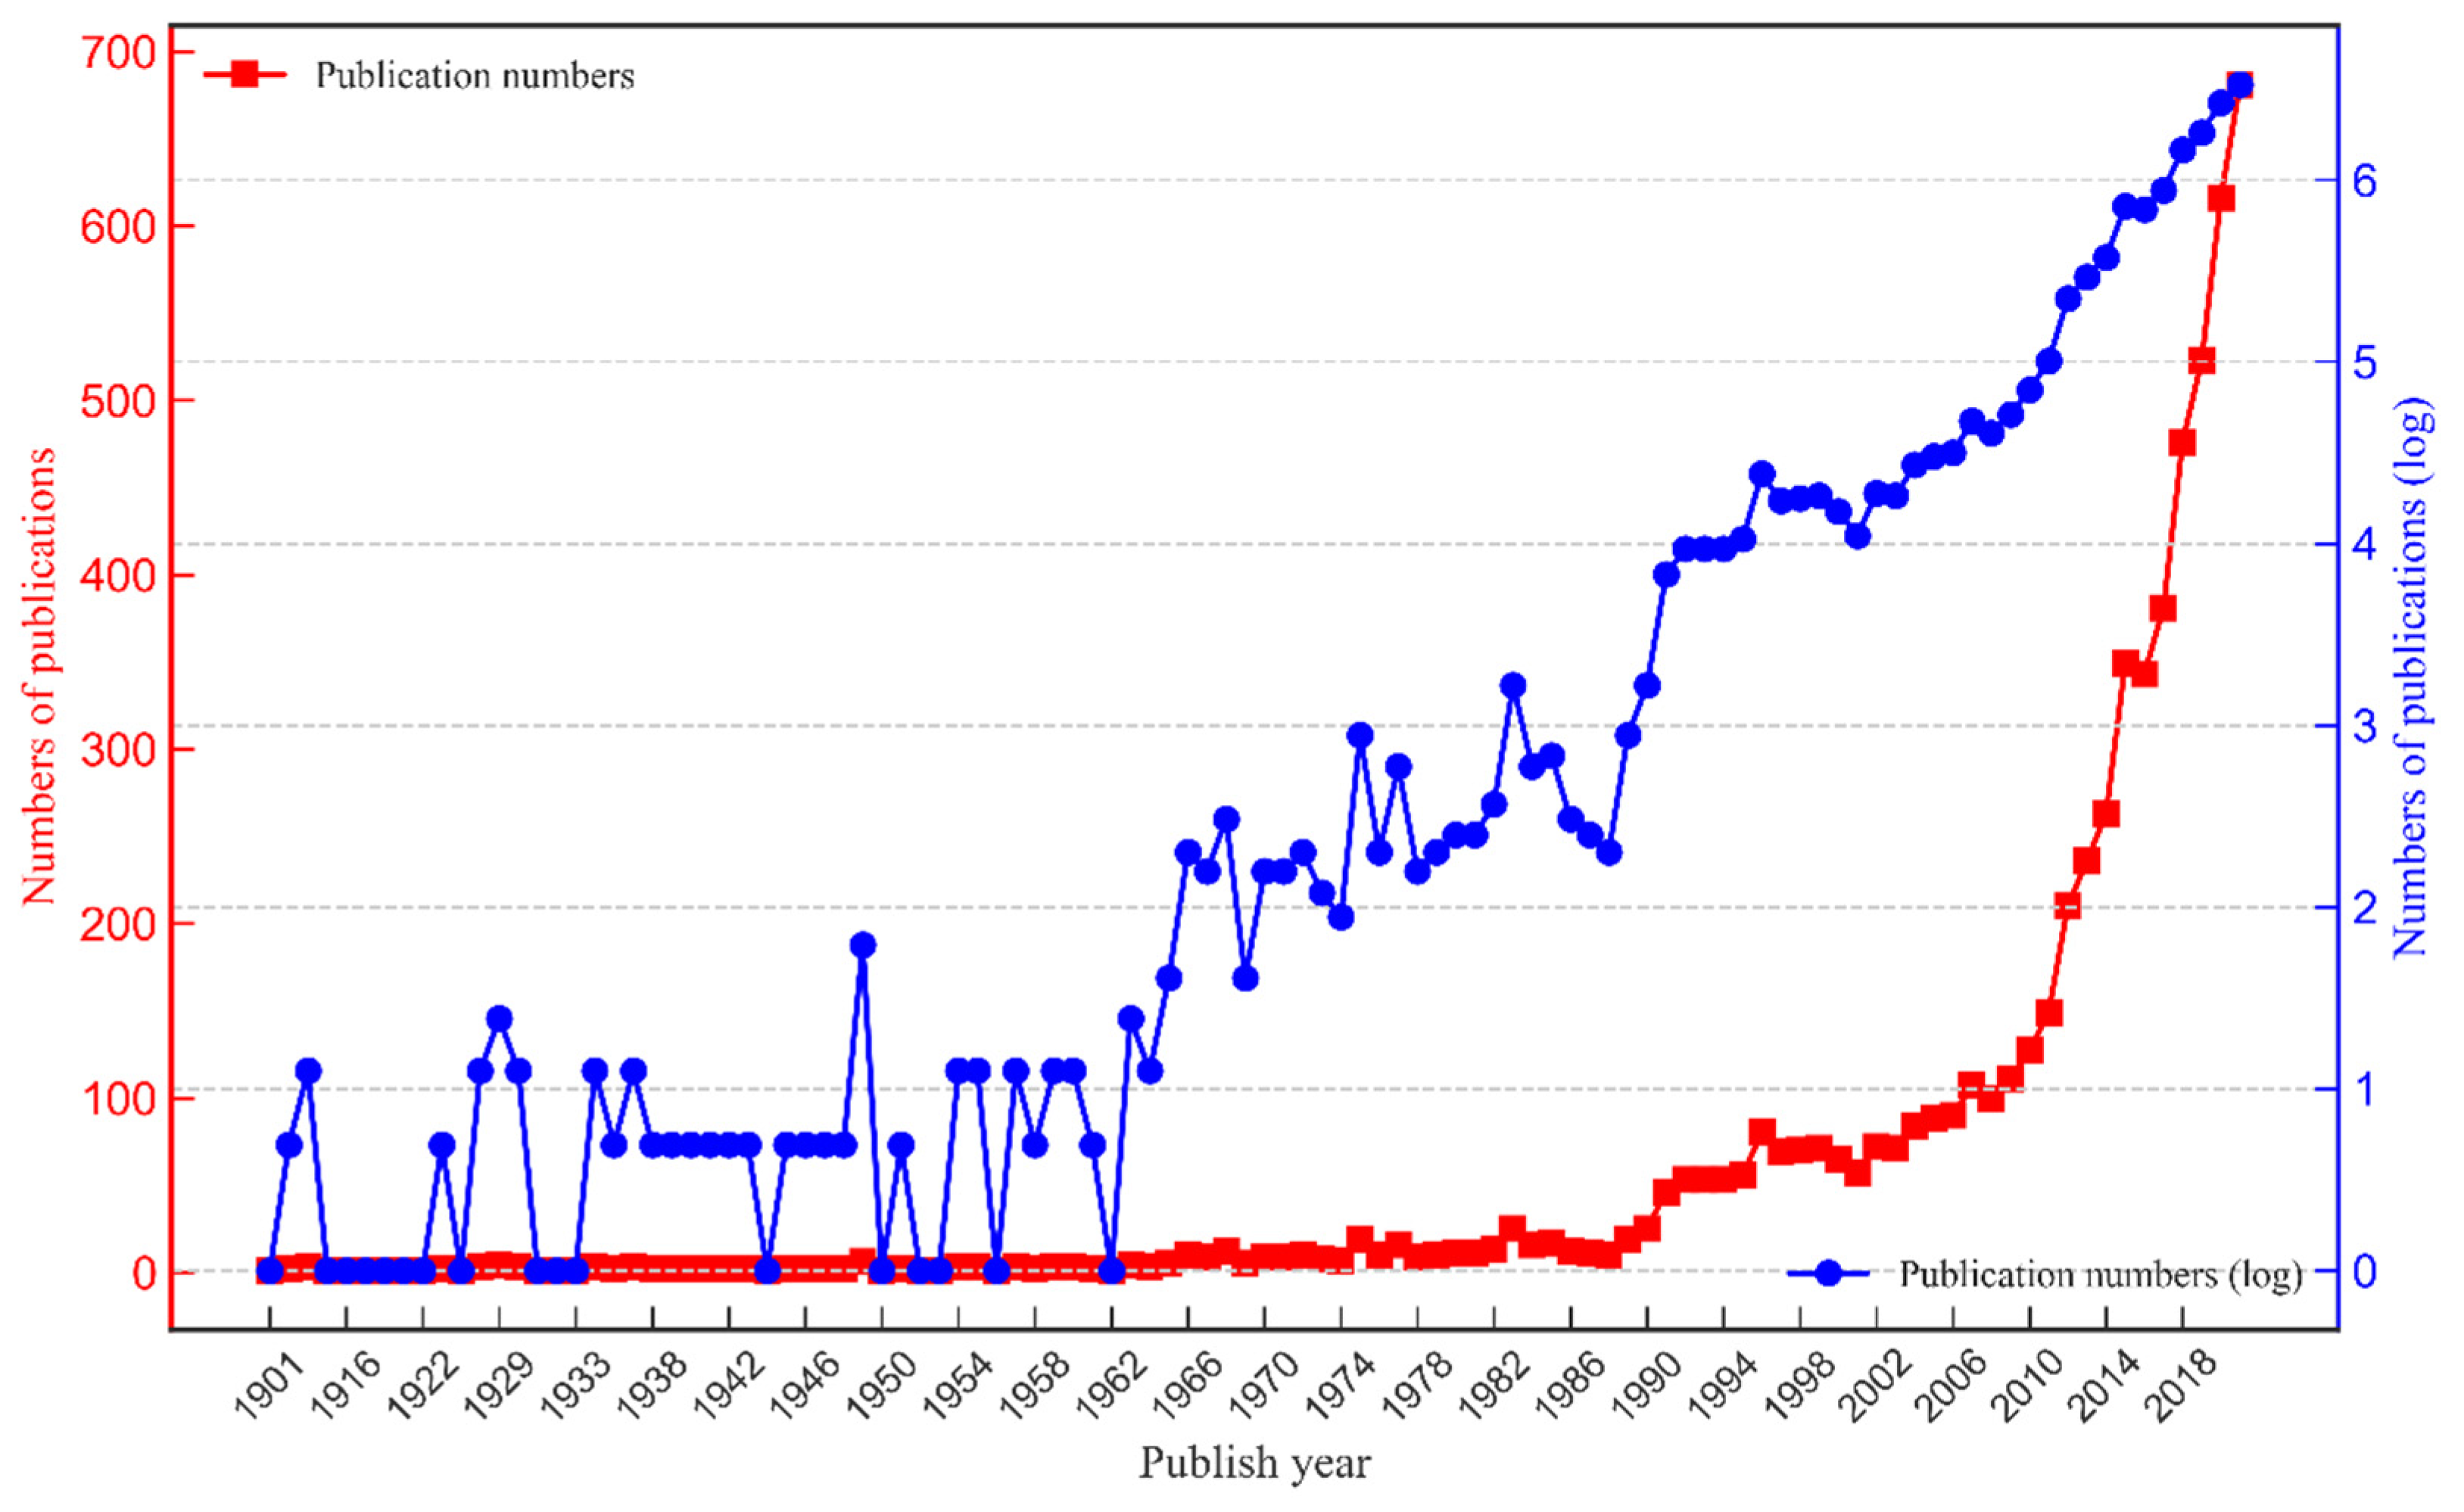
3.1. Timeseries Analysis of Paper Outputs
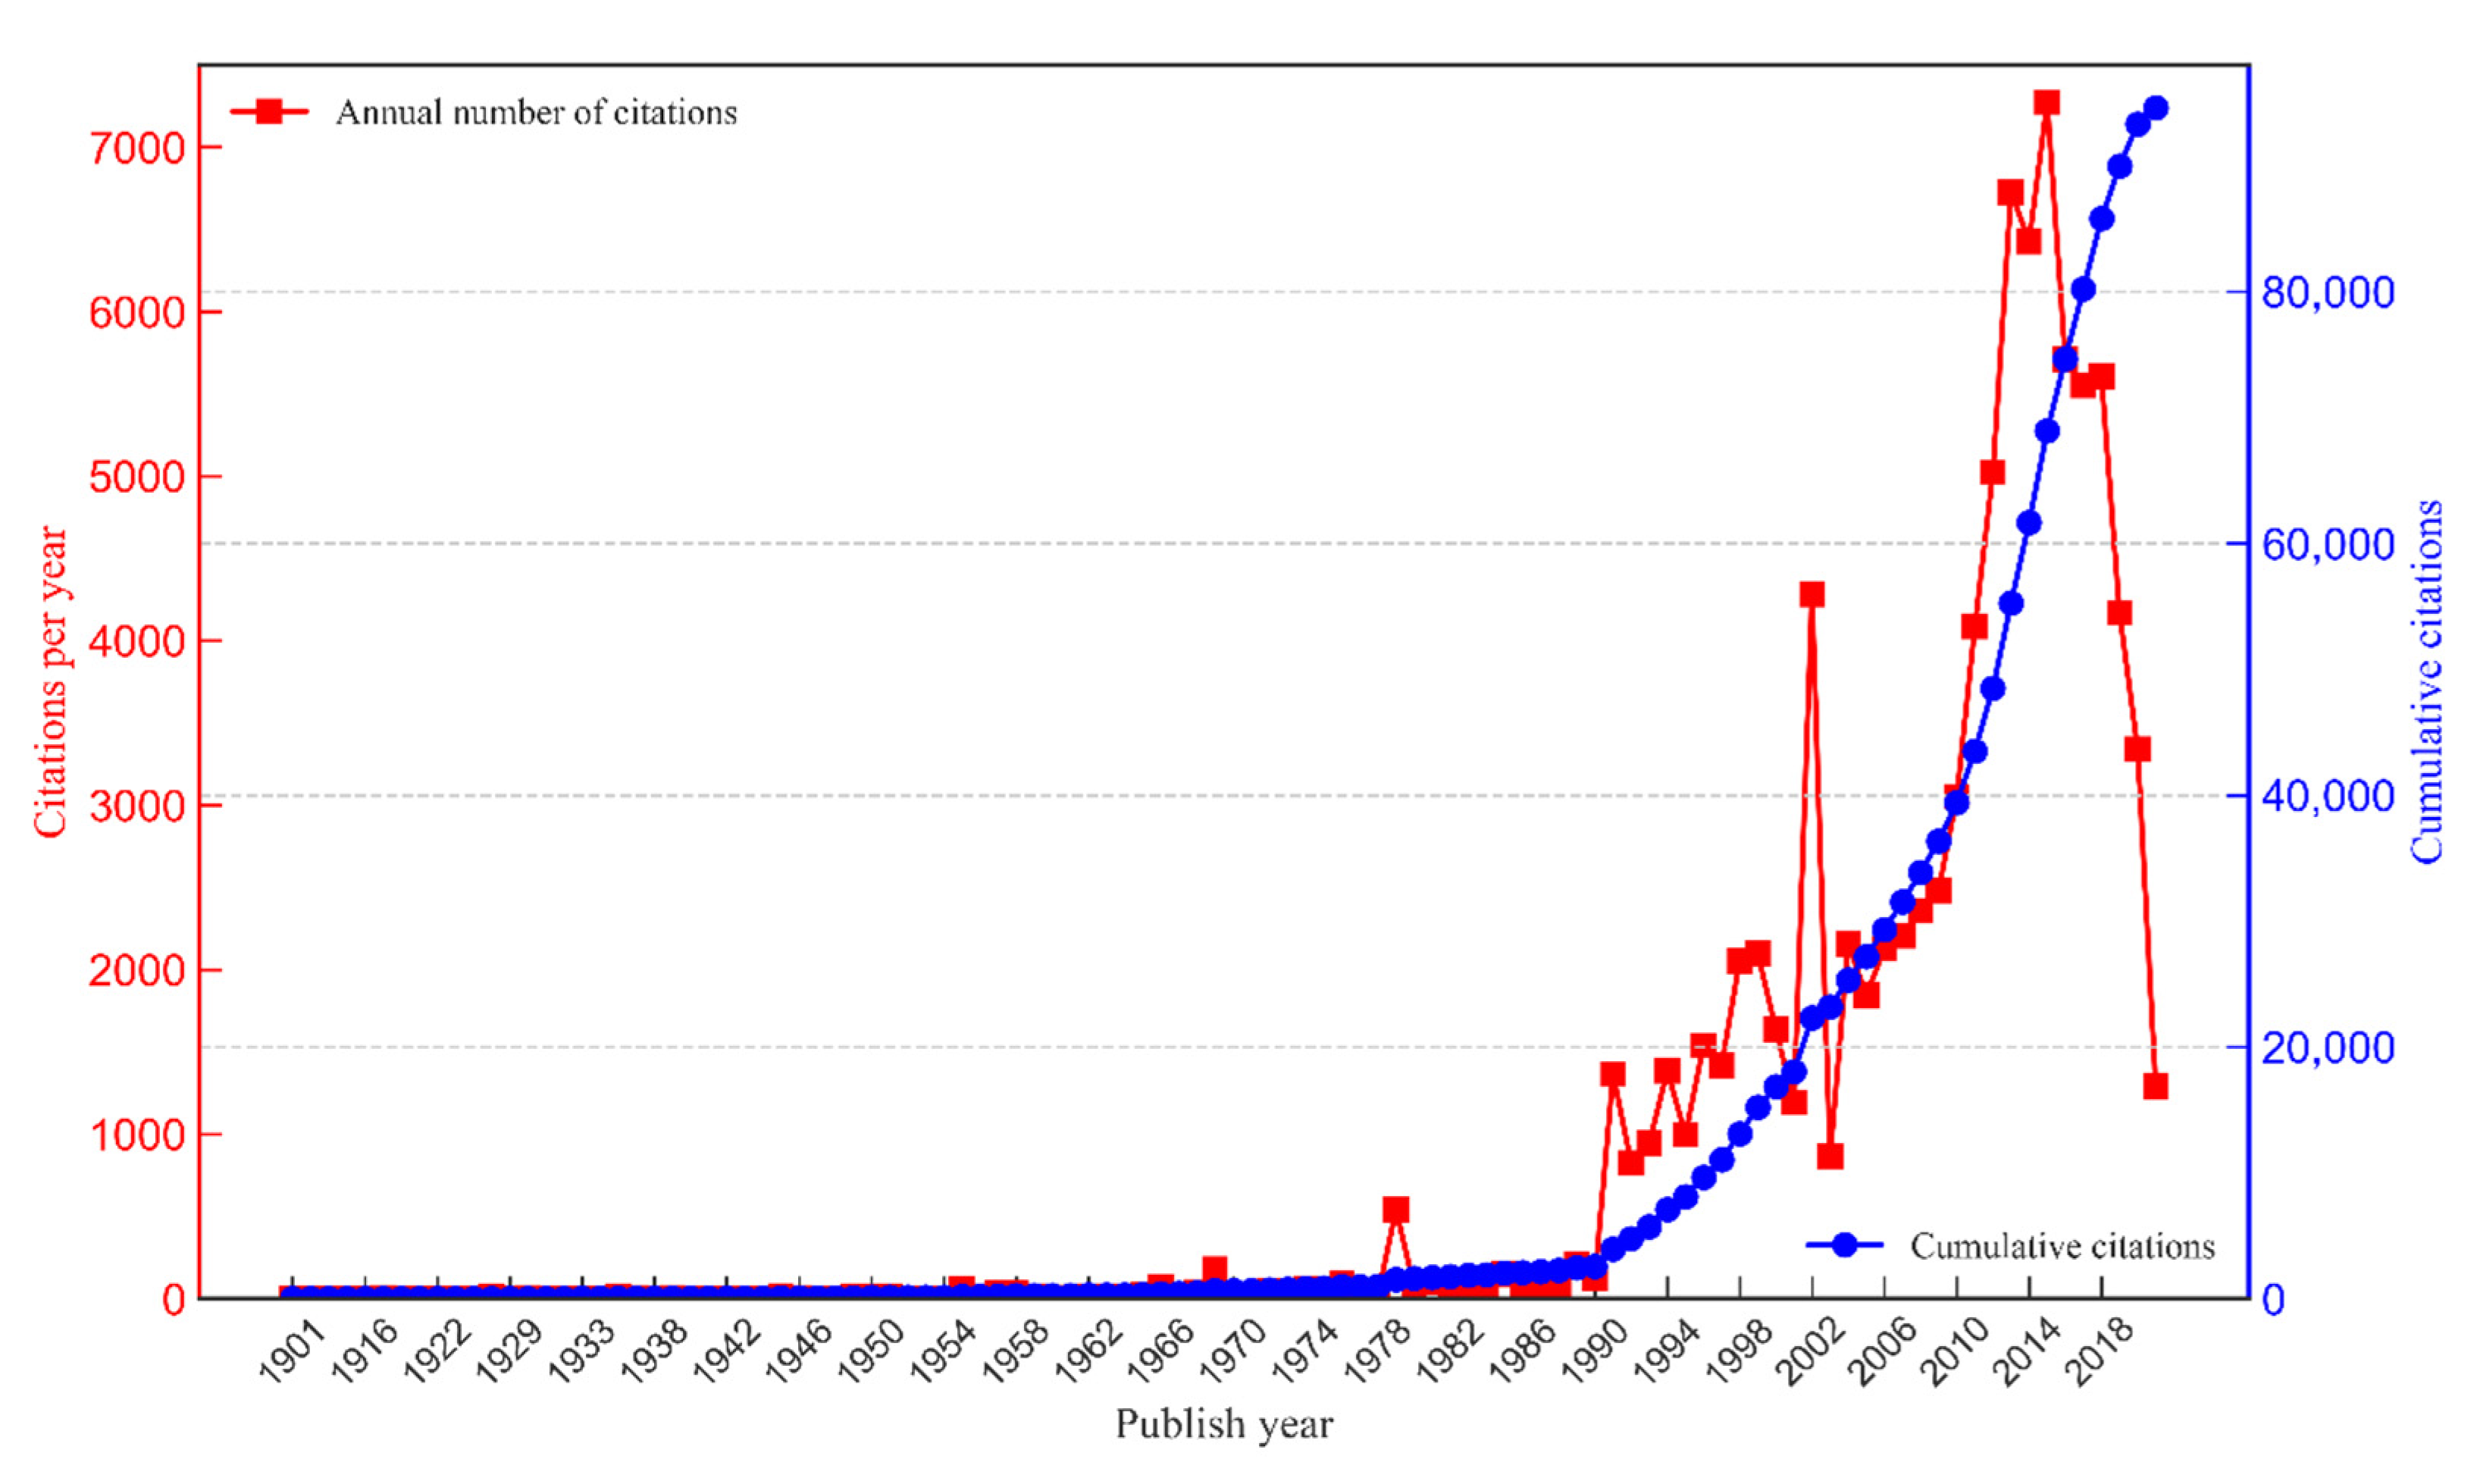
3.2. Citation Trends
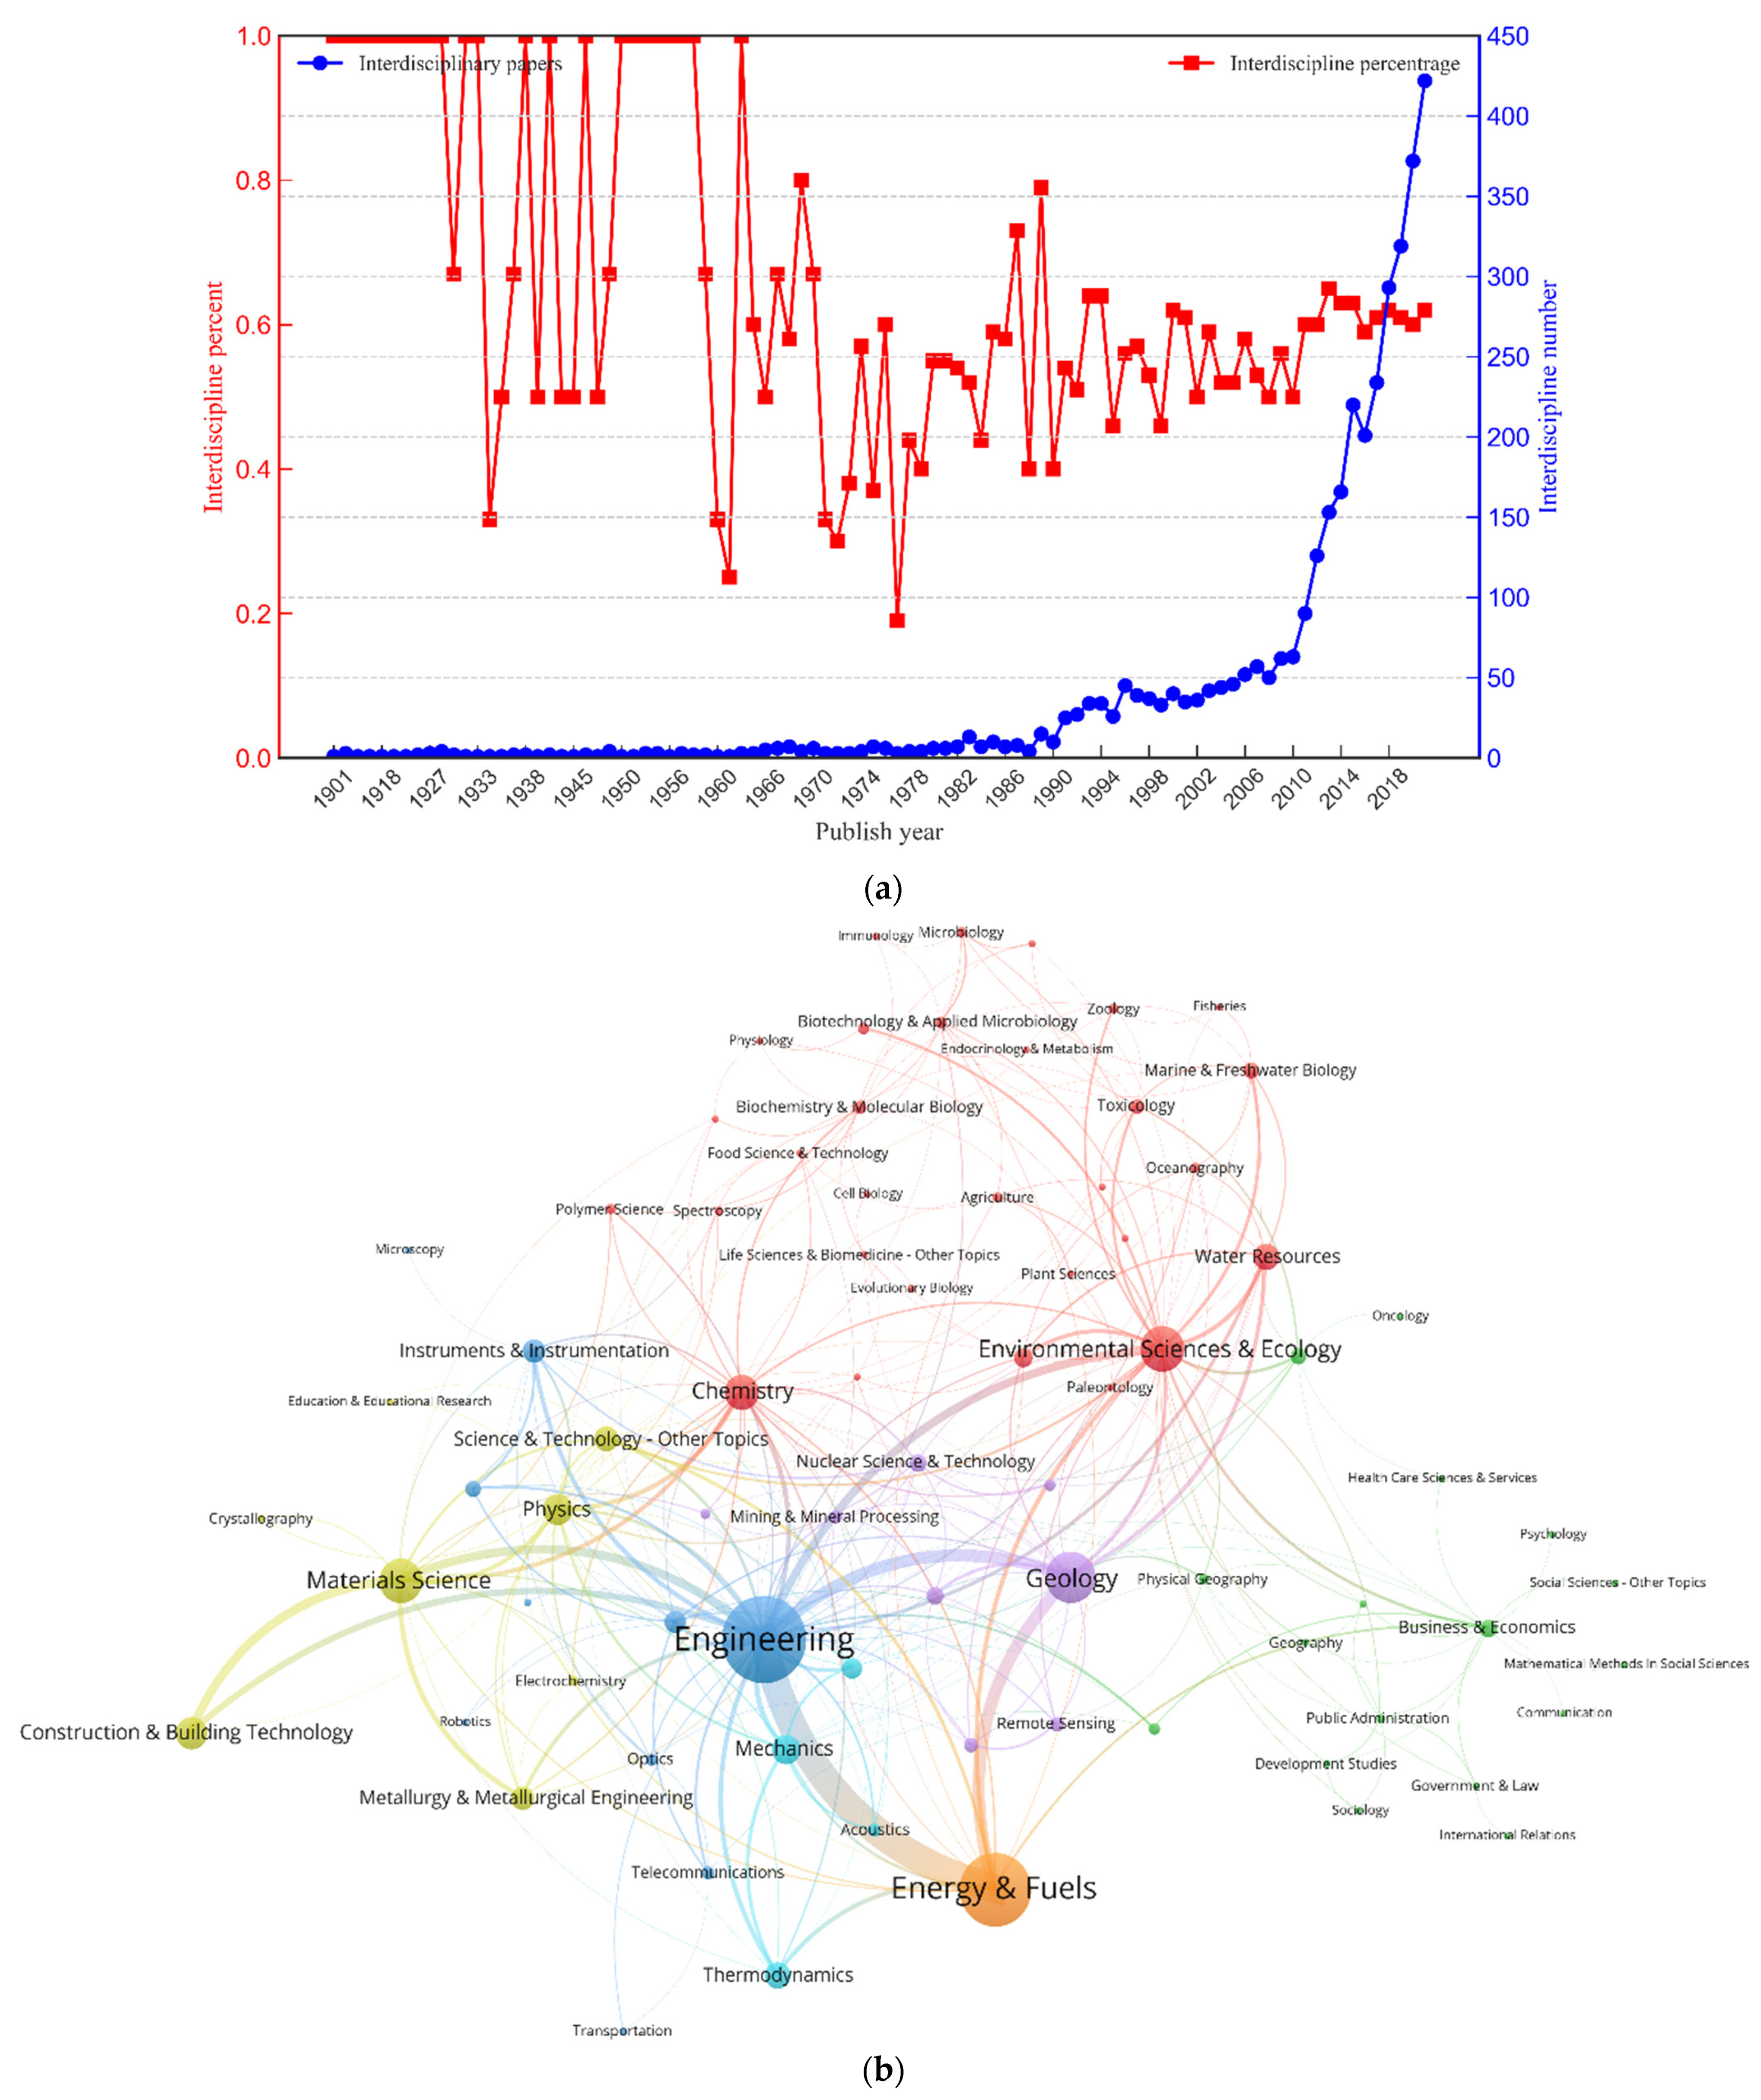
3.3. Interdisciplinary Characters
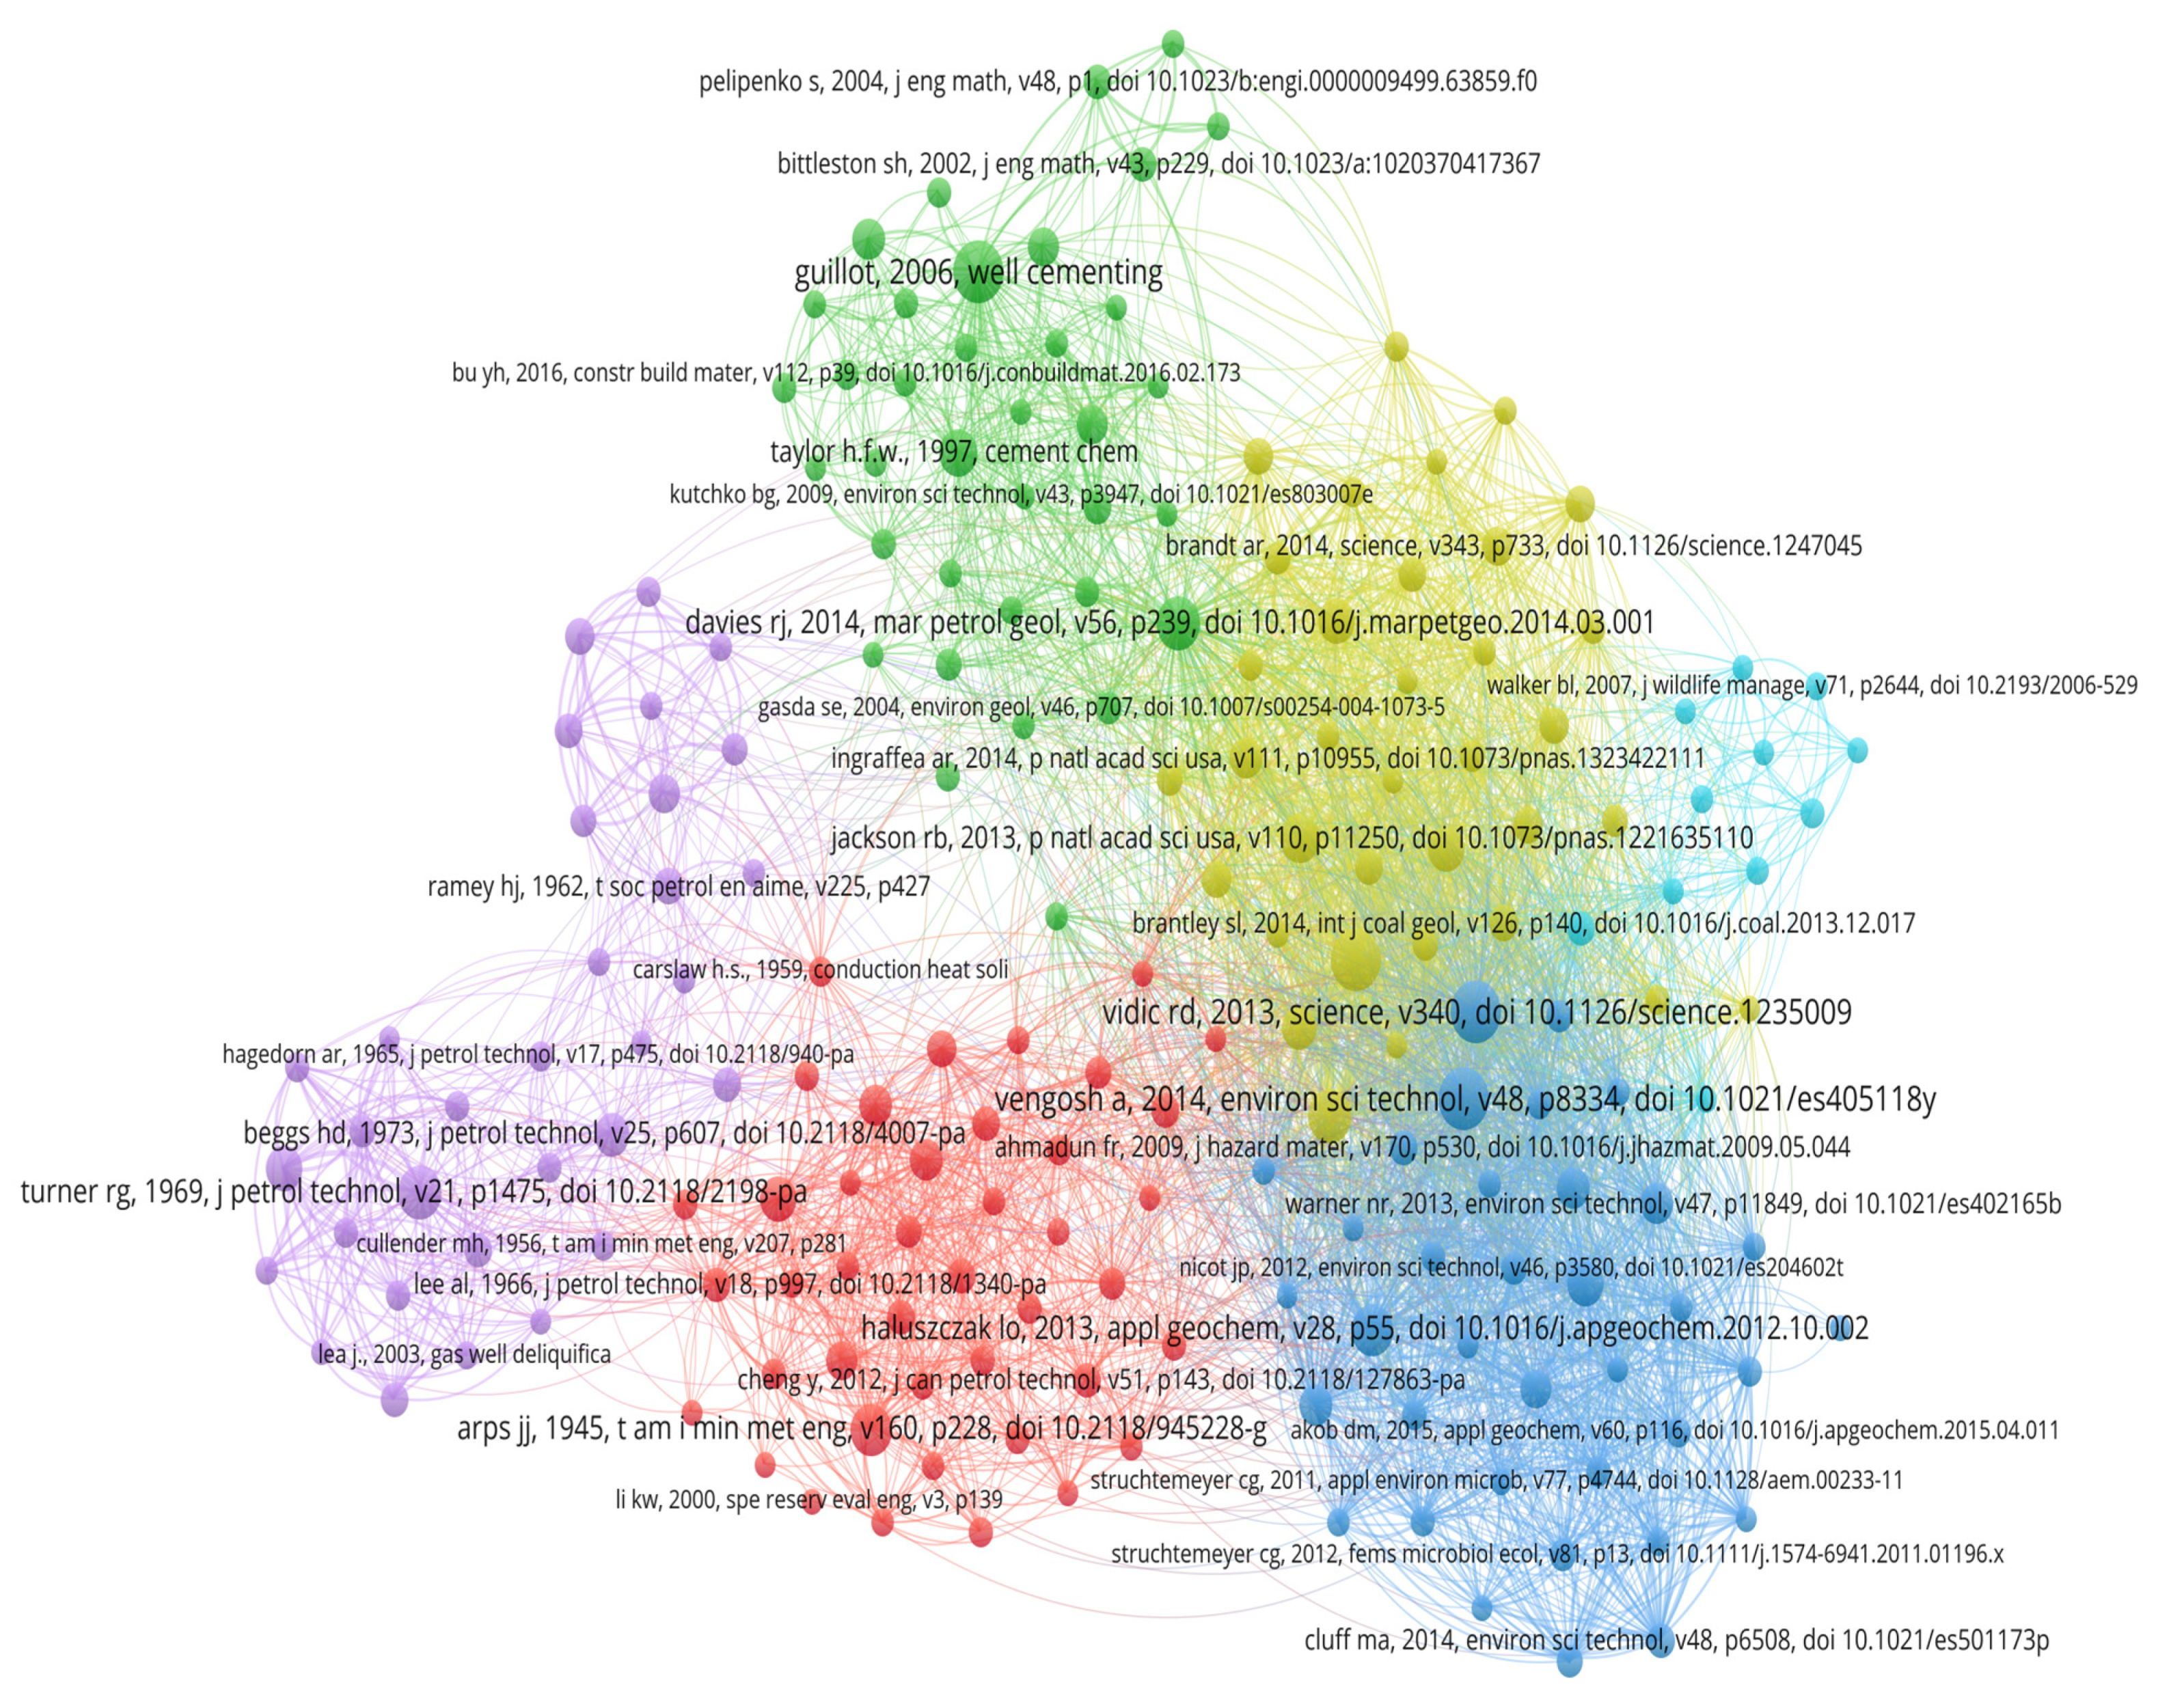
3.4. Most Influential Literature
4. Analysis of the Research Entities
4.1. Cooperation Patterns
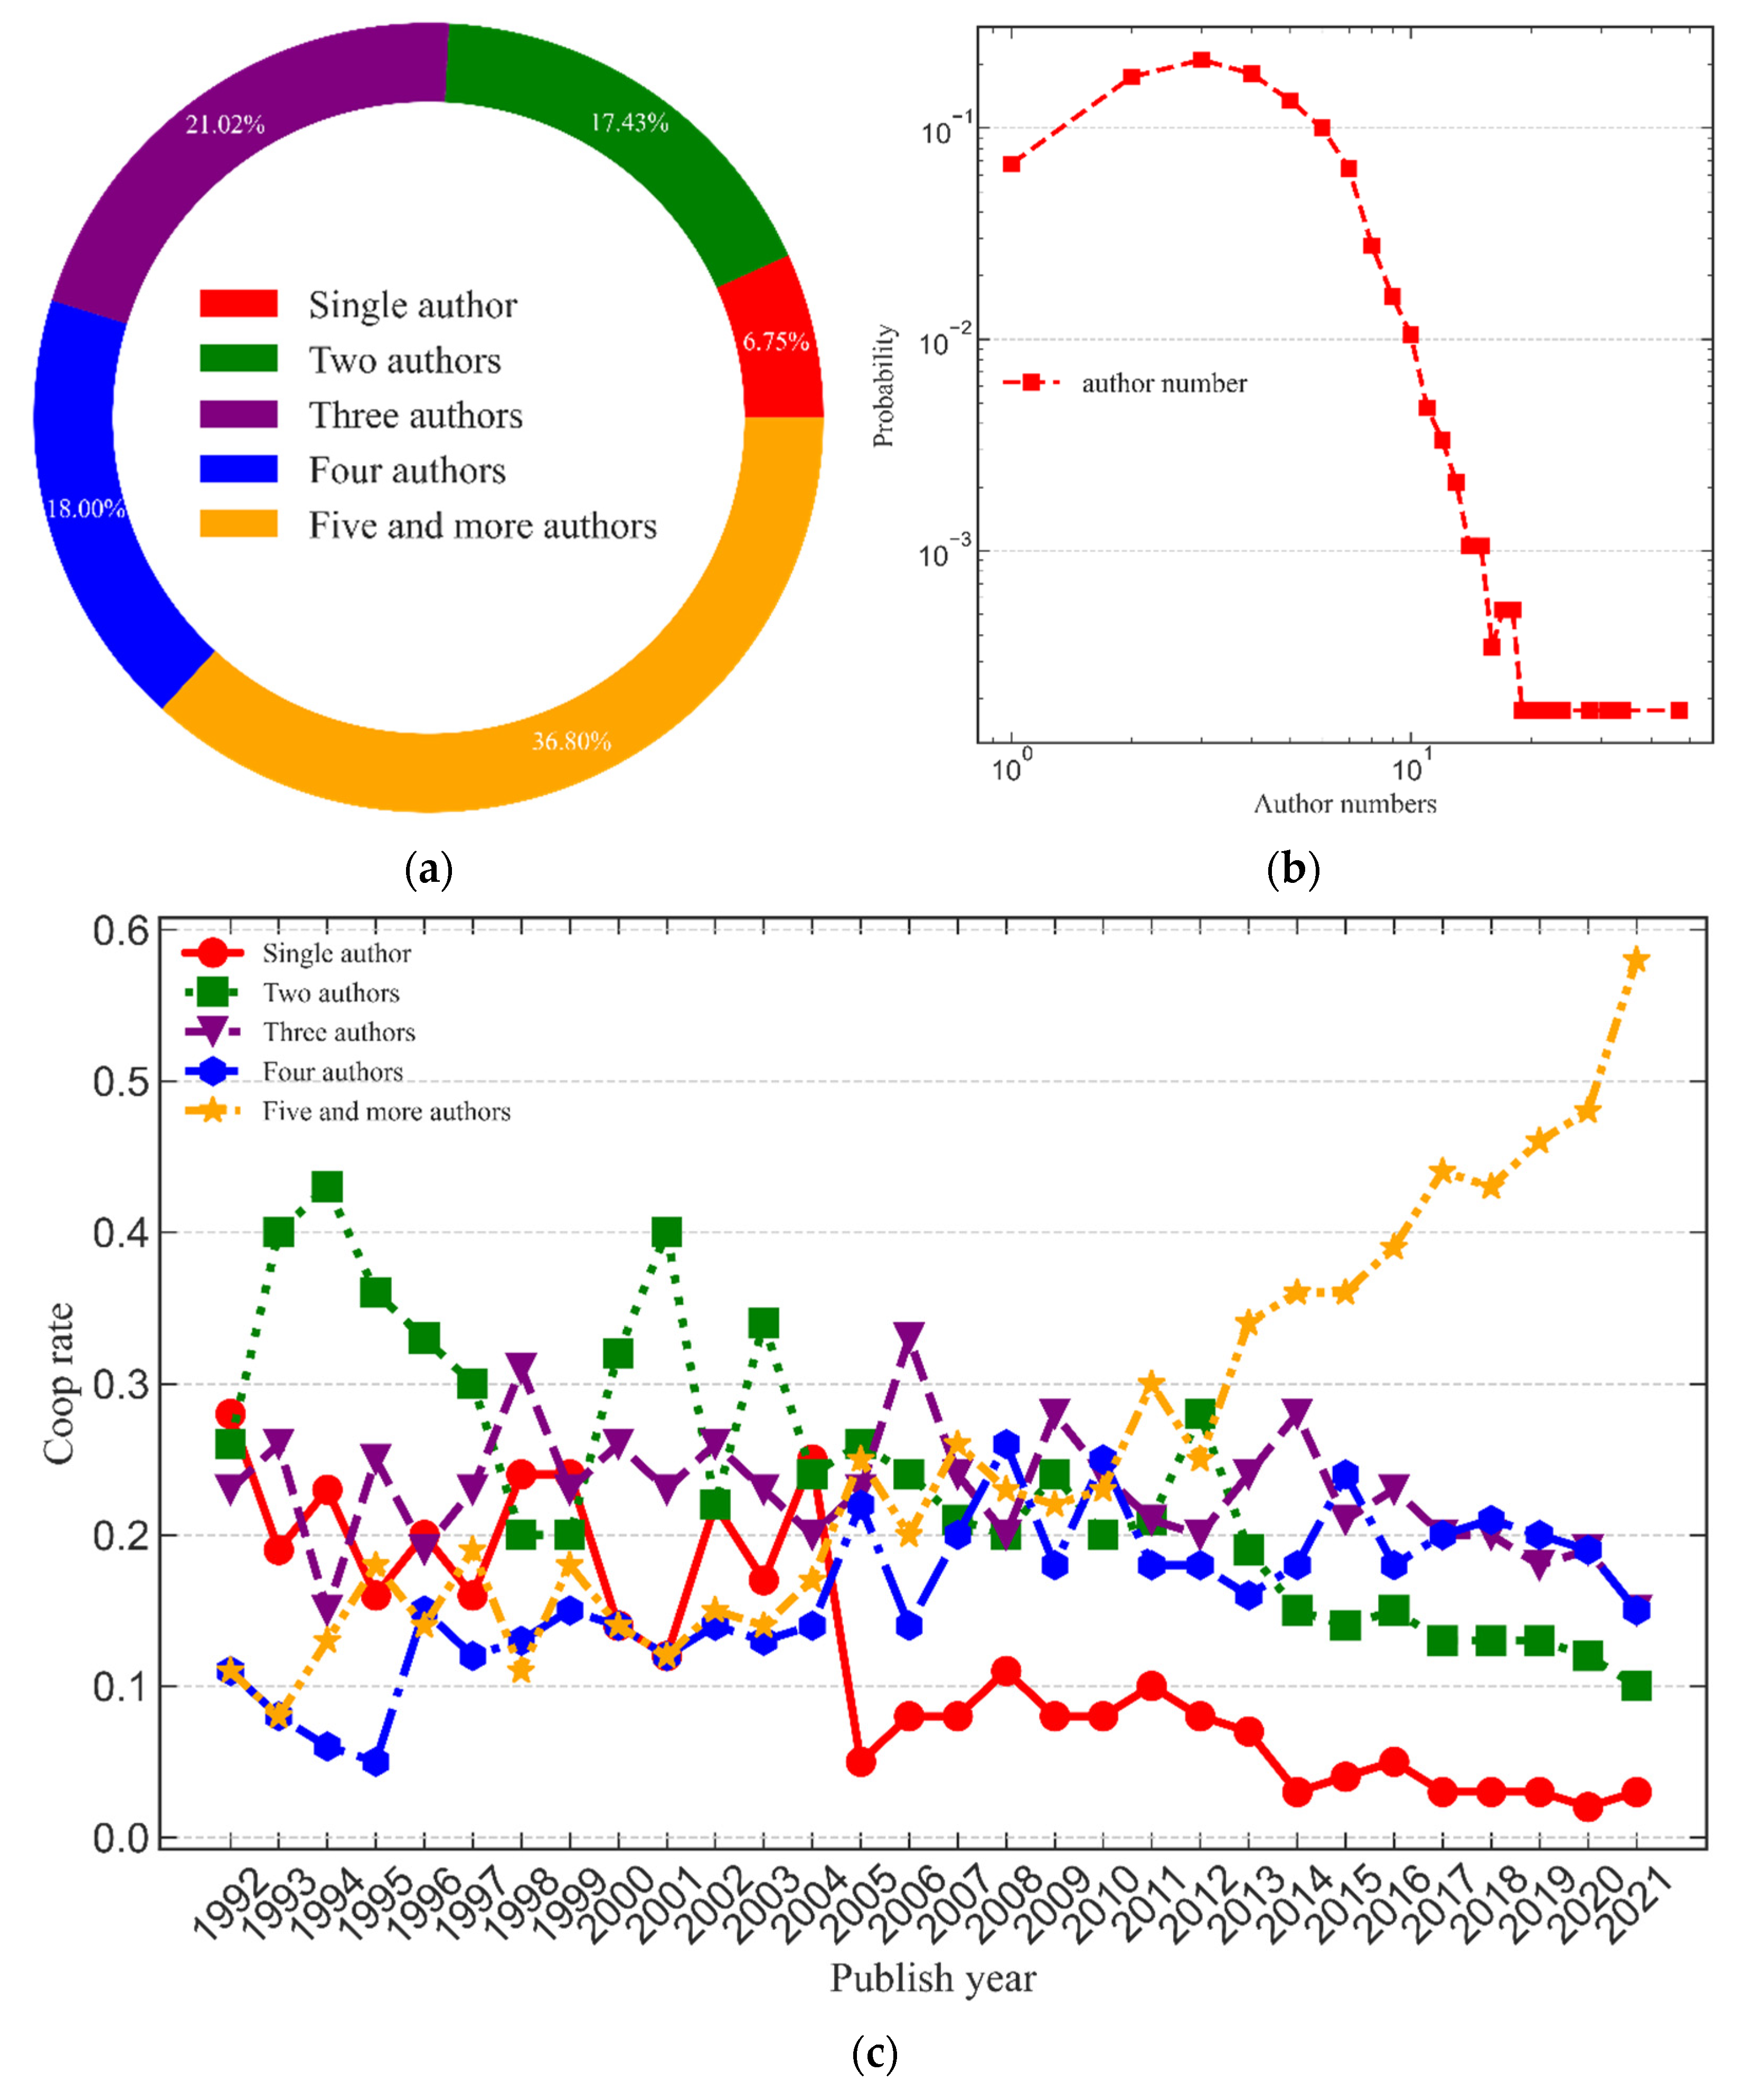
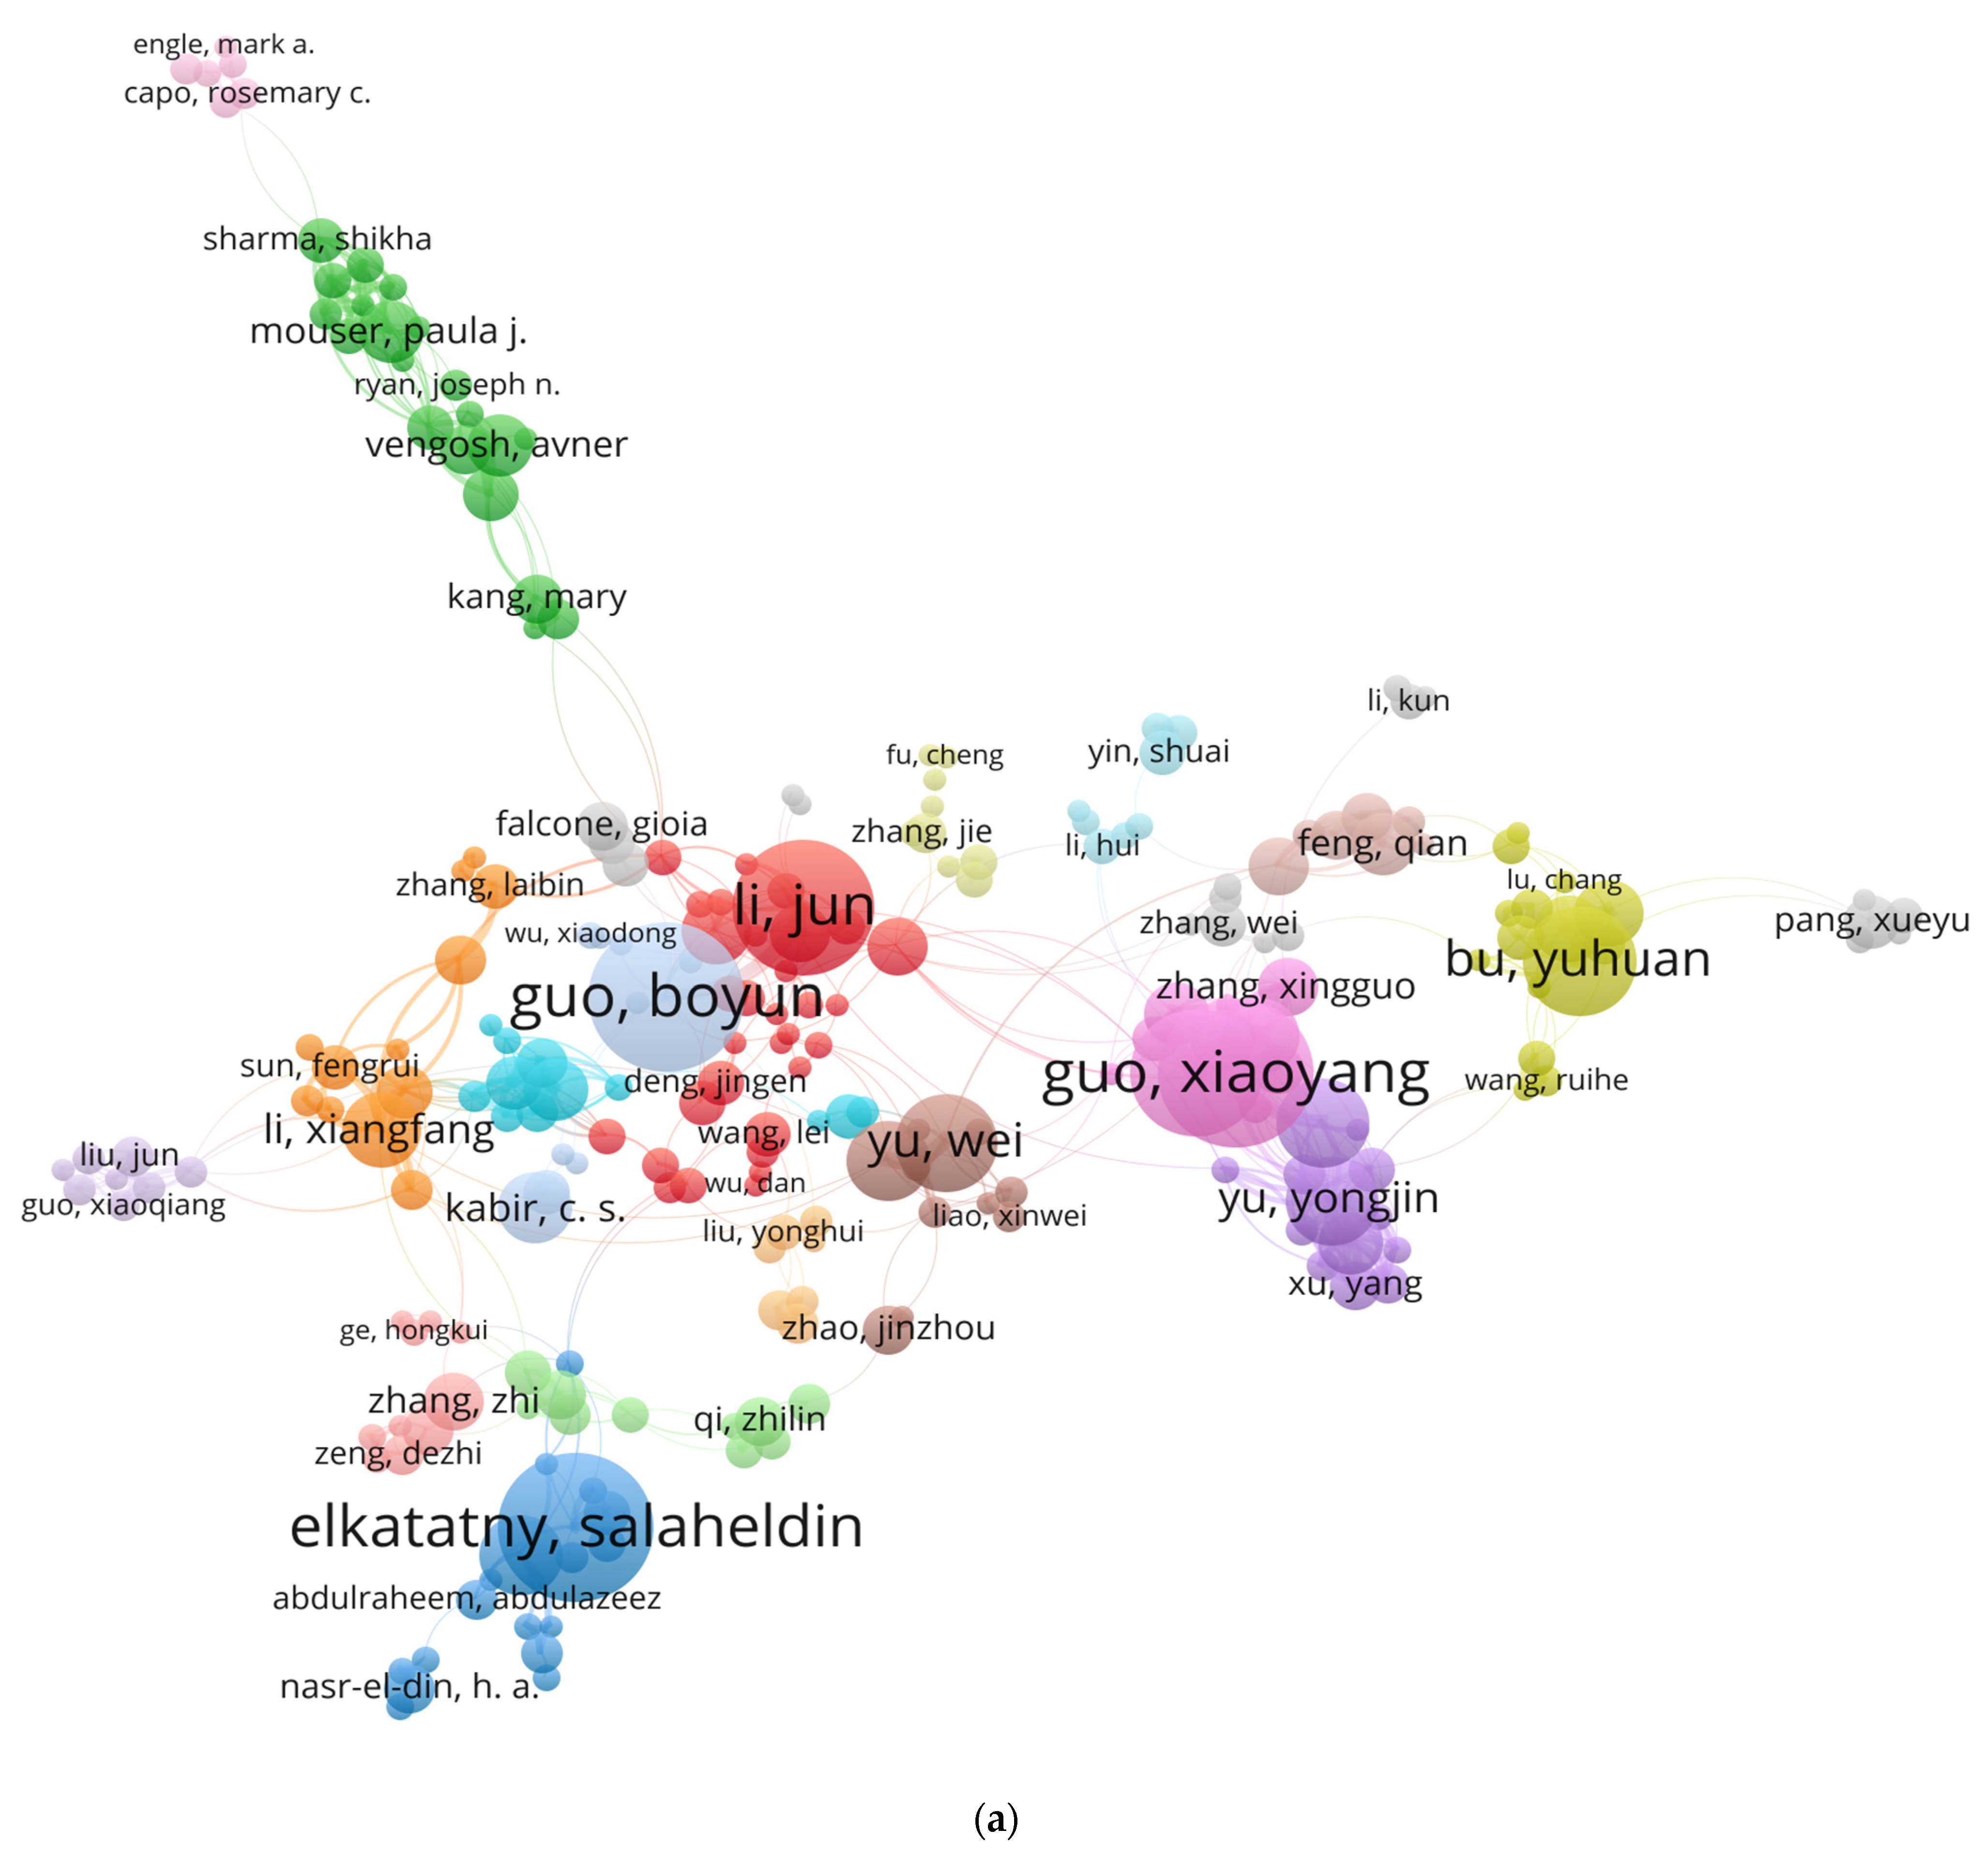
4.1.1. Cooperation Patterns of Authors
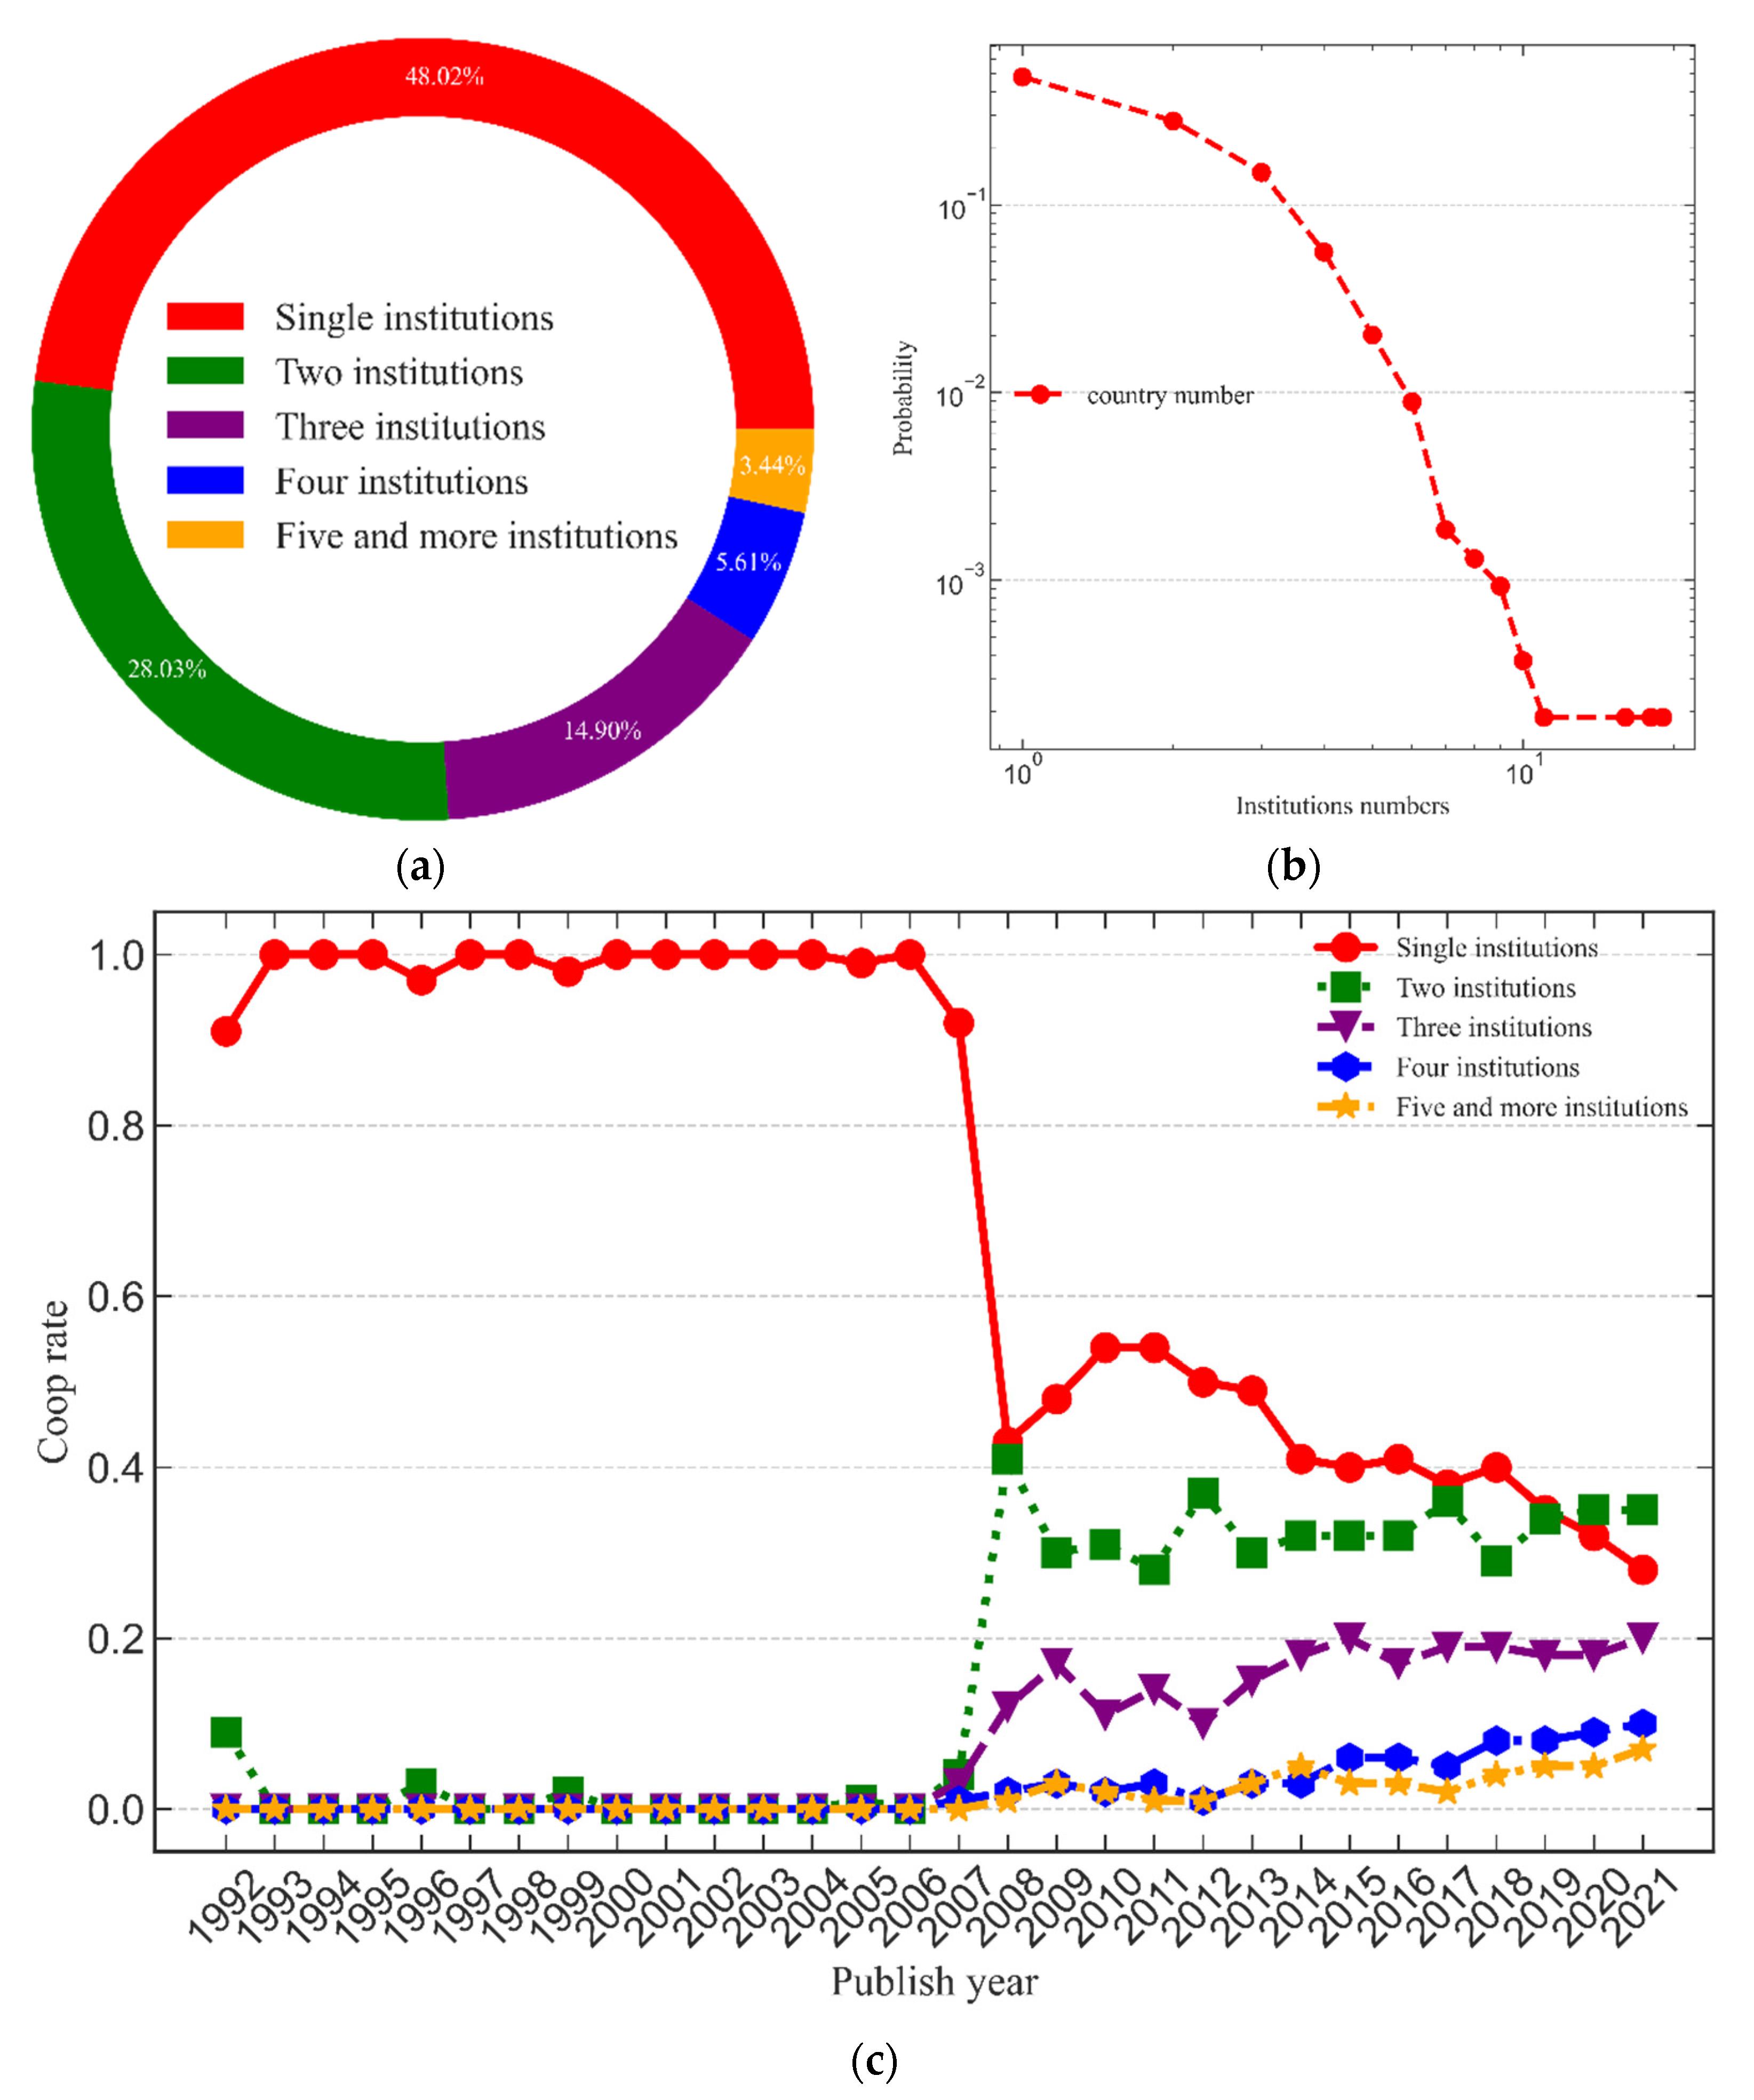
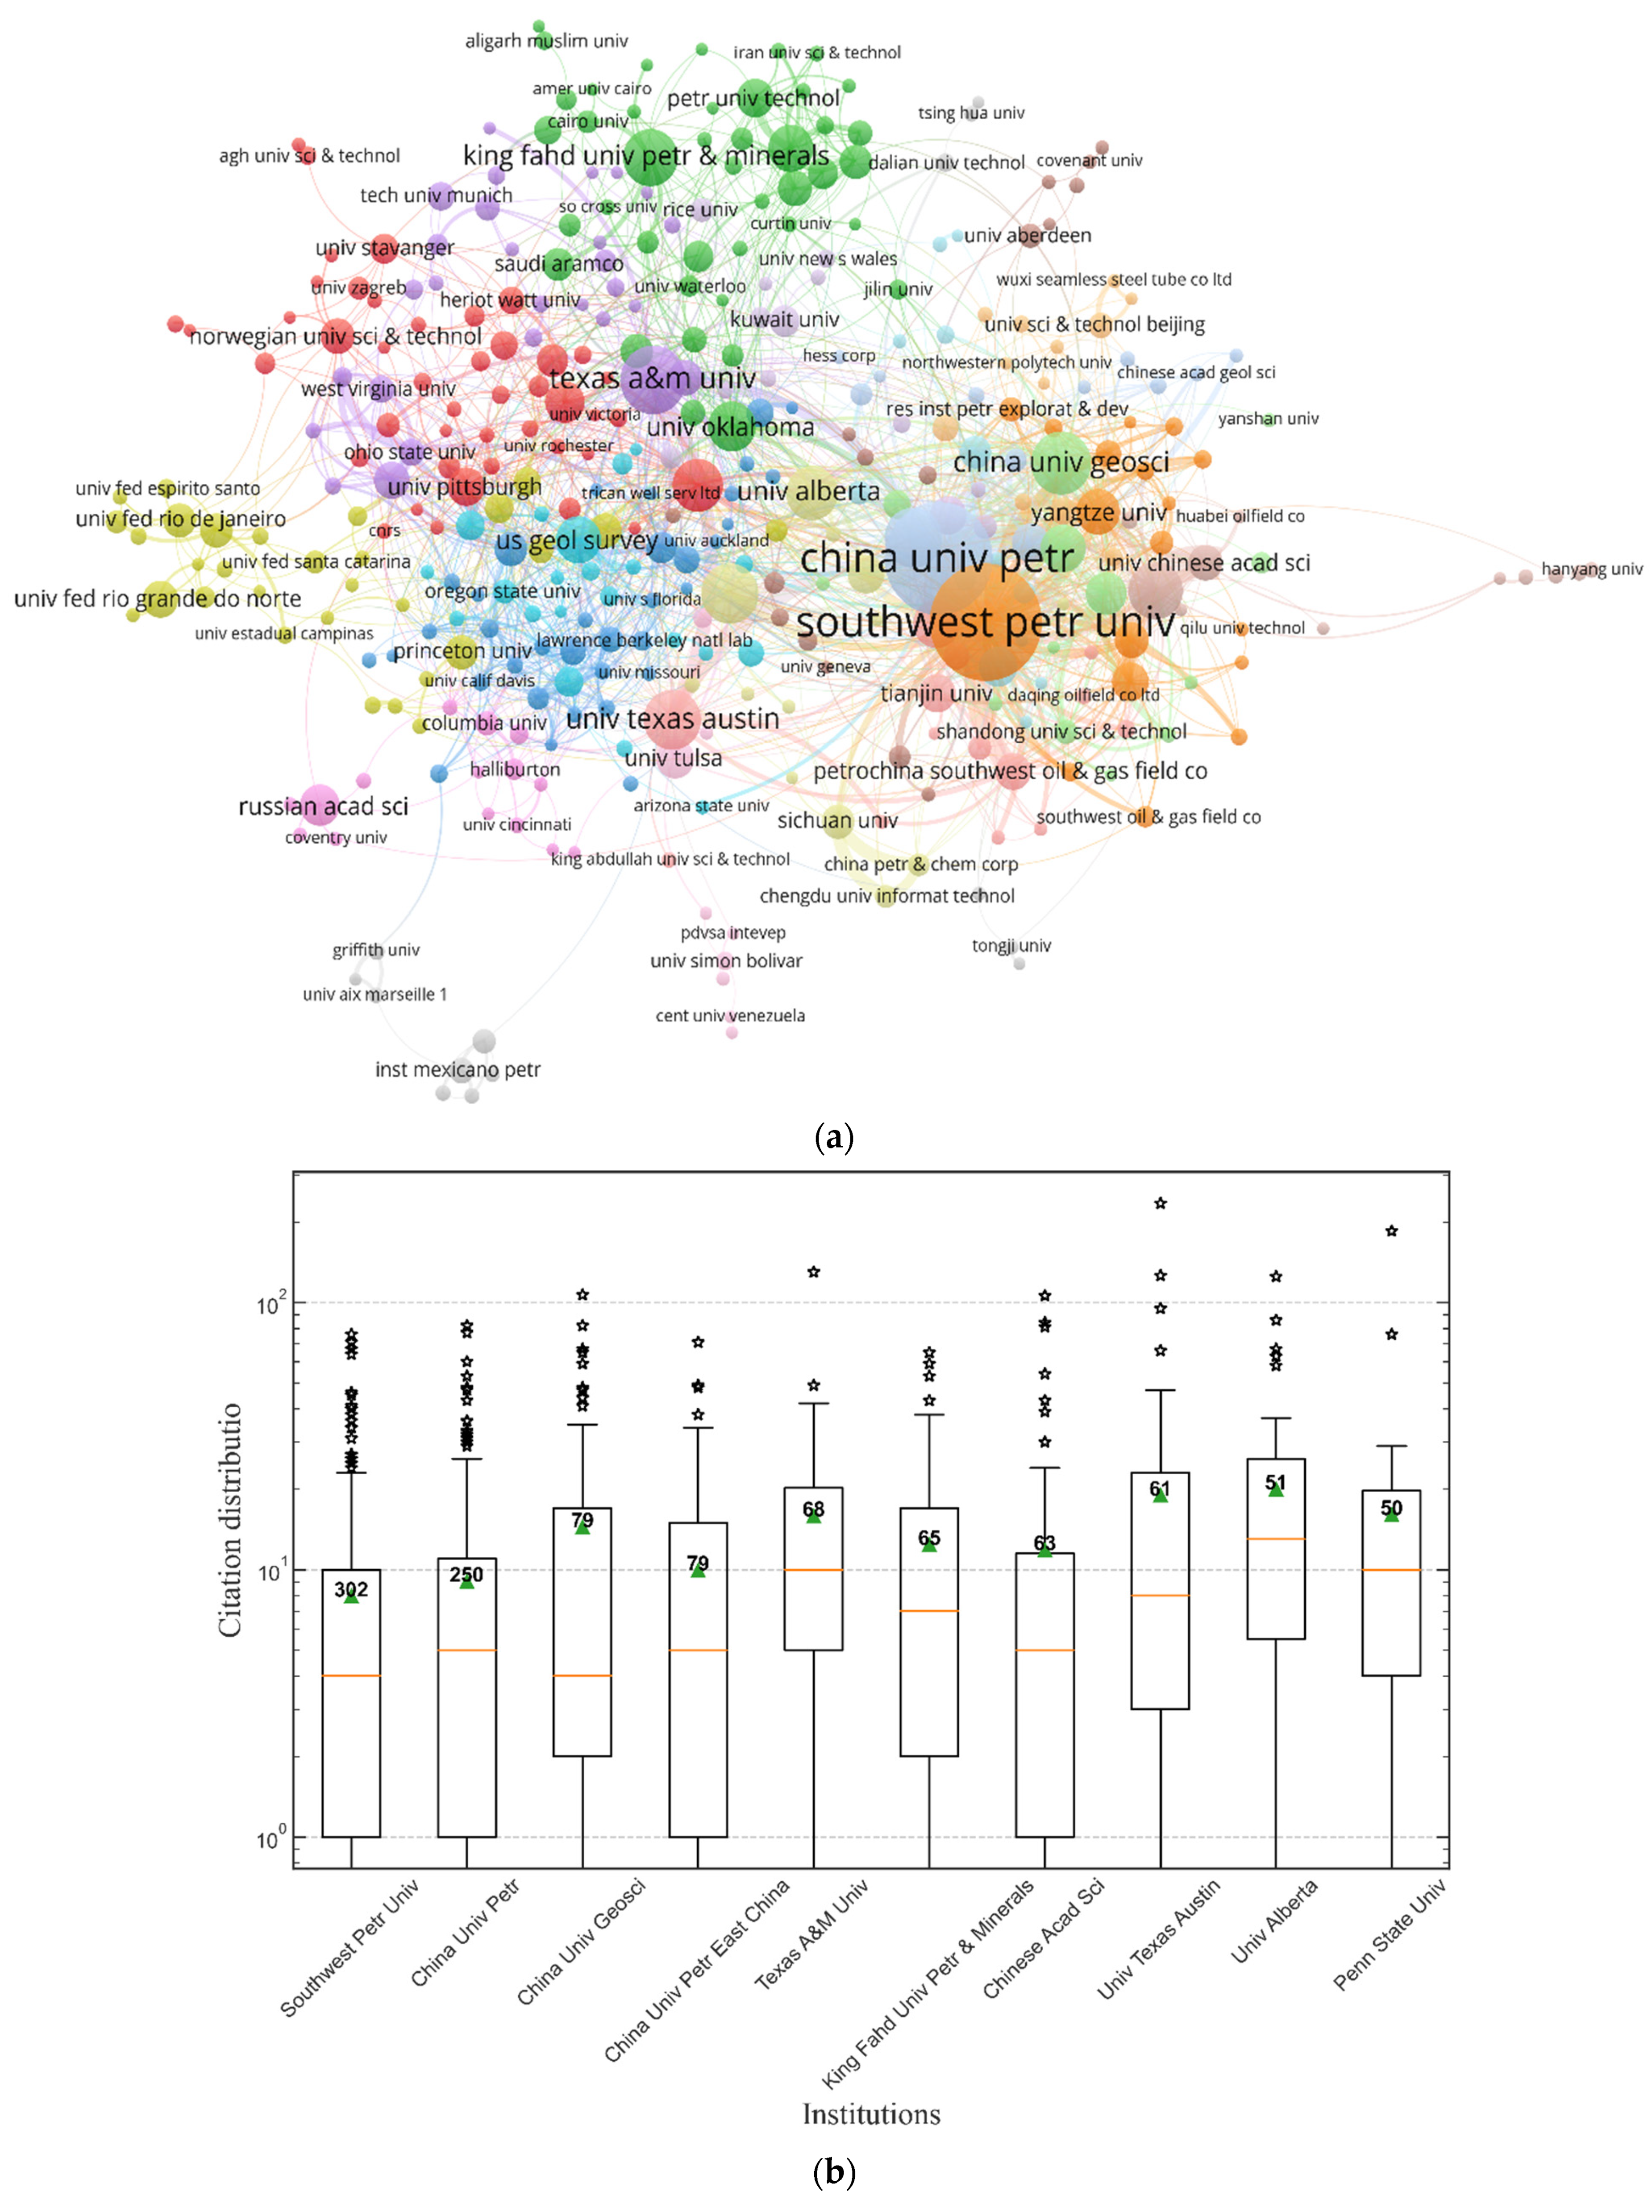
4.1.2. Cooperation Patterns of Institutions
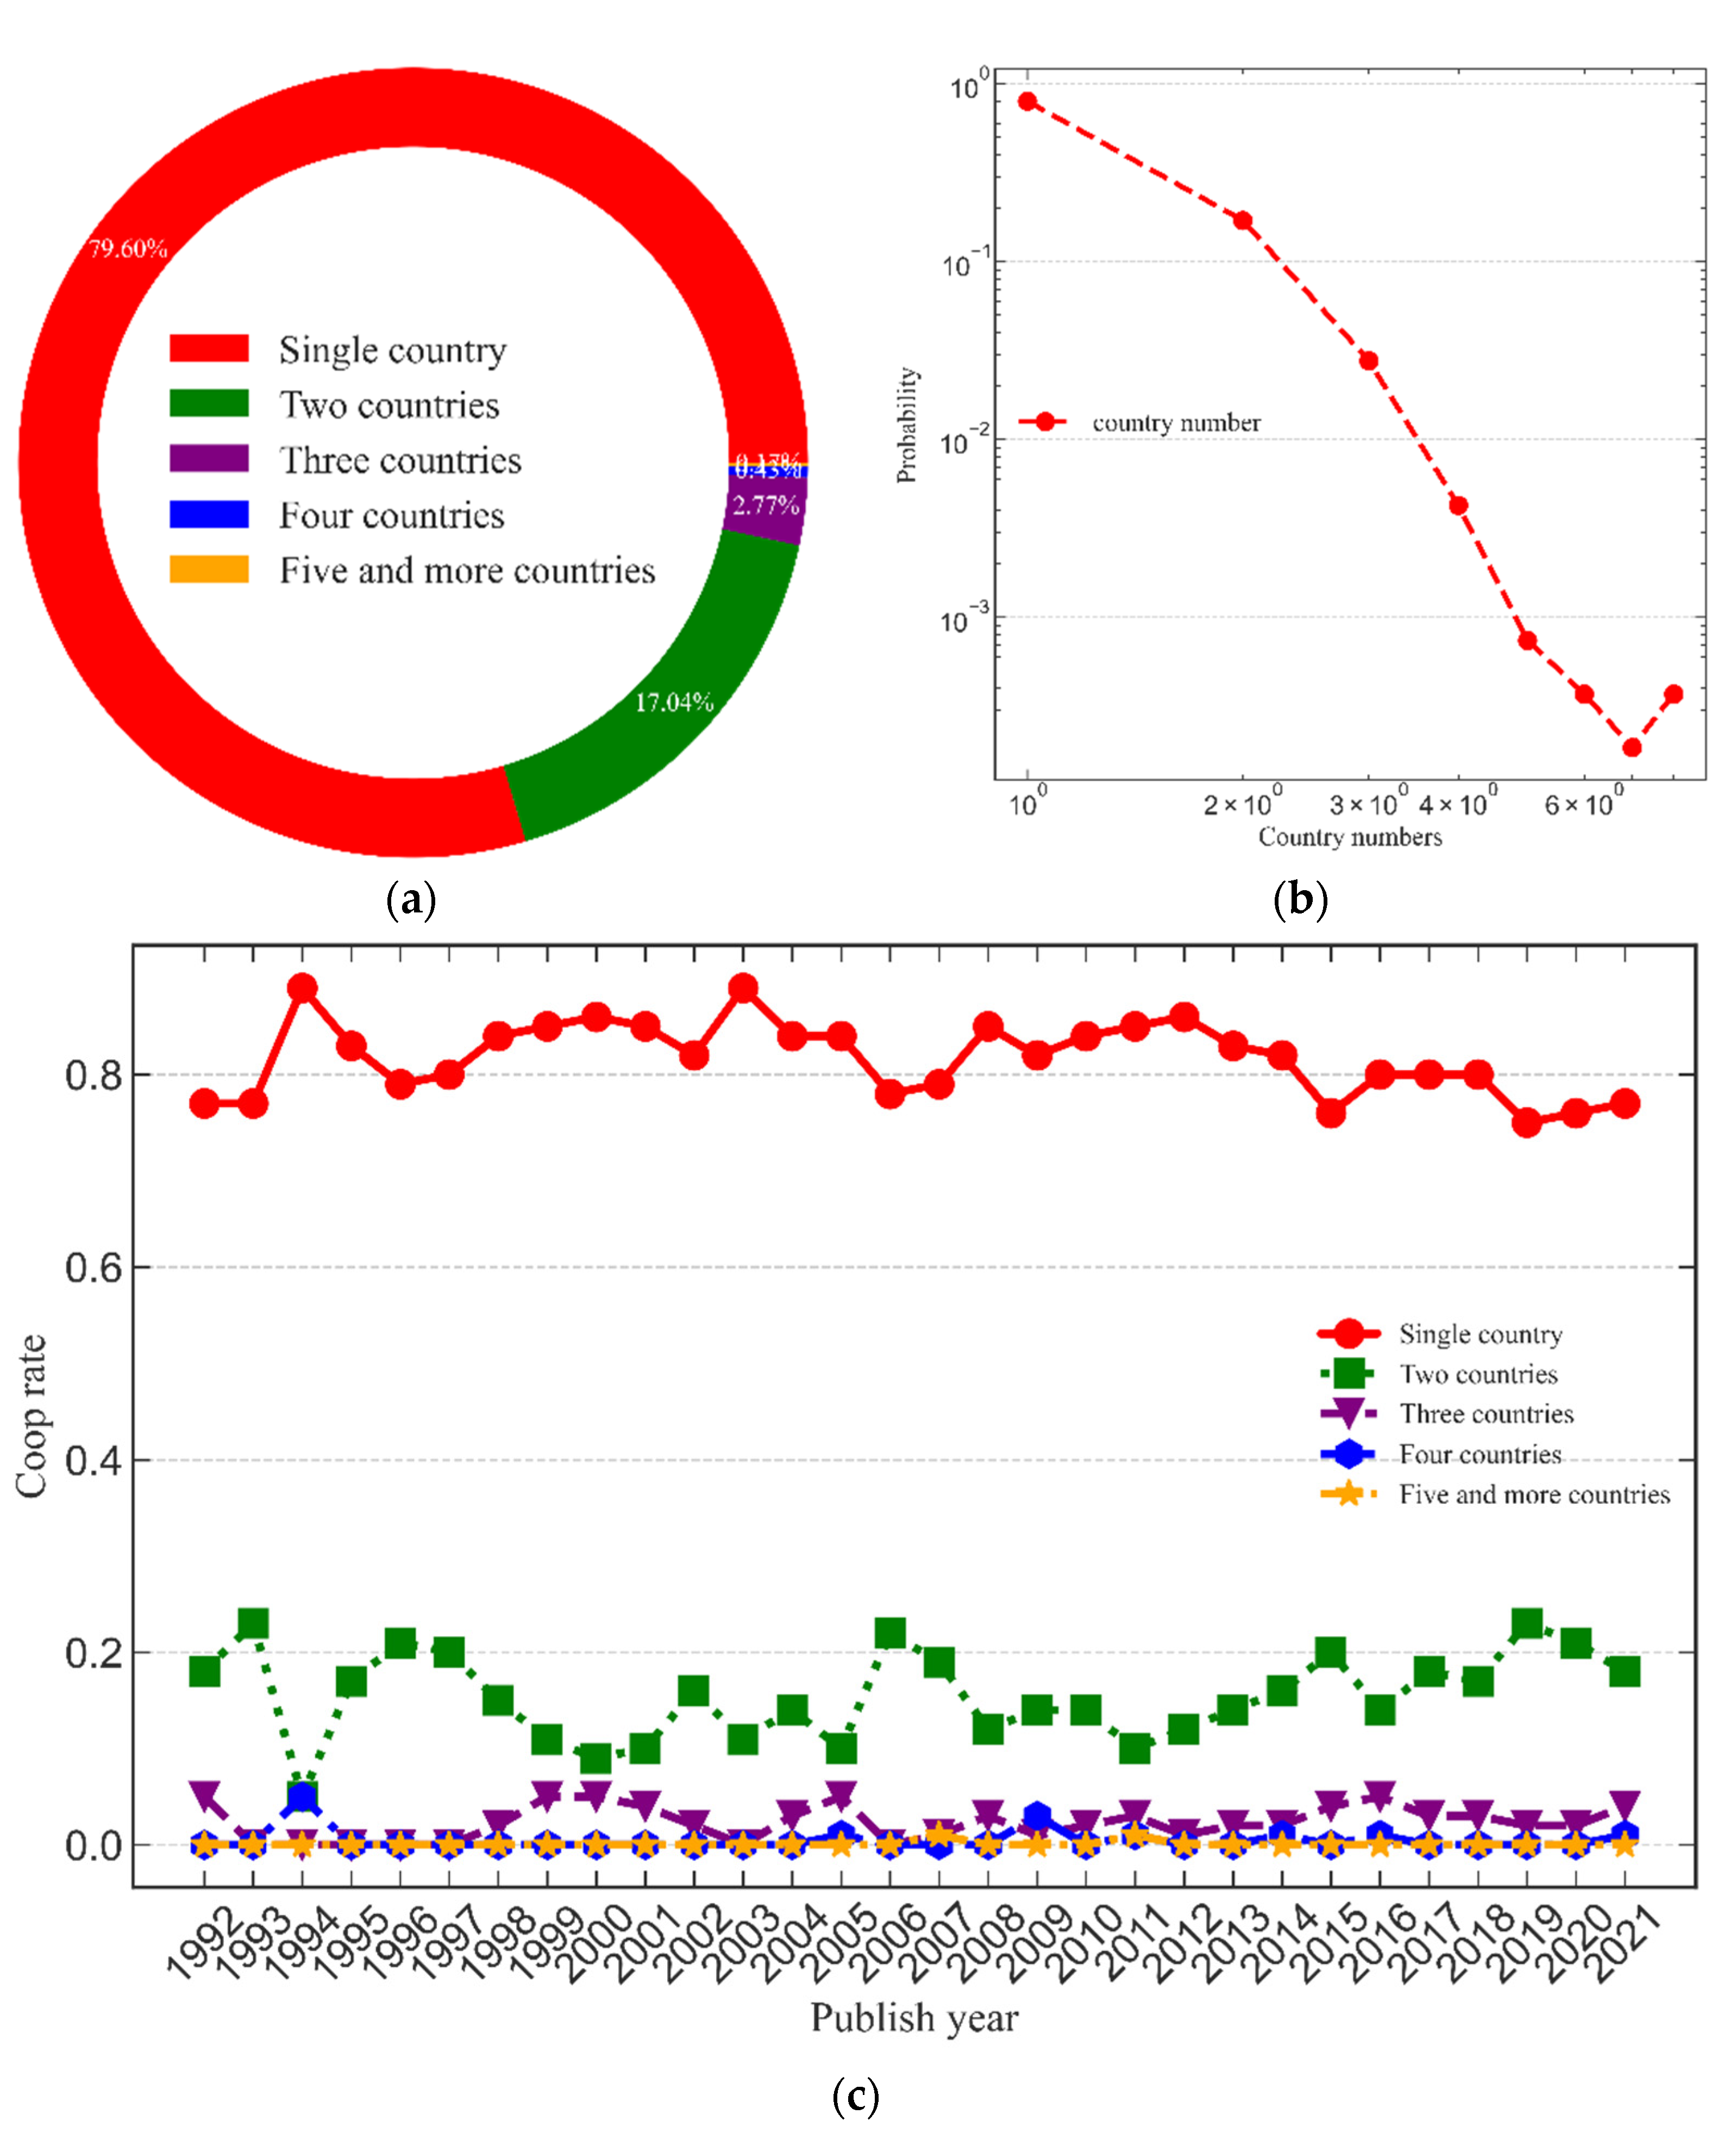
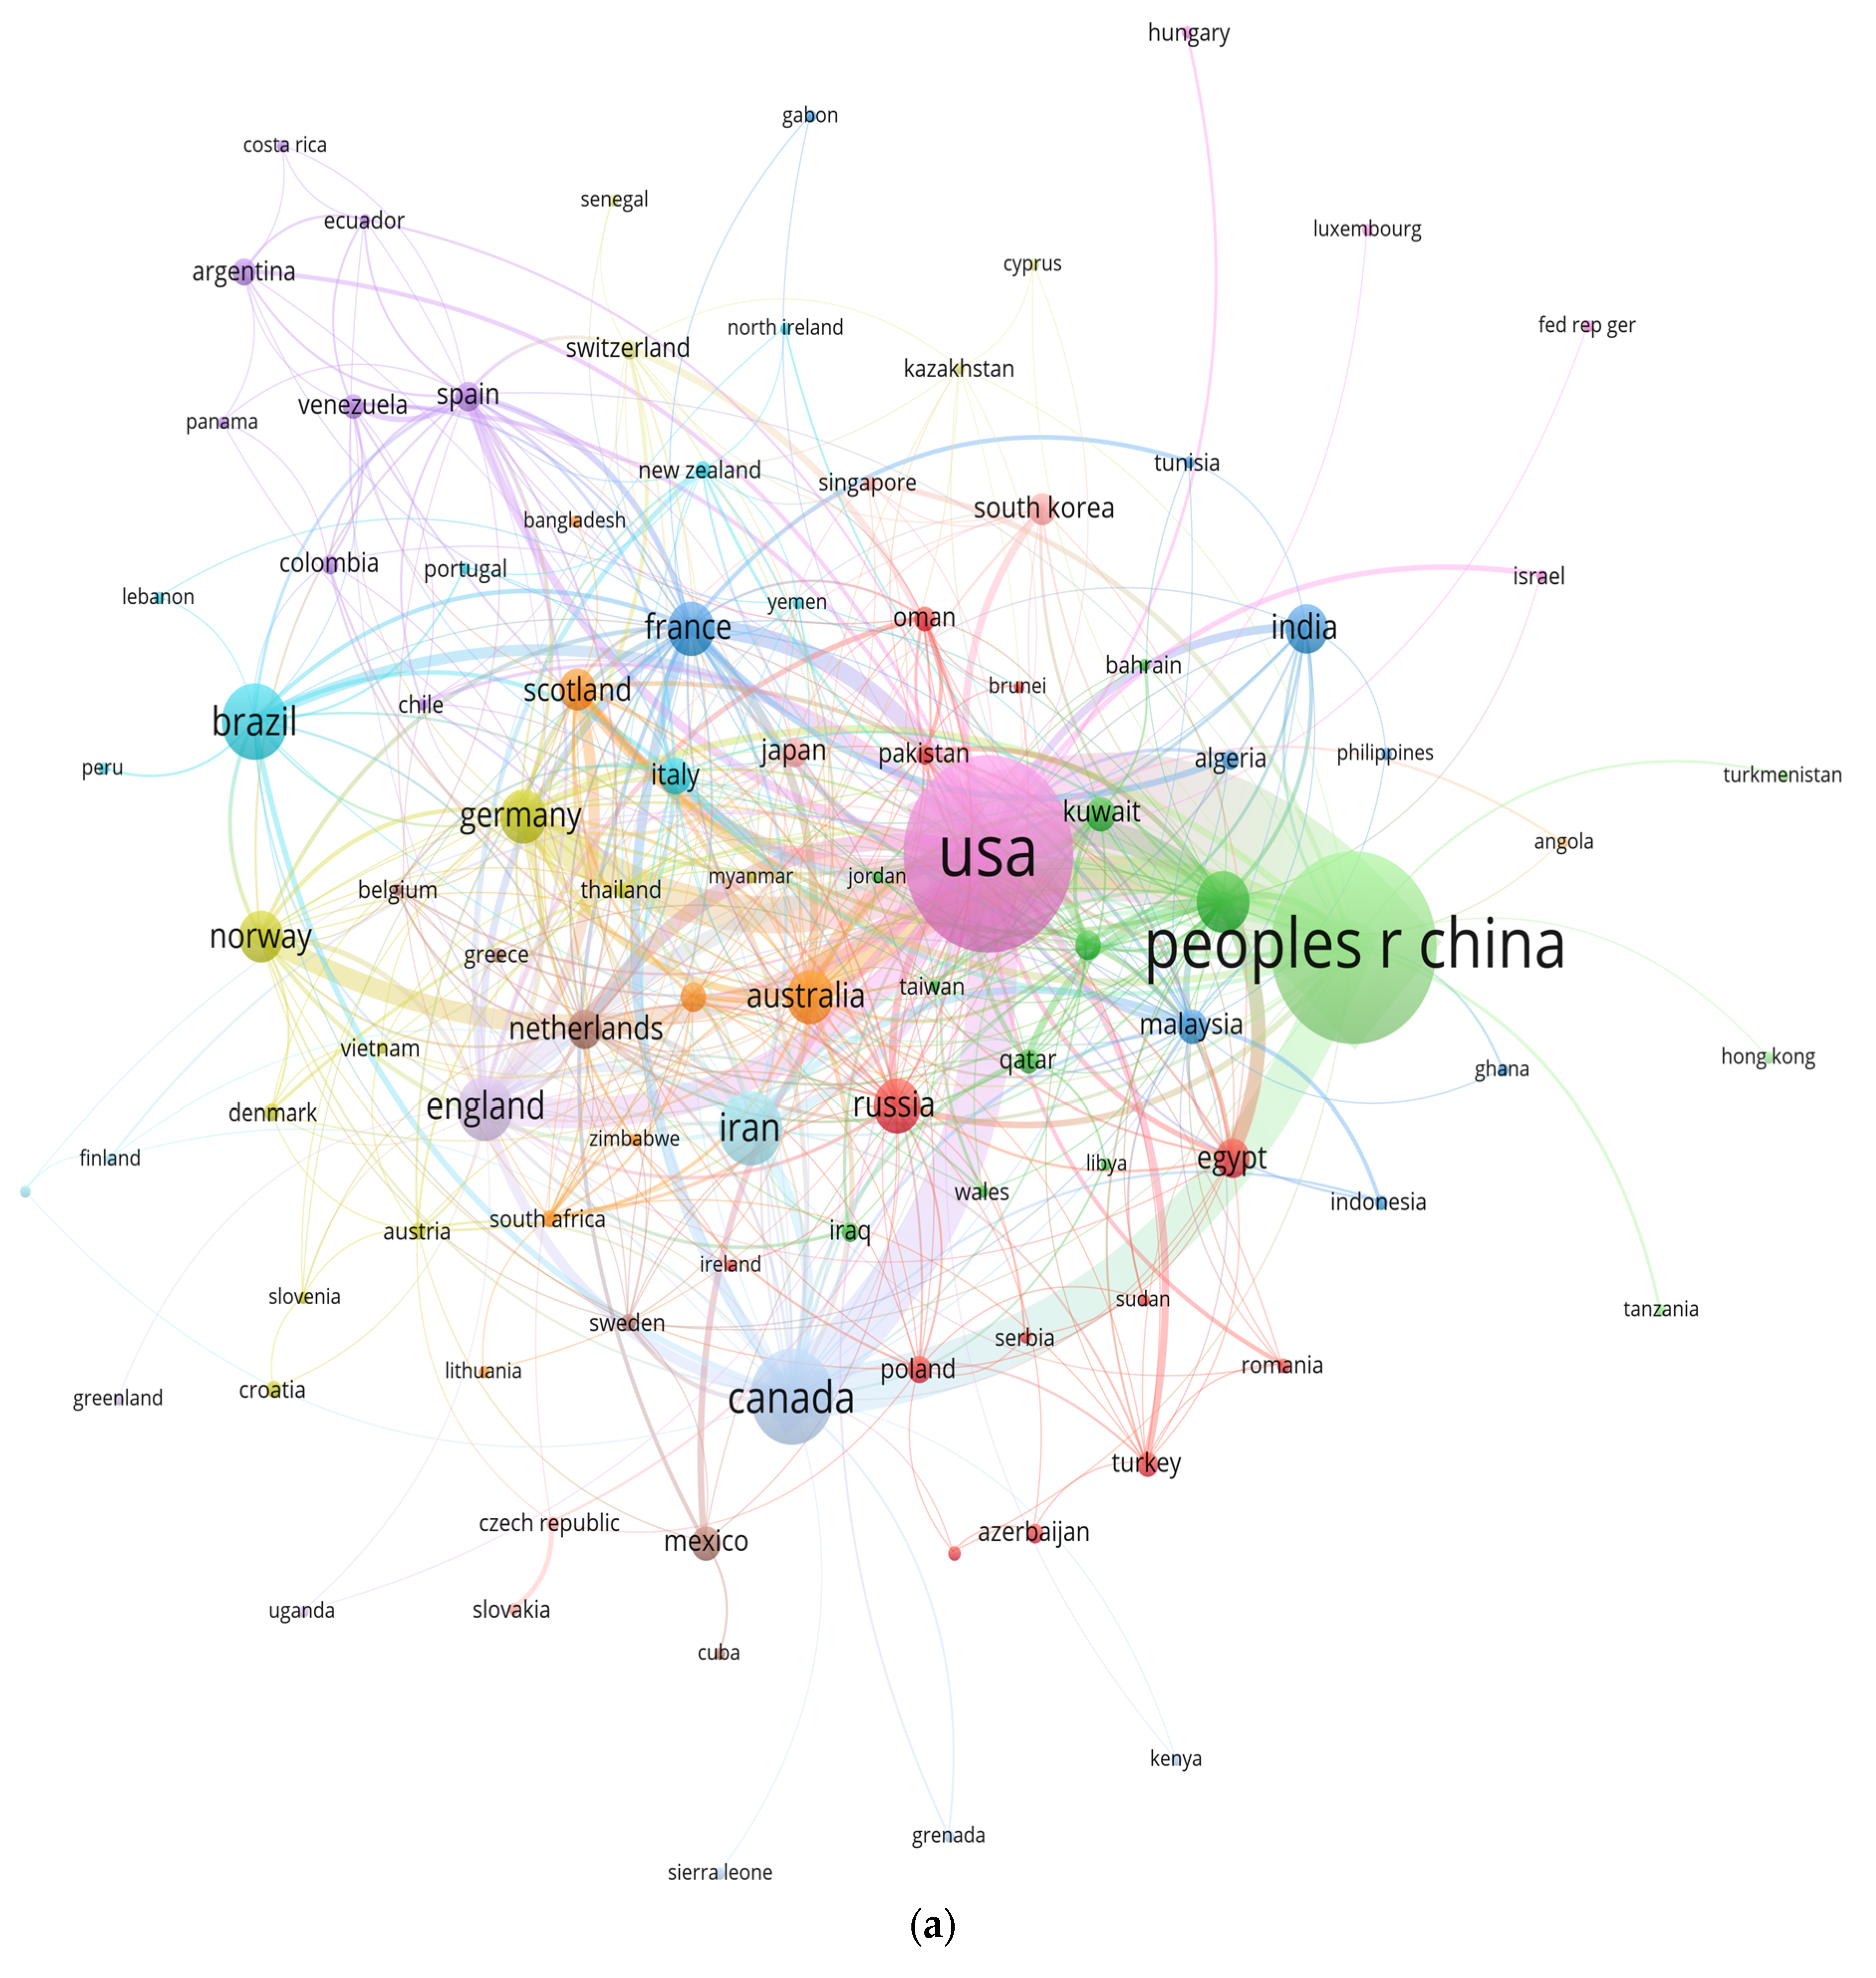
4.1.3. Cooperation Patterns of Countries/Regions
4.2. Leading Research Entities
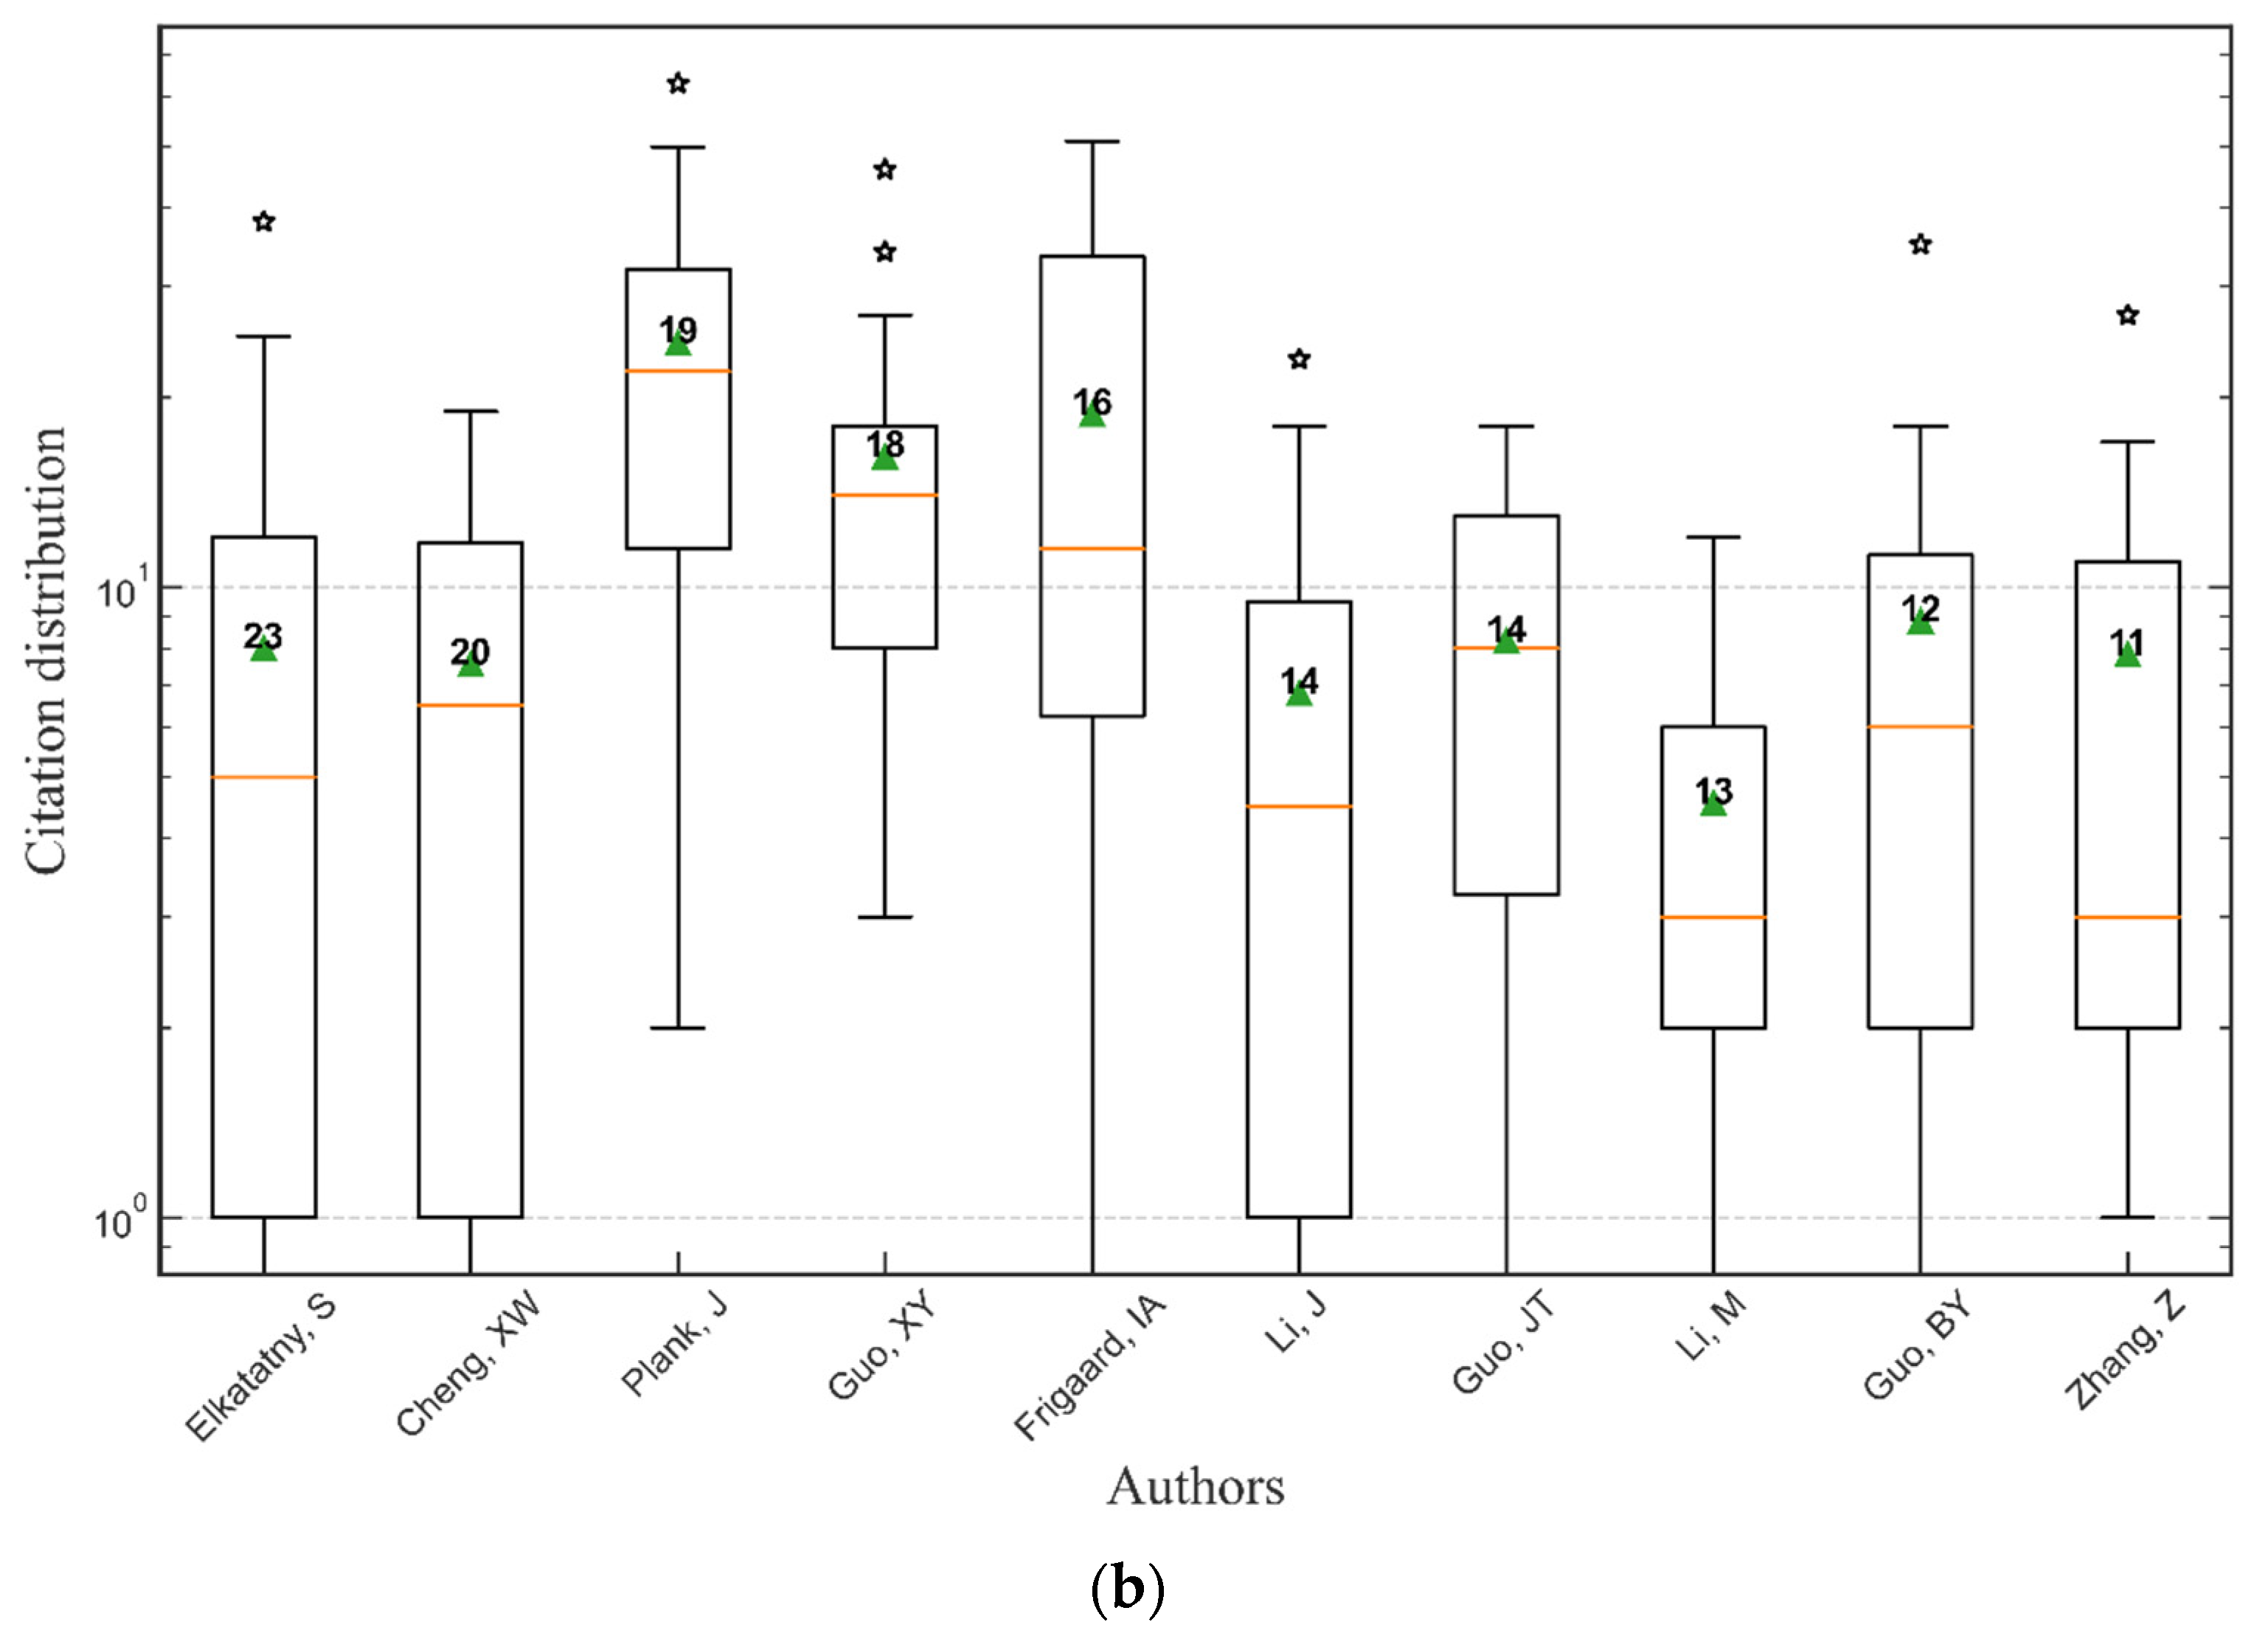
4.2.1. Leading Authors
4.2.2. Leading Institutions
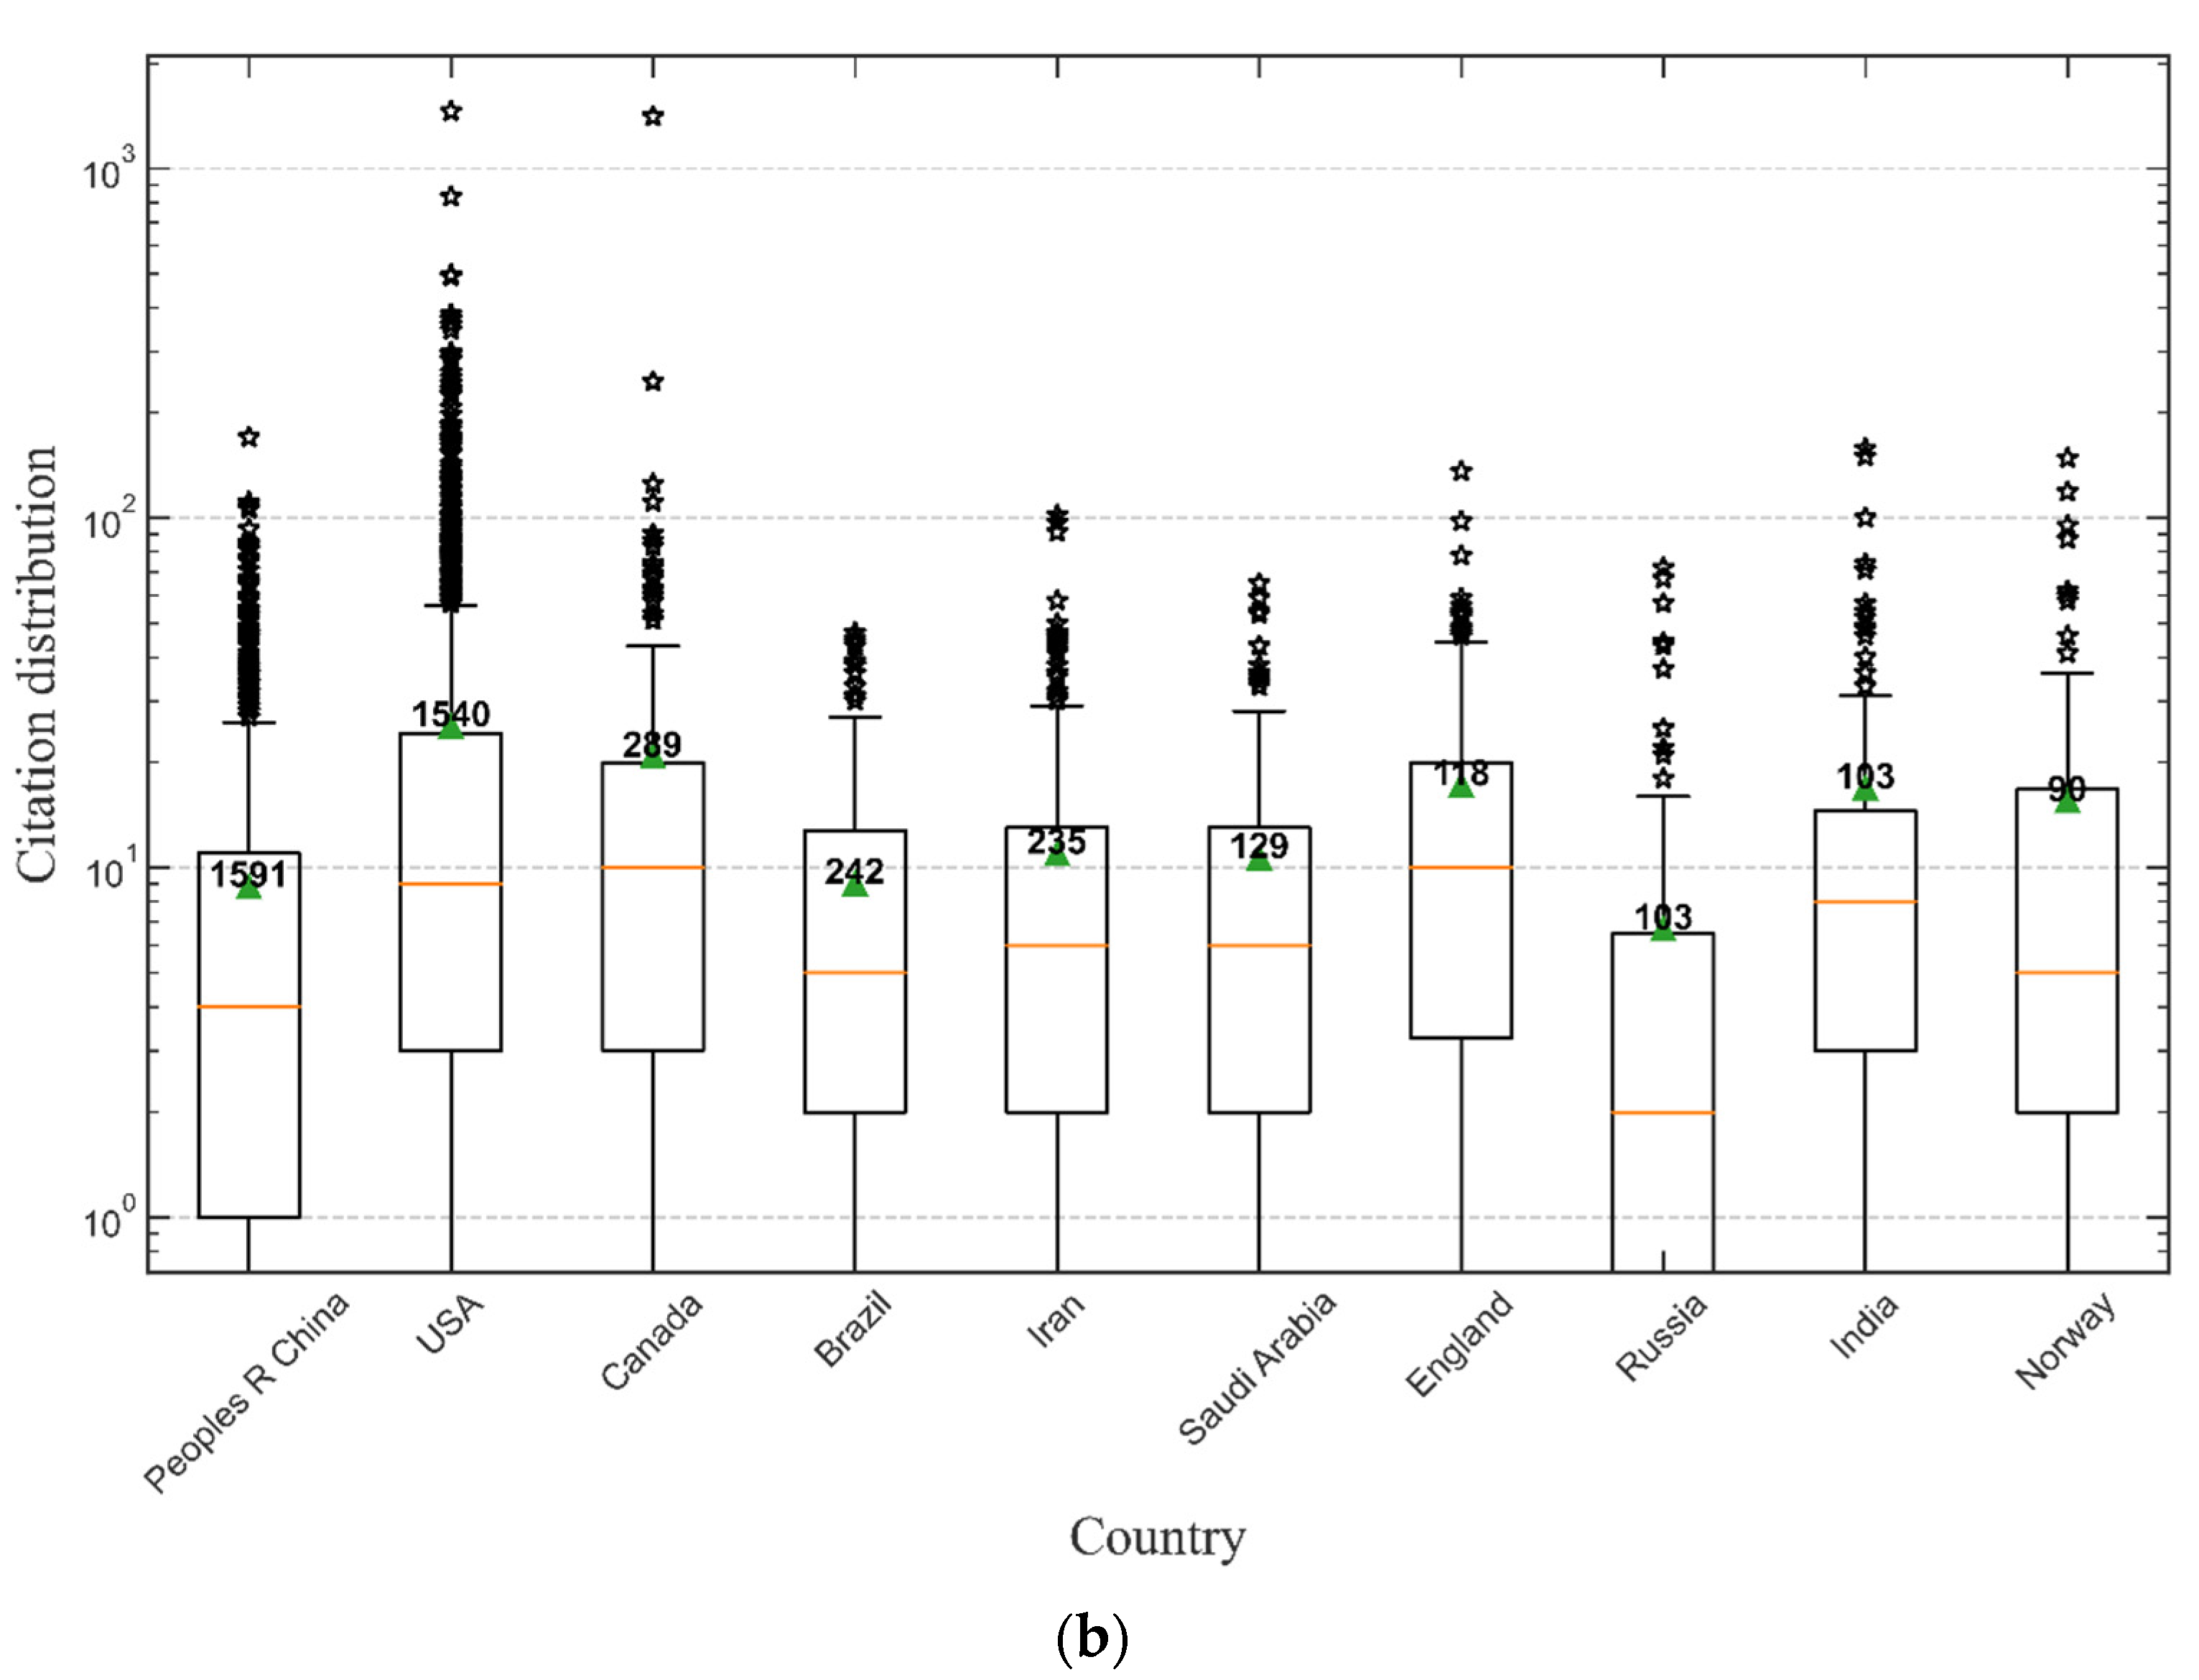
4.2.3. Leading Countries/Regions
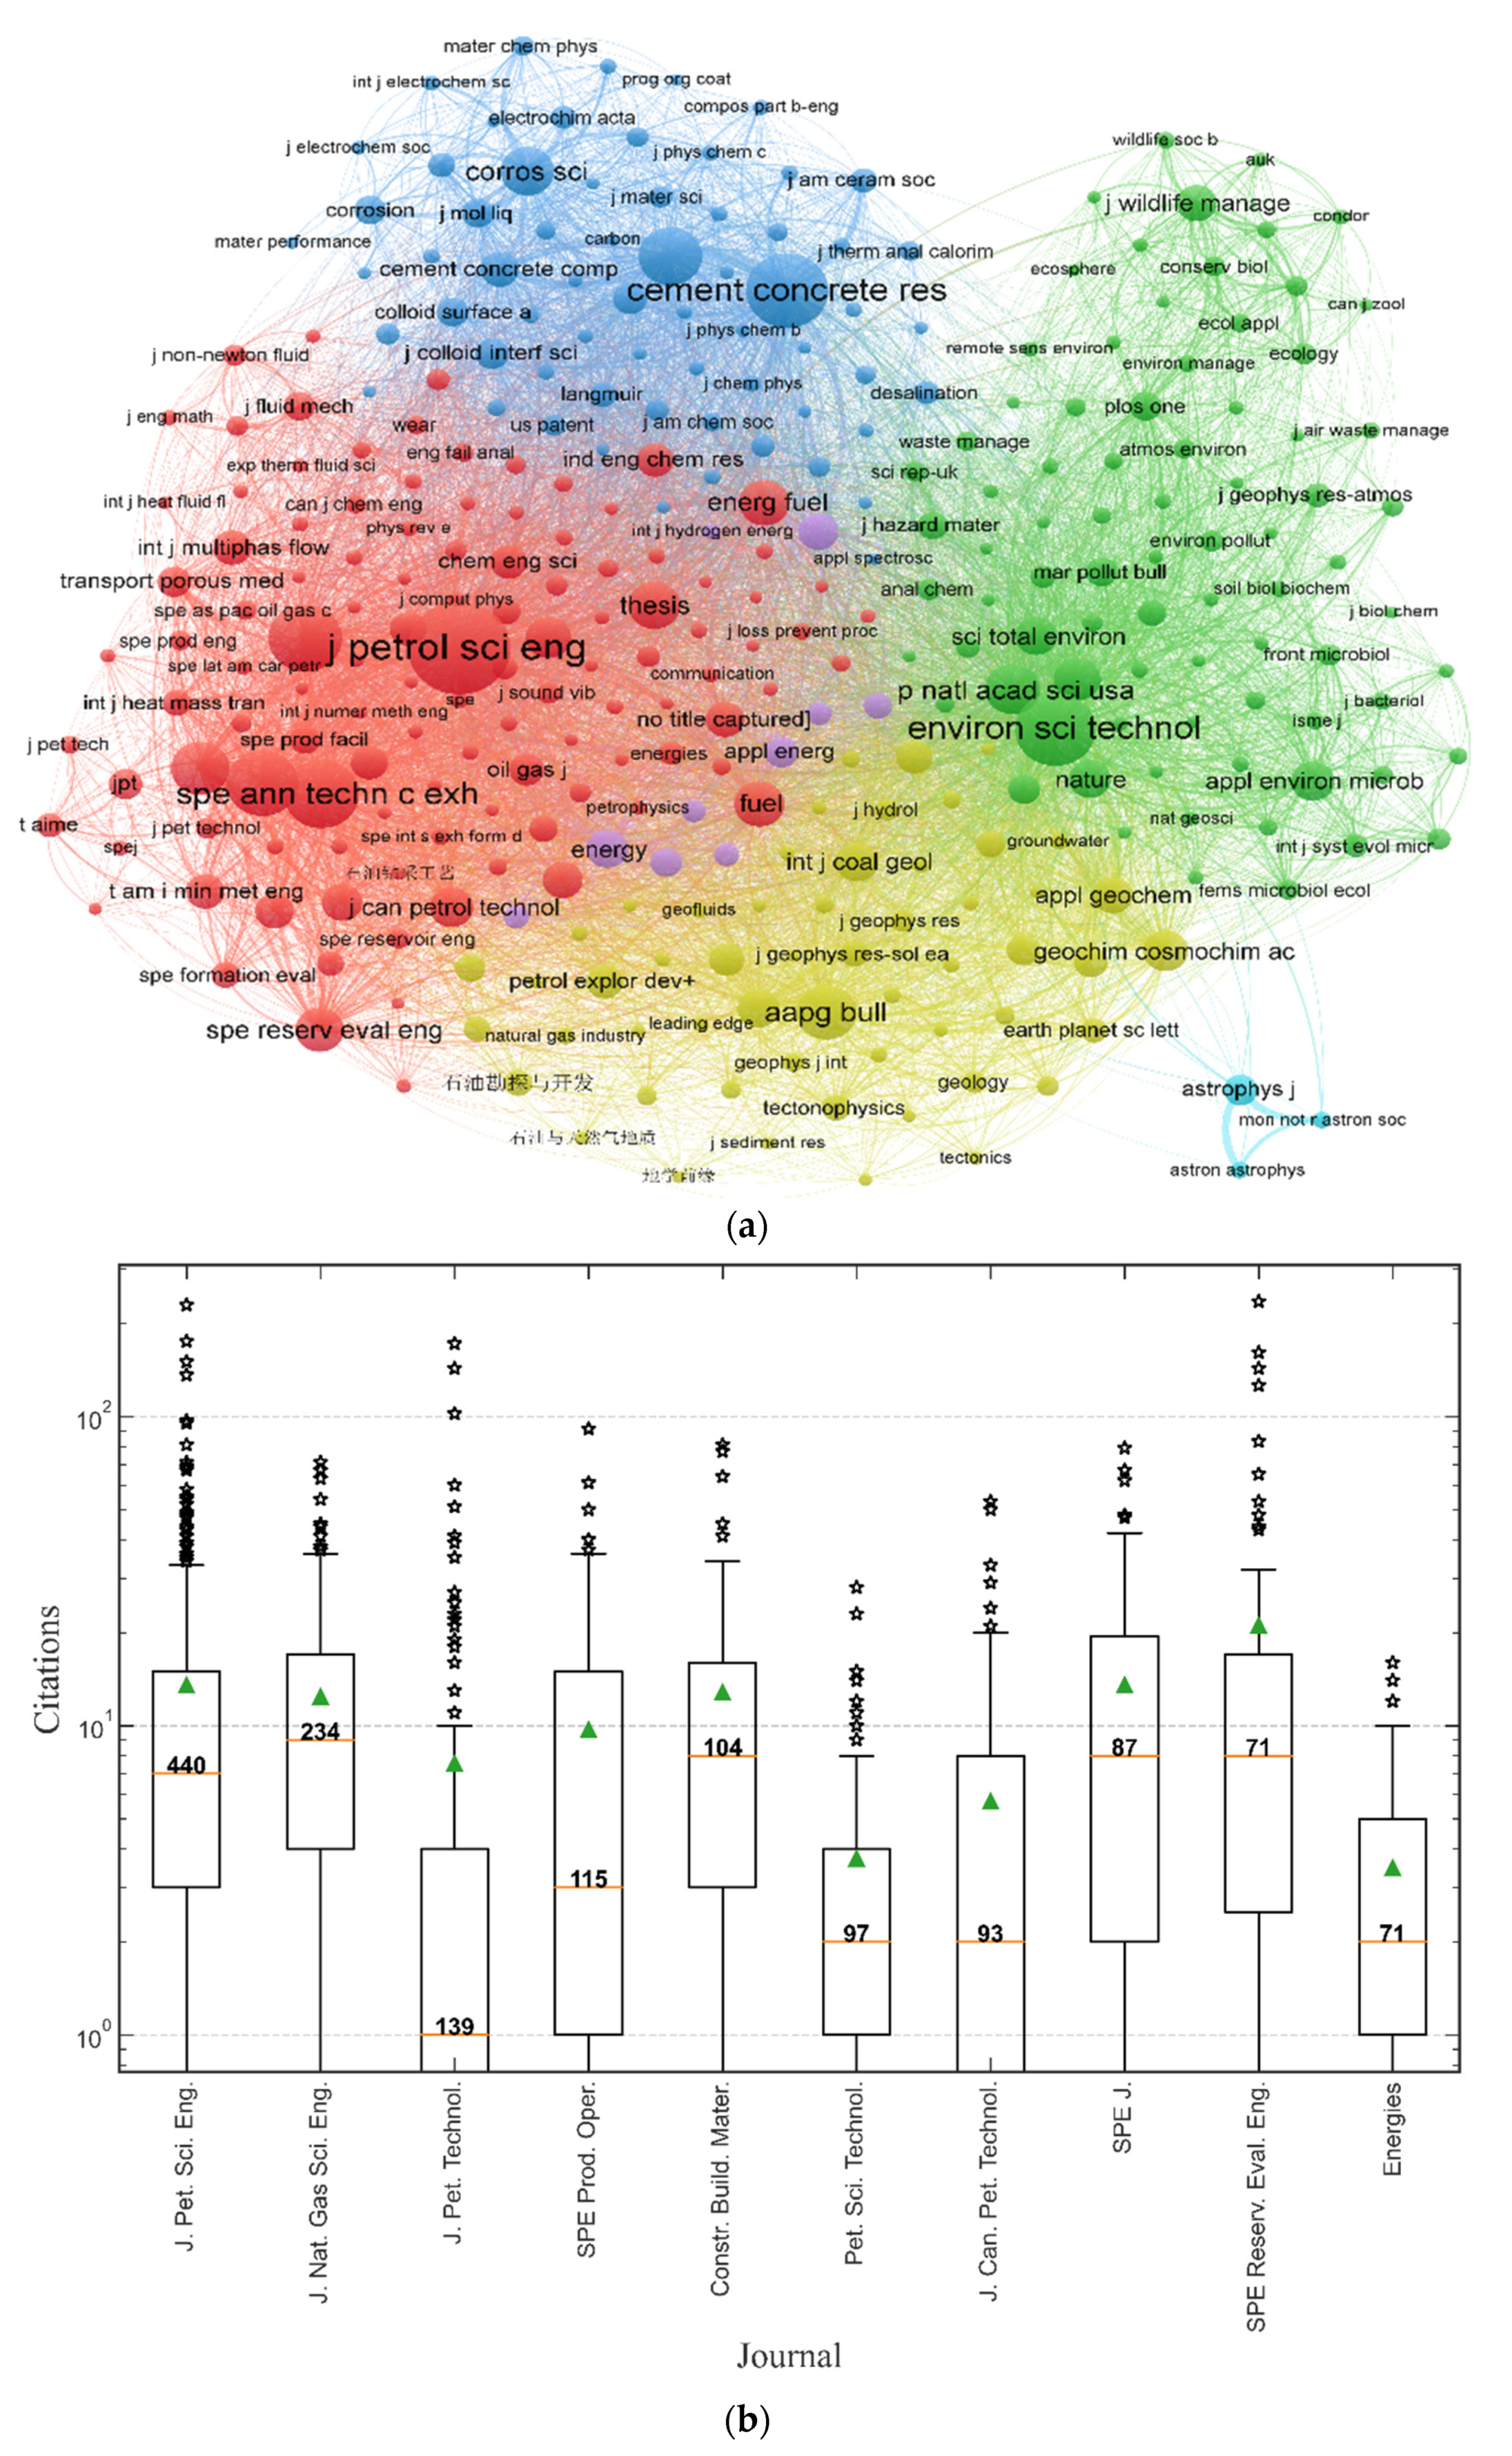
4.2.4. Leading Journals
5. Hotspots and Frontiers
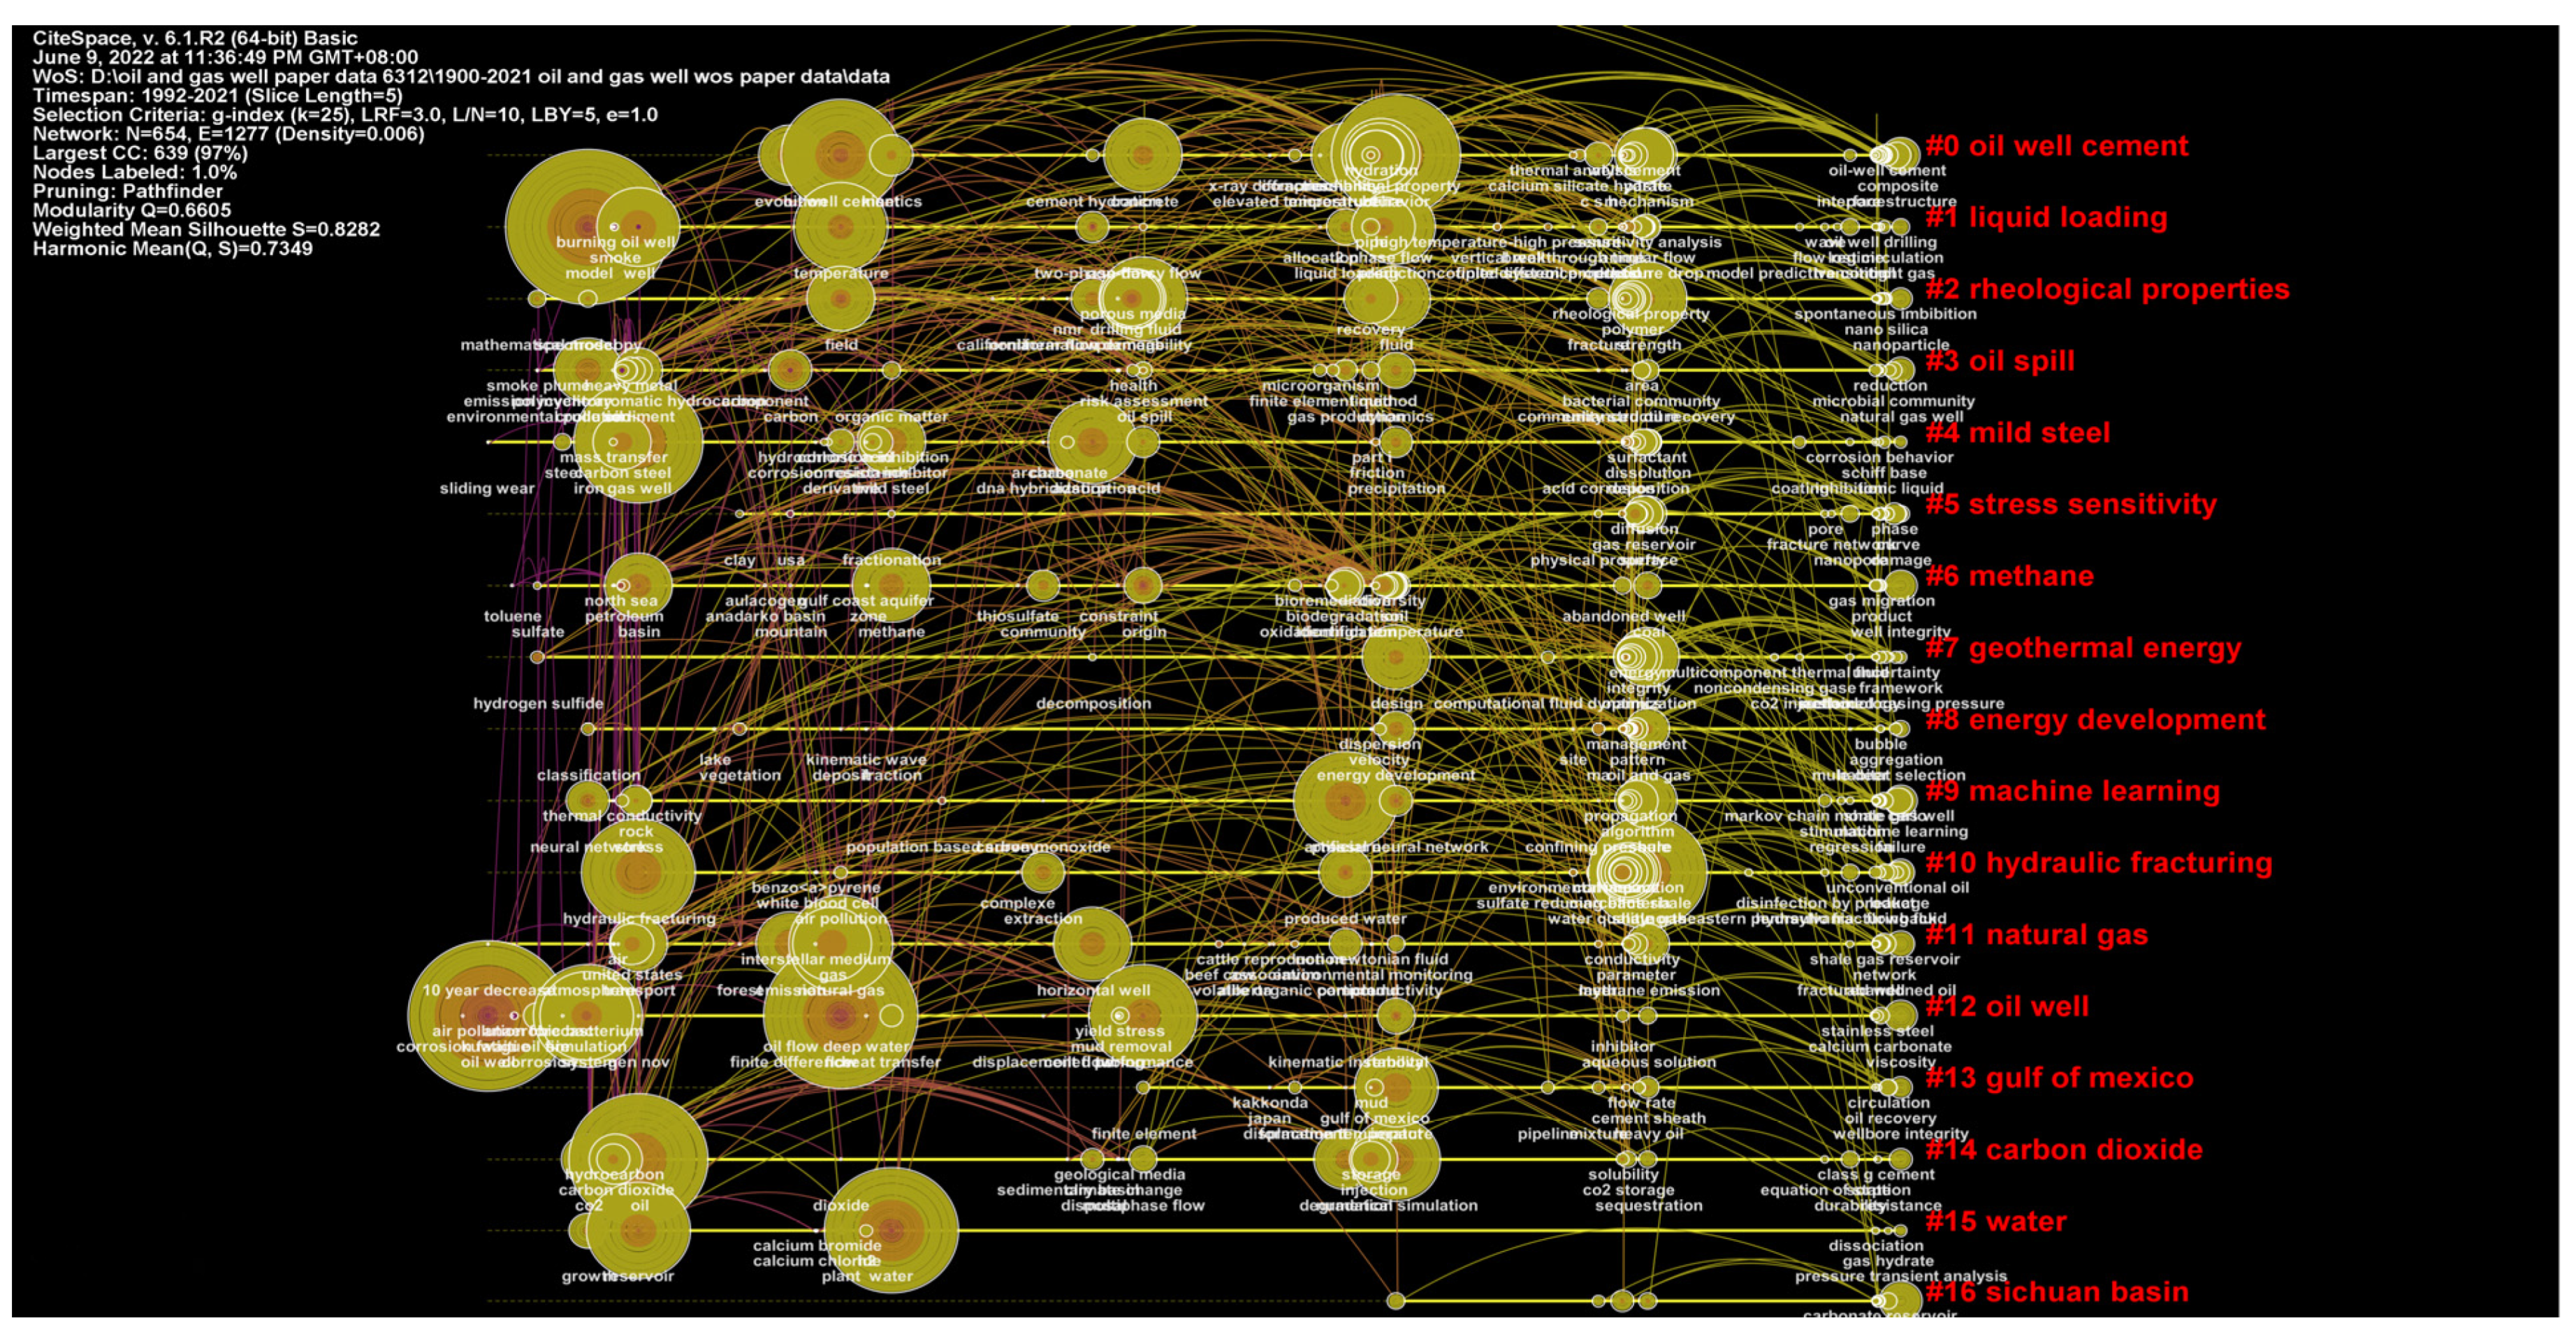
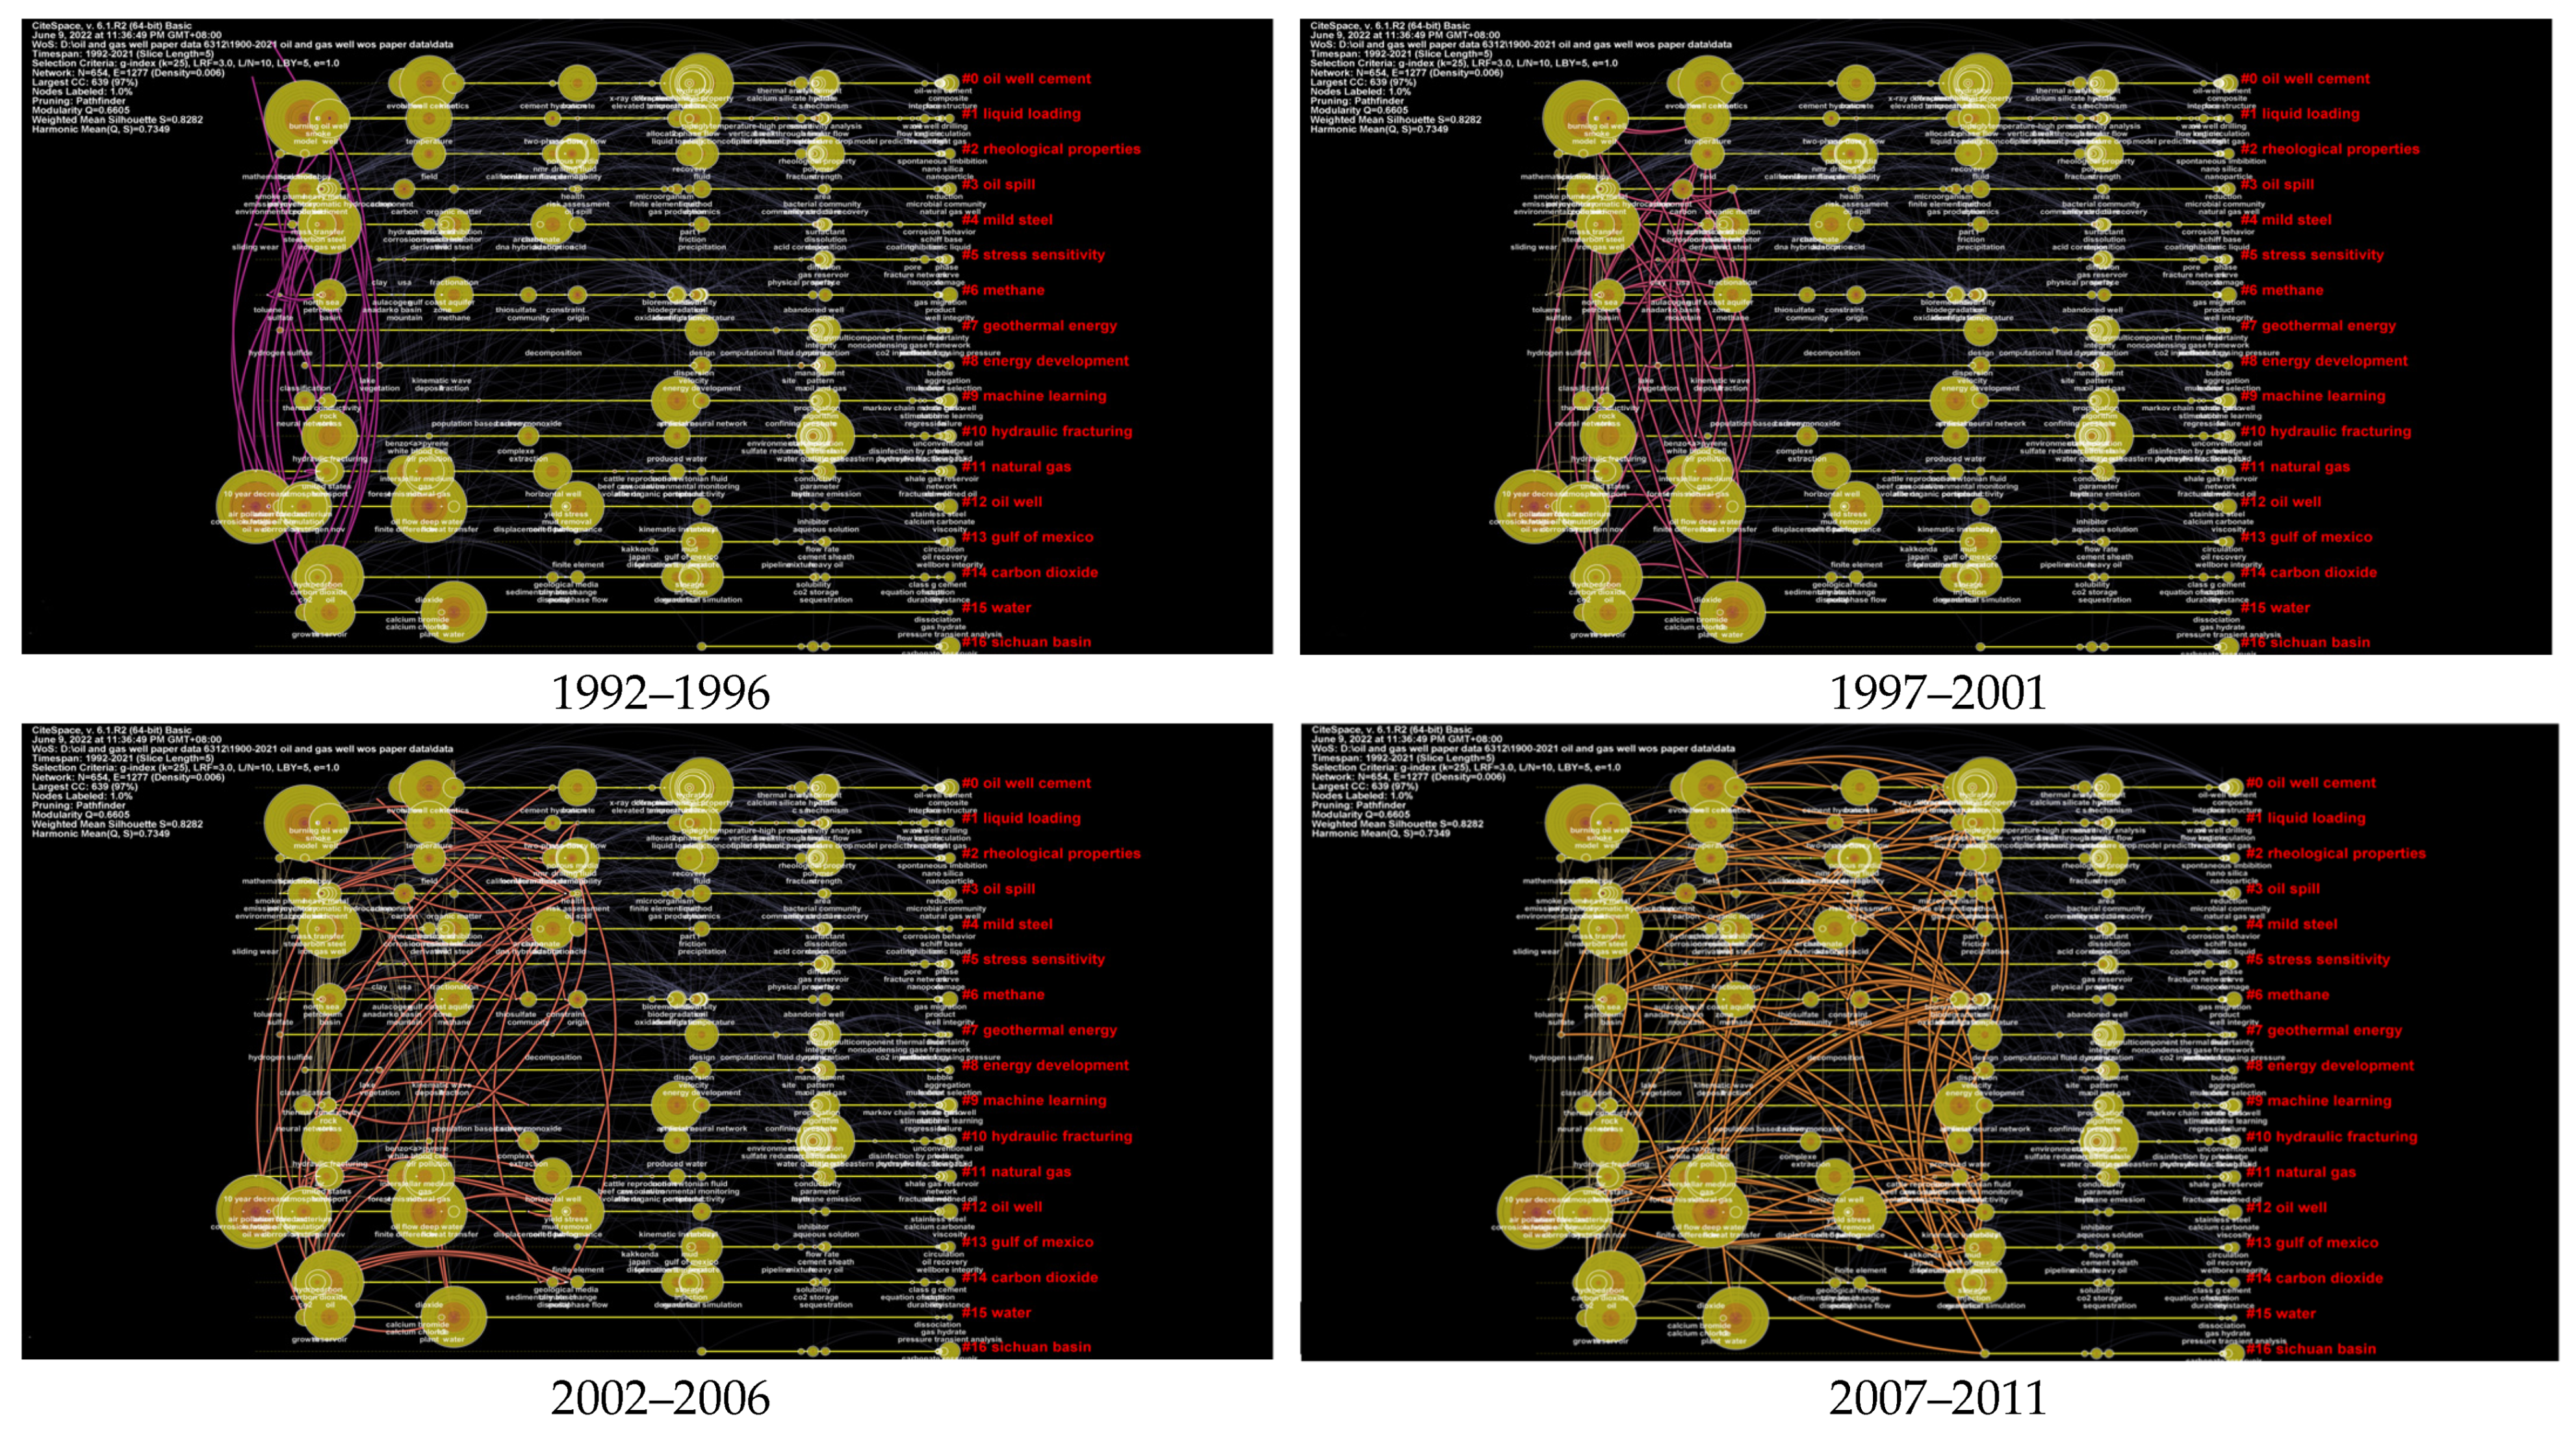
5.1. Hotspots
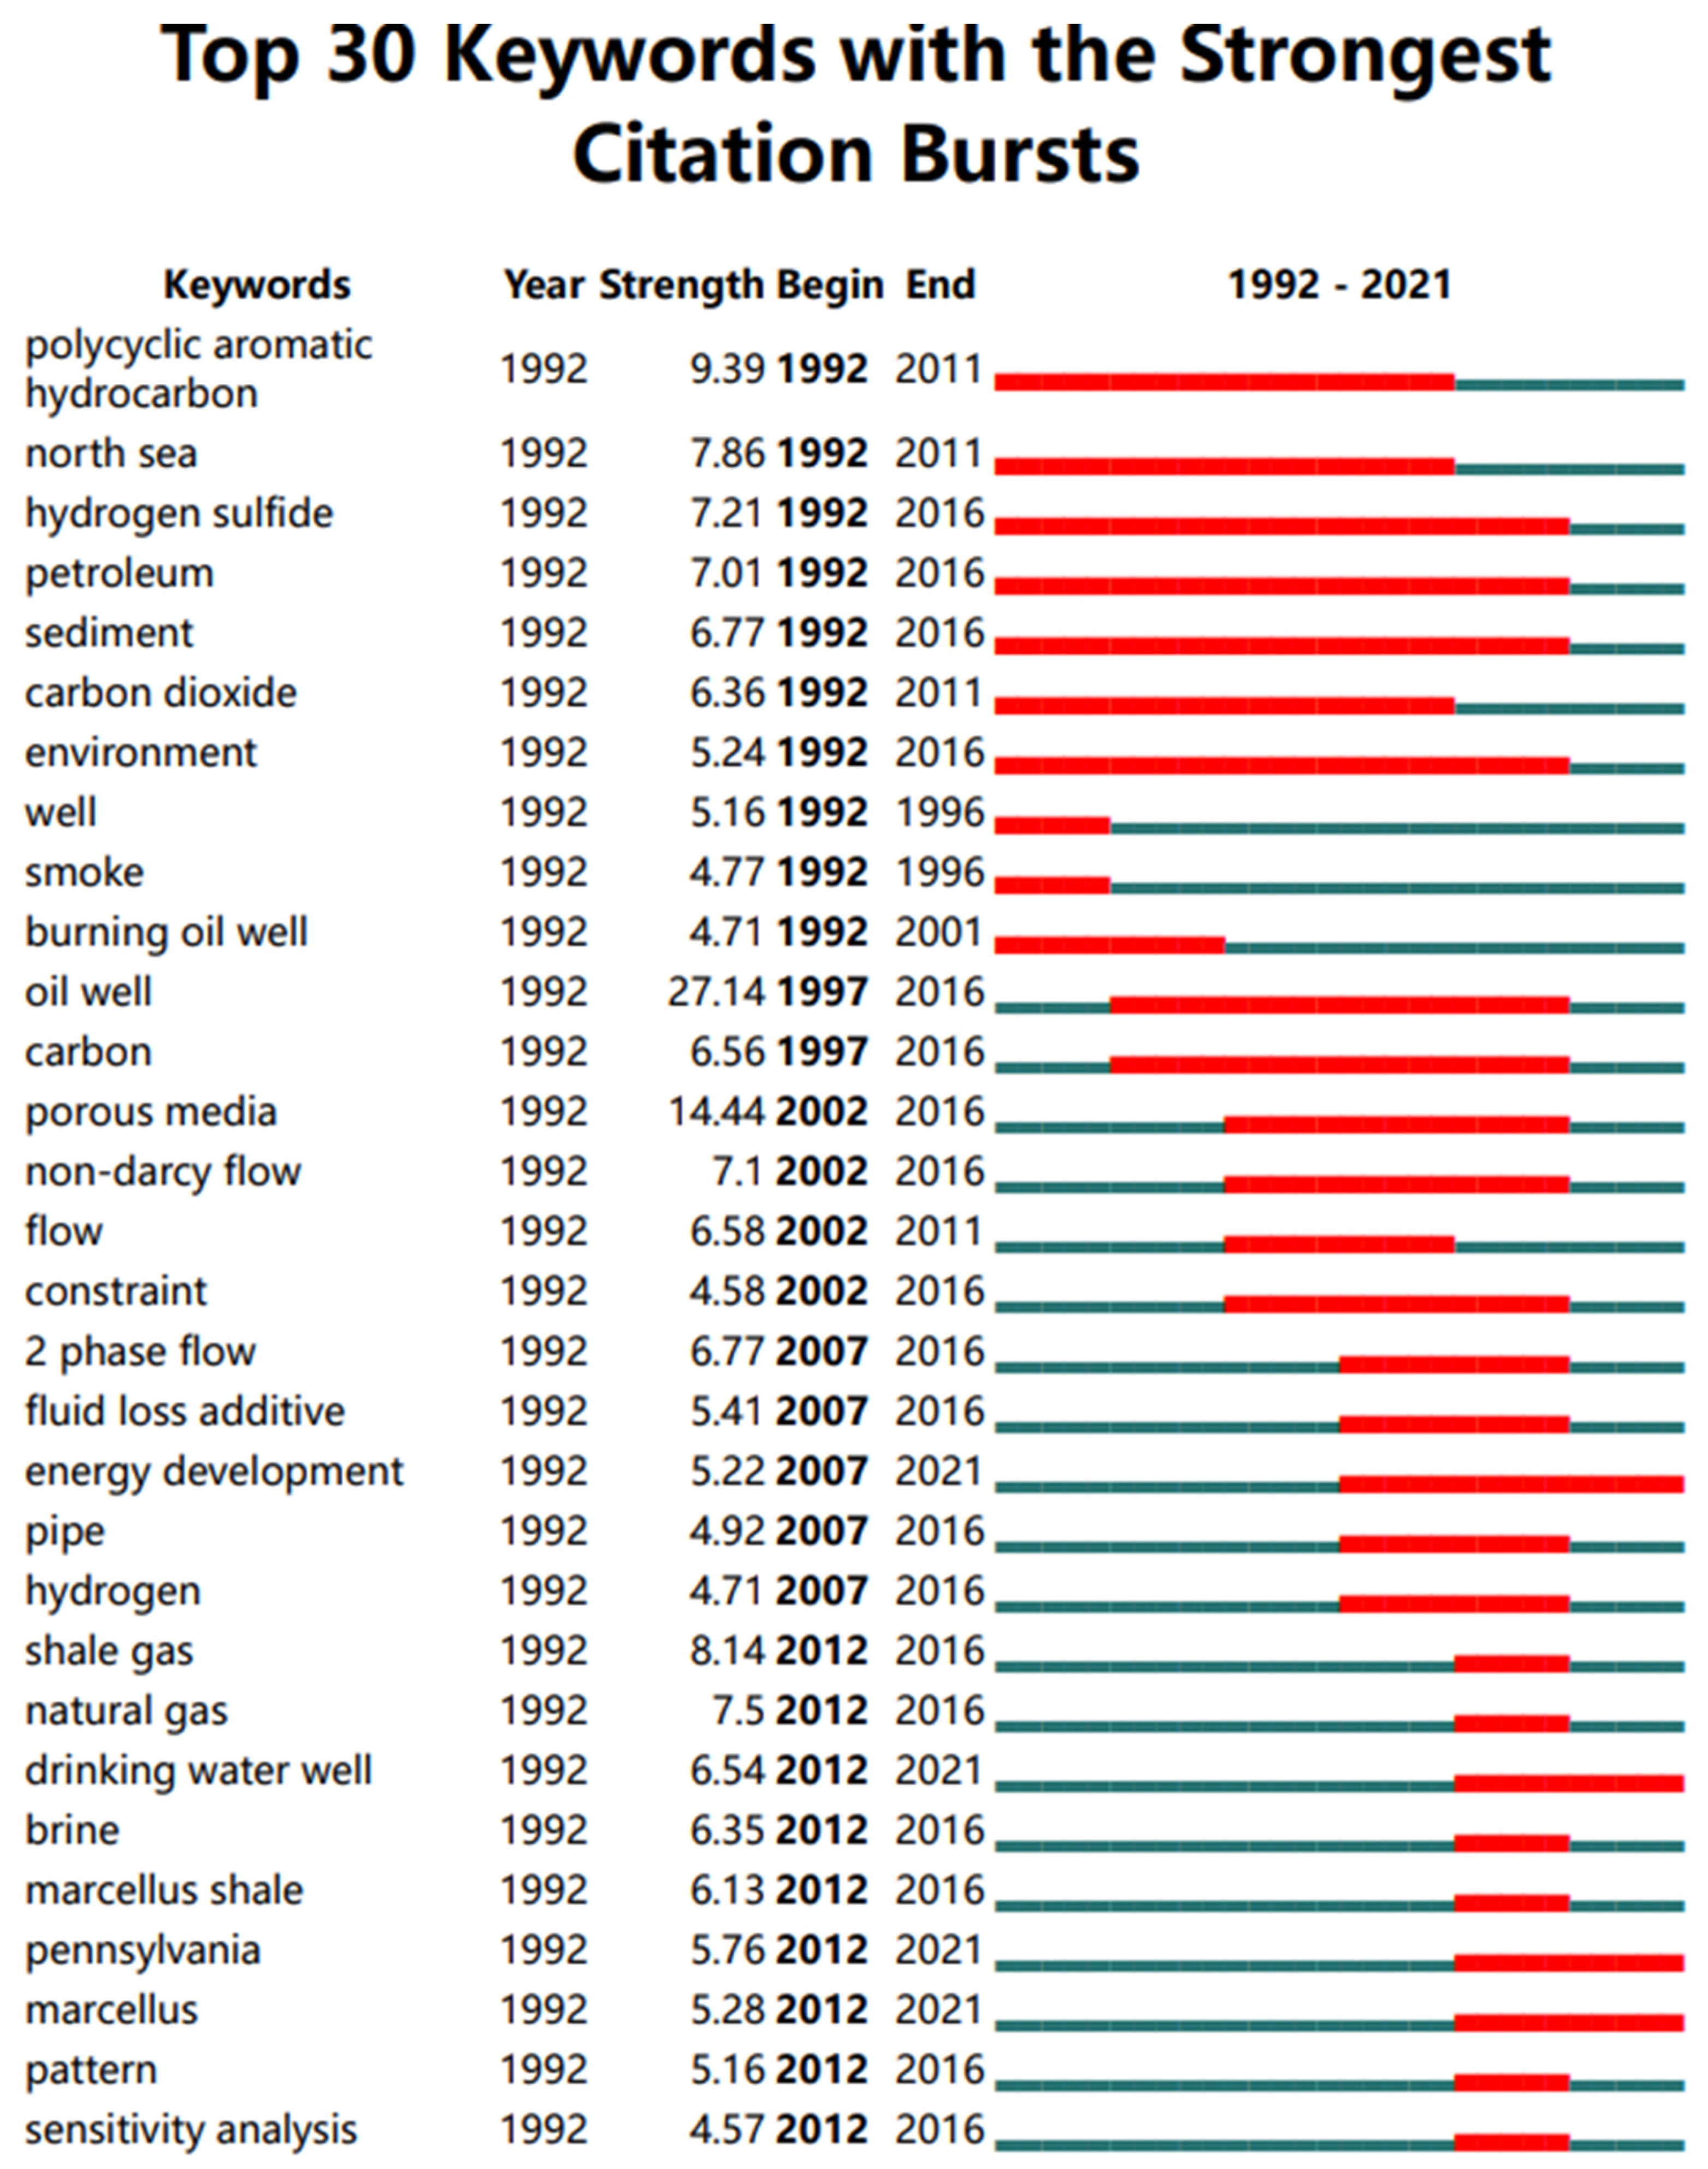
5.2. Frontiers
Author Contributions
Funding
Institutional Review Board Statement
Informed Consent Statement
Data Availability Statement
Acknowledgments
Conflicts of Interest
References
- American Chemical Society. National Historic Chemical Landmarks. Development of the Pennsylvania Oil Industry. Available online: http://www.acs.org/content/acs/en/education/whatischemistry/landmarks/pennsylvaniaoilindustry.html (accessed on 19 June 2022).
- A Brief History of Natural Gas. Available online: https://www.apga.org/apgamainsite/aboutus/facts/history-of-natural-gas (accessed on 19 June 2022).
- Knez, D.; Khalilidermani, M. A review of different aspects of off-earth drilling. Energies 2021, 14, 7351. [Google Scholar] [CrossRef]
- Osarogiagbon, A.U.; Khan, F.; Venkatesan, R.; Gillard, P. Review and analysis of supervised machine learning algorithms for hazardous events in drilling operations. Process. Saf. Environ. Protect. 2021, 147, 367–384. [Google Scholar] [CrossRef]
- Chen, W.; Elkatatny, S.; Murtaza, M.; Mahmoud, A.A. Recent Advances in Magnesia Blended Cement Studies for Geotechnical Well Construction-A Review. Front. Mater. 2021, 447, 754431. [Google Scholar] [CrossRef]
- Bai, M.; Sun, J.; Song, K.; Li, L.; Qiao, Z. Well completion and integrity evaluation for CO2 injection wells. Renew. Sust. Energ. Rev. 2015, 45, 556–564. [Google Scholar] [CrossRef]
- Bai, M.; Shen, A.; Meng, L.; Zhu, J.; Song, K. Well completion issues for underground gas storage in oil and gas reservoirs in China. J. Pet. Sci. Eng. 2018, 171, 584–591. [Google Scholar] [CrossRef]
- Teodoriu, C.; Bello, O. A review of cement testing apparatus and methods under CO2 environment and their impact on well integrity prediction–Where do we stand? J. Pet. Sci. Eng. 2020, 187, 106736. [Google Scholar] [CrossRef]
- Bahrami, N.; Pena, D.; Lusted, I. Well test, rate transient analysis and reservoir simulation for characterizing multi-fractured unconventional oil and gas reservoirs. J. Pet. Explor. Prod. Technol. 2016, 6, 675–689. [Google Scholar] [CrossRef] [Green Version]
- Ershov, M.A.; Potanin, D.A.; Tarazanov, S.V.; Abdellatief, T.M.; Kapustin, V.M. Blending characteristics of isooctene, MTBE, and TAME as gasoline components. Energy Fuels 2020, 34, 2816–2823. [Google Scholar] [CrossRef]
- Ershov, M.A.; Abdellatief, T.M.; Potanin, D.A.; Klimov, N.A.; Chernysheva, E.A.; Kapustin, V.M. Characteristics of isohexene as a novel promising high-octane gasoline booster. Energy Fuels 2020, 34, 8139–8149. [Google Scholar] [CrossRef]
- Ershov, M.A.; Grigorieva, E.V.; Abdellatief, T.M.; Chernysheva, E.A.; Makhin, D.Y.; Kapustin, V.M. A new approach for producing mid-ethanol fuels E30 based on low-octane hydrocarbon surrogate blends. Fuel Process. Technol. 2021, 213, 106688. [Google Scholar] [CrossRef]
- Abdellatief, T.M.; Ershov, M.A.; Kapustin, V.M. New recipes for producing a high-octane gasoline based on naphtha from natural gas condensate. Fuel 2020, 276, 118075. [Google Scholar] [CrossRef]
- Abdellatief, T.M.; Ershov, M.A.; Kapustin, V.M.; Chernysheva, E.A.; Savelenko, V.D.; Salameh, T.; Ali Abdelkareembc, M.; Olabi, A.G. Novel promising octane hyperboosting using isoolefinic gasoline additives and its application on fuzzy modeling. Int. J. Hydrogen Energy 2022, 47, 4932–4942. [Google Scholar] [CrossRef]
- Savelenko, V.D.; Ershov, M.A.; Kapustin, V.M.; Chernysheva, E.A.; Abdellatief, T.M.; Makhova, U.A.; Ali Abdelkareembc, M.; Olabi, A.G. Pathways resilient future for developing a sustainable E85 fuel and prospects towards its applications. Sci. Total Environ. 2022, 844, 157069. [Google Scholar] [CrossRef] [PubMed]
- Sinatra, R.; Deville, P.; Szell, M.; Wang, D.; Barabási, A.L. A century of physics. Nat. Phys. 2015, 11, 791–796. [Google Scholar] [CrossRef]
- Milojević, S. Quantifying the cognitive extent of science. J. Informetr. 2015, 9, 962–973. [Google Scholar] [CrossRef] [Green Version]
- Noyons, E.C.; Moed, H.F.; Luwel, M. Combining mapping and citation analysis for evaluative bibliometric purposes: A bib-liometric study. J. Am. Soc. Inf. Sci. 1999, 50, 115–131. [Google Scholar] [CrossRef]
- van Raan, A.F.J. Handbook of Quantitative Studies of Science and Technology, 3rd ed.; Elsevier: Amsterdam, The Netherlands, 2013. [Google Scholar]
- Boudry, C.; Baudouin, C.; Mouriaux, F. International publication trends in dryeye disease research: A bibliometric analysis. Ocul. Surf. 2018, 16, 173–179. [Google Scholar] [CrossRef] [PubMed] [Green Version]
- Geng, Y.; Chen, W.; Liu, Z.; Chiu, A.S.F.; Han, W.Y.; Liu, Z.Q.; Zhong, S.Z.; Qian, Y.Y.; You, W.; Cui, X.W. A bibliometric review: Energy consumption and greenhouse gas emissions in the residential sector. J. Clean. Prod. 2017, 159, 301–316. [Google Scholar] [CrossRef]
- Moral Muñoz, J.A.; Herrera Viedma, E.; Santisteban Espejo, A.; Cobo, M.J. Software tools for conducting bibliometric analysis in science: An up-to-date review. Prof. Inf. 2020, 29, e290103. [Google Scholar] [CrossRef] [Green Version]
- Pan, X.; Yan, E.; Cui, M.; Hua, W. Examining the usage, citation, and diffusion patterns of bibliometric mapping software: A comparative study of three tools. J. Informetr. 2018, 12, 481–493. [Google Scholar] [CrossRef]
- Gutiérrez-Salcedo, M.; Martínez, M.Á.; Moral-Muñoz, J.A.; Herrera-Viedma, E.; Cobo, M.J. Some bibliometric procedures for analyzing and evaluating research fields. Appl. Intell. 2018, 48, 1275–1287. [Google Scholar] [CrossRef]
- Cobo, M.J.; López-Herrera, A.G.; Herrera-Viedma, E.; Herrera, F. An approach for detecting, quantifying, and visualizing the evolution of a research field: A practical application to the fuzzy sets theory field. J. Informetr. 2011, 5, 146–166. [Google Scholar] [CrossRef]
- Van Eck, N.J.; Waltman, L. Software survey: VOSviewer, a computer program for bibliometric mapping. Scientometrics 2010, 84, 523–538. [Google Scholar] [CrossRef] [PubMed] [Green Version]
- Chen, C. CiteSpace II: Detecting and visualizing emerging trends and transient patterns in scientific literature. J. Am. Soc. Inf. Sci. Technol. 2006, 57, 359–377. [Google Scholar] [CrossRef] [Green Version]
- Bastian, M.; Heymann, S.; Jacomy, M. Gephi: An open source software for exploring and manipulating networks. In Proceedings of the Third International AAAI Conference on Weblogs and Social Media, San Jose, CA, USA, 17–20 May 2009; The AAAI Press: Menlo Park, CA, USA; Volume 3, pp. 361–362. Available online: https://ojs.aaai.org/index.php/ICWSM/article/view/13937 (accessed on 23 June 2022).
- Aria, M.; Cuccurullo, C. Bibliometrix: An R-tool for comprehensive science mapping analysis. J. Informetr. 2017, 11, 959–975. [Google Scholar] [CrossRef]
- Cobo, M.J.; López-Herrera, A.G.; Herrera-Viedma, E.; Herrera, F. SciMAT: A new science mapping analysis software tool. J. Am. Soc. Inf. Sci. Technol. 2012, 63, 1609–1630. [Google Scholar] [CrossRef]
- Merigó, J.M.; Yang, J.B. A bibliometric analysis of operations research and management science. Omega 2017, 73, 37–48. [Google Scholar] [CrossRef] [Green Version]
- González-Alcaide, G. Bibliometric studies outside the information science and library science field: Uncontainable or uncon-trollable? Scientometrics 2021, 126, 6837–6870. [Google Scholar] [CrossRef]
- Duan, Y.; Guan, Q. Predicting potential knowledge convergence of solar energy: Bibliometric analysis based on link prediction model. Scientometrics 2021, 126, 3749–3773. [Google Scholar] [CrossRef]
- Merigó, J.M.; Gil-Lafuente, A.M.; Yager, R.R. An overview of fuzzy research with bibliometric indicators. Appl. Soft. Comput. 2015, 27, 420–433. [Google Scholar] [CrossRef]
- Guo, Y.M.; Huang, Z.L.; Guo, J.; Guo, X.R.; Li, H.; Liu, M.Y.; Ezzeddine, S.; Nkeli, M.J. A bibliometric analysis and visualization of blockchain. Futur. Gener. Comp. Syst. 2021, 116, 316–332. [Google Scholar] [CrossRef]
- Fagerberg, J.; Fosaas, M.; Sapprasert, K. Innovation: Exploring the knowledge base. Res. Policy 2012, 41, 1132–1153. [Google Scholar] [CrossRef]
- Merigó, J.M.; Cancino, C.A.; Coronado, F.; Urbano, D. Academic research in innovation: A country analysis. Scientometrics 2016, 108, 559–593. [Google Scholar] [CrossRef]
- Marchiori, D.M.; Popadiuk, S.; Mainardes, E.W.; Rodrigues, R.G. Innovativeness: A bibliometric vision of the conceptual and intellectual structures and the past and future research directions. Scientometrics 2021, 126, 55–92. [Google Scholar] [CrossRef]
- Aalirezaei, A.; Kabir, G. A bibliometric analysis on oil and gas pipeline failure consequence analysis. Innov. Infrastruct. Solut. 2021, 6, 230. [Google Scholar] [CrossRef]
- Bi, D.; Guo, J.E.; Wang, S.; Sun, S. New research trends in unconventional oil and gas environmental issue: A bibliometric analysis. arXiv 2020, arXiv:preprint 2003.06126. [Google Scholar]
- Tamala, J.K.; Maramag, E.I.; Simeon, K.A.; Ignacio, J.J. A bibliometric analysis of sustainable oil and gas production research using VOSviewer. Clean. Eng. Technol. 2022, 7, 100437. [Google Scholar] [CrossRef]
- Mei, Y.; Ma, T.; Su, R. How marketized is China’s natural gas industry? A bibliometric analysis. J. Clean Prod. 2021, 306, 127289. [Google Scholar] [CrossRef]
- Chen, C.; Li, C.; Reniers, G.; Yang, F. Safety and security of oil and gas pipeline transportation: A systematic analysis of research trends and future needs using WoS. J. Clean Prod. 2021, 279, 123583. [Google Scholar] [CrossRef]
- Moshiul, A.M.; Mohammad, R.; Hira, F.A.; Maarop, N. Alternative Marine Fuel Research Advances and Future Trends: A Bibliometric Knowledge Mapping Approach. Sustainability 2022, 14, 4947. [Google Scholar] [CrossRef]
- Sarquah, K.; Narra, S.; Beck, G.; Awafo, E.A.; Antwi, E. Bibliometric Analysis; Characteristics and Trends of Refuse Derived Fuel Research. Sustainability 2022, 14, 1994. [Google Scholar] [CrossRef]
- Baiyegunhi, T.L.; Baiyegunhi, C.; Pharoe, B.K. Global Research Trends on Shale Gas from 2010–2020 Using a Bibliometric Approach. Sustainability 2022, 14, 3461. [Google Scholar] [CrossRef]
- Liao, H.; Tang, M.; Li, Z.; Lev, B. Bibliometric analysis for highly cited papers in operations research and management science from 2008 to 2017 based on essential science indicators. Omega 2019, 88, 223–236. [Google Scholar] [CrossRef]
- Tran, B.X.; Vu, G.T.; Ha, G.H.; Vuong, Q.H.; Ho, M.T.; Vuong, T.T.; La, V.-P.; Ho, M.-T.; Nghiem, K.C.P.; Nguyen, H.L.T.; et al. Global evolution of research in artificial intelligence in health and medicine: A bibliometric study. J. Clin. Med. 2019, 8, 360. [Google Scholar] [CrossRef] [PubMed] [Green Version]
- Wu, L.; Wang, D.; Evans, J.A. Large teams develop and small teams disrupt science and technology. Nature 2019, 566, 378–382. [Google Scholar] [CrossRef] [PubMed]
- Wuchty, S.; Jones, B.F.; Uzzi, B. The increasing dominance of teams in production of knowledge. Science 2007, 316, 1036–1039. [Google Scholar] [CrossRef] [PubMed] [Green Version]
- Jones, B.F.; Wuchty, S.; Uzzi, B. Multi-university research teams: Shifting impact, geography, and stratification in science. Science 2008, 322, 1259–1262. [Google Scholar] [CrossRef] [PubMed] [Green Version]
- Gowida, A.; Elkatatny, S.; Gamal, H. Unconfined compressive strength (UCS) prediction in real-time while drilling using artificial intelligence tools. Neural Comput. Appl. 2021, 33, 8043–8054. [Google Scholar] [CrossRef]
- Siddig, O.; Abdulhamid Mahmoud, A.; Elkatatny, S.; Soupios, P. Utilization of Artificial Neural Network in Predicting the Total Organic Carbon in Devonian Shale Using the Conventional Well Logs and the Spectral Gamma Ray. Comput. Intell. Neurosci. 2021, 2021, 2486046. [Google Scholar] [CrossRef] [PubMed]
- Muhammed, N.S.; Olayiwola, T.; Elkatatny, S. A review on clay chemistry, characterization and shale inhibitors for water-based drilling fluids. J. Pet. Sci. Eng. 2021, 206, 109043. [Google Scholar] [CrossRef]


| Ref. | Title | Year | Contributions |
|---|---|---|---|
| [39] | A bibliometric analysis on oil and gas pipeline failure consequence analysis | 2021 | Evaluating research patterns in oil and gas pipeline failure consequences considering 20 years of scientific documents. |
| [40] | New research trends in unconventional oil and gas environmental issue: a bibliometric analysis | 2020 | A bibliometrics overview of unconventional oil and gas environmental issue from 1990 to 2018. |
| [41] | A bibliometric analysis of sustainable oil and gas production research using VOSviewer | 2022 | Using VOSviewer software to carry out a bibliometric analysis of research on sustainable oil and gas production from 1994 to 2021. |
| [42] | How marketized is China’s natural gas industry? A bibliometric analysis | 2021 | Quantitative analysis of the marketization degree of China’s natural gas industry through a literature analysis. |
| [43] | Safety and security of oil and gas pipeline transportation: a systematic analysis of research trends and future needs using WoS | 2021 | Quantitating the security and safety of oil and gas pipeline transportation through informetric analysis. |
| [44] | Alternative marine fuel research advances and future trends: a bibliometric knowledge mapping approach | 2022 | Quantifying research of the alternative marine fuel. |
| [45] | Bibliometric analysis; characteristics and trends of refuse derived fuel research | 2022 | Carrying out a bibliometric analysis for refuse-derived fuel research. |
| [46] | Global research trends on shale gas from 2010–2020 using a bibliometric approach | 2022 | Quantifying the global research in the field of shale gas published between 2010 and 2020 through the bibliometric method. |
| PY | TC (WOS) | Cited Frequency | Title | Research Area | JI | CA/FA (AN) | CI (AI) | CC (CN) |
|---|---|---|---|---|---|---|---|---|
| 2013 | 943 | 109 | Impact of shale gas development on regional water quality | Science and technology—other topics | Science | Vidic, R. D. (5) | Univ Pittsburgh (2) | USA (1) |
| 2002 | 910 | 106 | A critical review of the risks to water resources from unconventional shale gas development and hydraulic fracturing in the United States | Engineering; environmental sciences and ecology | Environ. Sci. Technol. | Vengosh, Avner (5) | Duke Univ (4) | USA (1) |
| 2011 | 830 | 105 | Methane contamination of drinking water accompanying gas-well drilling and hydraulic fracturing | Science and technology—other topics | Proc. Natl. Acad. Sci. | Osborn, SG/Jackson, RB (4) | Duke Univ (1) | USA (1) |
| 1969 | 172 | 84 | Analysis and prediction of minimum flow rate for continuous removal of liquids from gas wells | Energy and fuels, engineering, and geology | J. Pet. Technol. | TURNER, RG (3) | / | / |
| 2014 | 219 | 82 | Oil and gas wells and their integrity: implications for shale and unconventional resource exploitation | Geology | Mar. Pet. Geol. | Davies, Richard J. (9) | Univ Durham (5) | England (2) |
| 2012 | 358 | 81 | Geochemical evidence for possible natural migration of Marcellus Formation brine to shallow aquifers in Pennsylvania | Science and technology—other topics | Proc. Natl. Acad. Sci. | Warner, NR/Vengosh, A (8) | Duke Univ (2) | USA (1) |
| 1945 | 421 | 77 | Analysis of decline curves | Engineering, metallurgy, and metallurgical engineering | / | ARPS, JJ (1) | / | / |
| 2013 | 347 | 74 | Geochemical evaluation of flowback brine from Marcellus gas wells in Pennsylvania, USA | Geochemistry and geophysics | Appl. Geochem. | Haluszczak, Lara O./Rose, Arthur W. | Penn State Univ (1) | USA (1) |
| 2013 | 370 | 69 | Increased stray gas abundance in a subset of drinking water wells near Marcellus shale gas extraction | Science and technology—other topics | Proc. Natl. Acad. Sci. | Jackson, RB (9) | Duke Univ (3) | USA (1) |
| 2011 | 572 | 60 | Water management challenges associated with the production of shale gas by hydraulic fracturing | Geochemistry and geophysics, and mineralogy | Elements | Gregory, Kelvin B. (3) | Carnegie Mellon Univ (2) | USA (1) |
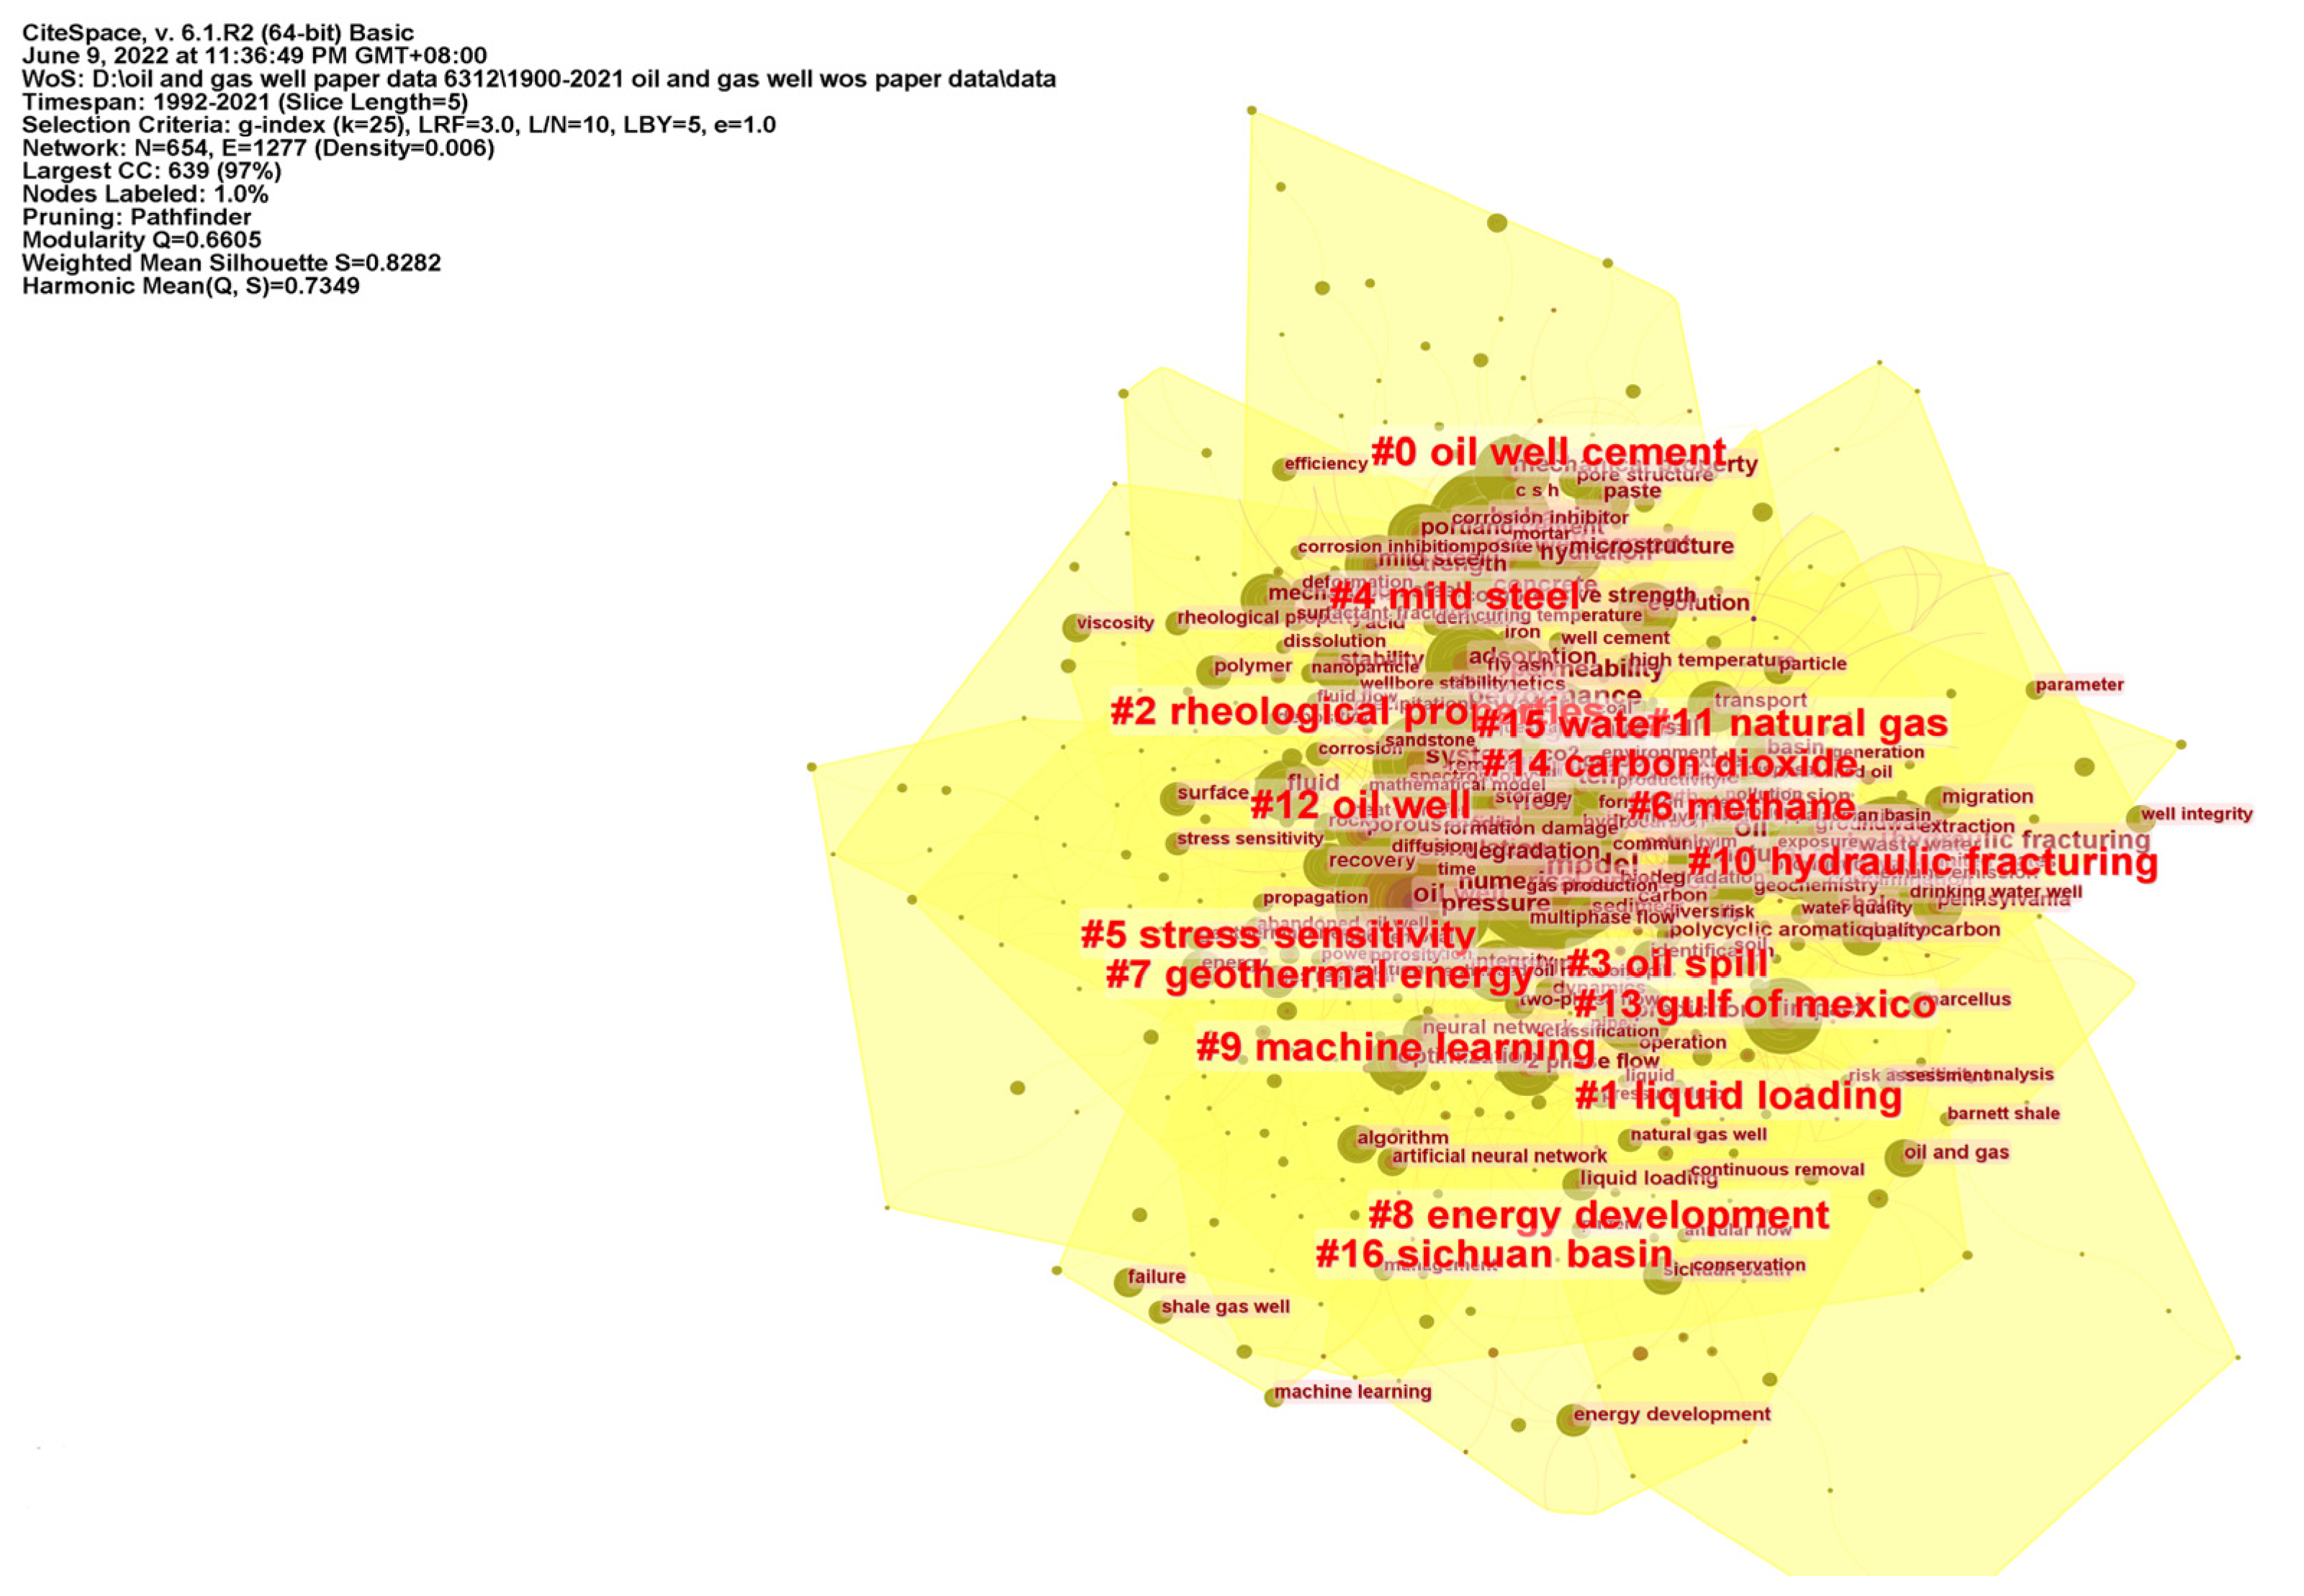
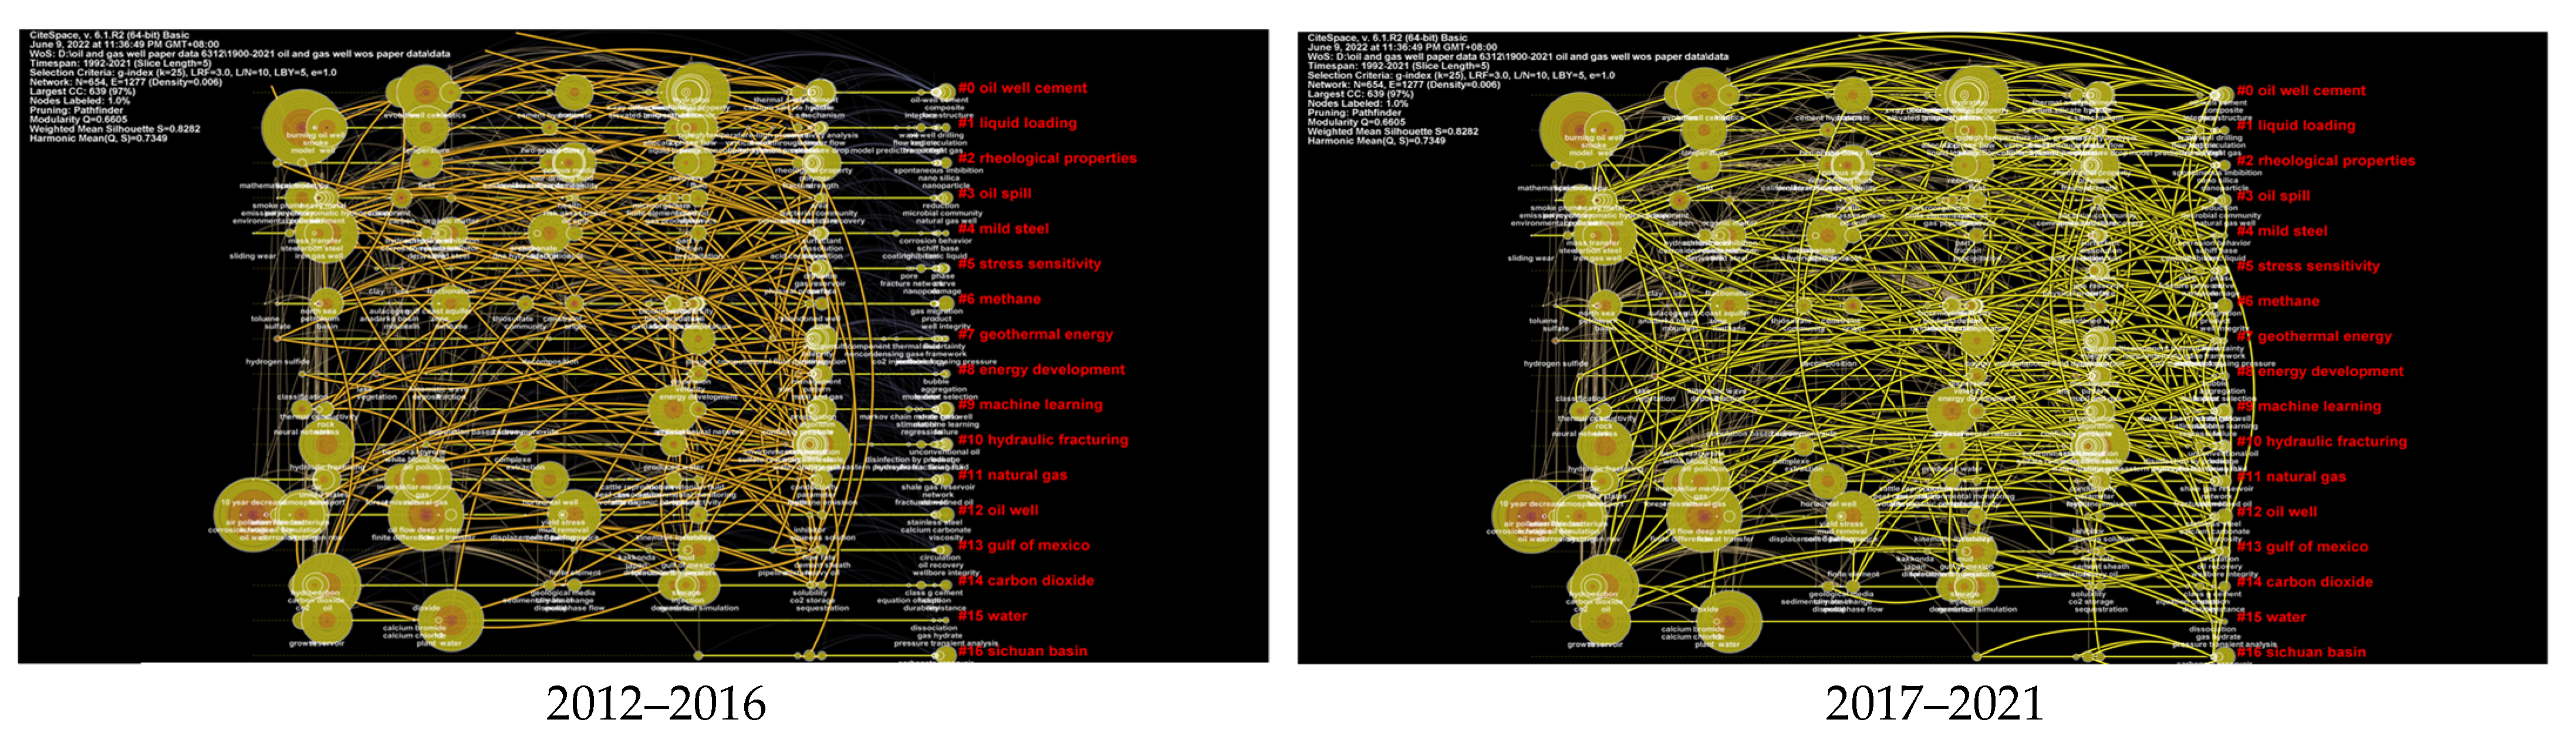
| Hotspots ID | Size | Silhouette | Hotspot Name | Top Terms (LSI) |
|---|---|---|---|---|
| 0 | 61 | 0.849 | Oil well cement | Oil well cement; cement paste; uniaxial compression; gel transition time; shale gas|mechanical properties; oil-well cement; shallow wells; gel transition time; shale gas |
| 1 | 48 | 0.888 | Liquid loading | two-phase flow; vertical wellbore; transient simulation; Duong’s method; hybrid method|sensitivity analysis; Monte Carlo simulation; wellbore temperature; high-temperature formation; Longmaxi |
| 2 | 46 | 0.804 | Rheological properties | Porous media; energy balance; temperature transient; fracturing fluid; hollow perlite microspheres|drilling fluid; soaking time; deep mudstone; clay-bearing reservoir; carbonation resistance |
| 3 | 45 | 0.786 | Oil spill | Hydraulic fracturing; ribosomal RNA gene analysis; low biomass samples; area; organic compound|polycyclic aromatic hydrocarbons; carbon isotope ratios; total petrol; hydrocarbon; characteristic auxiliaries; foaming agent series |
| 4 | 45 | 0.782 | Mild steel | Carbon steel; corrosion inhibitors; nonionic surfactants; formation water; acid inhibition|corrosion inhibitor; impedance spectroscopy; PKA analysis; DLC coatings; salt-affected soils |
| 5 | 43 | 0.781 | Stress sensitivity | Stress sensitivity; production performance; carbonate gas reservoirs; composite reservoirs; ultimate recovery|ultimate recovery; production forecast; unconventional gas; parameter determination; production analysis |
| 6 | 42 | 0.782 | Methane | Hydraulic fracturing; water quality; isotope tracers; critical flow rate; tight sandstone gas|natural gas; emission; soil; RN 222; flowback fluids |
| 7 | 40 | 0.813 | Geothermal energy | Geothermal energy; abandoned oil wells; direct heating; organic Rankine cycle; thermal expansion annulus pressure; working fluids|hydrothermal enhanced geothermal system; enhanced geothermal system; shallow depth; hydrothermal system |
| 8 | 40 | 0.859 | Energy development | Energy development; grassland songbirds; anthropogenic noise; edge effects; nesting success|gas development; forest fragmentation; biotic homogenization; Allegheny national forest; forest songbirds |
| 9 | 39 | 0.811 | Machine learning | Hydraulic fracturing; multiple fracture growth; fluid viscosity; rate transient analysis; multistage hydraulic fracturing|machine learning; deep learning; production forecasting; phase flow; two-fluid model |
| 10 | 39 | 0.886 | Hydraulic fracturing | Hydraulic fracturing; water quality; isotope tracers; coprecipitation; flowback fluids|Marcellus shale; coprecipitation; flowback fluids; risk assessment; greenhouse gases |
| 11 | 38 | 0.802 | Natural gas | Natural gas; United States; abandoned oil; Williston Basin; North Dakota|horizontal well; transient analysis; performance; media; gas flow |
| 12 | 32 | 0.83 | Oil well | Heat transfer; flow; system; methane; model|performance; permeability; fracture; film flow; Sichuan Basin |
| 13 | 28 | 0.84 | Gulf of Mexico | cement sheath; finite element; graphene oxide; wellbore irregularity; sensitivity analysis|wellbore integrity; finite elements; hydraulic tong; stress concentration; water hammer effect |
| 14 | 24 | 0.831 | Carbon dioxide | Numerical simulation; temperature field; fragment mechanism; stress distribution; laser perforation|hydraulic fracturing; example calculation; atmospheric models; bile metabolites; CO2 fracturing |
| 15 | 15 | 0.922 | Water | Reservoir; porous media; recovery; swelling clay; sandstone|water; flow; permeability; thermodynamic property; Posidonia shale |
| 16 | 14 | 0.954 | Sichuan Basin | Longmaxi Formation; Wufeng Formation; Yangtze Plate; differential enrichment; confining pressure|Barnett shale; Silurian Longmaxi; miniature core plug; gold-tube pyrolysis; residual TOC content |
Publisher’s Note: MDPI stays neutral with regard to jurisdictional claims in published maps and institutional affiliations. |
© 2022 by the authors. Licensee MDPI, Basel, Switzerland. This article is an open access article distributed under the terms and conditions of the Creative Commons Attribution (CC BY) license (https://creativecommons.org/licenses/by/4.0/).
Share and Cite
Zhang, P.; Du, Y.; Han, S.; Qiu, Q. Global Progress in Oil and Gas Well Research Using Bibliometric Analysis Based on VOSviewer and CiteSpace. Energies 2022, 15, 5447. https://doi.org/10.3390/en15155447
Zhang P, Du Y, Han S, Qiu Q. Global Progress in Oil and Gas Well Research Using Bibliometric Analysis Based on VOSviewer and CiteSpace. Energies. 2022; 15(15):5447. https://doi.org/10.3390/en15155447
Chicago/Turabian StyleZhang, Pan, Yongjun Du, Sijie Han, and Qingan Qiu. 2022. "Global Progress in Oil and Gas Well Research Using Bibliometric Analysis Based on VOSviewer and CiteSpace" Energies 15, no. 15: 5447. https://doi.org/10.3390/en15155447
APA StyleZhang, P., Du, Y., Han, S., & Qiu, Q. (2022). Global Progress in Oil and Gas Well Research Using Bibliometric Analysis Based on VOSviewer and CiteSpace. Energies, 15(15), 5447. https://doi.org/10.3390/en15155447