
Numerical Simulation on Erosion Wear Law of Pressure-Controlled Injection Tool in Solid Fluidization Exploitation of the Deep-Water Natural Gas Hydrate

 ,
,
Abstract
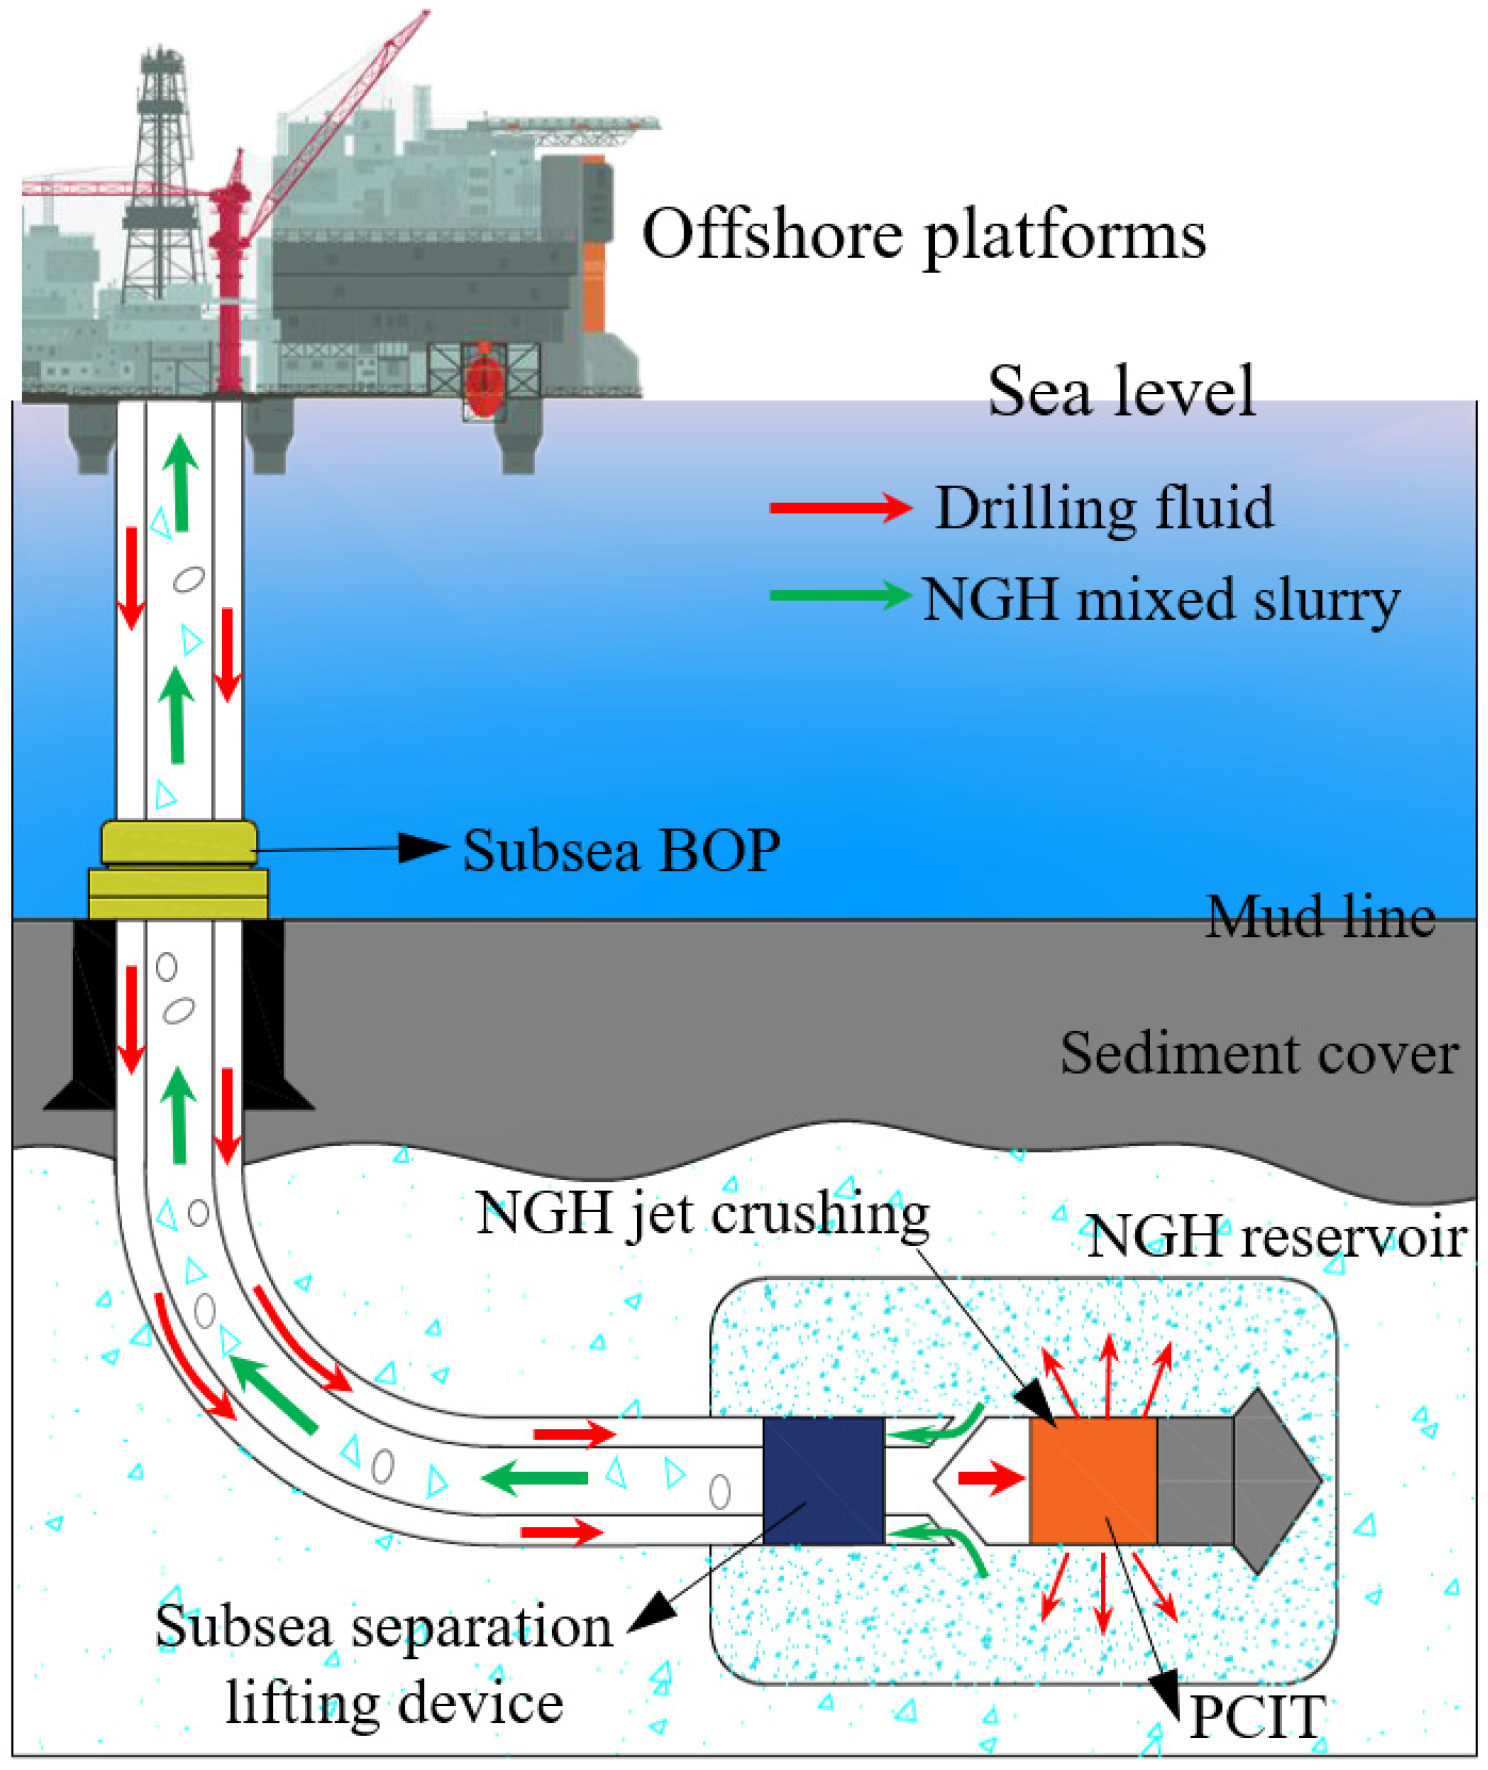
:1. Introduction
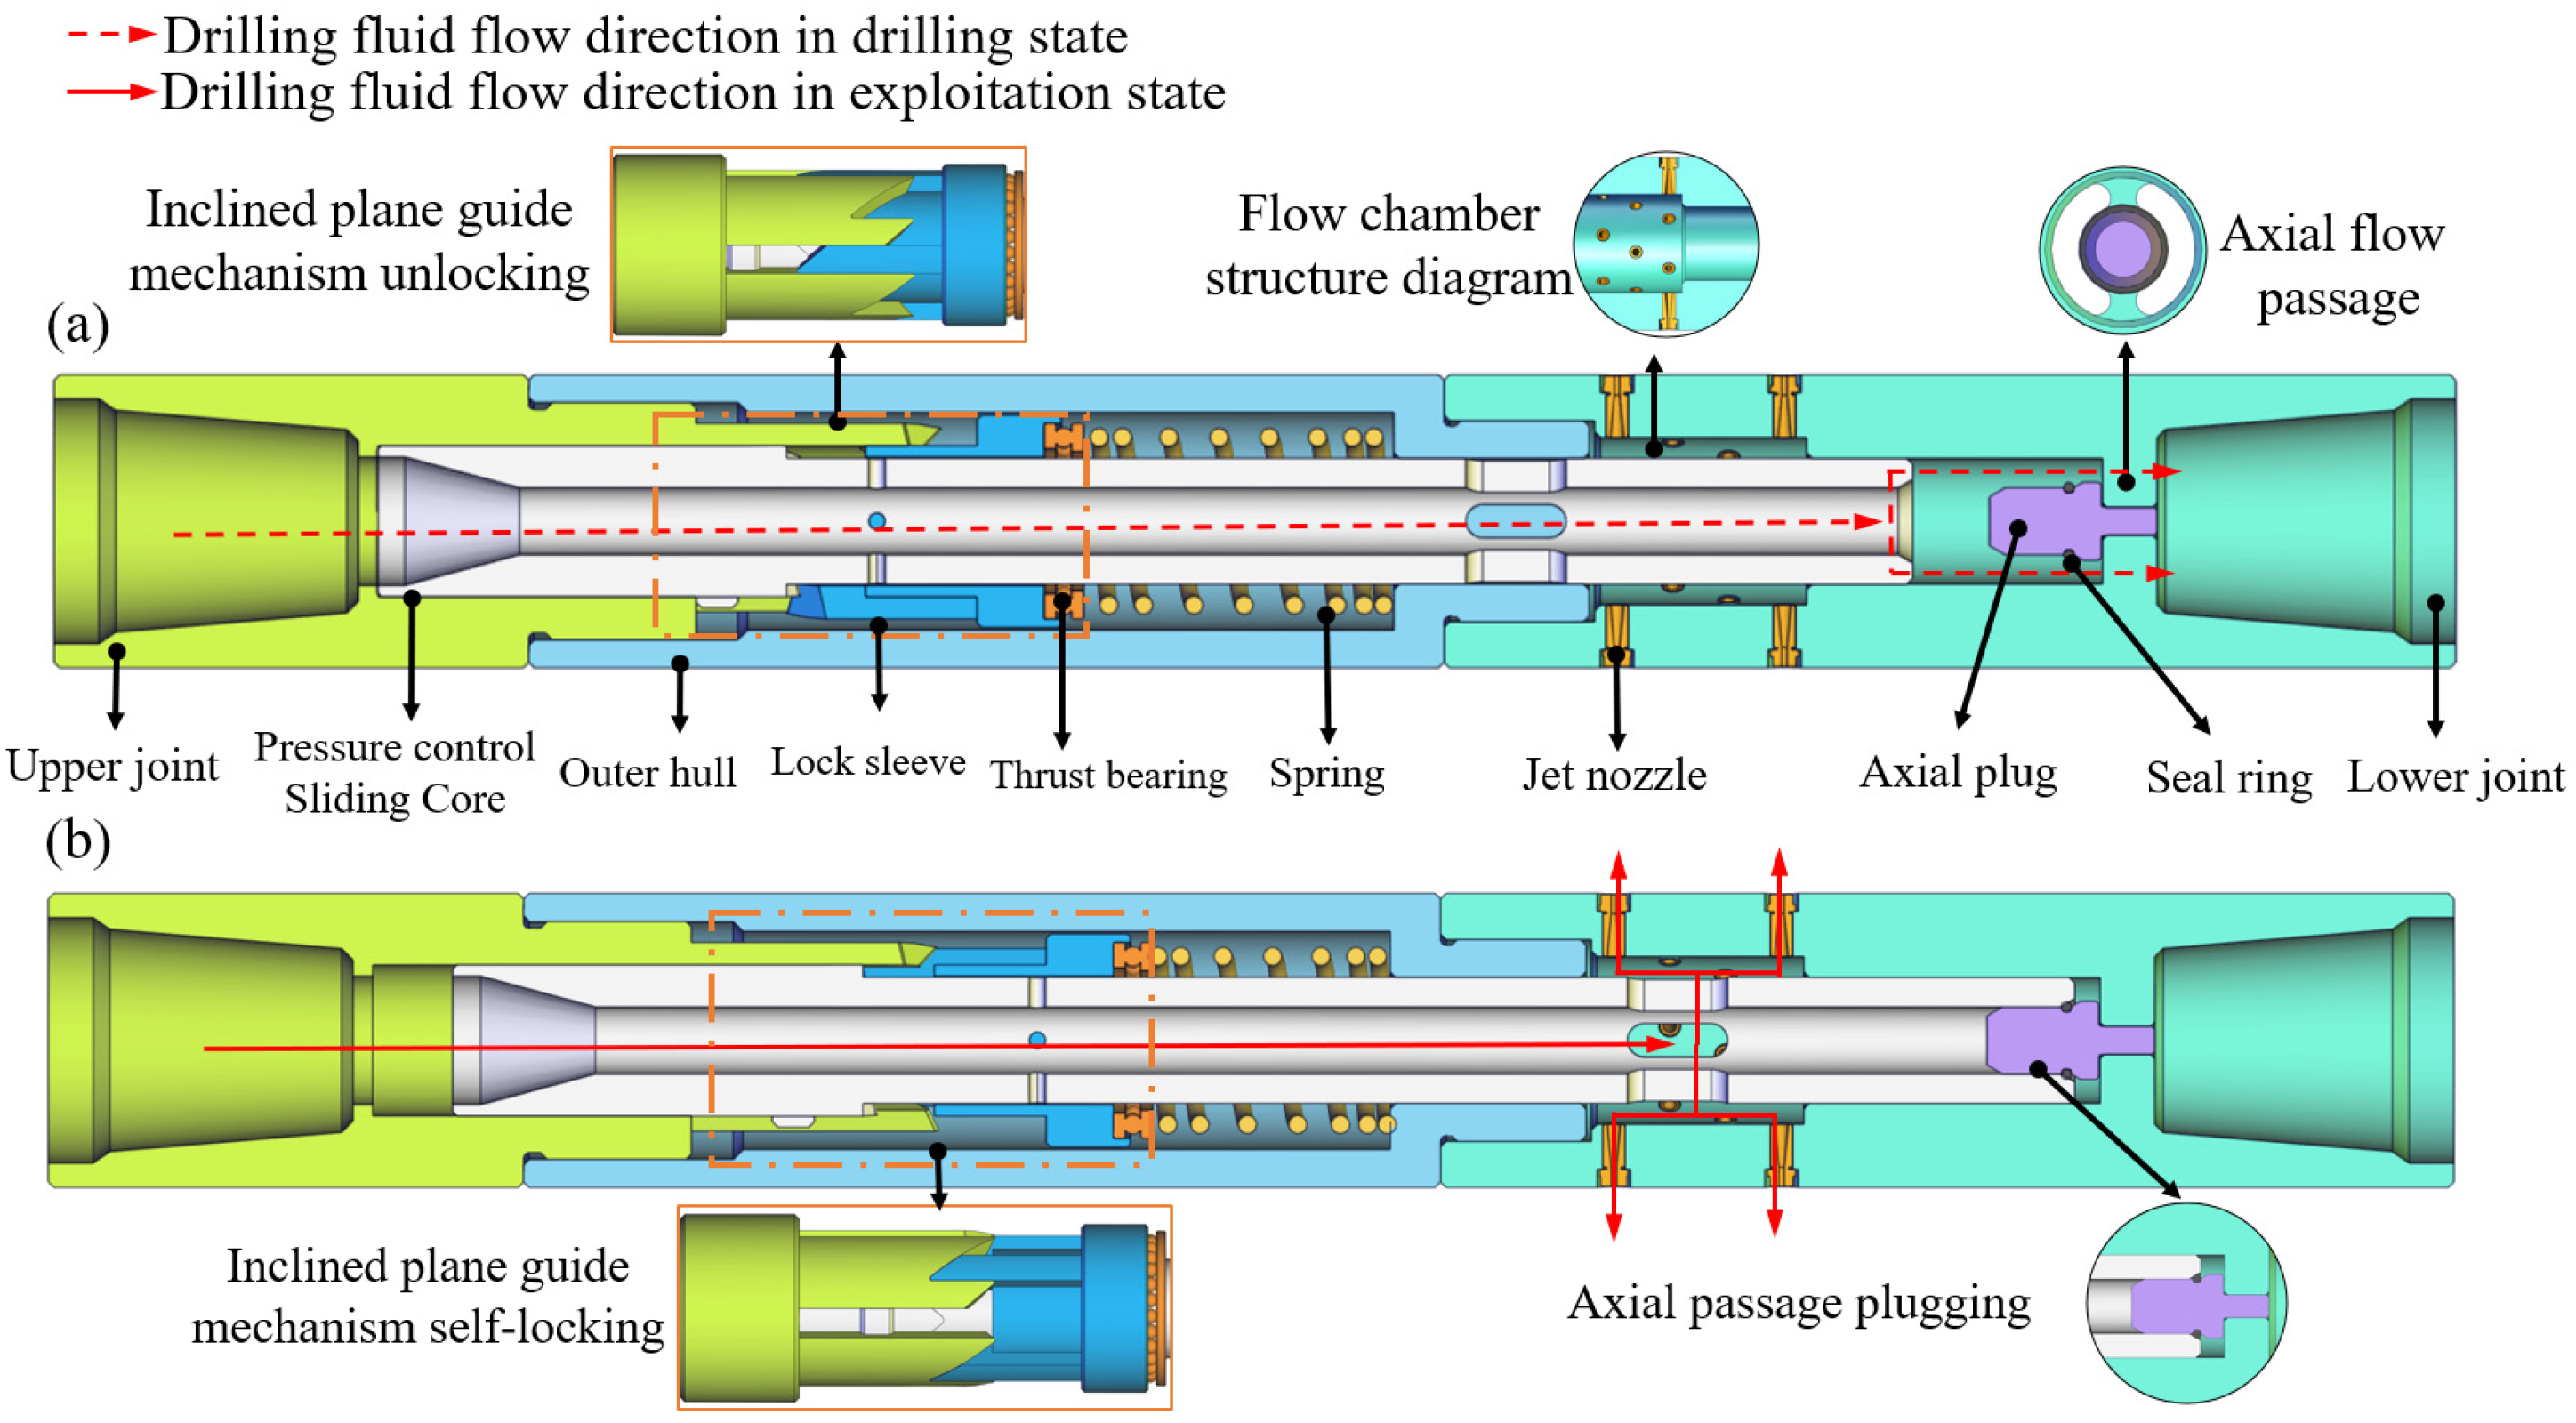
2. Working Mechanism of PCIT
2.1. Stage 1: Horizontal Drilling Process
2.2. Stage 2: NGH Crushing and Cavity Making
2.3. Stage 3: Multi-Angle Directional Mining
2.4. Stage 4: Multi-Level Mining
3. Governing Equations
3.1. Liquid-Phase Governing Equations
3.2. Erosion Model
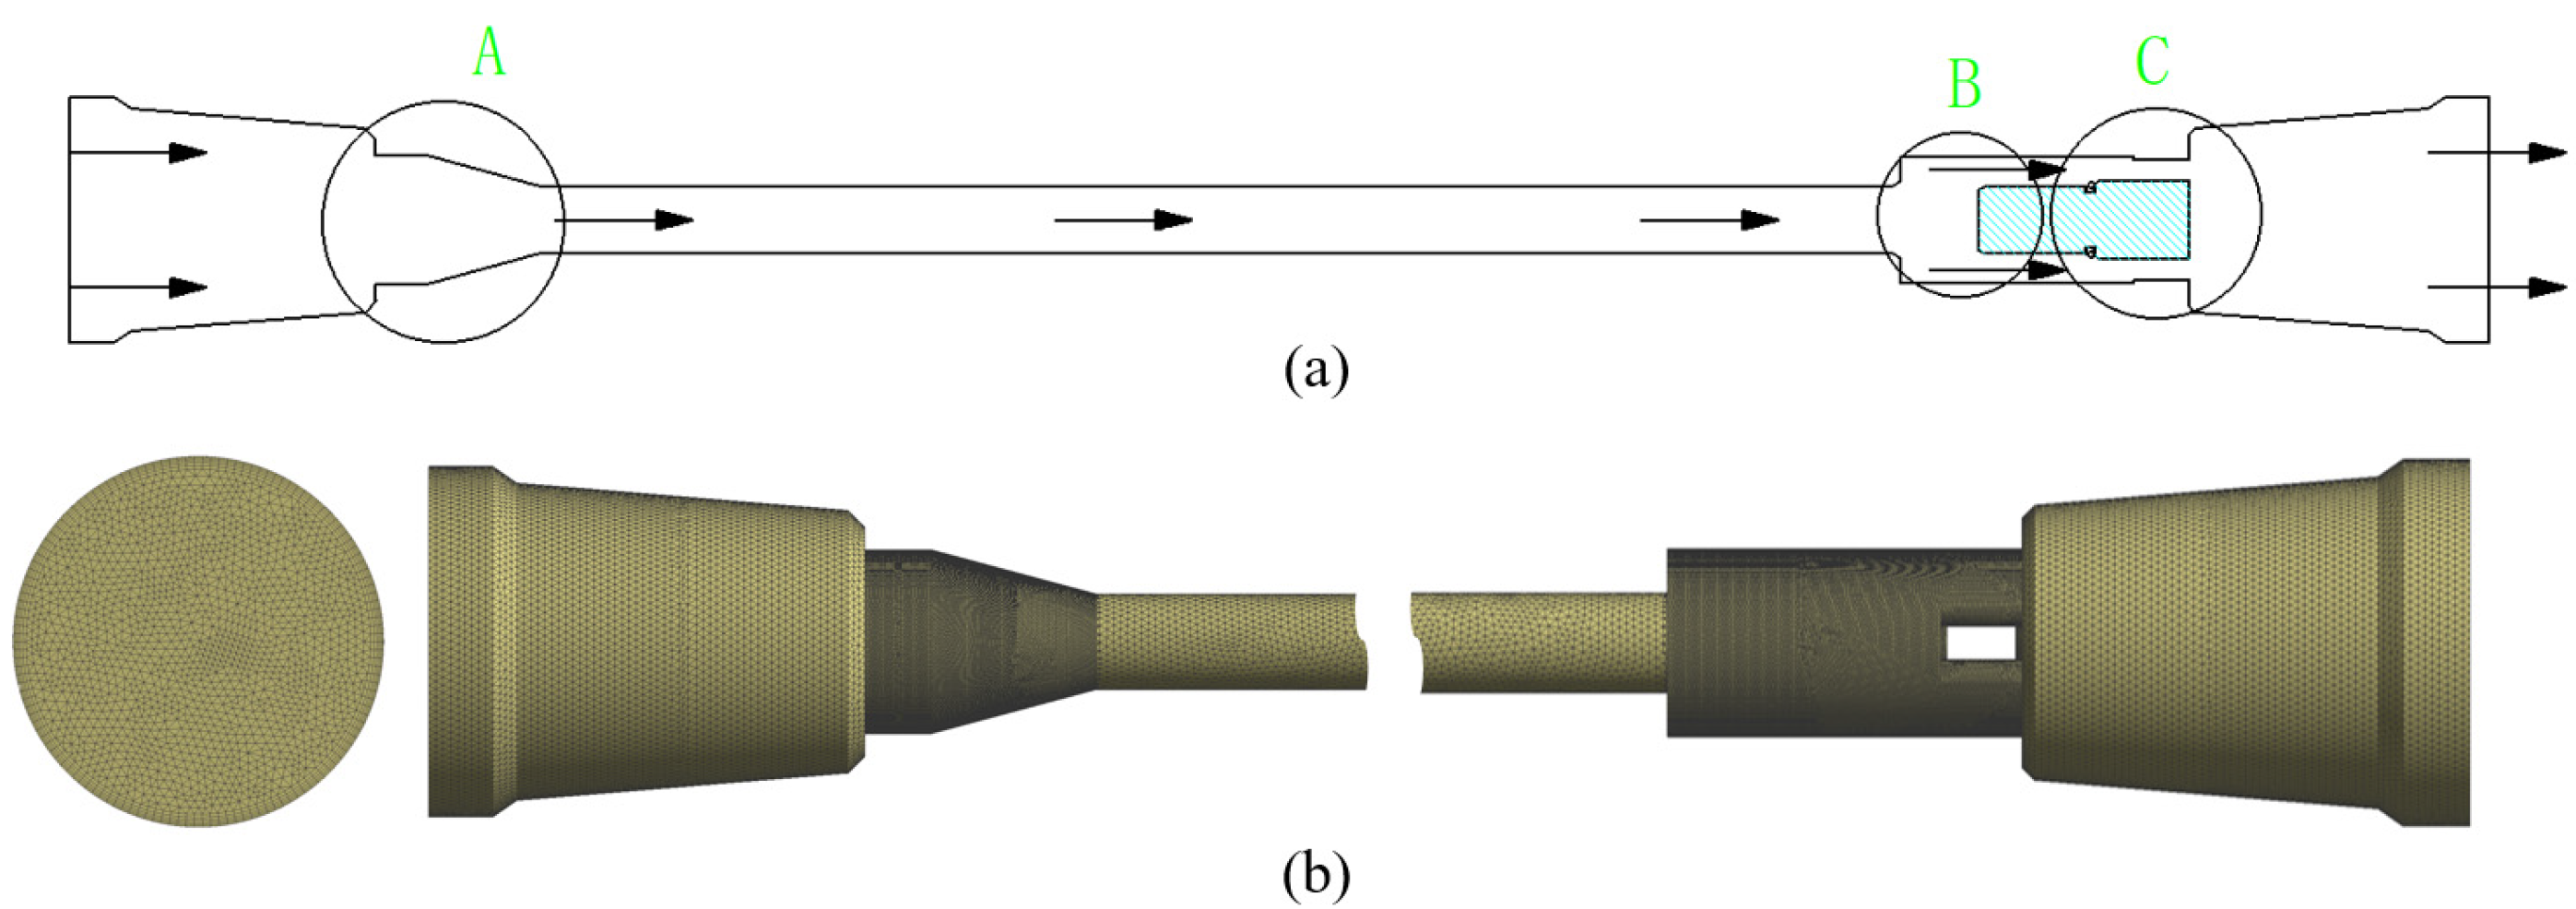
3.3. Erosion Wear Flow Field Geometric Model and Meshing
3.4. Simulation Parameters and Boundary Conditions
- (1)
- In the simulation process, the velocity inlet boundary condition was used, which is determined by the flow rate and the inlet size of the PCIT. At the same time, the inlet velocity of the solid-phase particles was set to be the same as the fluid velocity, and the outlet adopted the pressure outlet boundary condition.
- (2)
- In this paper, the standard wall function method was chosen to correct the results. The specific definition value in the reflection wall model was determined by the wall collision recovery equation. The impact angle function was defined as a linear value, as shown in Table 1.
4. Analysis of Numerical Simulation Results
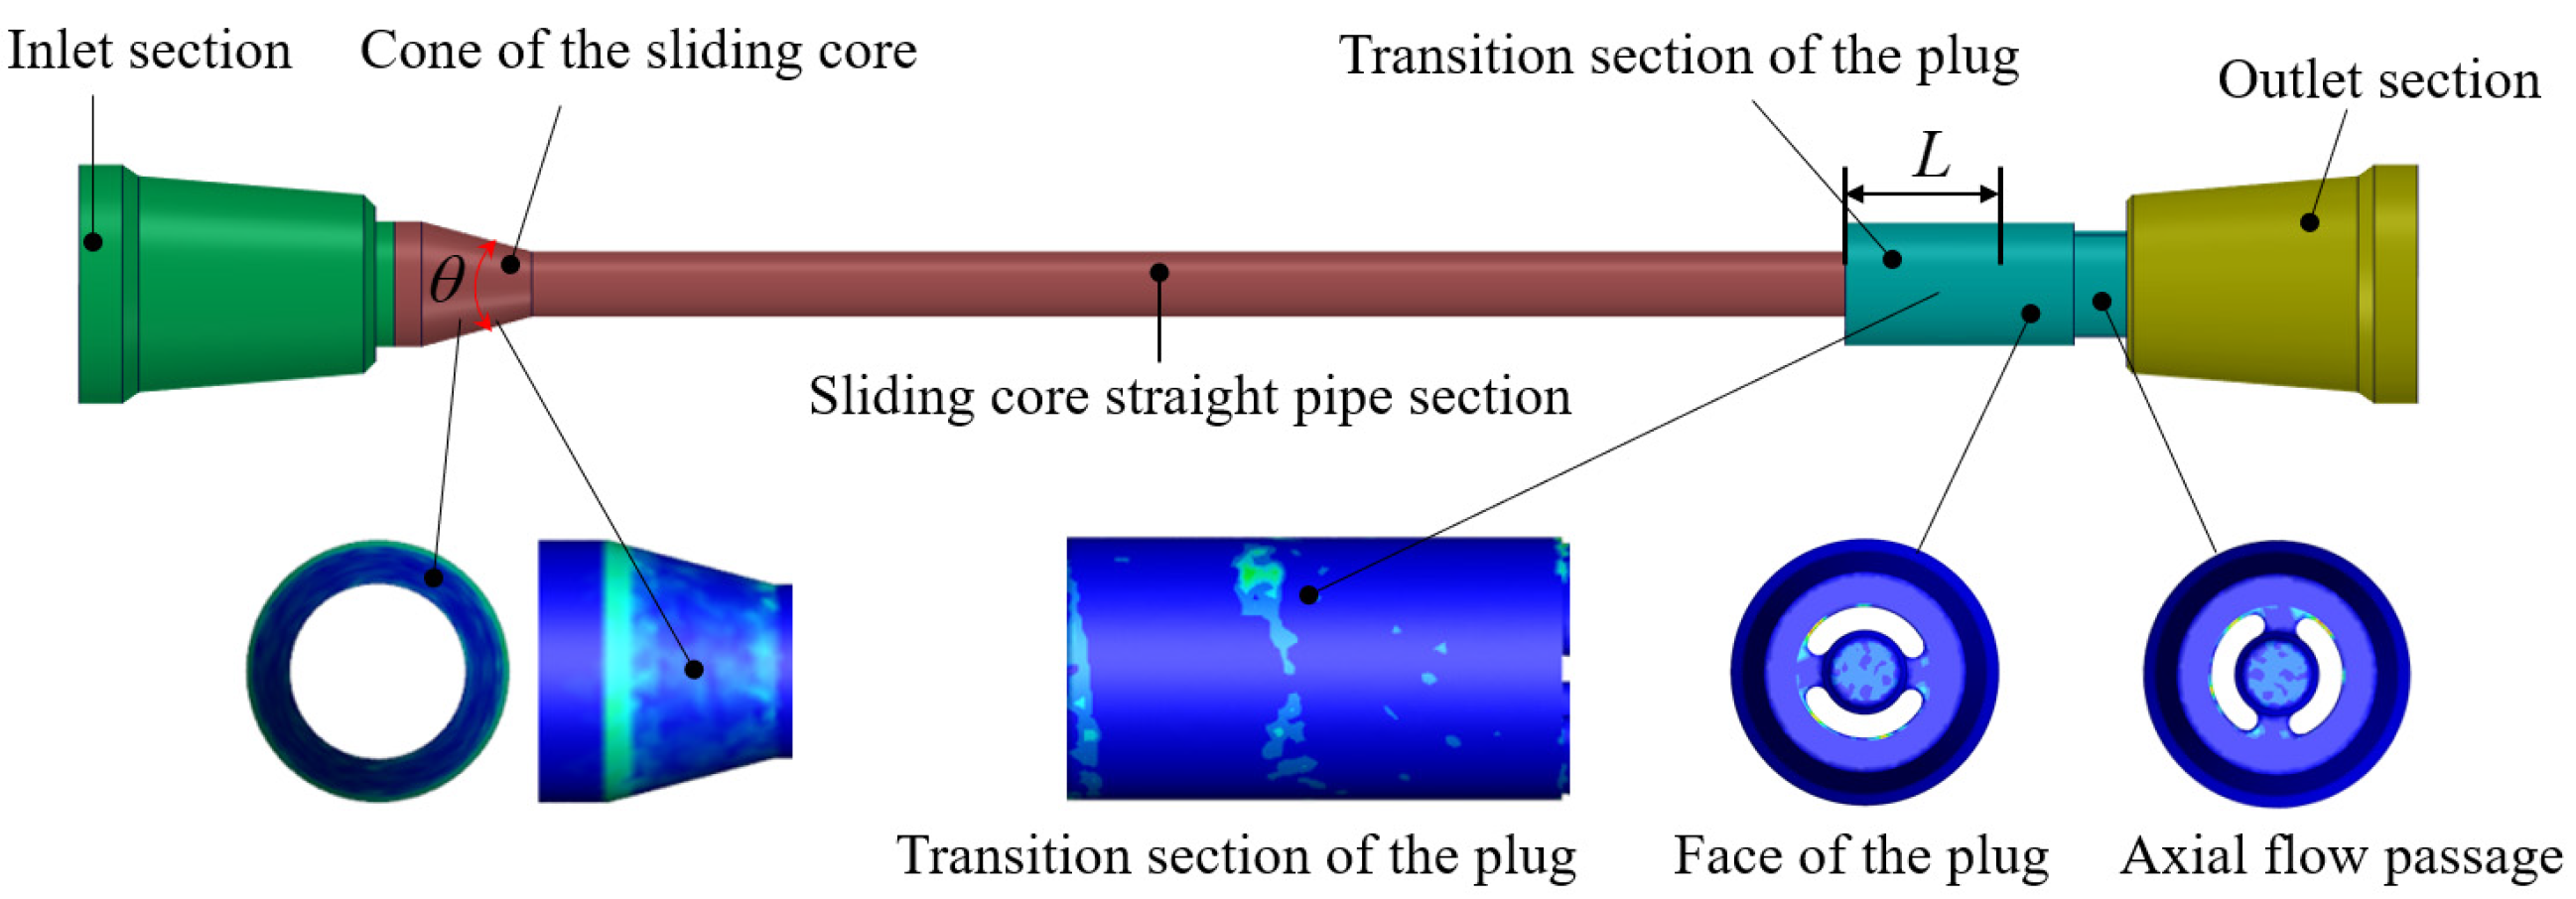
4.1. Prediction of Erosion Location
4.2. Influence of Drilling Fluid Physical Parameters on Erosion Rate
4.2.1. Influence of Drilling Fluid Flow on Erosion Rate
4.2.2. Influence of Solid-Phase Particle Mass Flow on Erosion Rate
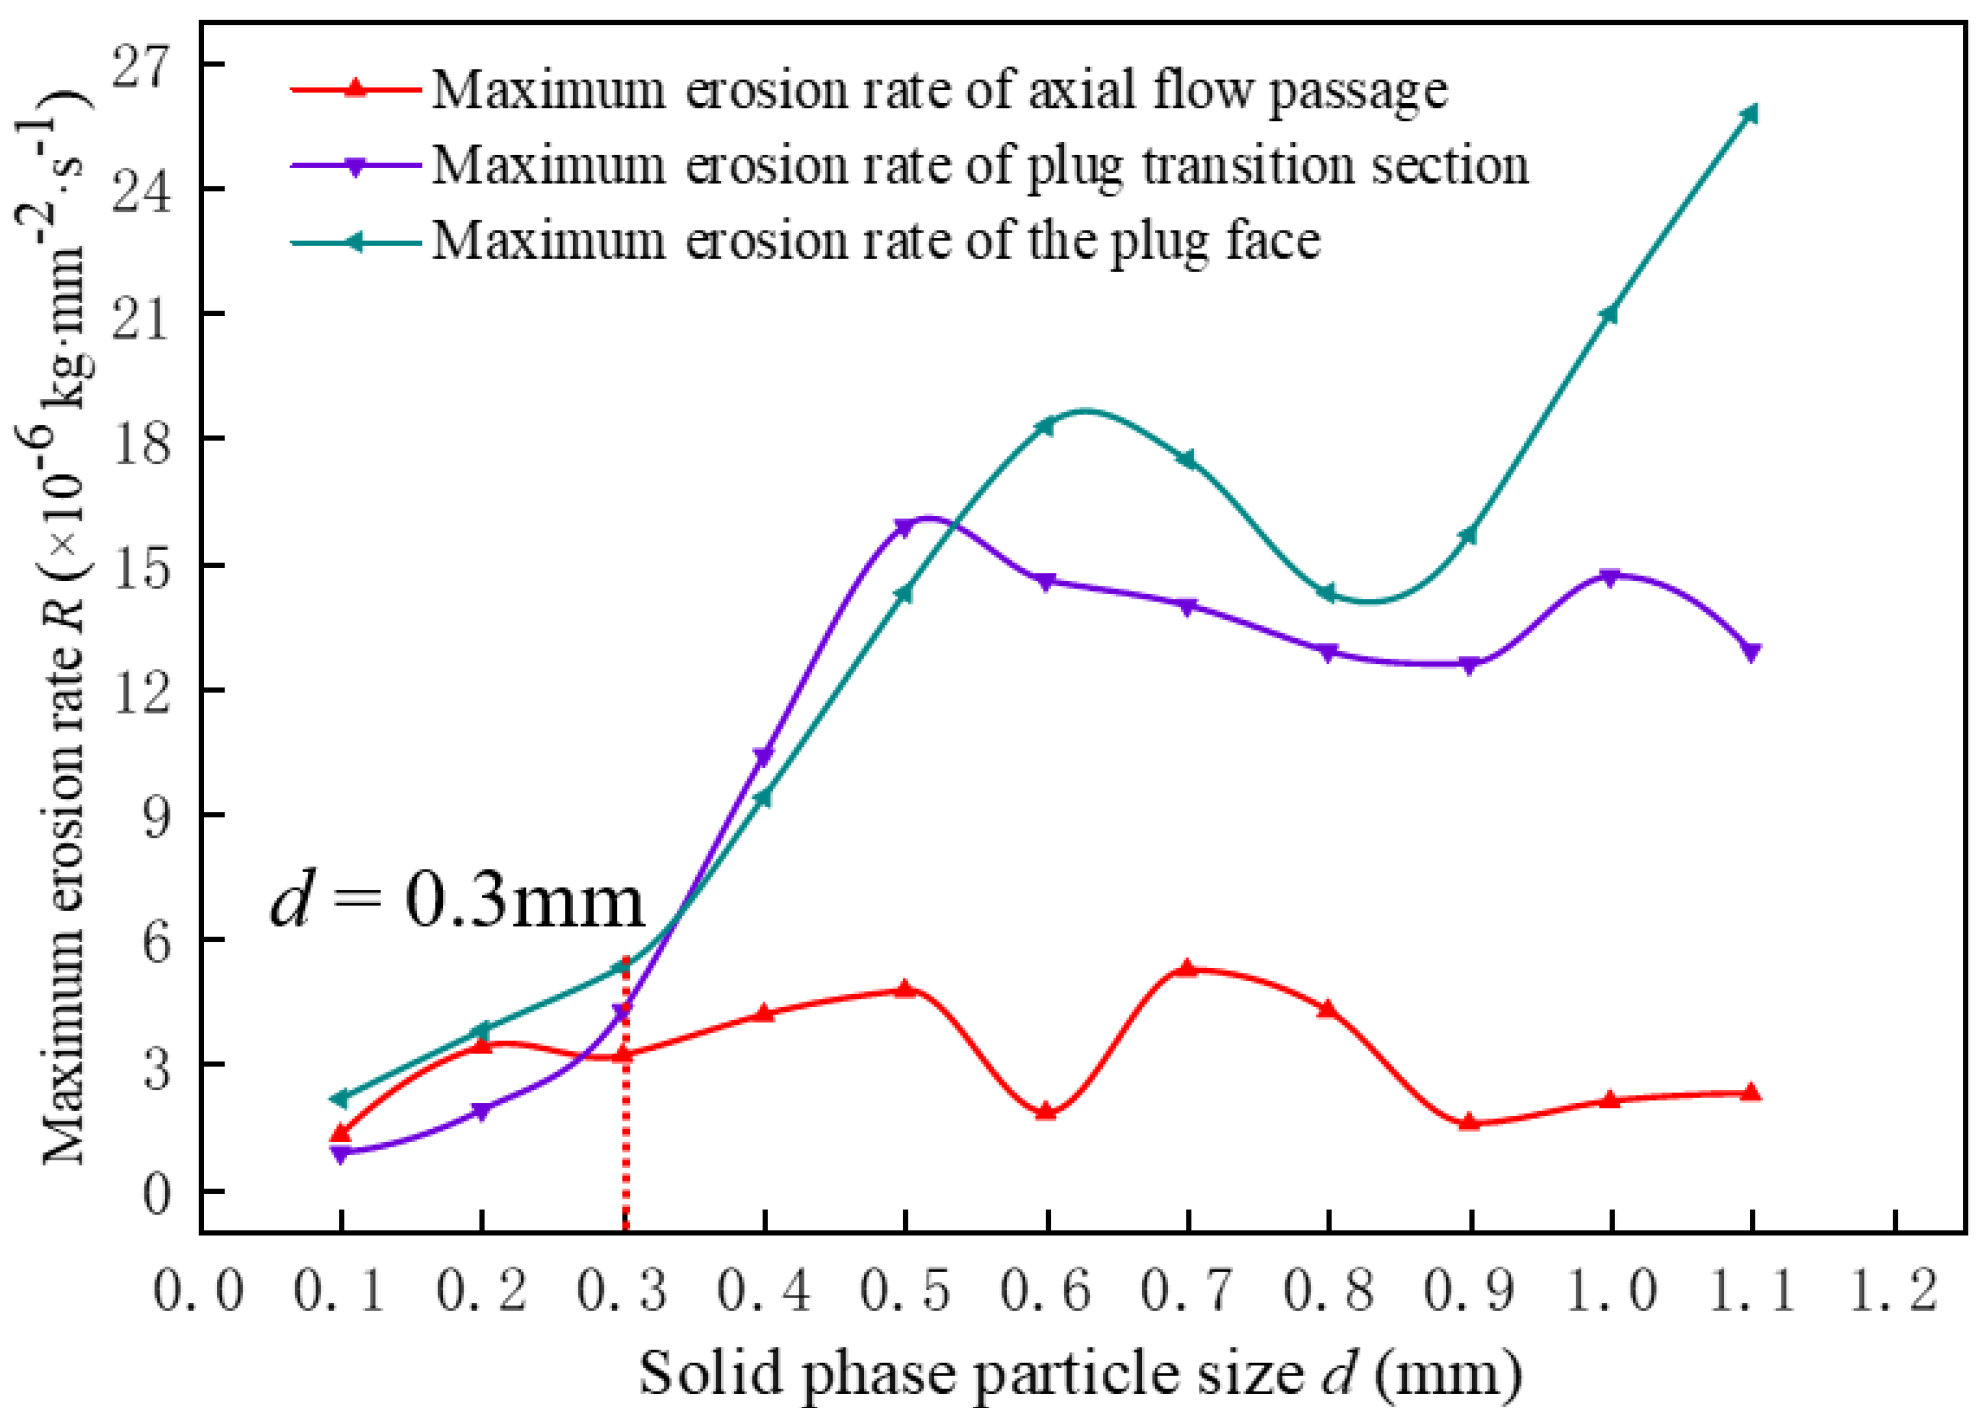
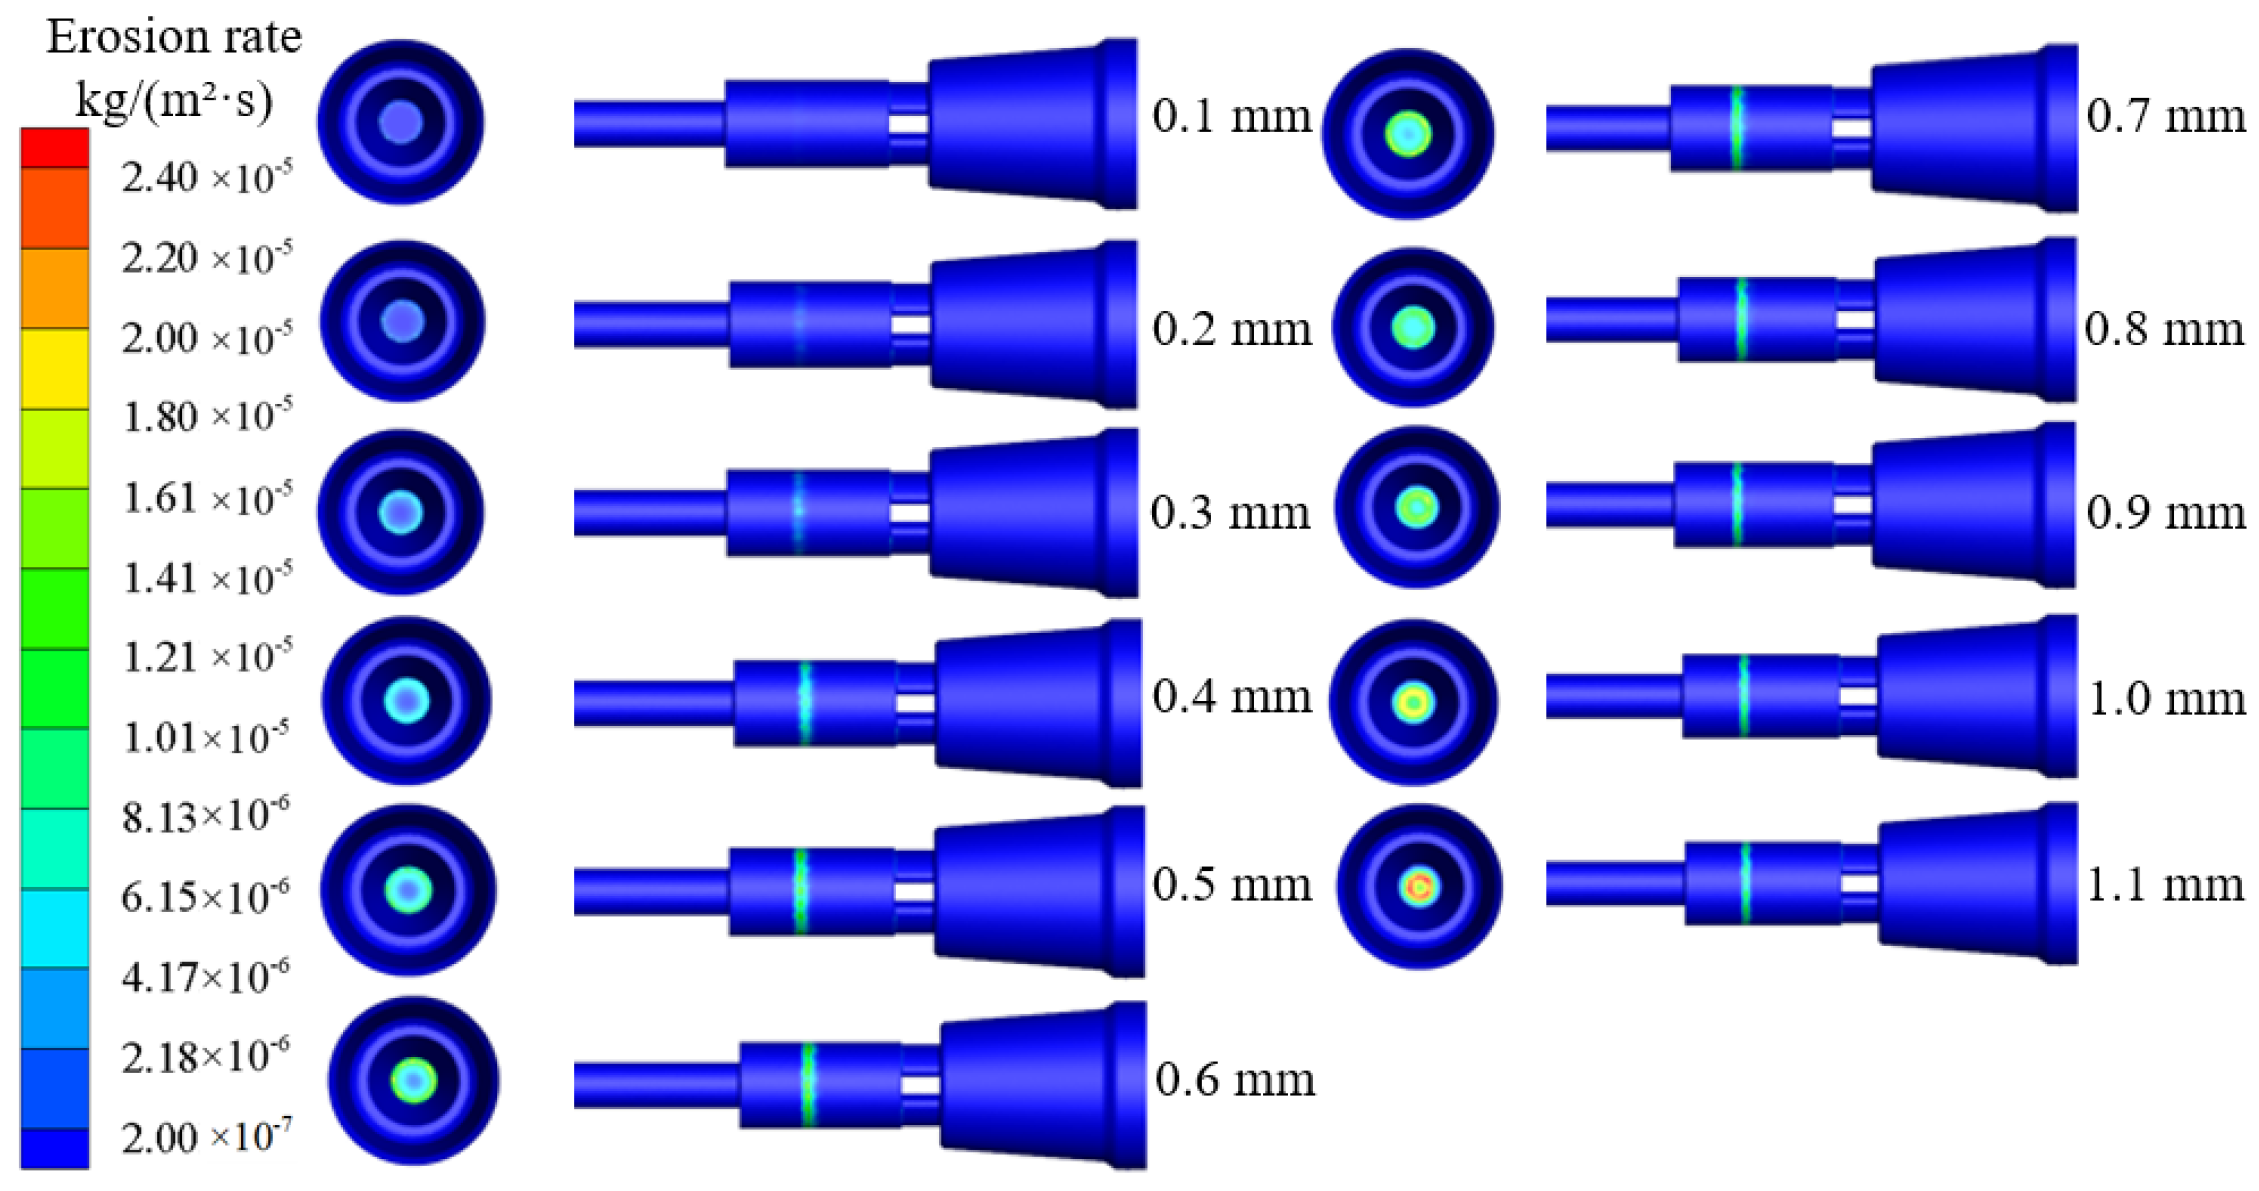
4.2.3. Influence of Solid-Phase Particle Diameter on Erosion Rate
4.3. Influence of PCIT Structural Parameters on Erosion
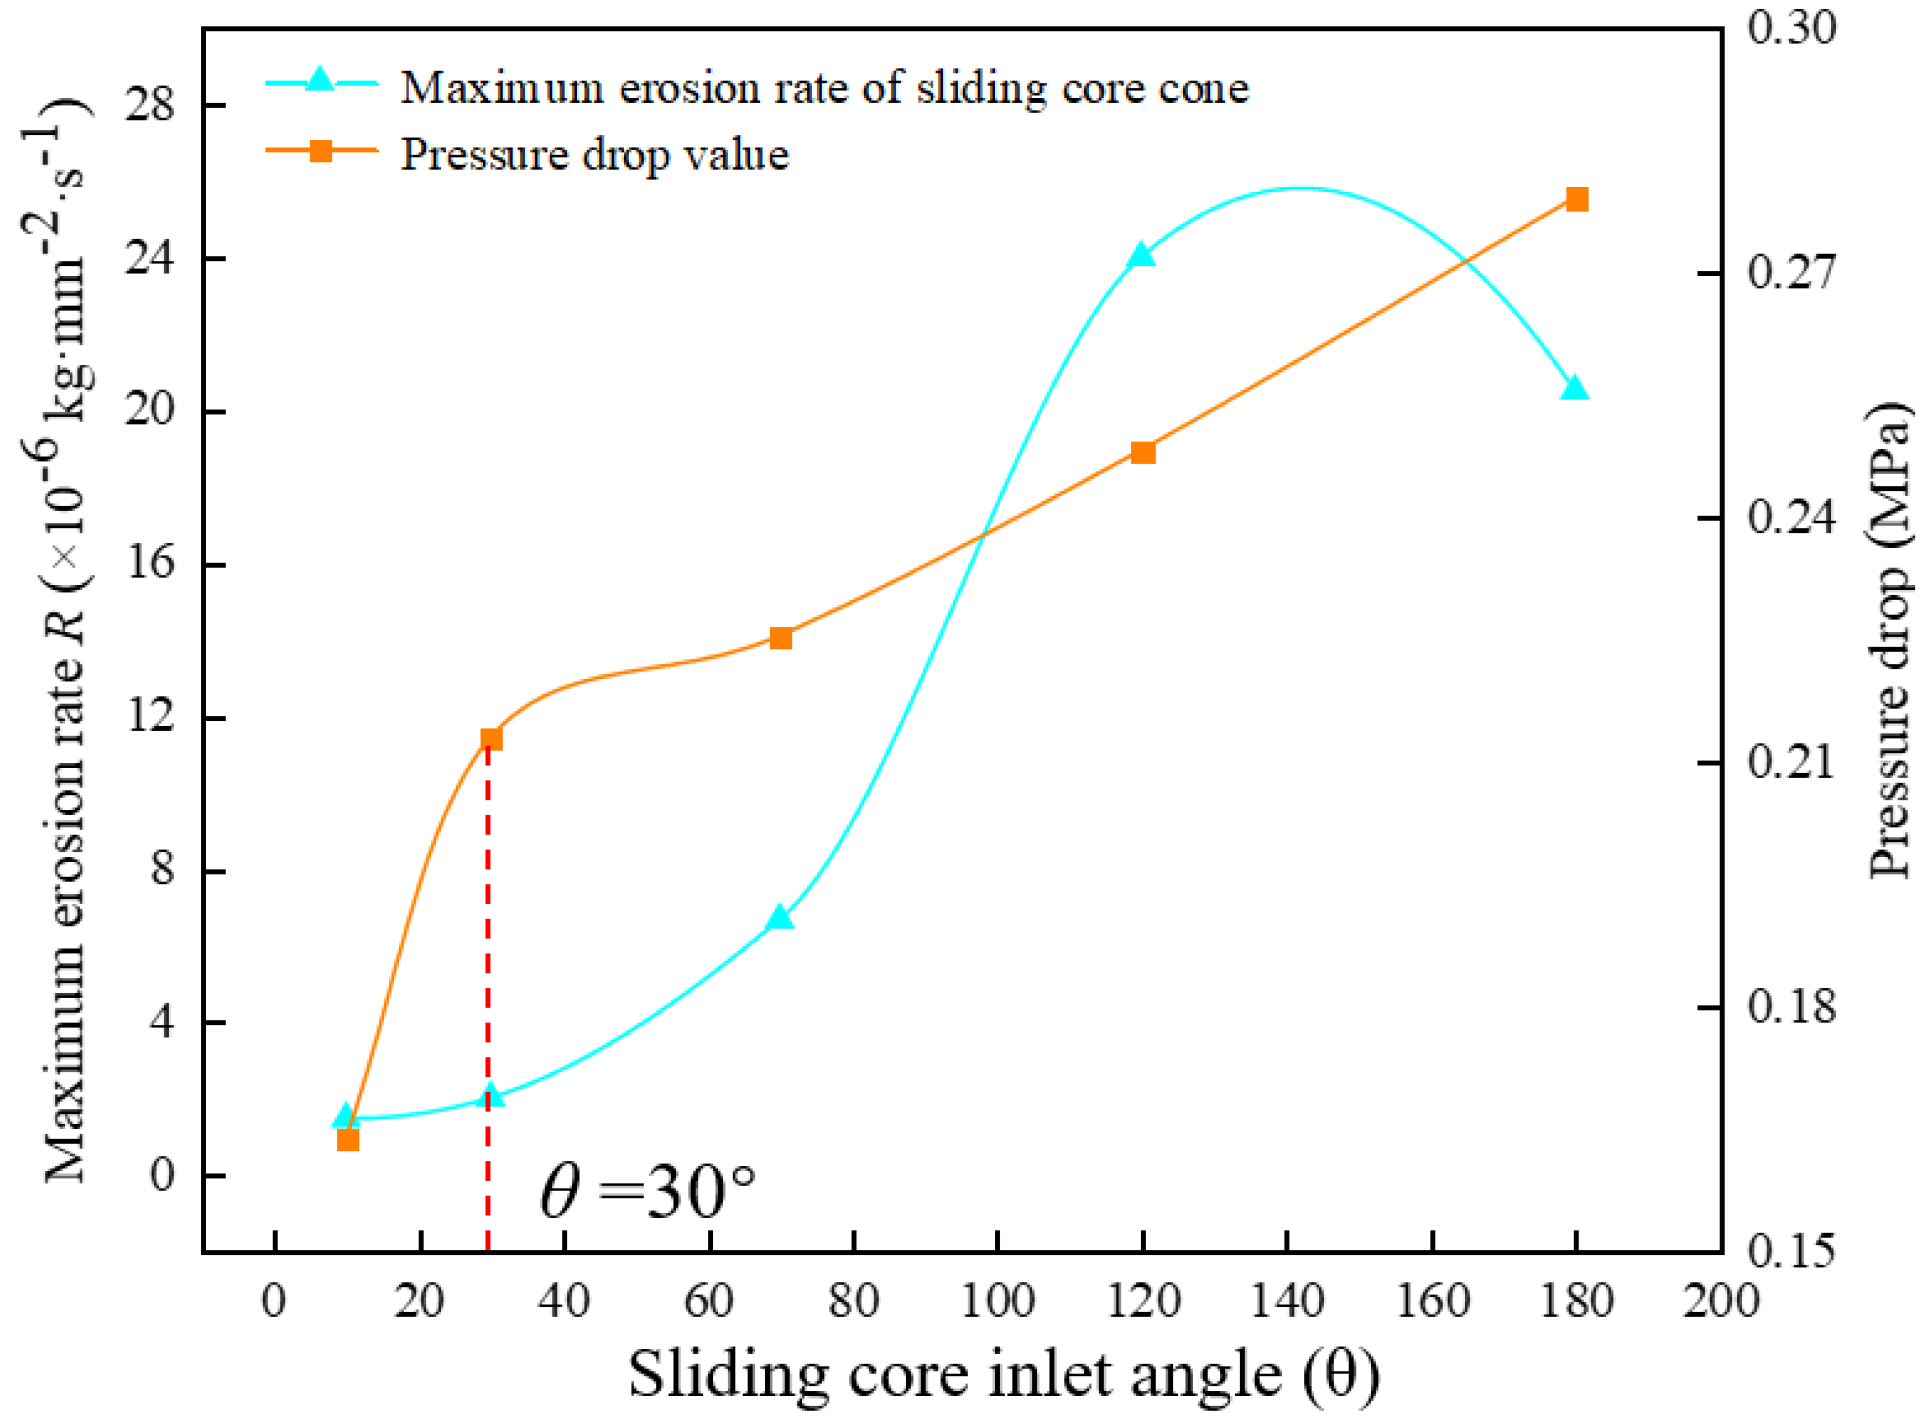
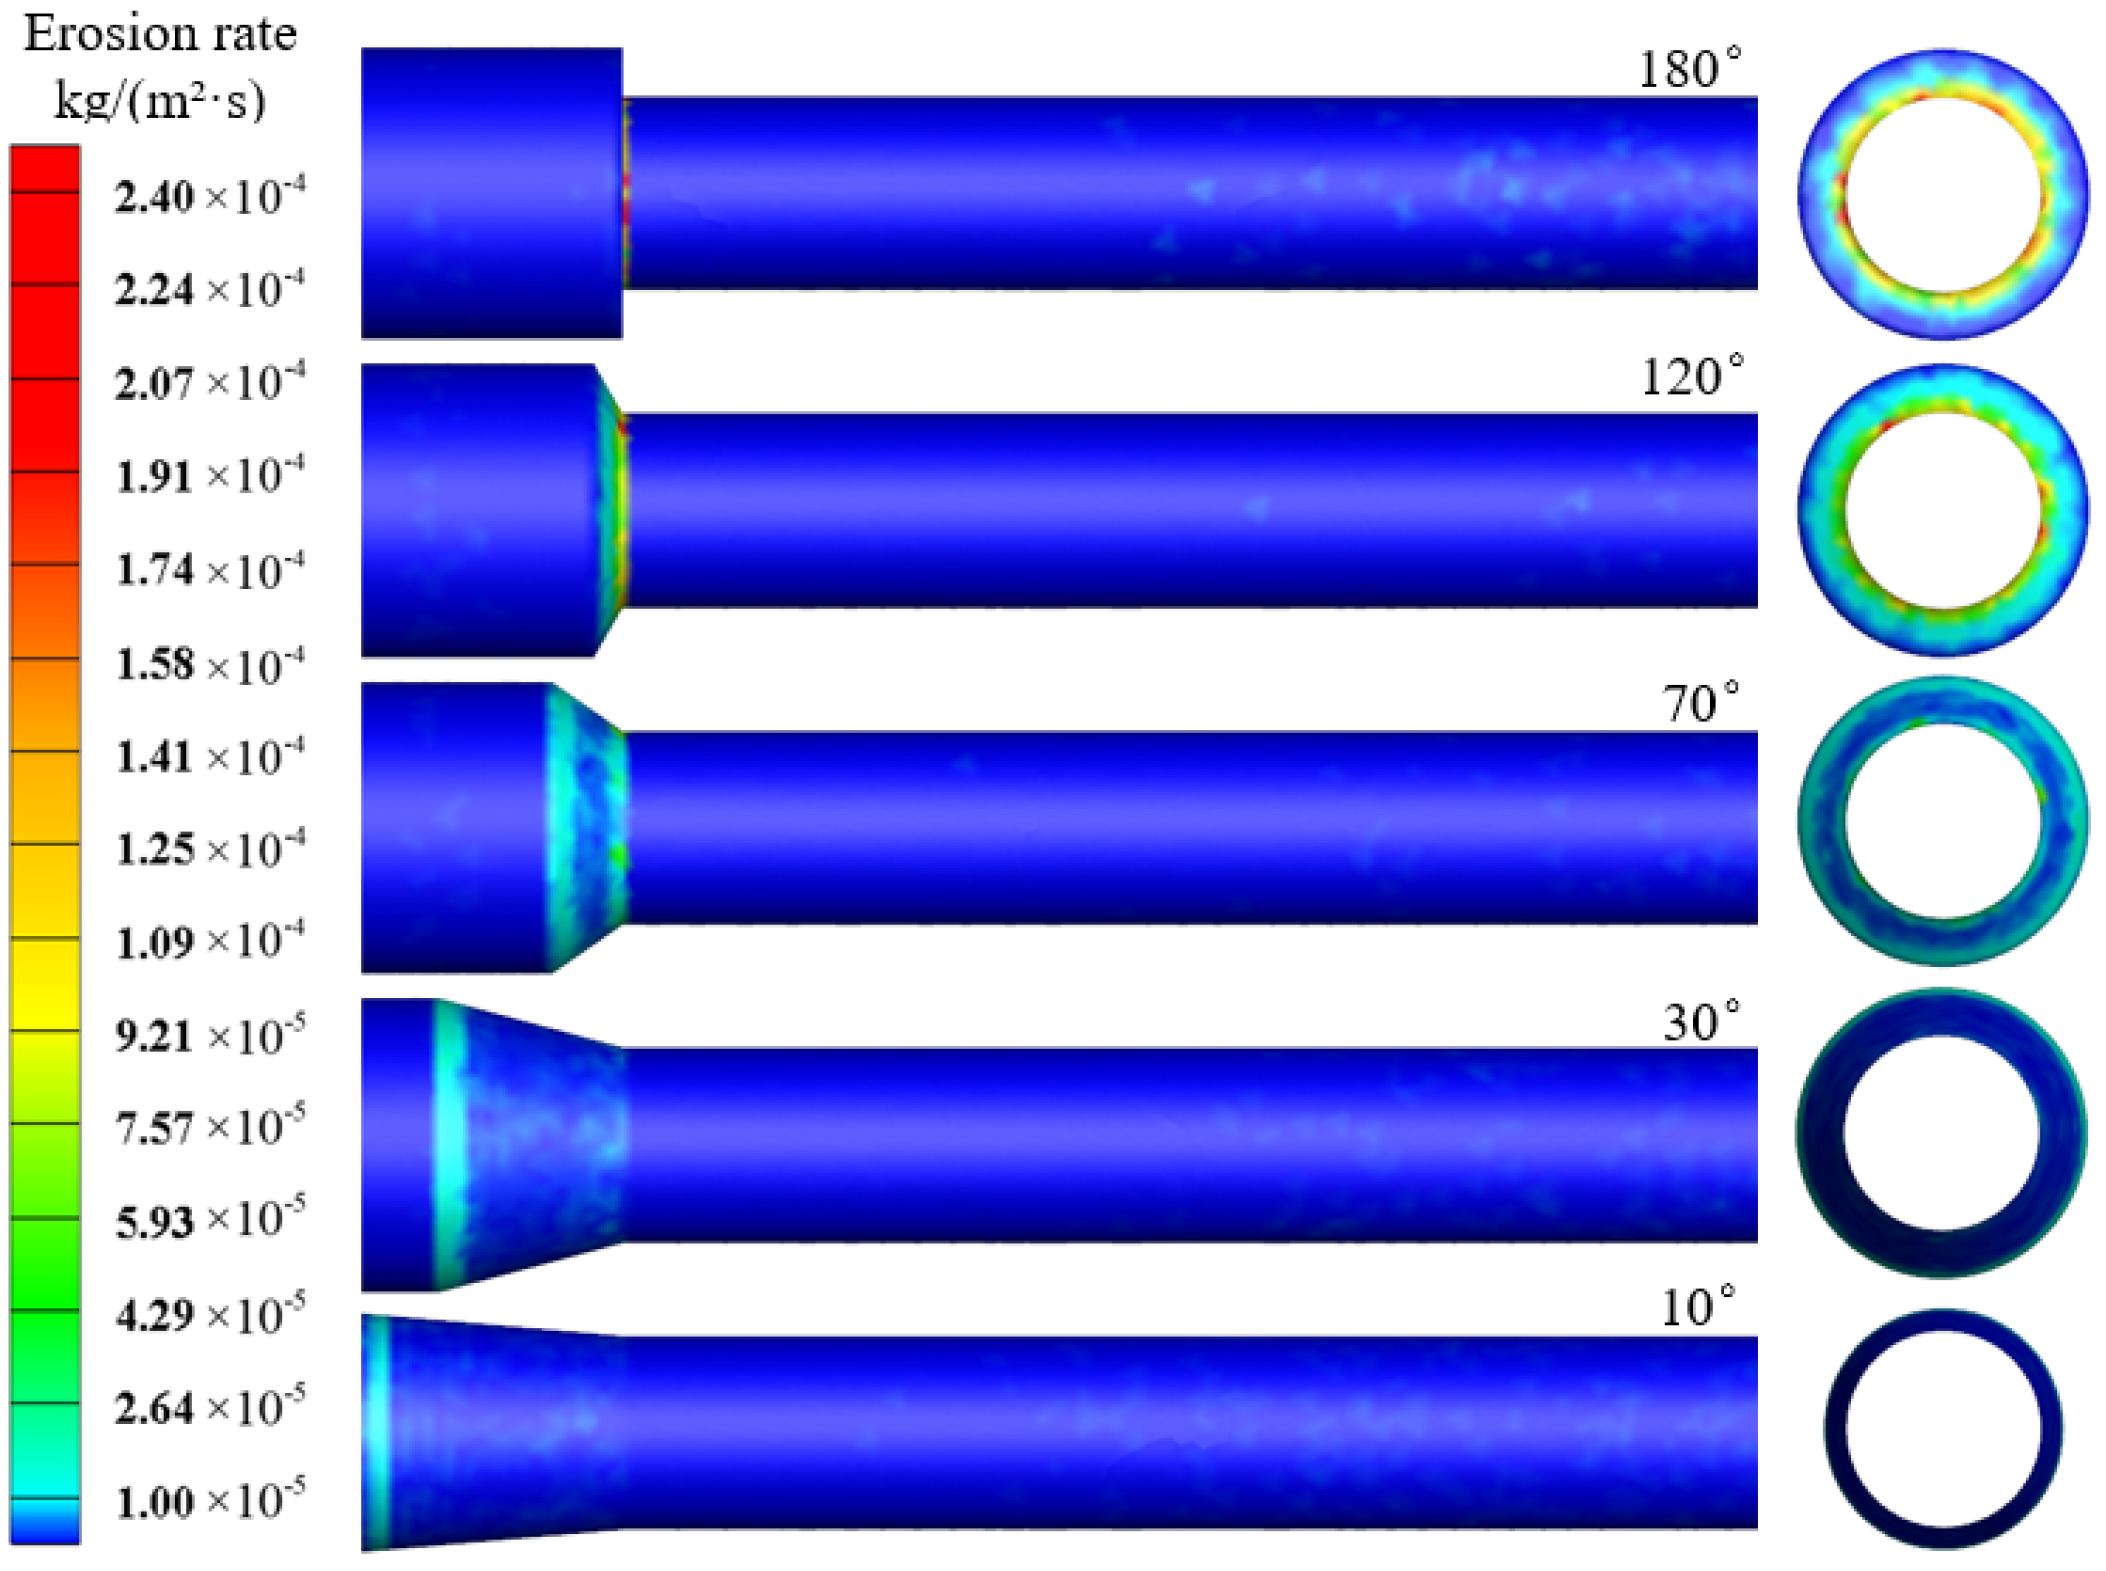
4.3.1. Influence of the Sliding Core Inlet Angle on Erosion Rate
4.3.2. Influence of Plug Angle on Erosion Rate
4.3.3. Influence of Plug Transition Distance on Erosion Rate
5. Conclusions
- (1)
- There are four erosion-prone areas in the PCIT, including the sliding core cone, the plug transition section, the plug surface, and the axial flow passage. These four areas should be considered and strengthened in the design and processing.
- (2)
- The maximum erosion rate and erosion area in the easy erosion area increase with the increase of solid particle diameter. The average maximum erosion rate increased by 63.4 times when the particle size changed from 0.1 to 1.1 mm, which exceeded other influencing factors such as mass flow rate and drilling fluid flow rate. Therefore, it was considered that the solid particle diameter was the main factor affecting the growth of the maximum erosion rate. When the solid particle diameter was less than 0.3 mm, the erosion of each part of the PCIT was better. The particle size of solid particles should be strictly controlled when configuring the drilling fluid, which can significantly reduce erosion.
- (3)
- With the increase of the sliding core inlet angle, the erosion of the sliding core cone is intensified. Therefore, considering the relationship between pressure drop, erosion rate, and inlet angle, the sliding core inlet angle should preferably be set to 30°. Under the same flow conditions, an inlet angle of 30° can cause the largest possible pressure drop while greatly improving the erosion of the sliding core cone. At the same time, the top angle of the plug should be set to 60°, and the distance of the plug transition section should be greater than 30 mm, so that the erosion rate of the plug surface and the plug transition section can be effectively reduced.
Author Contributions
Funding
Institutional Review Board Statement
Informed Consent Statement
Data Availability Statement
Conflicts of Interest
References
- Kajiyama, S.; Wu, Y.; Hyodo, M. Experimental investigation on the mechanical properties of methane hydrate-bearing sand formed with rounded particles. J. Nat. Gas Sci. Eng. 2017, 45, 96–107. [Google Scholar] [CrossRef]
- Zhou, S.W.; Li, Q.Y.; Lv, X. Key issues in development of offshore natural gas hydrate. Front. Energy 2020, 14, 433–442. [Google Scholar] [CrossRef]
- Sloan, E.D. Fundamental principles and applications of natural gas hydrates. Nature 2003, 426, 353–359. [Google Scholar] [CrossRef]
- Liu, J.J.; Shao, Z.L.; Wu, M.Y. Heat and mass transfer analysis of depressurization-induced hydrate decomposition with different temperatures of over-and under burden. J. Nat. Gas Sci. Eng. 2017, 44, 65–76. [Google Scholar] [CrossRef]
- Feng, Y.; Chen, L.; Suzuki, A. Numerical analysis of gas production from layered methane hydrate reservoirs by depressurization. Energy 2019, 166, 1106–1119. [Google Scholar] [CrossRef]
- Gambelli, A.M.; Rossi, F. Natural gas hydrates: Comparison between two different applications of thermal stimulation for performing CO2 replacement. Energy 2019, 172, 423–434. [Google Scholar] [CrossRef]
- Xu, C.G.; Cai, J.; Yu, Y.S. Effect of pressure on methane recovery from natural gas hydrates by methane-carbon dioxide replacement. Appl. Energy 2018, 217, 527–536. [Google Scholar] [CrossRef]
- Wang, Y.; Feng, J.C.; Li, X.S.; Zhang, Y. Experimental investigation of optimization of well spacing for gas recovery from methane hydrate reservoir in sandy sediment by heat stimulation. Appl. Energy 2017, 207, 562–572. [Google Scholar] [CrossRef]
- Chen, C.; Pan, D.B.; Yang, L. Investigation into the water jet erosion efficiency of hydrate-bearing sediments based on the arbitrary Lagrangian-Eulerian method. Appl. Sci. 2019, 9, 182. [Google Scholar] [CrossRef] [Green Version]
- Li, Z.Z.; Guo, X.Q.; Yang, L.Y. Exploitation of methane in the hydrate by use of carbon dioxide in the presence of sodium chloride. Pet. Sci. 2009, 6, 426–432. [Google Scholar] [CrossRef] [Green Version]
- Zhou, S.W.; Zhao, J.Z.; Li, Q.Y. Optimal design of the engineering parameters for the first global trial production of marine natural gas hydrates through solid fluidization. Nat. Gas Ind. B 2018, 5, 118–131. [Google Scholar] [CrossRef]
- Wang, L.Z.; Wang, G.R. Experimental and Theoretical Study on the Critical Breaking Velocity of Marine Natural Gas Hydrate Sediments Breaking by Water Jet. Energies 2020, 13, 1725. [Google Scholar] [CrossRef] [Green Version]
- Zhou, S.W.; Chen, W.; Li, Q.P. The green solid fluidization development principle of natural gas hydrate stored in shallow layers of deep water. China Offshore Oil Gas 2014, 26, 1–7. [Google Scholar]
- Wei, N.; Sun, W.T.; Meng, Y.T. Multiphase non-equilibrium pipe flow behaviors in the solid fluidization exploitation of marine natural gas hydrate reservoir. Energy Sci. Eng. 2018, 6, 760–782. [Google Scholar] [CrossRef] [Green Version]
- Tang, Y.; Yao, J.X.; He, Y.; Sun, P.; Jing, X. Study on pressure-controlled sliding sleeve of jet breaking for natural gas hydrate mining based on throttle pressure drop principle. Energy Sci. Eng. 2020, 8, 1422–1437. [Google Scholar] [CrossRef]
- Tang, Y.; Huang, S.X.; Yao, J.X.; Liu, Q.Y.; Wang, G.R.; Zhou, S.W. An Automatic Jet Breaking Tool for Solid-State Fluidized Exploitation of Natural Gas Hydrate. U.S. Patent No. 11,193,333, 17 January 2020. [Google Scholar]
- Yi, X.Z.; Peng, Z.; Zhou, Y.H. Numerical simulation for erosion behavior of high-pressure fracturing fluids on JY-50 fracturing bend pipe. Surf. Technol. 2019, 48, 144–151. [Google Scholar]
- Huang, Z.Q.; Xie, D.; Huang, X.B. Analytical and experimental research on erosion wear law of drill pipe in gas drilling. Eng. Fail. Anal. 2017, 79, 615–624. [Google Scholar] [CrossRef]
- Huang, Y.; Yin, K.; Zhu, L.H. Numerical simulation of swivel bend wear in reverse circulation drilling. J. Cent. South Univ. 2013, 44, 2052059. [Google Scholar]
- Wang, G.R.; Chu, F.; Tao, S.Y. Optimization design for throttle valve of managed pressure drilling based on CFD erosion simulation and response surface methodology. Wear 2015, 338, 114–121. [Google Scholar] [CrossRef]
- Jafari, A.; Dehghani, K.; Bahaaddini, K. Experimental comparison of abrasive and erosive wear characteristics of four wear-resistant steels. Wear 2018, 416, 14–26. [Google Scholar] [CrossRef]
- Habib, M.A.; Ben-Mansour, R.; Badr, H.M. Erosion and penetration rates of a pipe protruded in a sudden contraction. Comput. Fluids 2008, 37, 146–160. [Google Scholar] [CrossRef]
- Alfonsi, G. Reynolds-averaged Navier-Stokes equations for turbulence modeling. Appl. Mech. Rev. 2009, 62, 4–20. [Google Scholar] [CrossRef]
- Hinze, J.O. Turbulence; Mc Graw Hill: New York, NY, USA, 1975. [Google Scholar]
- Chintala, V.; Subramanian, K.A. A CFD (computational fluid dynamics) study for optimization of gas injector orientation for performance improvement of a dual-fuel diesel engine. Energy 2013, 57, 709–721. [Google Scholar] [CrossRef]
- Ji, M.K.; Utomo, T.; Woo, J.S.; Lee, Y.H.; Jeong, H.M.; Chung, H.S. CFD investigation on the flow structure inside thermo vapor compressor. Energy 2010, 35, 2694–2702. [Google Scholar] [CrossRef]
- Dickenson, J.A.; Sansalone, J.J. Discrete phase model representation of Particulate Matter (PM) for simulating PM separation by hydrodynamic unit operations. Environ. Sci. Technol. 2009, 43, 8220–8226. [Google Scholar] [CrossRef]
- Frawley, P.; Corish, J.; Niven, A.; Geron, M. Combination of CFD and DOE to analyse solid particle erosion in elbows. Int. J. Comput. Fluid Dyn. 2009, 23, 411–426. [Google Scholar] [CrossRef]
- Grant, G.; Tabakoff, W. Erosion prediction in turbomachinery resulting from environmental solid particles. J. Aircr. 1975, 12, 471–478. [Google Scholar] [CrossRef]
- Forder, A.; Thew, M.; Harrison, D. A numerical investigation of solid particle erosion experienced within oilfield control valves. Wear 1998, 216, 184–193. [Google Scholar] [CrossRef]


| Impact Angle (°) | |
|---|---|
| 0 | 0 |
| 20 | 0.8 |
| 30 | 1 |
| 45 | 0.5 |
| 90 | 0.4 |
Publisher’s Note: MDPI stays neutral with regard to jurisdictional claims in published maps and institutional affiliations. |
© 2022 by the authors. Licensee MDPI, Basel, Switzerland. This article is an open access article distributed under the terms and conditions of the Creative Commons Attribution (CC BY) license (https://creativecommons.org/licenses/by/4.0/).
Share and Cite
Tang, Y.; Zhao, P.; Fang, X.; Wang, G.; Zhong, L.; Li, X. Numerical Simulation on Erosion Wear Law of Pressure-Controlled Injection Tool in Solid Fluidization Exploitation of the Deep-Water Natural Gas Hydrate. Energies 2022, 15, 5314. https://doi.org/10.3390/en15155314
Tang Y, Zhao P, Fang X, Wang G, Zhong L, Li X. Numerical Simulation on Erosion Wear Law of Pressure-Controlled Injection Tool in Solid Fluidization Exploitation of the Deep-Water Natural Gas Hydrate. Energies. 2022; 15(15):5314. https://doi.org/10.3390/en15155314
Chicago/Turabian StyleTang, Yang, Peng Zhao, Xiaoyu Fang, Guorong Wang, Lin Zhong, and Xushen Li. 2022. "Numerical Simulation on Erosion Wear Law of Pressure-Controlled Injection Tool in Solid Fluidization Exploitation of the Deep-Water Natural Gas Hydrate" Energies 15, no. 15: 5314. https://doi.org/10.3390/en15155314
APA StyleTang, Y., Zhao, P., Fang, X., Wang, G., Zhong, L., & Li, X. (2022). Numerical Simulation on Erosion Wear Law of Pressure-Controlled Injection Tool in Solid Fluidization Exploitation of the Deep-Water Natural Gas Hydrate. Energies, 15(15), 5314. https://doi.org/10.3390/en15155314