Article

Artificial Electric Field Algorithm-Pattern Search for Many-Criteria Networks Reconfiguration Considering Power Quality and Energy Not Supplied

by
Abdulaziz Alanazi
1,* and
Mohana Alanazi
2
1
Department of Electrical Engineering, College of Engineering, Northern Border University, Arar 73222, Saudi Arabia
2
Electrical Engineering Department, College of Engineering, Jouf University, Sakaka 72388, Saudi Arabia
*
Author to whom correspondence should be addressed.
Energies 2022, 15(14), 5269; https://doi.org/10.3390/en15145269
Submission received: 15 June 2022 / Revised: 16 July 2022 / Accepted: 18 July 2022 / Published: 20 July 2022
(This article belongs to the Special Issue Building Simulation Tool and Model)

Abstract

:
Considering different objectives and using powerful optimization methods in the distribution networks reconfiguration by accurately achieving the best network configuration can further improve network performance. In this paper, reconfiguration of radial distribution networks is performed to minimize the power loss, voltage sag, voltage unbalance, and energy not supplied (ENS) of customers using a new intelligent artificial electric field algorithm-pattern search (AEFAPS) method based on the many-criteria optimization approach. The voltage sag and voltage unbalance are defined as power quality indices and the ENS is the reliability index. In this study, the pattern search (PS) algorithm enhances the artificial electric field algorithm’s (AEFA) flexibility search both globally and locally. AEFAPS is applied to determine the decision variables as open switches of the networks considering the objective function and operational constraints. The proposed methodology based on AEFAPS is performed on an unbalanced 33-bus IEEE standard network and a real unbalanced 13-bus network. The reconfiguration problem is implemented in single-criterion and many-criteria optimization approaches to evaluate the proposed methodology’s effectiveness using different algorithms. The single-criterion results demonstrated that some power quality indices might be out of range, while all indices are within the permitted range in the many-criteria optimization approach, proving the effectiveness of the proposed many-criteria reconfiguration with logical compromise between different objectives. The results show that AEFAPS identified the network configuration optimally and different objectives are improved considerably compared to the base network. The results confirmed the superior capability of AEFAPS to obtain better objective values and lower values of losses, voltage sag, voltage unbalance, and ENS compared with conventional AEFA, particle swarm optimization (PSO), and grey wolf optimizer (GWO). Moreover, the better performance of AEFAPS is proved in solving the reconfiguration problem compared with previous studies.

Graphical Abstract

1. Introduction

Several studies have been performed in the past decade to improve the distribution network qualities through loss reduction, voltage deviations reduction, and voltage stability improvement in these networks [1]. Primary methods that suggest loss reduction in the distribution networks include distributed generations (DGs), the optimal use of capacitors, and network reconfiguration [2]. Network reconfiguration is one of the important benefits of network automation. Reconfiguration is a low-cost method for reducing the losses of distribution networks because this method has less need for additional equipment and high costs to reduce losses induced by the capacitor methods and use of DG resources [3]. Reconfiguration changes the distribution network topology by modifying the state of the operational switches in the network and directing the power flow on the distribution network, thereby fulfilling the objectives at the network level considering the operational constraints [4,5]. In other words, the operational switches, in addition to the task of network protection, affect the network configuration and change the network power flow direction, reducing the losses and voltage deviation [6,7].
Furthermore, distribution networks are usually operated as radial, which must be preserved during the reconfiguration process [6,7]. Distribution network automation has become increasingly important. Automation enhances system reliability and power quality. The network restructuring with the reconfiguration causes changes to the current through the lines, the bus voltages, and the unbalanced voltage. Since the current path impedance is also varied, voltage sags also change. Therefore, voltage sag and voltage unbalance as power quality indices can cause some sensitive loads outage. Thus, enhancing the voltage sag and unbalance can enhance the power quality, reduce network loss, and improve reliability [8,9].
Moreover, the most basic purpose of the power systems is to continue to supply cheap, affordable, and desirable quality to the distribution network customers. However, for reasons such as failures in components applied in the distribution network and both predictable and unpredictable faults, the energy will not be available forever and electricity interruption will probably occur. Thus, the assessment of the reliability of power systems is critical. In other words, considering the outage of the network lines, a possible part of the network load may be interrupted; as a result, it is of high importance to assess the reliability of the distribution network [8,9]. Instead, the exact reconfiguration of distribution networks requires consideration of different and important objectives in the distribution network for accurate network operation. As a result, the comprehensive objectives will further improve the performance of distribution networks. Furthermore, in solving the reconfiguration problem, using powerful algorithms with high optimization and computing power can achieve the best network configuration with further improvement of the reconfiguration objectives.
Regarding the electricity network reconfiguration, various studies have been performed based on different objective functions and optimization methods. Heuristic, meta-heuristic, and traditional programming methods are applied to solve the reconfiguration problem. In [10], network reconfiguration is performed to minimize the voltage and current unbalance using a selective bat algorithm. In [4], an improved equilibrium optimization algorithm is presented for solving the reconfiguration problem with the aim of loss minimization and voltage stability improvement. In [11], the reconfiguration problem is developed using a modified marine predators optimizer (MMPO) for a radial balanced distribution network to minimize the losses and voltage deviations. In [12], a heap-based algorithm with a deeper exploitative feature is presented for feeder reconfiguration to minimize power losses and voltage stability enhancement. The heuristic approach based on intelligent algorithms is used to configure the distribution network to obtain minimum losses [13]. Based on mathematical optimization theory, all possible network modes are considered in the switches’ open and closed positions in the reconfiguration method. Therefore, they are more complex than the heuristic method and have a longer runtime. Artificial intelligence techniques and theories have been recently used for electricity network optimization. These methods can easily process a direct search for a global optimum [14]. In [14], Pareto front analysis is applied to multi-objective distribution network reconfiguration considering losses and reliability using multi-objective binary particle swarm optimization (MBPSO). In [15], the single-criterion reconfiguration of a network as balanced is developed to minimize losses via ant colony optimization (ACO). In [16], the taboo search (TS) is used for optimal network reconfiguration as a single-criterion problem by minimizing the losses considering the changing situation of the network switches. In [17], the reconfiguration problem is developed via an adaptive cuckoo search algorithm (ACSA) to find the optimal network configuration in a balanced network with the aim of loss minimization and voltage profile enhancement via weighted coefficients. In [18], the balanced network reconfiguration is performed with losses reduction and voltage profile enhancement is achieved as a multi-criteria optimization using the weight coefficient method using the cuckoo search algorithm (CSA). The proposed method in [18] checks the network radiality in the reconfiguration process. The results in [18] indicated the superiority of the CSA over particle swarm optimization (PSO). In [19], a multi-objective optimization reconfiguration of the distribution network is presented to maximize the hosting capacity considering the allocation of soft open points. In [20], the discrete teaching–learning algorithm is used to solve the reconfiguration of a balanced network to minimize losses and voltage deviation with the weight coefficient method. In [21], the reconfiguration of an electricity network as balanced is investigated to enhance network reliability via the bat algorithm (BA). In [22], power quality and reliability enhancement of a balanced distribution network based on the reconfiguration is developed by applying the quantum firefly algorithm (FA). In [12], the network reconfiguration is evaluated to enhance the power quality using the genetic algorithm (GA). In [23], the balanced network reconfiguration is presented via a harmony search method for loss minimization. In [15], the balanced network reconfiguration is studied for loss minimization using ACO. In [24], the balanced network reconfiguration is performed to minimize the losses and voltage deviations minimization via a plant growth simulation algorithm. A summary of the previous studies on reconfiguration is presented in Table 1.
By investigating the literature, it is observed that most of the research on the reconfiguration problem has worked considering balanced networks [25]. However, in real-life problems, electricity networks are operated unbalanced due to continuous load changes. Therefore, for a detailed study of the reconfiguration problem, considering a balanced network is not an appropriate approach [25]. To achieve the objectives of the reconfiguration, the distribution network should be considered unbalanced to find the optimal network configuration with the unbalanced behavior of the network customers’ demands. As a result, most reconfiguration studies have aimed to minimize the losses and voltage deviations, power quality, and network reliability enhancement.
In contrast, fewer studies have applied several objectives, including losses, power quality, and reliability, to solve the reconfiguration problem as a many-criteria optimization problem. In this paper, these objectives are considered together in a way to solve the many-criteria reconfiguration. The current study uses a new meta-heuristic intelligent method, the hybrid artificial electric field algorithm-pattern search (AEFAPS), to solve the many-criteria reconfiguration problem to find the optimal network configuration. The conventional AEFA [26] is modeled based on Coulomb’s law for electrostatic force and is a competitive method to solve optimization problems with a high convergence rate and accuracy.
Moreover, the conventional AEFA method may be trapped locally when problem dimensions increase. In this paper, the pattern search (PS) [27] is applied to improve the performance and flexibility of the local and global optimal search. Most of the many-criteria reconfiguration problems in previous studies have been solved with the weight coefficient method, which is the adjustment of weight coefficients using a trial-and-error way, which may reduce the problem accuracy. One of the powerful methods in solving a many-criteria problem is the many-criteria decision-making optimization method [28]. Many-criteria decision-making optimization involves real-world decision-making methods that help make decisions in the presence of a set of conflicting objectives and criteria. Therefore, in a many-criteria decision-making optimization problem, a set of solutions is obtained as Pareto sets instead of just one solution in single-criterion optimization. Nevertheless, as reported in [28], increasing the number of objectives poses a serious challenge, including the loss of selection pressure of Pareto dominance, the difficulty of estimating high dimensional space density, and the anti-convergence phenomenon, and the exponential increase in computational complexity. Therefore, Pareto-based evolutionary algorithms are used for a maximum of three objectives in the total objective function. In this study, due to considering four important objectives, many-criteria method-based decomposition is applied for reconfiguration problem-solving. Many-criteria decision-making optimization-based decomposition is a well-known and popular strategy for satisfactory performance and desirable efficiency of its implementation due to considering each objective as a vector. The meta-heuristic algorithm can solve the optimization problem by comprising all objectives into a participatory form.
In this study, unbalanced networks reconfiguration is presented considering the many-criteria method-based decomposition with the aim of loss minimization, enhancement of the voltage sag and voltage unbalance (enhancing the power quality), and reducing the customer’s energy not supplied (reliability enhancement) using the new AEFAPS meta-heuristic intelligent algorithm. The decision-making variable of the problem is considered network open switches (tie-lines), which are determined by the AEFAPS method. Therefore, the best configuration of the network is found because of open and closed switches based on the proposed method that achieves the minimum loss and the highest reliability and power quality. This paper evaluates the results of loss, power quality indices, and reliability with and without many criteria for decision-making reconfiguration of unbalanced distribution networks using AEFAPS. Moreover, the superiority of AEFAPS is compared with well-known PSO [29] and grey wolf optimizer (GWO) [30] in problem-solving.
The highlights of this study are as follows:
  • Network automation based on optimal reconfiguration;
  • Network reconfiguration with many-criteria decision-making optimization;
  • Using artificial electric field algorithm-pattern search (AEFAPS) for problem-solving;
  • Using pattern search in the suggested algorithm to improve global and local searches;
  • Superiority of AEFAPS compared with conventional AEFA, GWO, and PSO methods.
The rest of the paper is structured as follows: Section 2 describes the formulation of the problem. Section 3 describes the load flow problem and the branch exchange method. Section 4 presents the optimization algorithm. Section 5 presents the results of the findings. Section 6 concludes with the major findings of the paper.

2. Problem Formulation

This study considers many-criteria decision-making optimization-based decomposition for unbalanced distribution networks reconfiguring using AEFAPS. The formulation of objective function and constraints are presented below.

2.1. Objective Function

The objective function based on many criteria is defined considering losses, voltage sag and unbalance, and ENS.

2.1.1. Power Losses

The power loss is calculated by determining the buses’ voltage and also the line current by [11].
P l o s s = k = 1 l R k I k 2
where R k and I k   indicate the ohmic resistance and current magnitude of the k-th line, respectively, and l refers to the line’s number. Equation (1) is related to the active power losses of the distribution network based on the ohmic resistance and also current of the network lines.

2.1.2. Voltage Sag

This objective is achieved by evaluating the bus’s remaining voltage in the voltage sag condition. The average voltage sag in all buses is applied to enhance this objective of the entire network [4,6,10].
V   s a g . a v = 1 m   j = 1 m ( 1 n     i = 1 n V   i   j )  
where V   i   j is bus voltage magnitude i in the condition of the fault in bus j; i = 1, 2, …, n refers to the number of buses; j = 1, 2, …, m refers to the possible faults number, and V   s a g . a v denotes the bus voltage average in the condition of the voltage sag.
The voltage sag model is implemented via fault performing in the network. The fault current for a fault at bus p is based on the admittance matrix with the fault ( Y F a , b , c ), self-impedance of bus p ( Z p p a , b , c ), and pre-fault voltage at bus p ( E p ( o ) a , b , c ) and is determined as follows:
I p ( F a u l t ) a , b , c = Y F a , b , c ( U + Z p p a , b , c Y F a , b , c ) 1 E p ( o ) a , b , c
where U refers to the unity matrix.
Voltage drop is computed as follows:
V B u s ( F ) a , b , c = Z B u s a , b , c I B u s ( F ) a , b , c
where I p ( F a u l t ) refers to the pth current vector component I B u s ( F ) , E p ( o ) a , b , c refers to the bus p pre-fault voltage, Z B u s a , b , c refers to the three-phase network impedance matrix, Z p p a , b , c represents the bus p self-impedance, Y F a , b , c indicates the fault admittance matrix, V B u s ( F ) a , b , c refers to the three phases of bus voltage drop, and U denotes the unity matrix.
The rest of the bus voltage is computed as follows. The distribution network operation must minimize the voltage drop based on reconfiguration.
V s a g a , b , c = E B u s ( o ) a , b , c V B u s ( F ) a , b , c
where E B u s ( o ) a , b , c is the bus voltages magnitude without fault as three-phase, which is achieved with power flow in system frequency.

2.1.3. Voltage Unbalance

The unbalanced network is due to load unbalanced. The network unbalance value is computed by calculating the voltage unbalance of the buses.
Voltage unbalance in three-phase networks is caused by network load unbalance, which is defined by the sum of voltage unbalances of all network buses as follows [31]:
V   u n b , a v = 1 n   i = 1 n 100 | V N e g , i | | V P o s , i |
where V P o s , i indicates the bus i positive sequence and V N e g , i refers to the bus i negative sequence voltage magnitude.

2.1.4. Reliability

The objective function of the network reliability improvement or reduction of customers’ energy not supplied (ENS) is defined considering the load point and its energy consumption. The electrical power of some load points may be cut off due to a line outage. Therefore, based on the probability of the network line outage, the amount of power lost by network customers is defined as ENS, which aims to reduce this index and improve network reliability. Based on reconfiguration, the ENS value can be reduced by changing the position of the switches and consequently by changing the path of the power flow in the case of a network line outage. The ENS should be minimized and its value is calculated by [32]:
ENS = i = 1 n l ( P i × U i )
U i = λ i × r i
where nl is the load point, P i is an average of active power at load point i, λ i represents the line outage rate, U i is the unavailability of load point i, and r i indicates average outage time of the load point i.

2.2. Constraints

The many-criteria objective function should be optimized subject to the constraints below. These constraints are addressed under two categories: equality and inequality constraints [12].
  • Power balance
P i + j Q i = V a i   I   a i * + V b i   I   b i * + V c i   I   c i *         i = 1 , 2 , 3 , , n
  • Voltage constraint
The bus’s voltage should be in the allowed range.
V m i n V p i V   m a x ,                   p = a , b , c ,           i = 1 , 2 , 3 , , n
  • Lines constraint
The current of each line should not exceed a certain value as the maximum allowable current ( I p l m a x ).
I p l I p l m a x ,                   p = a , b , c ,                     l = 1 , 2 , 3 , , L
  • Voltage unbalance constraint
The voltage unbalance should not exceed a certain value ( V u n b m a x ).
| V P o s , i | | V N e g , i | V u n b m a x ,             i = 1 , 2 , 3 , , n
  • Voltage sag constraint
The voltage sag should not exceed a certain value ( V s a g m i n ).
V s a g , a v V s a g m i n
  • Network radiality
In the reconfiguration process, the radial configuration of the network must be guaranteed and does not have a ring mode configuration. Matrix A has one row for each network line and one column for each network bus, with array aij in row i and column j according to the following rule [16]:
aij = 0: if line i is not connected to bus j.
aij = 1: if line i, exit from bus j.
aij = −1: if line i enters bus j.
The matrix of bus incidence [16] is presented in the literature for a radiality check of the network during the reconfiguration process as follows:
det ( A ) = + 1   o r det ( A ) = 1   R a d i a l   a n d   det ( A ) = 0       N o t   r a d i a l
where A is the bus incidence matrix.

2.3. Many-Criteria Decision-Making Optimization

In problem-solving based on the fuzzy method, each objective is presented as a fuzzy membership function. The fuzzy values given by the membership functions to each objective function are between 0 and 1 and depend on how much improvement has been achieved. In many-objective optimization, a compromise should be made between different objectives. Therefore, the fuzzy index (μ) is defined for each objective. In [28], the authors show how each of the fuzzy indices for the objectives is formulated which is shown in Figure 1.
Since the four objectives, such as the loss, ENS, voltage sag, and unbalance, must be minimized, each of the corresponding membership functions must be defined. Moreover, for loss, ENS, voltage unbalance, and voltage sag, the membership function is formulated as follows:
μ l o s s = { o x m a x x l o s s x m a x x m i n 1 x l o s s x m a x x m a x x l o s s x m i n x m i n x l o s s
μ E N S = { o x m a x x E N S x m a x x m i n 1 x E N S x m a x x m a x x E N S x m i n x m i n x E N S  
μ U N = { o x m a x x U N x m a x x m i n 1 x U N x m a x x m a x x U N x m i n x m i n x U N  
μ V = { o x m a x x S a g x m a x x m i n 1 x S a g x m a x x m a x x S a g x m i n x m i n x S a g  
where x m a x and x m i n   are the upper and lower values of each objective, respectively. x m a x is the objective value in the base network, while x m i n is extracted as single-objective optimization with reconfiguration; thus, x is placed among x m a x and x m i n . As expressed by Equations (15)–(18), the nearest objective value to x m a x has a lower µ. Suppose the minimum of all μi is maximized. In that case, it means moving to the minimum value of all objectives and the minimization of different objectives is created simultaneously, which is formulated as follows [28]:
μ D ( x ) = m i n [ μ f 1 ( x ) , μ f 2 ( x ) , , μ f m ( x ) ]
max μ D ( x )         s . t .           h ( x ) = 0 ,         g ( x ) 0
where μ f 1 ( x ) , μ f 2 ( x ) , , μ f m ( x ) are the vectors of individual objective functions based on fuzzy indices, x refers to the decision variables vector, and h ( x ) and g ( x ) are constraints of equality and inequality, respectively.

3. Power Flow and Branch Exchange Method

Forward–backwards load flow is used to understudy the distribution networks. Each line is modeled by series impedance (resistance and inductance). A forward–backward sweeping iterative algorithm produces the load flow to achieve convergence and find the current of lines and bus voltages [12]. There are two basic steps in the forward–backward sweeping iterative algorithm; they are very easy to learn. These two steps are used for all radial networks and act as a ring. In the forward sweeper, first, the bus voltage is equal to 1 p.u and the current for each bus is easily obtained. In the forward sweeper, the current of each bus is obtained. The amount of voltage is updated from the end of the feeder. As stated, the voltage is set to 1 p.u and the bus flow is obtained. From this current, a new voltage is again obtained from the end of the feeder. The steps of load flow are as follows: The three-phase voltage for all phases is considered equal to the bus voltage of the slack (post). A load of each phase is determined as a positive sequence and 120 degrees of phase difference. In this step, the backward load flow is achieved. Start from the ending bus and proceed to the sending bus and update the upstream lines’ current as follows: the current of the upstream branch equals the current of all the downstream lines that begin from the ending bus of the upstream branch (this step is repeated until the determination of the branches’ current). The forward load flow is then achieved. Move from the sending to the ending bus of the network to calculate the ending bus voltage of each line as follows [13]:
V d o w n a , b , c = V u p a , b , c Z u p , d o w n a , b , c I u p , d o w n a , b , c
where V d o w n a ,   b ,   c is the voltage of each phase of the bus (load side), which is referred to the lower bus (Figure 2); V u p a ,   b ,   c stands for the phase voltage of each sending bus of the line between up and down buses; Z u p ,   d o w n a ,   b ,   c is branch impedance; and I u p ,   d o w n a ,   b ,   c signifies the current of the line between up and down buses.
The forward load flow stage is then continued until all bus voltages are calculated. The forward–backward load flow steps are repeated until convergence conditions are achieved. With this load flow, the voltage of all buses is calculated at the main frequency.
To evaluate the radiality of the network, the branch exchange method has been applied. In order to maintain radiality, by closing one line another line should be opened so that the ring does not form and the network is still radial. This process is presented in Figure 2a, where t represents a tie-line. The load that connects to the bus n feeds through p-q-r lines. The power supply path to the bus n can be modified by closing the tie-line t and opening the line r to the p-s-t (Figure 2b). The advantage of this method is that the radiality of the network is automatically met, and it requires no computing and other algorithms to detect the radial mode of the network [13].

4. Proposed Optimizer

The fuzzy many-criteria reconfiguration is presented for minimizing the losses, power quality, and reliability enhancement using the meta-heuristic AEFAPS algorithm. One of the optimization variables is the situation of distribution network opened lines determined using AEFAPS. In this section, the AEFAPS method is formulated.

4.1. Overview of AEFA

The AEFA is modeled with Coulomb’s law for electrostatic force. This law describes the electrostatic reactions between the electrical charges. In the conventional AEFA, the charged particles are selected as agents, and each agent’s resistance is evaluated based on its charges. The conventional AEFA algorithm is modeled based on electrostatic attraction force. The first law of Coulomb says that the particles of the same name have repellent properties. Otherwise, the particles pull each other, with the second law of Coulomb also stating that there is an attractive force among opposing charges and repulsive force between same-name charges, which is directly related to the multiplication of the charges and conversely related to their distances. Suppose the position of the i-th particle considering d-dimension searching as ( X i = ( x i 1 , x i 1 , , x i d ) , i = 1 , 2 , , N ), where xid refers to the i-th particle position. The best position with the best fitness obtained from particles is determined. The best fitness position achieved by any particle i is defined by [26]:
p i d ( t + 1 ) = { p i d ( t ) ; f ( p i ( t ) ) < f ( x i ( t + 1 ) ) x i d ( t + 1 ) ;   f ( x i ( t + 1 ) ) f ( p i ( t ) )
Optimal fitness is defined as Pbest = Xbest.
The force of the charge i inserted by the charge j is calculated by [26]:
F i j d ( t ) = K ( t ) Q i ( t ) Q j ( t ) ( p j d ( t ) x i d ( t ) ) R i j ( t ) + ε
where Qi(t) and Qj(t) refer to the charged particles of i and j, K(t) indicates the constant of Coulomb, ε is a small constant, and Rij(t) is defined as the Euclidean distance among two charged particles of i and j and is calculated by [26]:
R i j ( t ) = X i ( t ) , X j ( t )
The K(t) is based on the iteration number and max iter action (max iter), which is defined by [26]:
K ( t ) = K 0 e x p ( α i t e r max i t e r )
where α refers to the parameter and K0 is the initial value. The inserted electric force on particle i via the other particles is defined in d search space at time t as follows [26]:
F i d ( t ) = j = 1 , j i N r a n d ( ) F i j d ( t )
where rand() indicates a uniform random number in [0, 1], N clears the number of particles, and Fi refers to the force inserted into charged particle i.
The particle (i) electrical force in d-th dimension search space is defined by:
E i d ( t ) = F i d ( t ) Q i ( t )
So, applying Newton’s Second Law of Motion, the particle i acceleration is defined by [26]:
a i d ( t ) = Q i ( t ) E i d ( t ) M i ( t )
Mi(t) clears the particle mass of i considering the iteration t. The velocity of the charged particle and its position are updated by [27]:
V i d ( t + 1 ) = r a n d ( ) V i d ( t ) + a i d ( t )
X i d ( t + 1 ) = X i d ( t ) + V i d ( t + 1 )
For the minimization or maximization problem, the fitness should have a downward or upward trend, respectively [26].
Q i ( t ) = Q j ( t )         i , j = 1 , 2 , , N
q i ( t ) = e x p ( f i t p i ( t ) w o r s t ( t ) b e s t ( t ) w o r s t ( t ) )
Q i ( t ) = q i ( t ) i = 1 N q i ( t )
where fiti refers to the fitness of particle i. The values of best and worst fitness for fitness maximization are formulated by [27]:
b e s t ( t ) = max ( f i t j ( t ) ) , j ( 1 , 2 , , N )
w o r s t ( t ) = min ( f i t j ( t ) ) , j ( 1 , 2 , , N )
For the problem with the minimization approach, the values of best and worst fitness are presented by [26]:
b e s t ( t ) = min ( f i t j ( t ) ) , j ( 1 , 2 , , N )
w o r s t ( t ) = max ( f i t j ( t ) ) , j ( 1 , 2 , , N )

4.2. Overview of AEFAPS

Direct search techniques are referred to the intelligent algorithms that are applied for solving constrained problems. One of these methods is the pattern search (PS) algorithm, a desirable algorithm for optimization problem solving [27]. The algorithm begins by creating the points around the initial starting point that can be provided by the user or derived from the calculation results of the previous steps. All processes for creating this set of points are called meshes, being mesh points performed by adding the initial point size to pattern vectors. Therefore, the algorithm steps are presented below:
Step 1: PS begins with the initial point of X 0 given by the user.
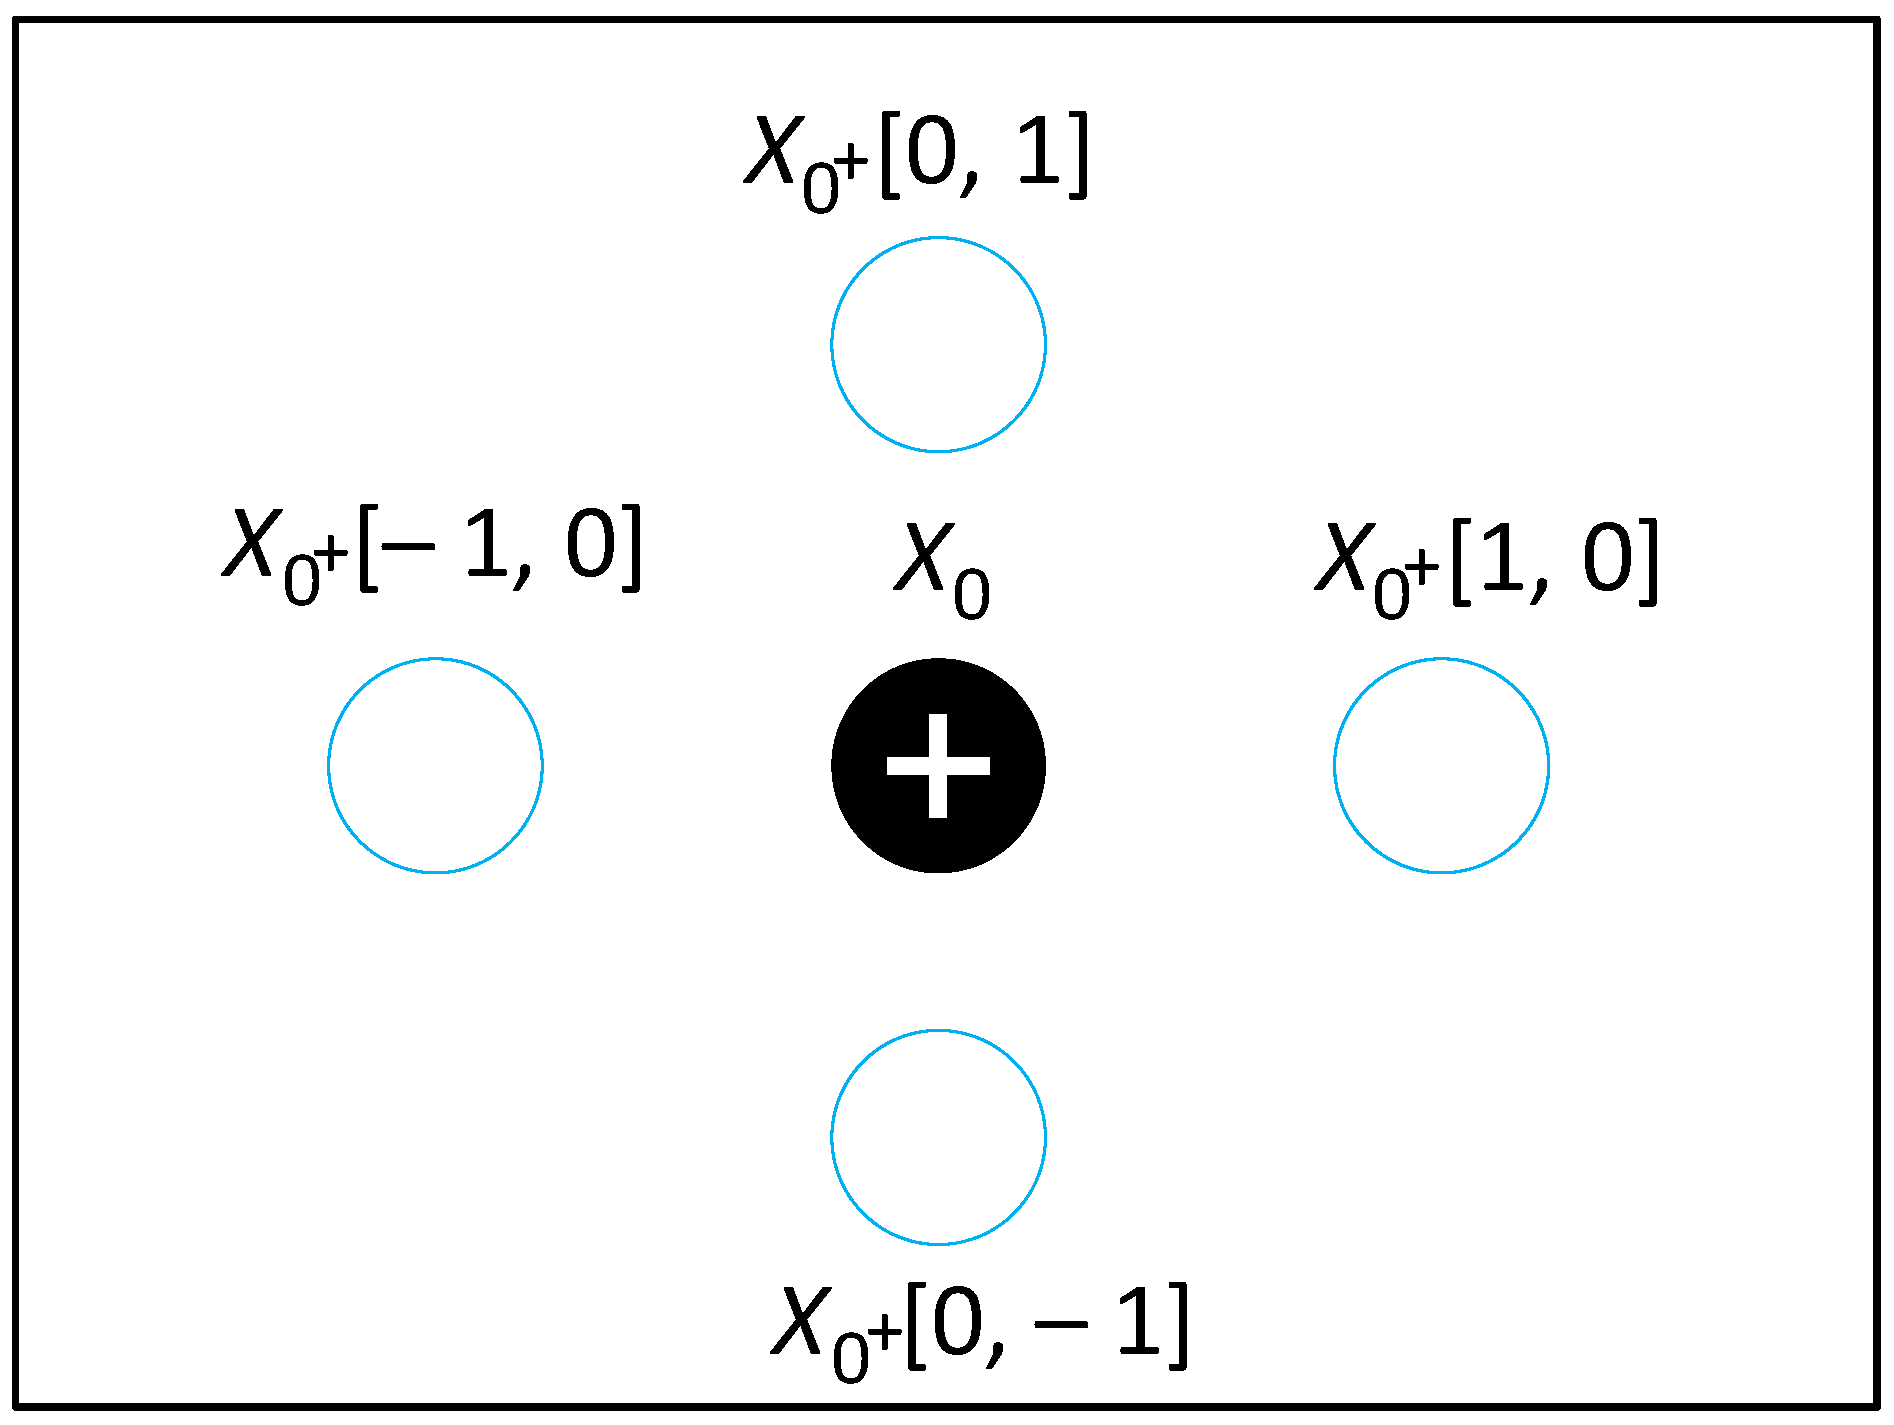
Step 2: Four unit vectors are constructed in the form of [1, 0], [0, 1], [−1, 0], and [0, −1] as the intervals of the initial environment of the search.
Step 3: The initial point X 0 is added to the unit vectors, with the fitness computed for the obtained new points. The formation of the mesh is shown in Figure 3.
Step 4: At this step, it is determined whether the objective function value for one of these points is lower than the fitness value for the initial point of the X 0 . If such a point exists, it is said that a successful selection occurs, and the algorithm places this point as X 1 . Therefore, the mesh changes as follows:
2 × [ 1 , 0 ] + X 1 , 2 × [ 0 , 1 ] + X 1
2 × [ 1 , 0 ] + X 1 , 2 × [ 0 , 1 ] + X 1  
Step 5: If at each step the fitness value for that step is larger than the value of the objective functions generated by each of the generated X (mesh points), then there will be an unsuccessful selection. For this unsuccessful selection, the algorithm multiplies the size of the mesh by a decreasing factor (typically 0.5).
The algorithm continues to find an optimal solution to minimize the objective function and stops when one of the following factors occurs:
(a)
The size of the mesh is lowering its defined value.
(b)
The iteration number reaches the predetermined value.
(c)
The distance between points determined in a desirable selection and the point determined in the following desirable selection is lower than the allowable value.
(d)
Changing the fitness from a desirable selection to another successful selection is lower than the allowable value.
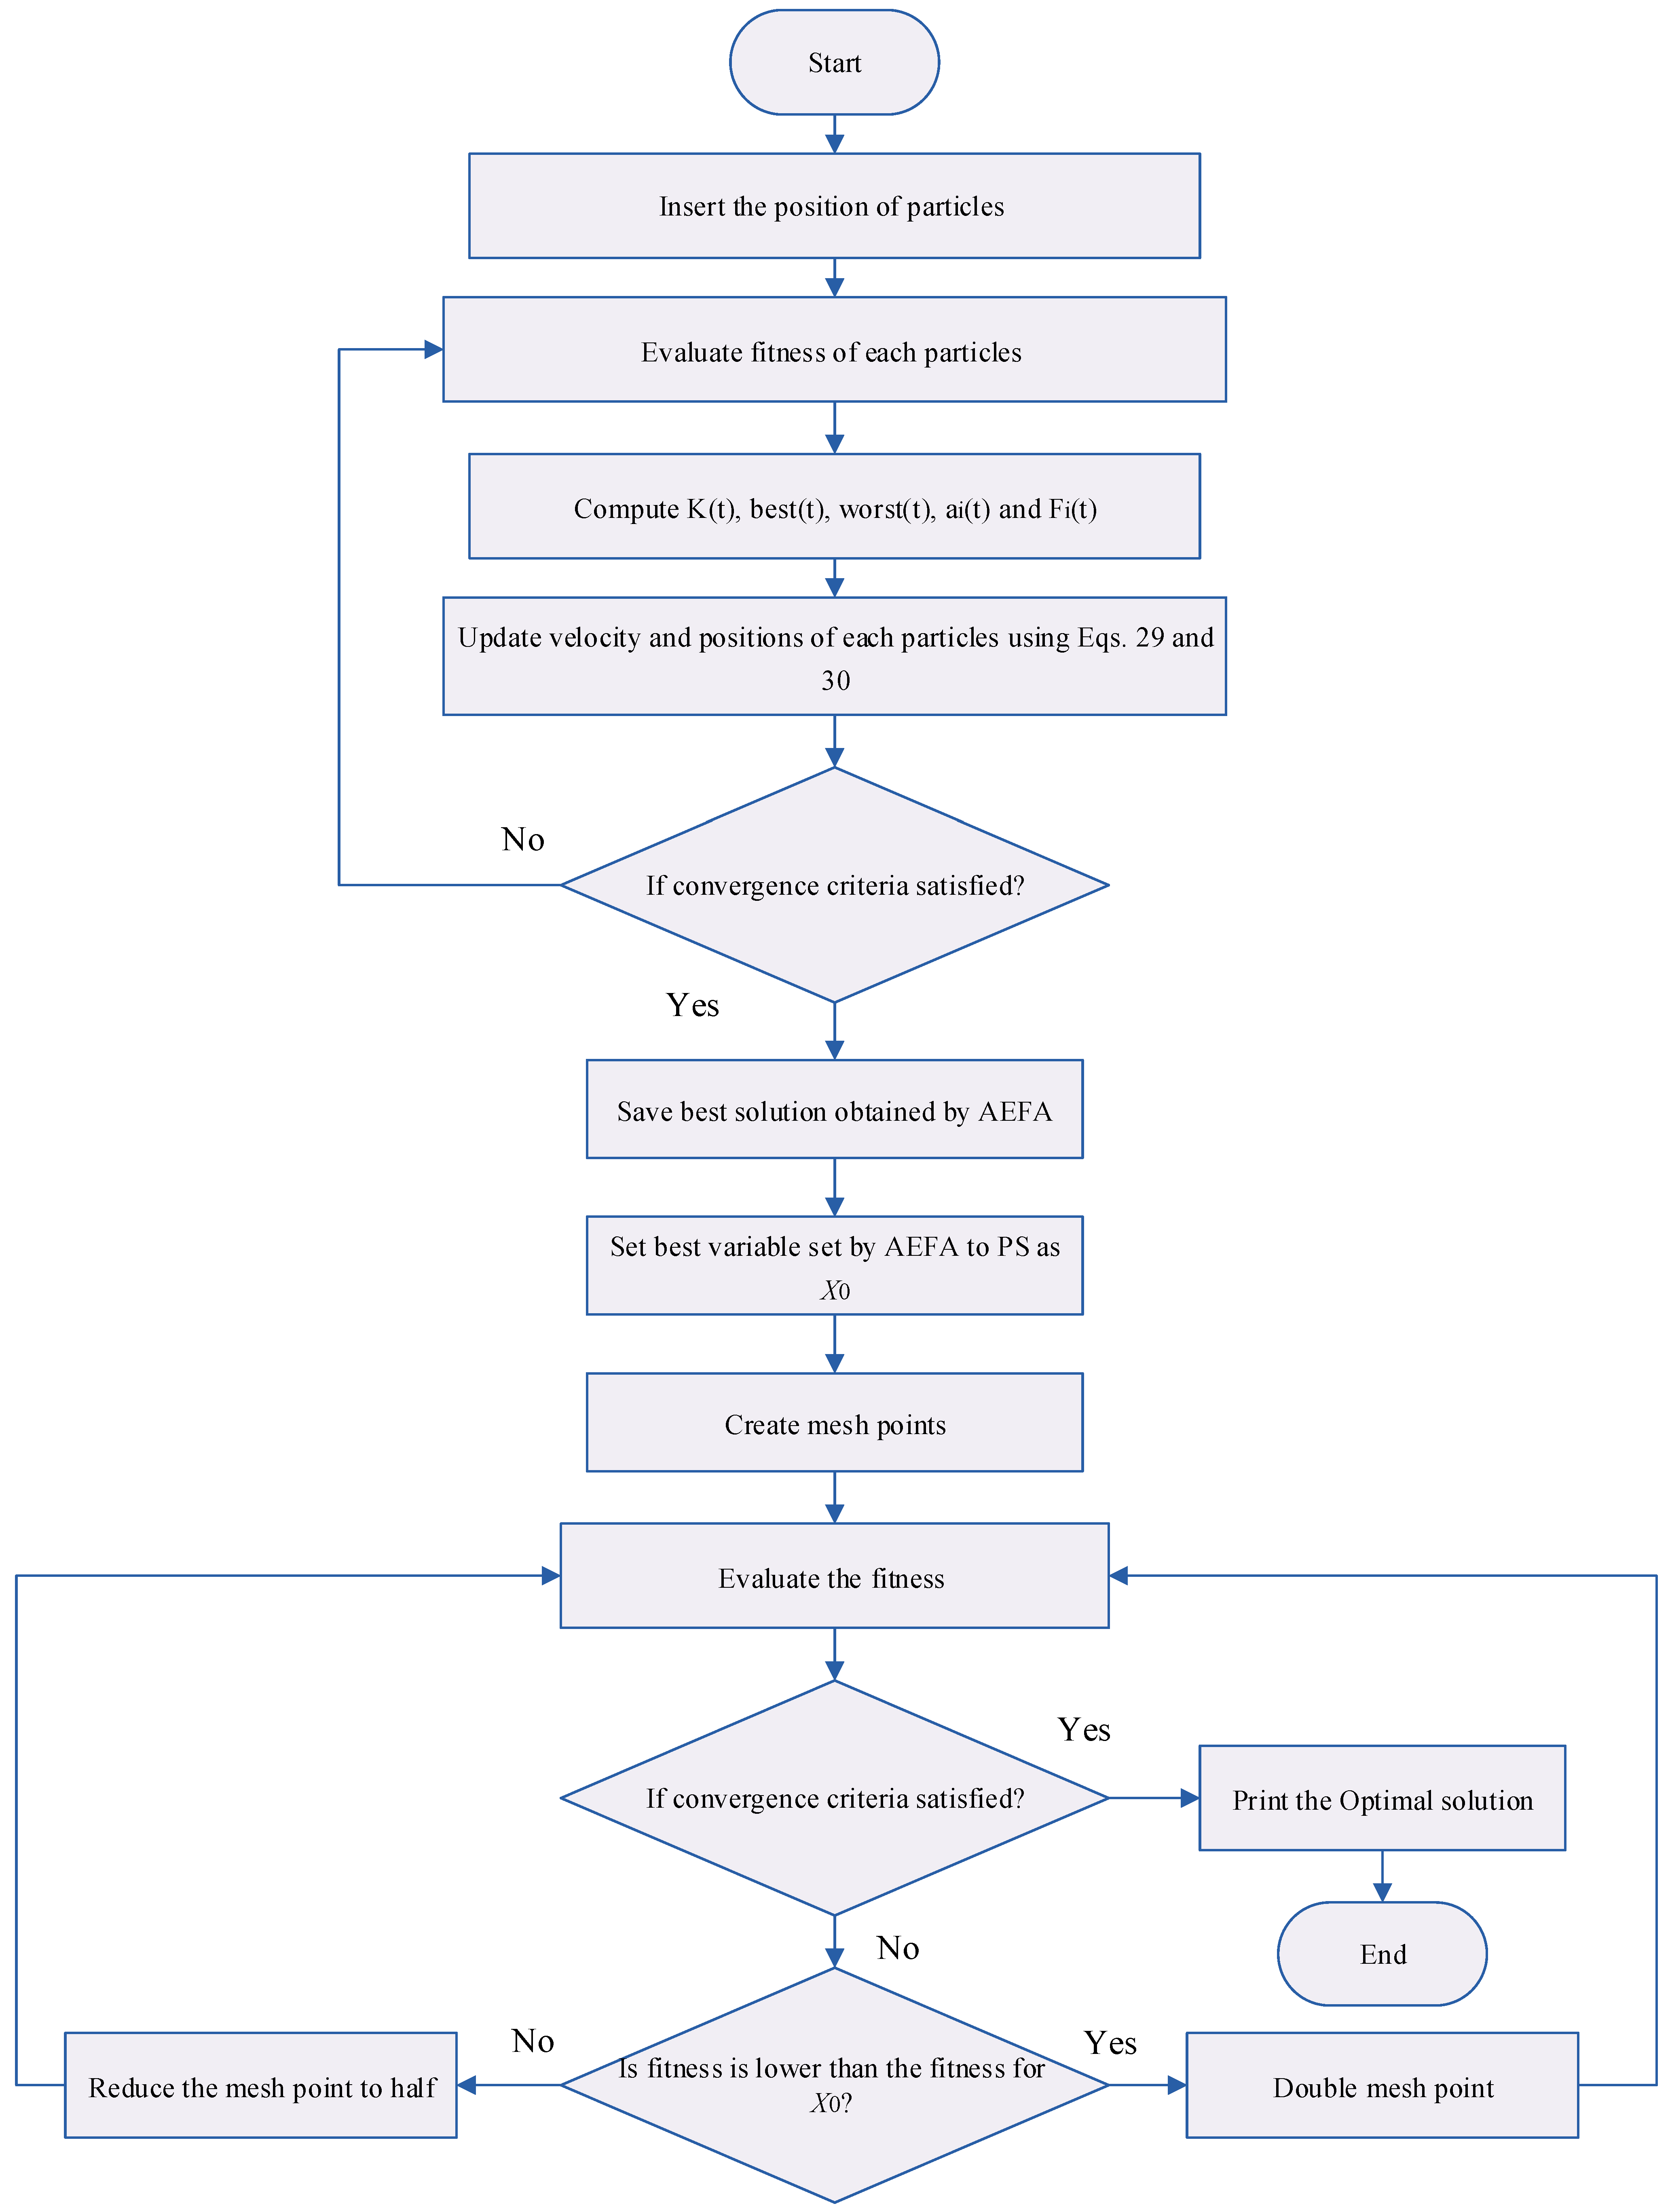
In AEFAPS, at first, the optimal variables determined by the conventional AEFA are applied as initial values for the PS method. The determination of the globally optimal values is continued using the PS method so that the best decision variables and the best objective function of the problem can be obtained.
The flowchart of the AEFAPS method is shown in Figure 4.

4.3. The AEFAPS Method Implementation

The AEFAPS method is applied to solving the network reconfiguration. The steps involved in the AEFAPS implementation in solving the reconfiguration are as follows:
Step 1: The number of optimization variables is equal to the number of tie-lines. The 13- and 33-bus networks have five tie-lines. Therefore, in opening the tie-lines, another line must be closed so that no loop is formed in the network and the radial state of the network is maintained.
Step 2: In the reconfiguration process, with the opening of the tie-lines, the network constraints, as well as the network radiality constraints, must be evaluated. The tie-line numbers must not be duplicated, otherwise, the selected variable set must be deleted. To evaluate the radiality state of the network, the bus incidence matrix (A) is used, in which the row number indicates the lines number and the column number indicates the number of buses. If line i is not connected to bus j, the matrix element is considered 0; if line i exits bus j, the matrix element is considered 1; and if line i enters bus j, the matrix element is considered +1. Finally, the network is radial if its determinants are not zero. The set of variables with matrix 0 is removed in the reconfiguration process.
Step 3: The objective function is computed for a set of decision variables (selected tie-lines) using the conventional AEFA by considering the network constraints by executing the load flow. The best network configuration is determined by the best set of variables with the best value of the objective function (minimum value).
Step 4: In this step, by updating the population of the conventional AEFA, steps 1 to 3 are performed for a set of new variables. Suppose the objective function value is less than step 3. In that case, the decision variables corresponding to the new configuration will be replaced.
Step 5: The best solution includes the best optimization variables set obtained by the conventional AEFA applied as initial values for the PS method. So, the best decision variables corresponding to the lowest objective function are determined using the PS method. If the value of the objective function is lower than the obtained value at step 4, the decision variables set corresponding to the new configuration will be replaced.
Step 6: Go to step 7 if the minimum objective function value with the algorithm’s maximum iteration is achieved. Otherwise, go to step 4.
Step 7: Stop the algorithm and save the optimal variables (optimal network configuration).

5. Results and Discussion

The results of the 13-and 33-bus distribution networks reconfiguration are performed to minimize power losses, improving power quality and reliability using the combined AEFAPS method. The unbalanced 33-bus IEEE network has five lines between buses 8–21, 9–15, 12–22, 18–33, and 25–29 on which the proposed methodology is implemented. This network has an active load of 3715 kW, a reactive load of 2300 kVAr, and a voltage of 12.66 kV. The unbalanced 33-bus network information is taken from [33] and network reliability information, including outage rate and line repair time, is taken from [34]. The reconfiguration is also implemented on a real unbalanced 13-bus network based on the proposed methodology. This network has a 10,536 kW active load and a 5992 kVAr reactive load with a voltage of 20 kV. The 13-bus network has five tie-lines between buses 13–4, 6–9, 13–12, 12–10, and 9–10. The 13-bus network information is taken from [35]. Moreover, the reconfiguration results in different loadings, including nominal load and 62.5% and 125% of nominal load peak, and the capability of the AEFAPS method is evaluated. In addition, the superiority of AEFAPS is evaluated with conventional AEFA, well-known PSO, and GWO algorithms. The population number of algorithms, the maximum number of iterations based on user experience, repeated execution of the optimization program, and evaluation of results are equal to 50 and 100, respectively.

5.1. Results of Unbalanced 33-Bus Network

After performing the load flow for the base model of the 33-bus network without the reconfiguration, the results are given in Table 2. The values of power losses, minimum voltage, ENS, and voltage unbalance are calculated as 207.44 kW, 0.9566 p.u, 7.43 MWh and 4.92%, respectively.
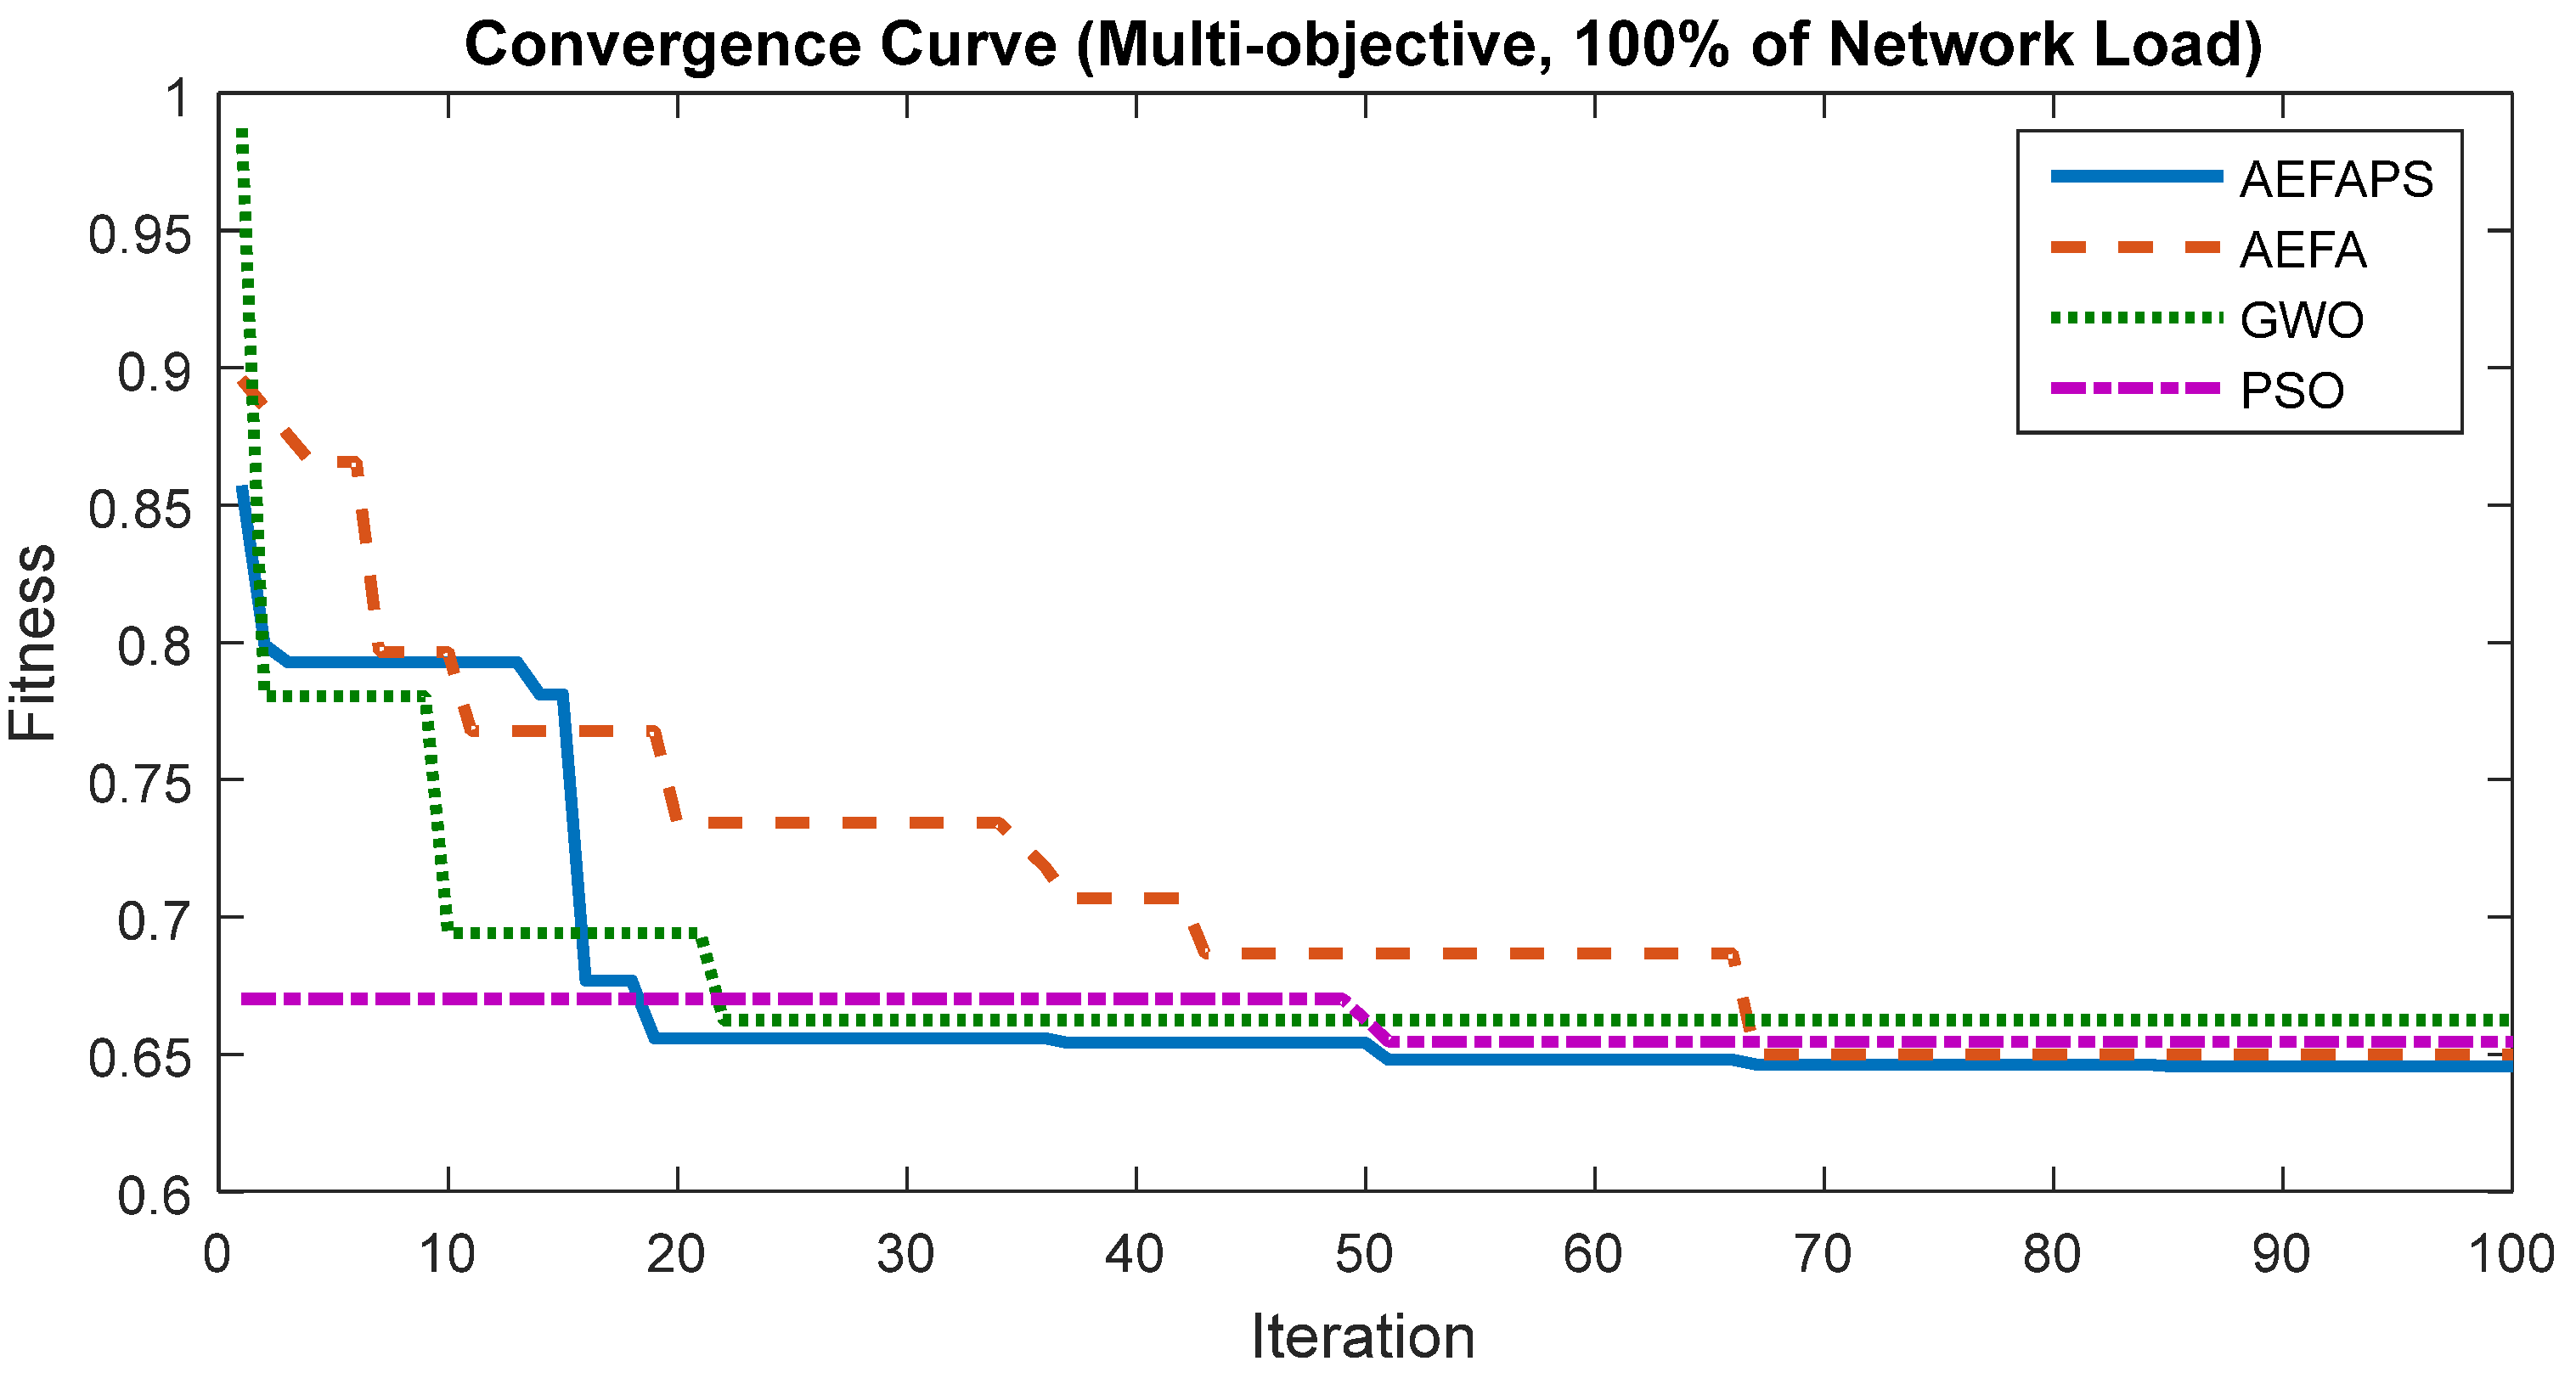
The problem of reconfiguration is performed as a single and fuzzy many-criteria, with the method results given. The optimization method’s population is set to 50, and the maximum iteration is fixed at 100. The algorithms’ parameters are found based on the trial-and-error method. The convergence process of different algorithms is depicted in Figure 5. This graph shows that AEFAPS obtained better fuzzy fitness than the conventional AEFA, PSO, and GWO methods. It is clear that conventional AEFA has many convergence tolerances and that the combination with the PS method improves its convergence process to achieve a better objective function value.
The simulation results of the 33-bus network at nominal load are presented in Table 3, including optimal network configuration based on opened lines. The values of each objective include the power loss, voltage sag, voltage unbalance, and ENS considering single-criterion and many-criteria optimization using the AEFAPS algorithm. The best network combination is obtained in many-criteria optimization by opening 7, 11, 13, 28, and 32 switches based on the proposed AEFAPS. According to Table 3, the losses, voltage sag, voltage unbalance, and ENS is obtained at 146.96 kW, 0.653 p.u, 2.42%, and 6.69 MWh/year, respectively, using the AEFAPS based on many-criteria reconfiguration. The obtained results showed that the AEFAPS is superior compared to the other algorithm to obtain the lower values of different objectives. Moreover, the results demonstrated that single-criterion results could not generate a logical compromise between all the objectives.
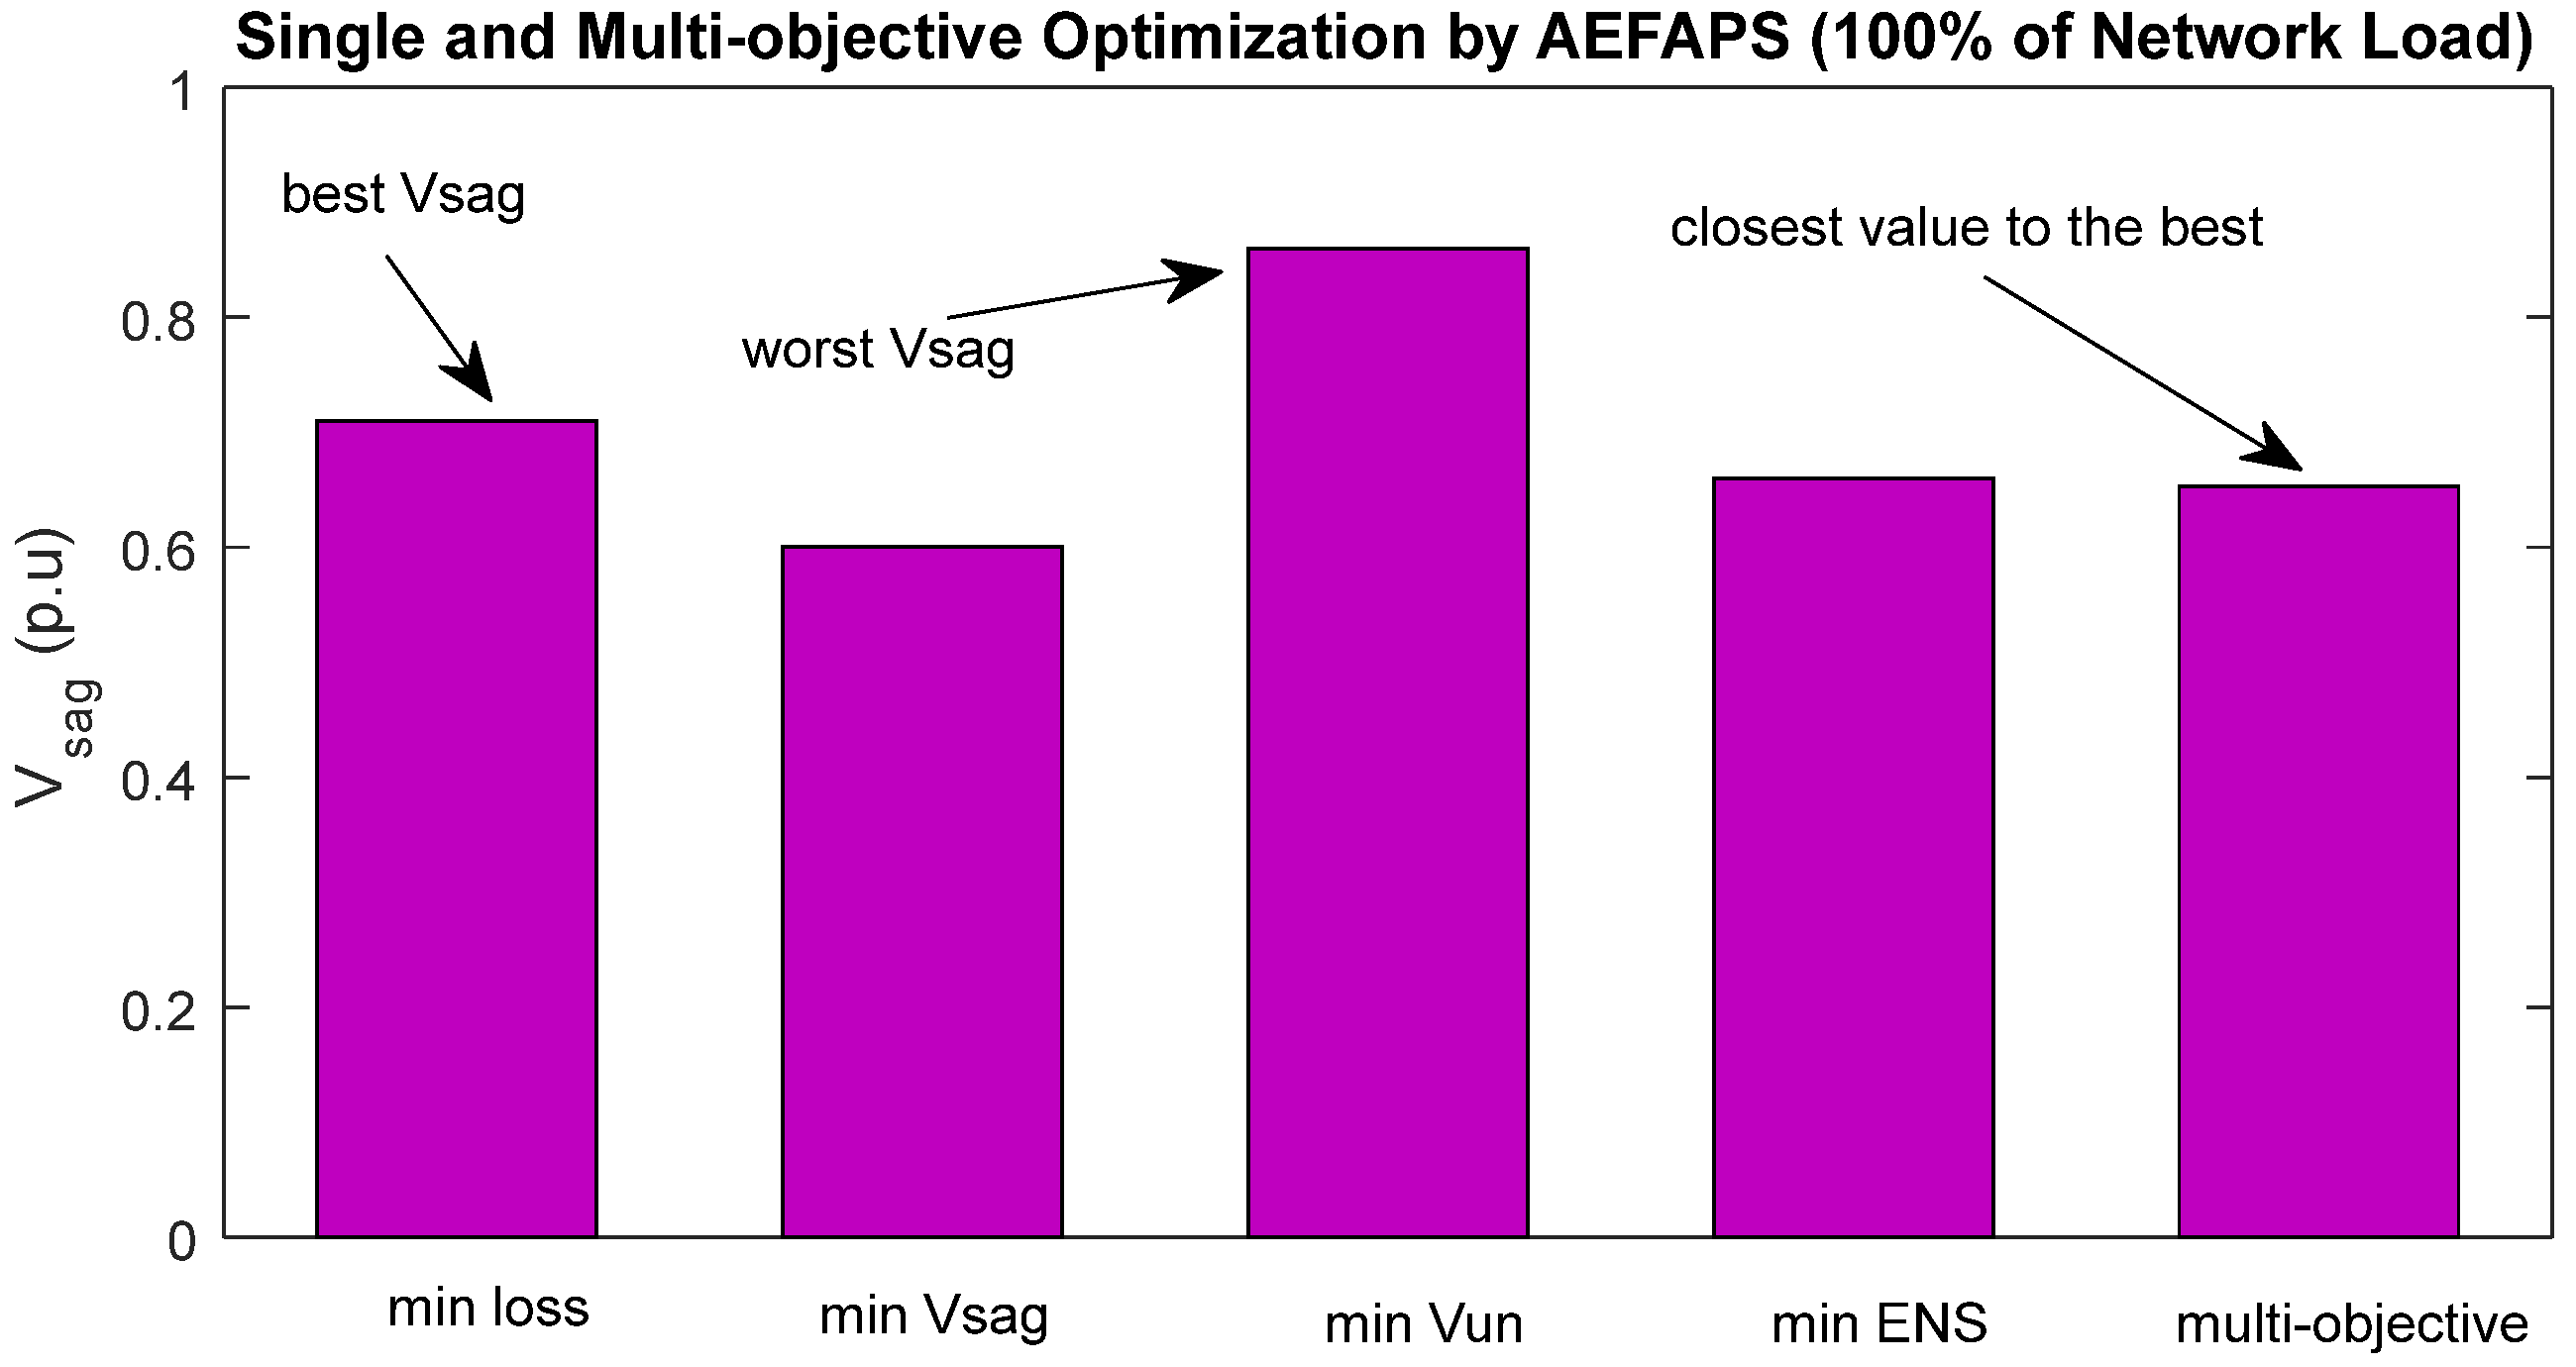
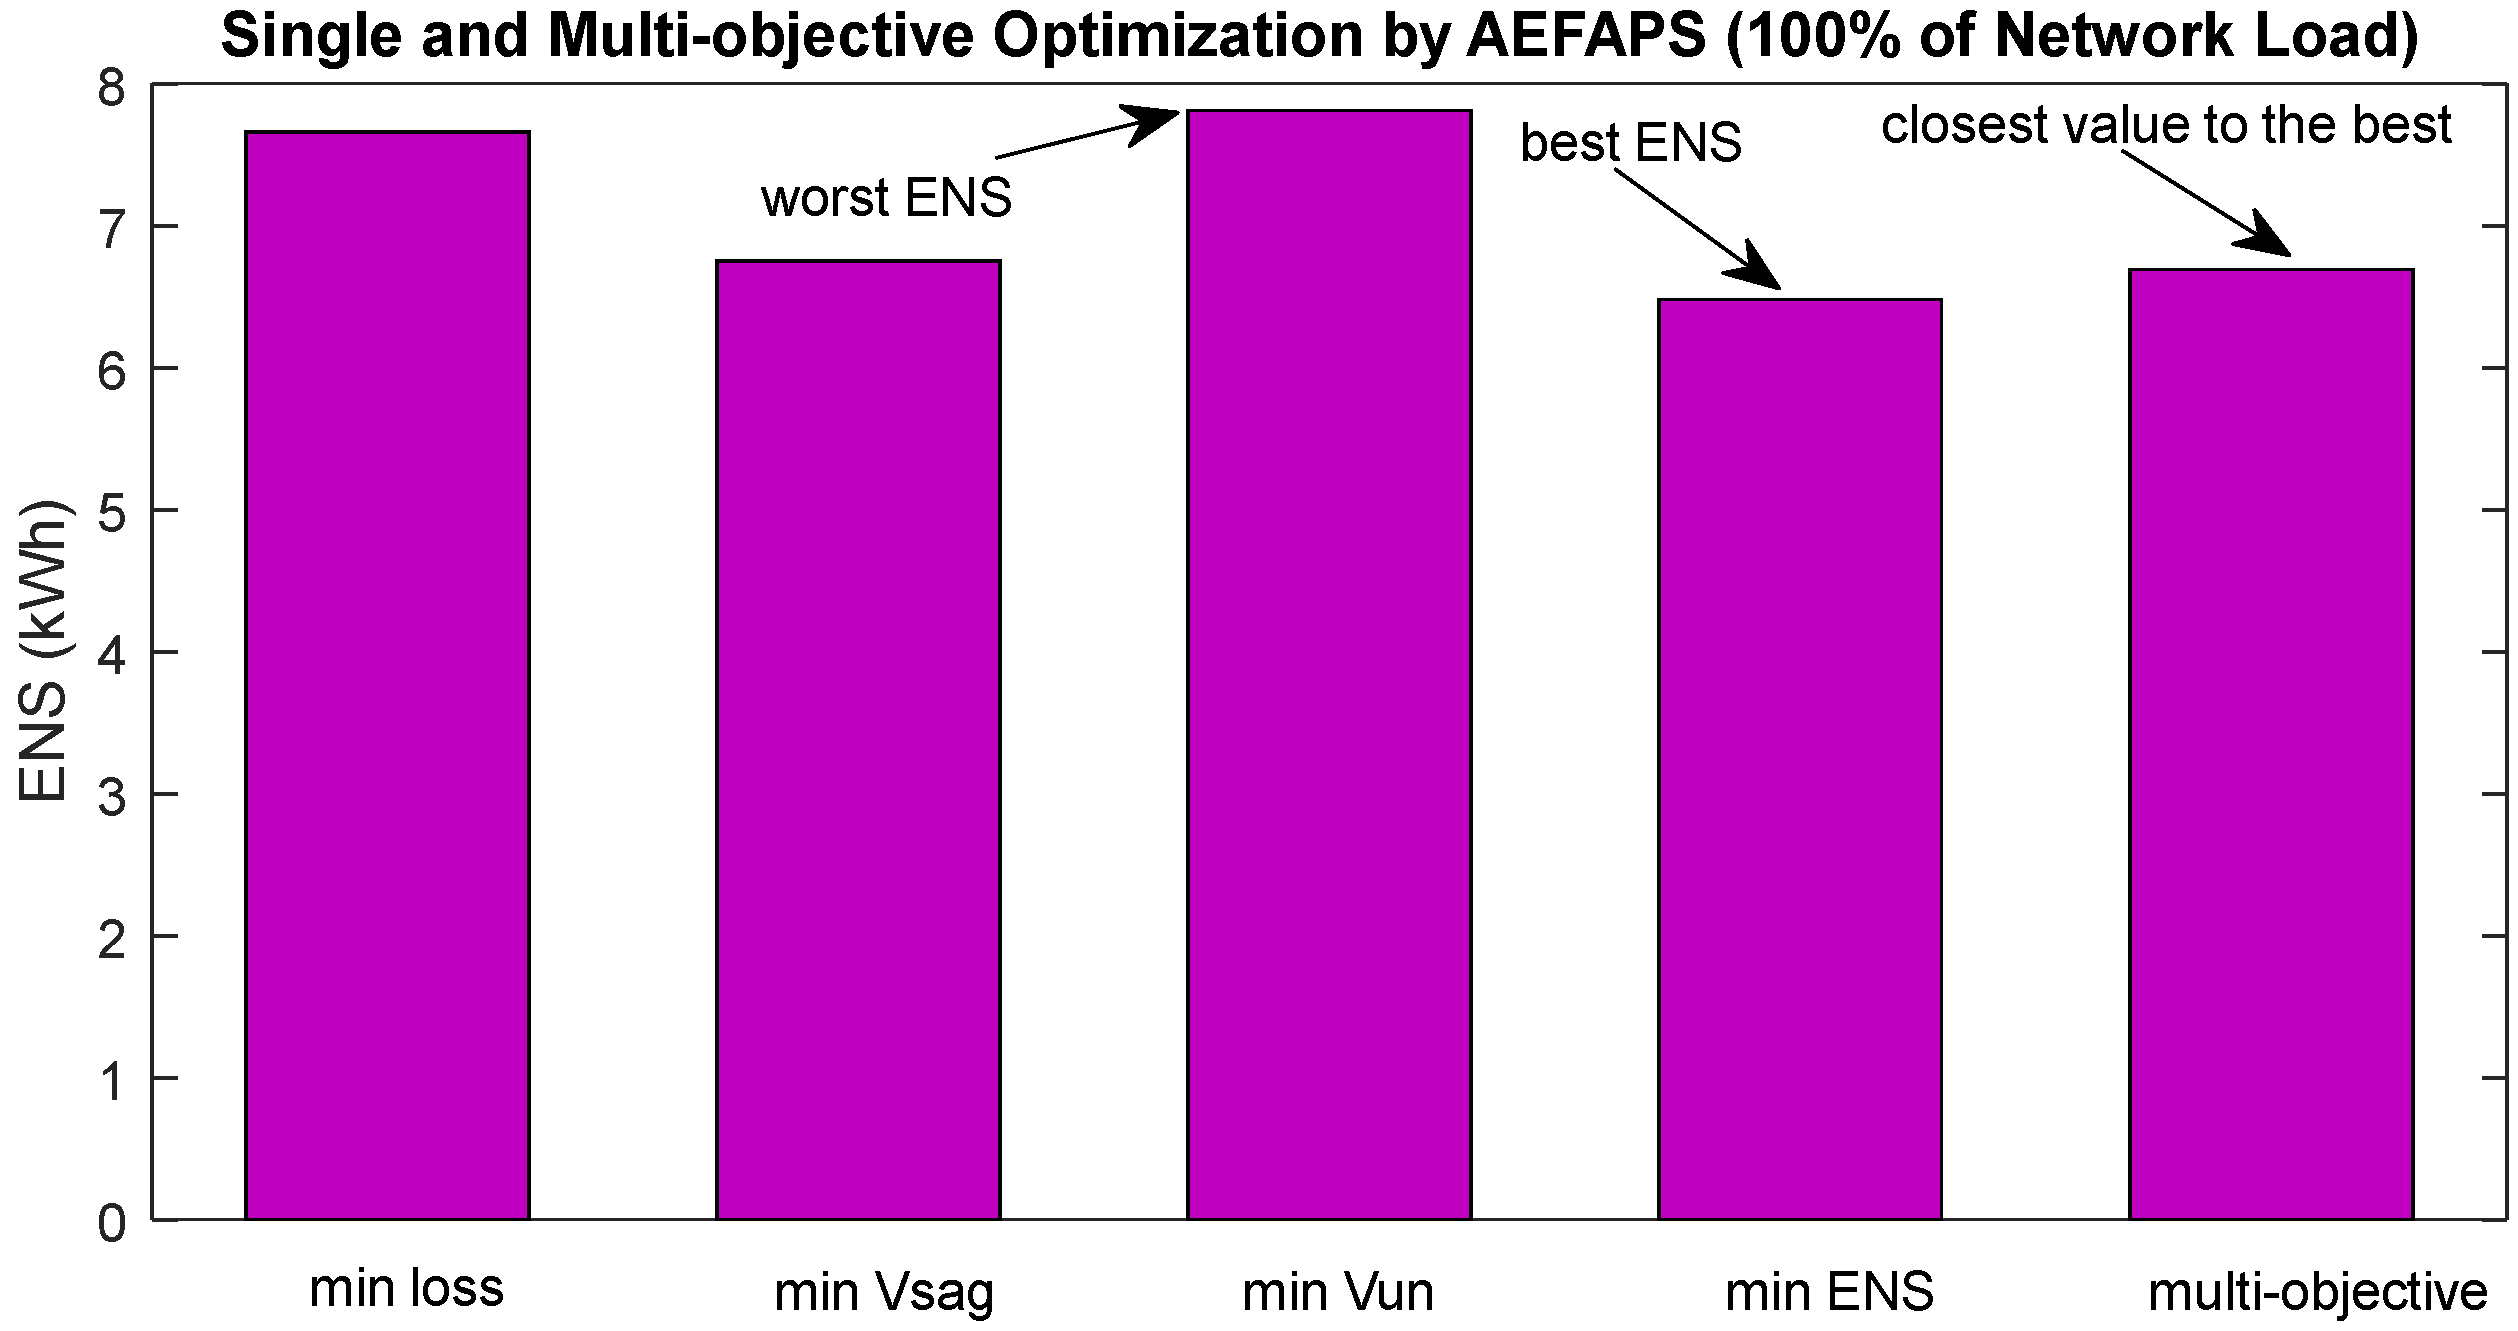
To investigate the ability of the AEFAPS method, its performance in solving reconfiguration problems has been compared with the conventional AEFA, PSO, and GWO methods. According to the results, it is obvious that the value of each objective in optimizing it as a single criterion is less than the other objectives. For example, the minimum amount of power loss is in a single-criterion reconfiguration to minimize power loss. This is true for the other objectives (see Figure 6, Figure 7, Figure 8 and Figure 9). The results support that in a single-criterion reconfiguration to minimize the voltage unbalance. The network power loss is close to the base value (it does not change much) and even increases the voltage sag, plus weakens the ENS (increased from 7.432 MWh to 7.810 MWh). Therefore, the results clarify that single-criterion reconfiguration cannot establish a logical and acceptable compromise between all the objectives. However, the results of many-criteria reconfiguration demonstrate that all the objectives of the problem have been established and improved by a compromise between them. In the AEFAPS method, opened network lines, including switches 7, 11, 13, 28, and 32, are determined as the optimal configuration of the 33-bus network. In the many-criteria reconfiguration, the power loss value decreased from 207.44 kW to 146.96 kW. The sag voltage value decreased from 0.9566 p.u in the base network to 0.6530 p.u, the voltage unbalance declined from 4.922% to 2.42%, and the ENS value decreased from 7.432 MWh to 6.69 MWh. Therefore, the reconfiguration based on many-criteria optimization using the AEFAPS method has improved all the objectives. Furthermore, comparing the results obtained from AEFAPS in solving the problem of single-criterion and many-criteria reconfiguration with conventional AEFA, PSO, and GWO methods shows the superiority of AEFAPS in achieving lower values of power losses, voltage sag, voltage unbalance, and ENS.
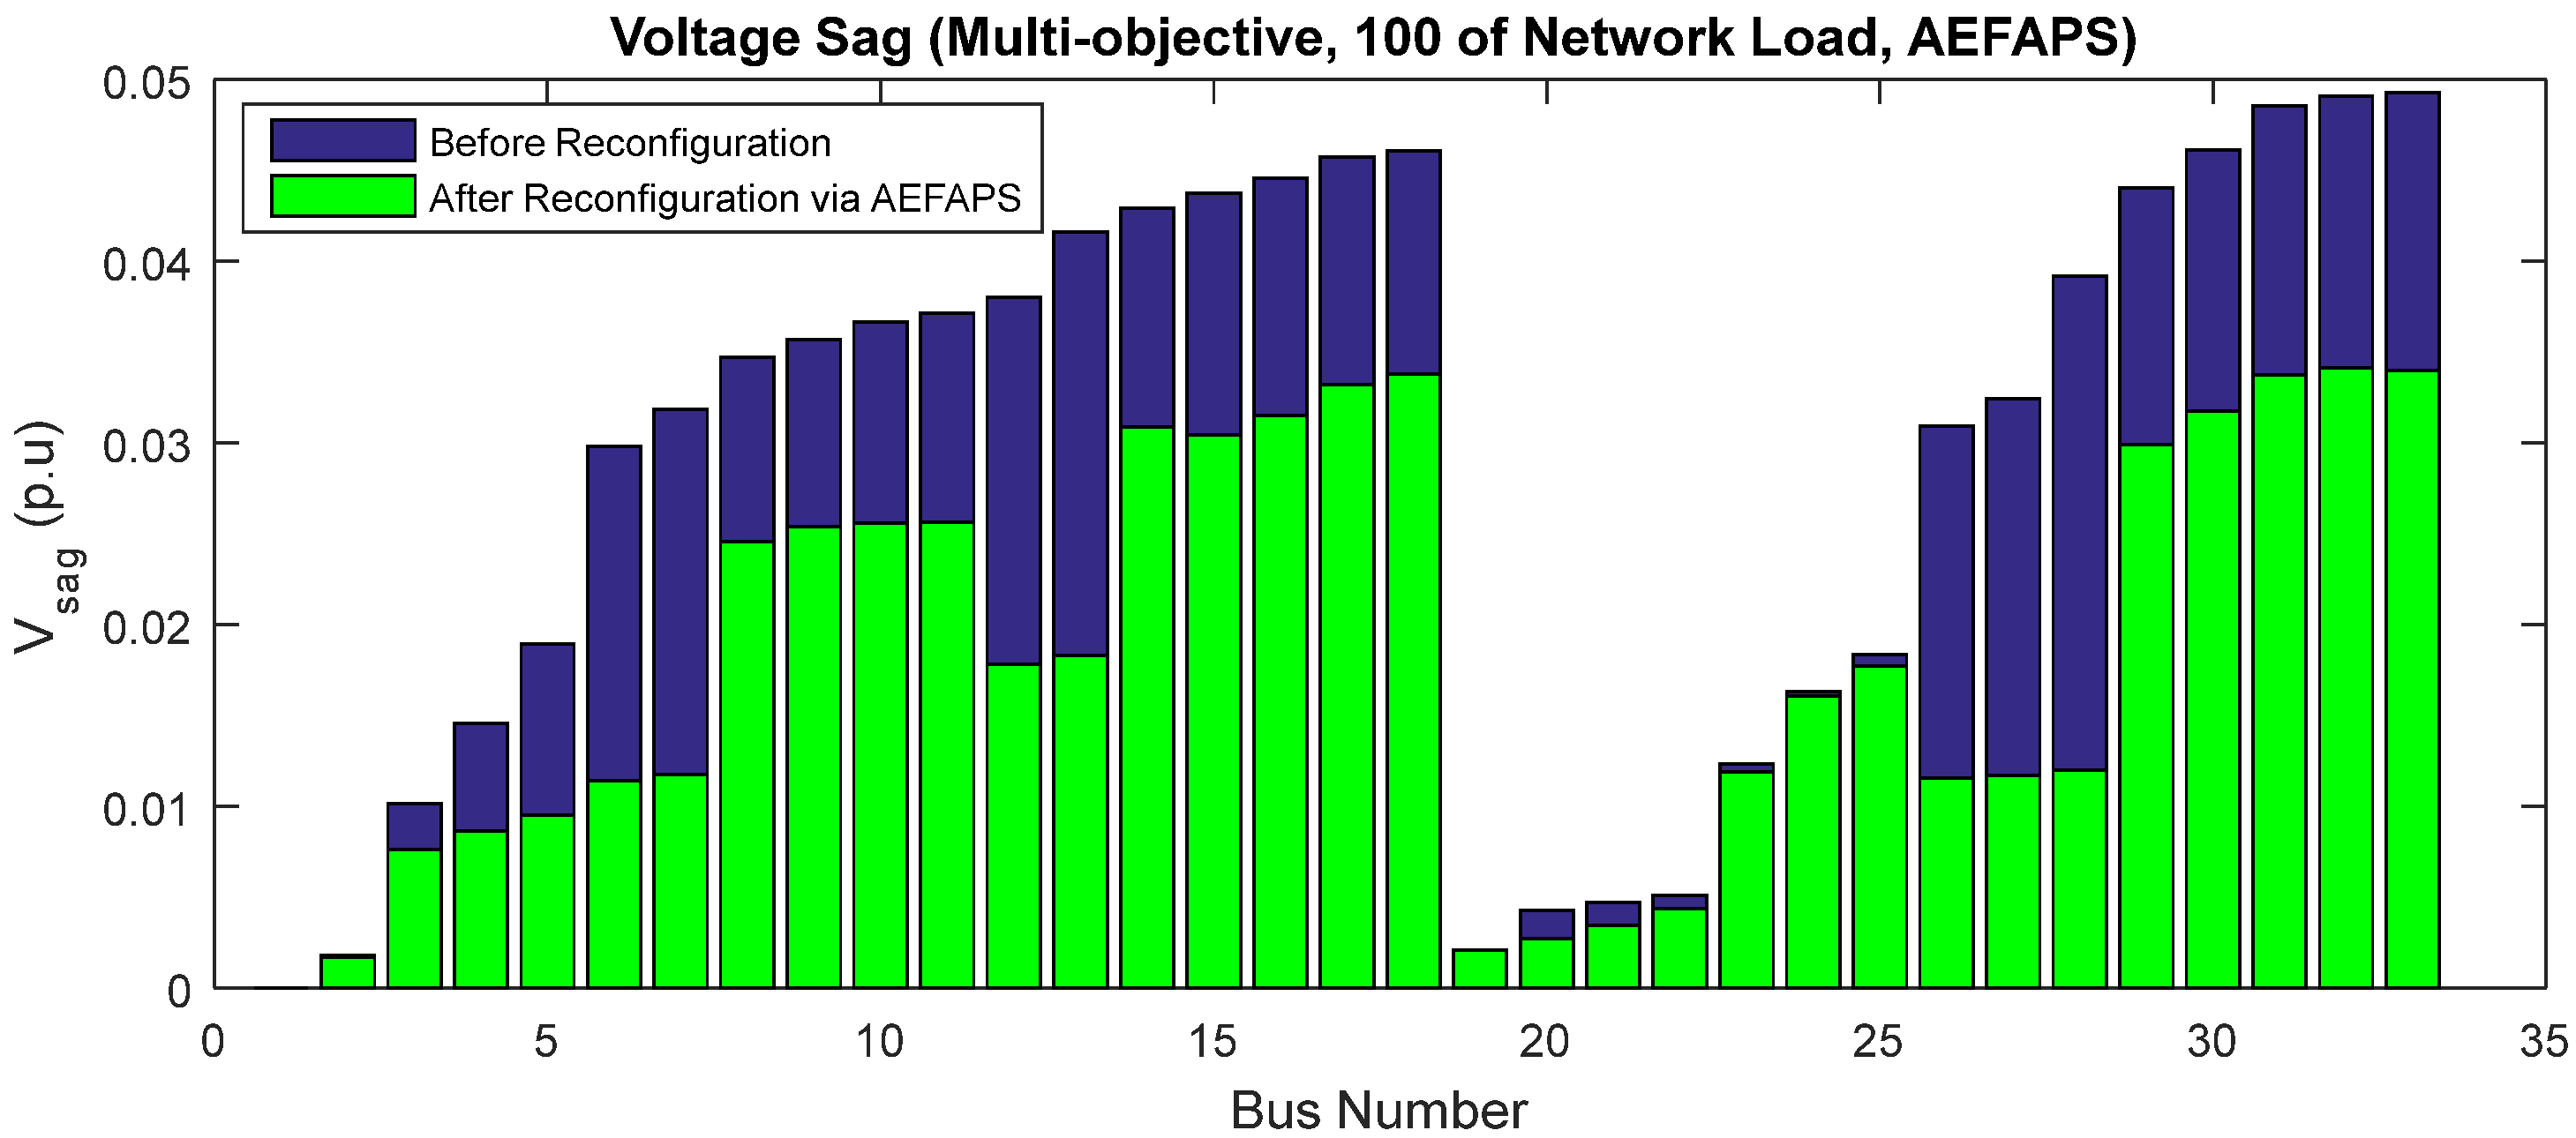
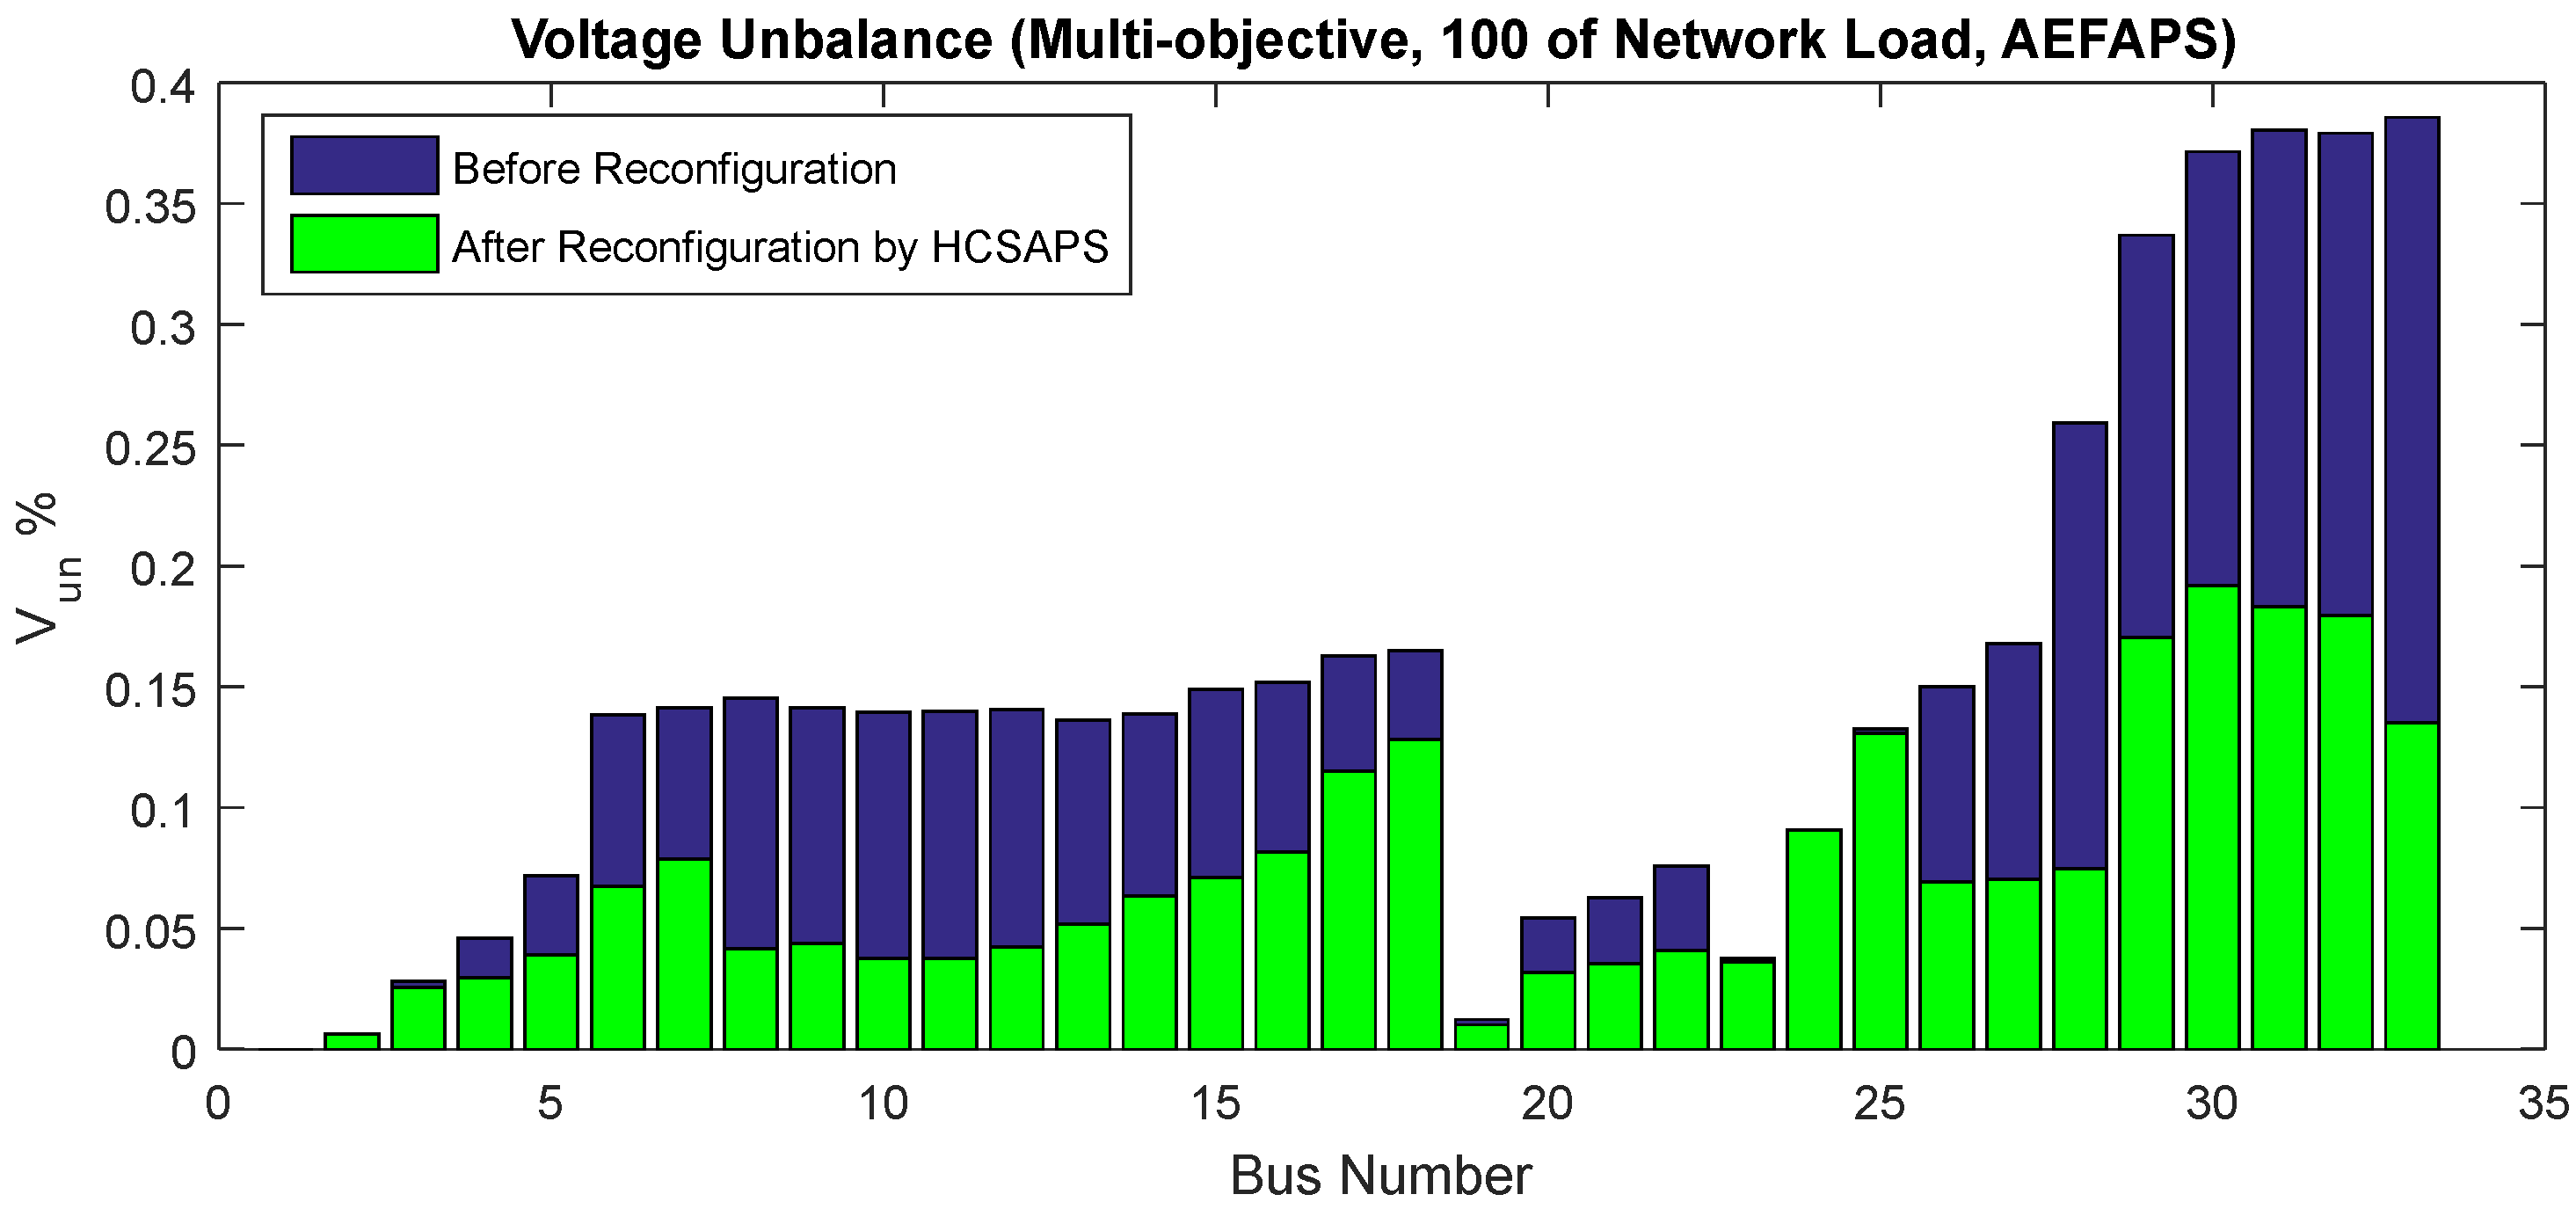
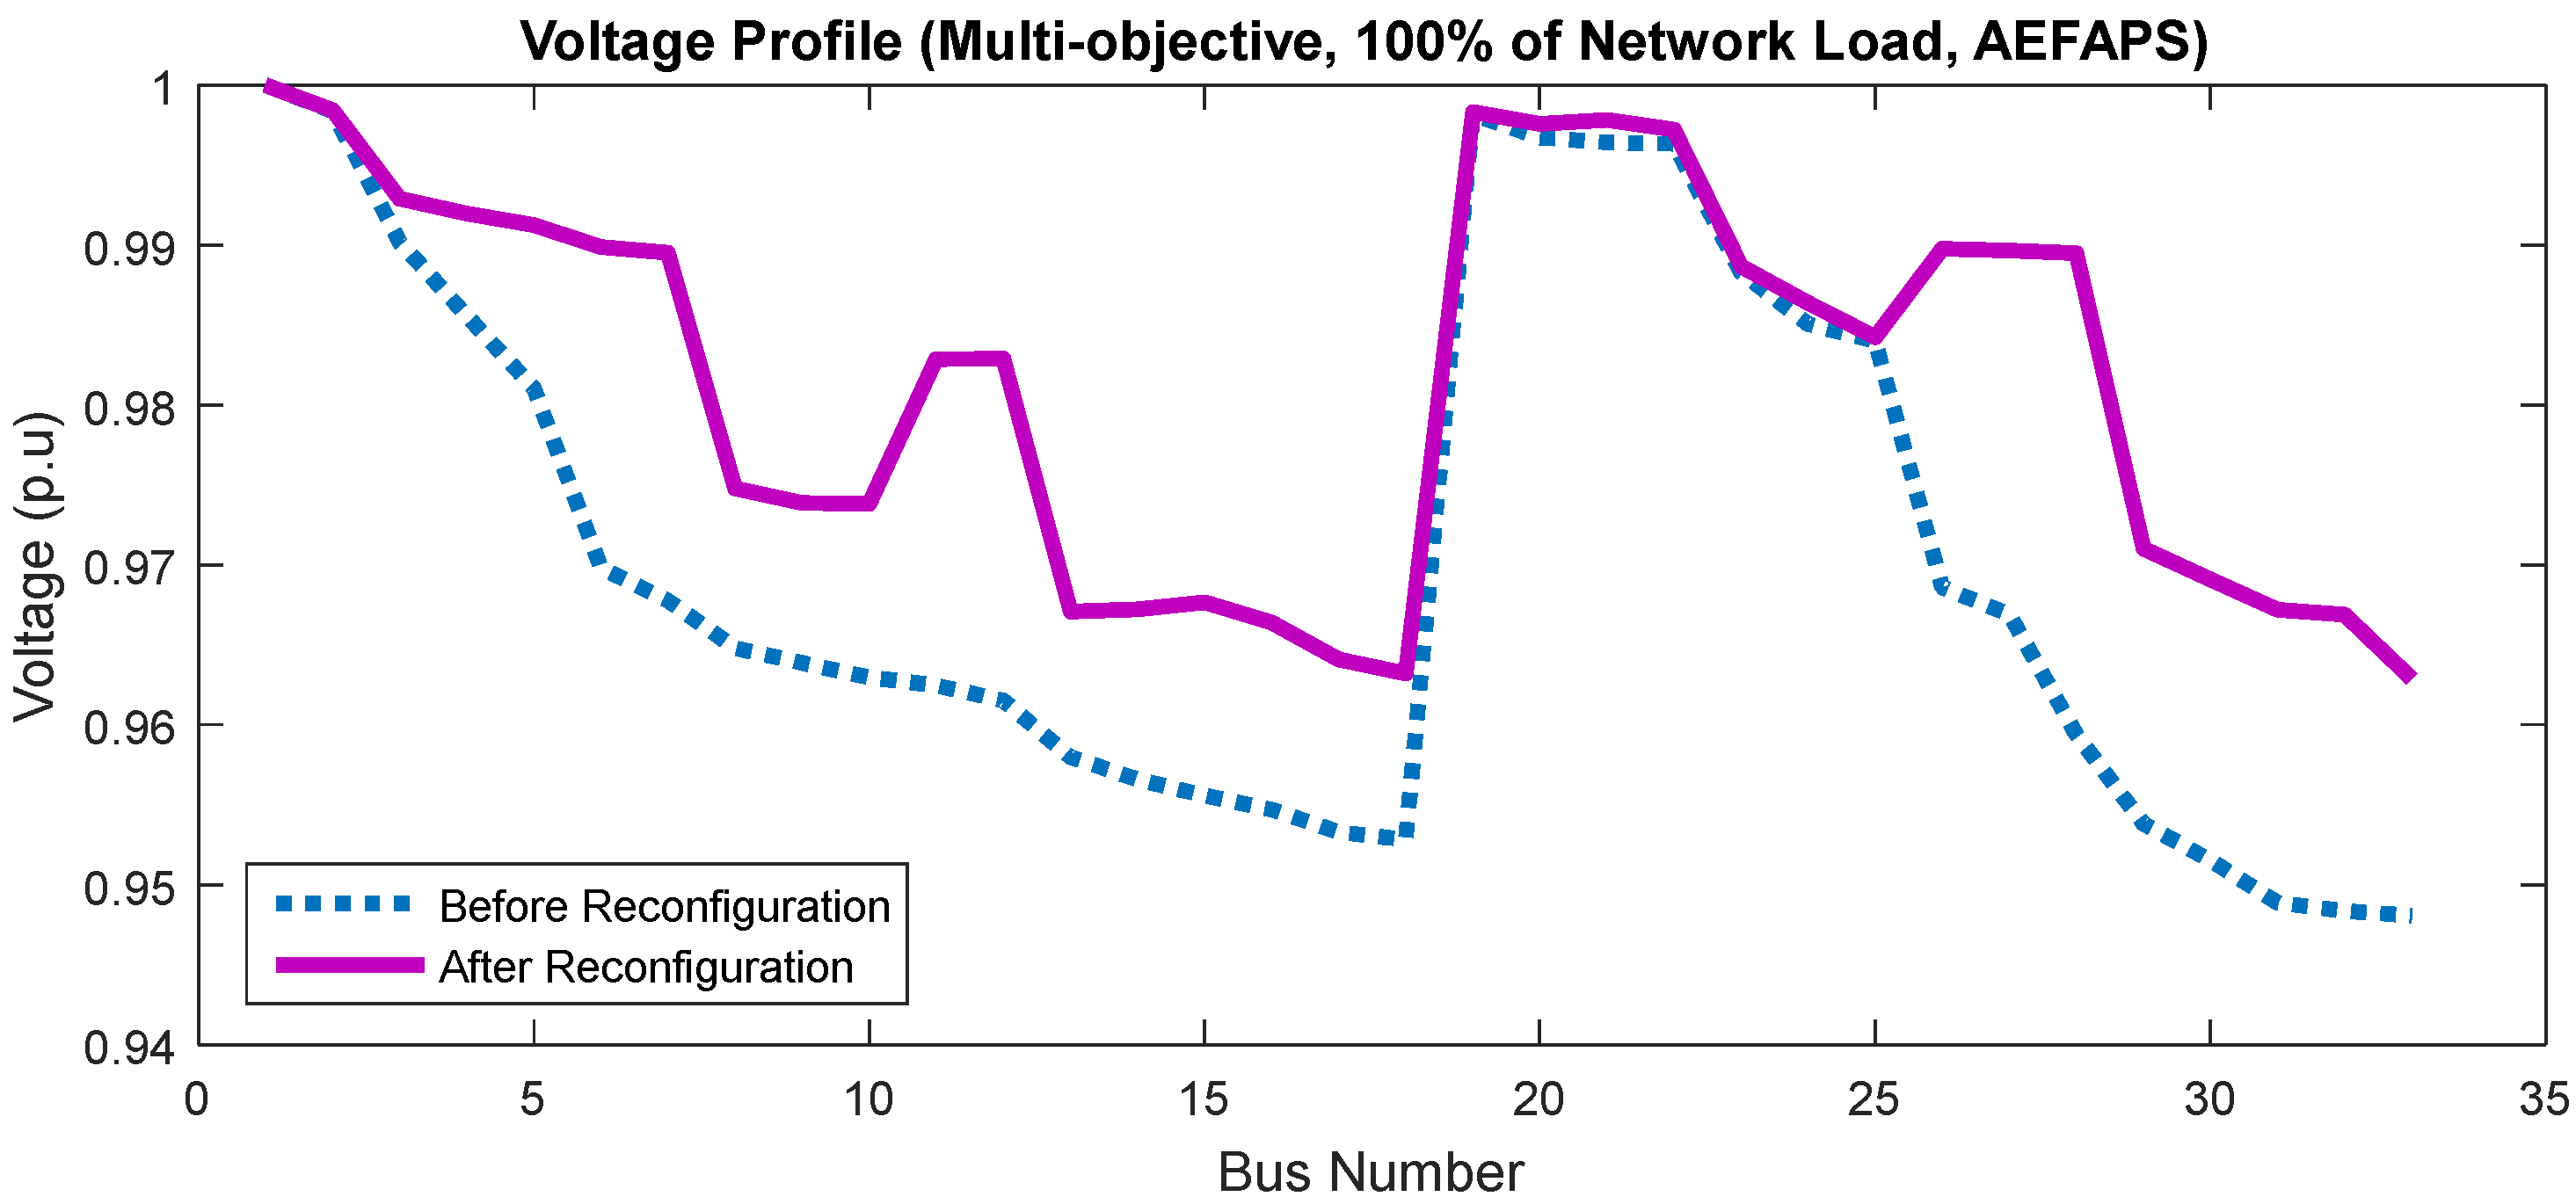
Figure 10, Figure 11 and Figure 12 show the variations of the sag voltage, voltage unbalance, and voltage profile of the 33-bus network before and after many-criteria reconfiguration based on the AEFAPS method, respectively. After many-criteria reconfiguration, the improvement of each mentioned objective confirmed the optimal performance of the proposed AEFAPS-based methodology.

5.1.1. Effect of Load Increasing

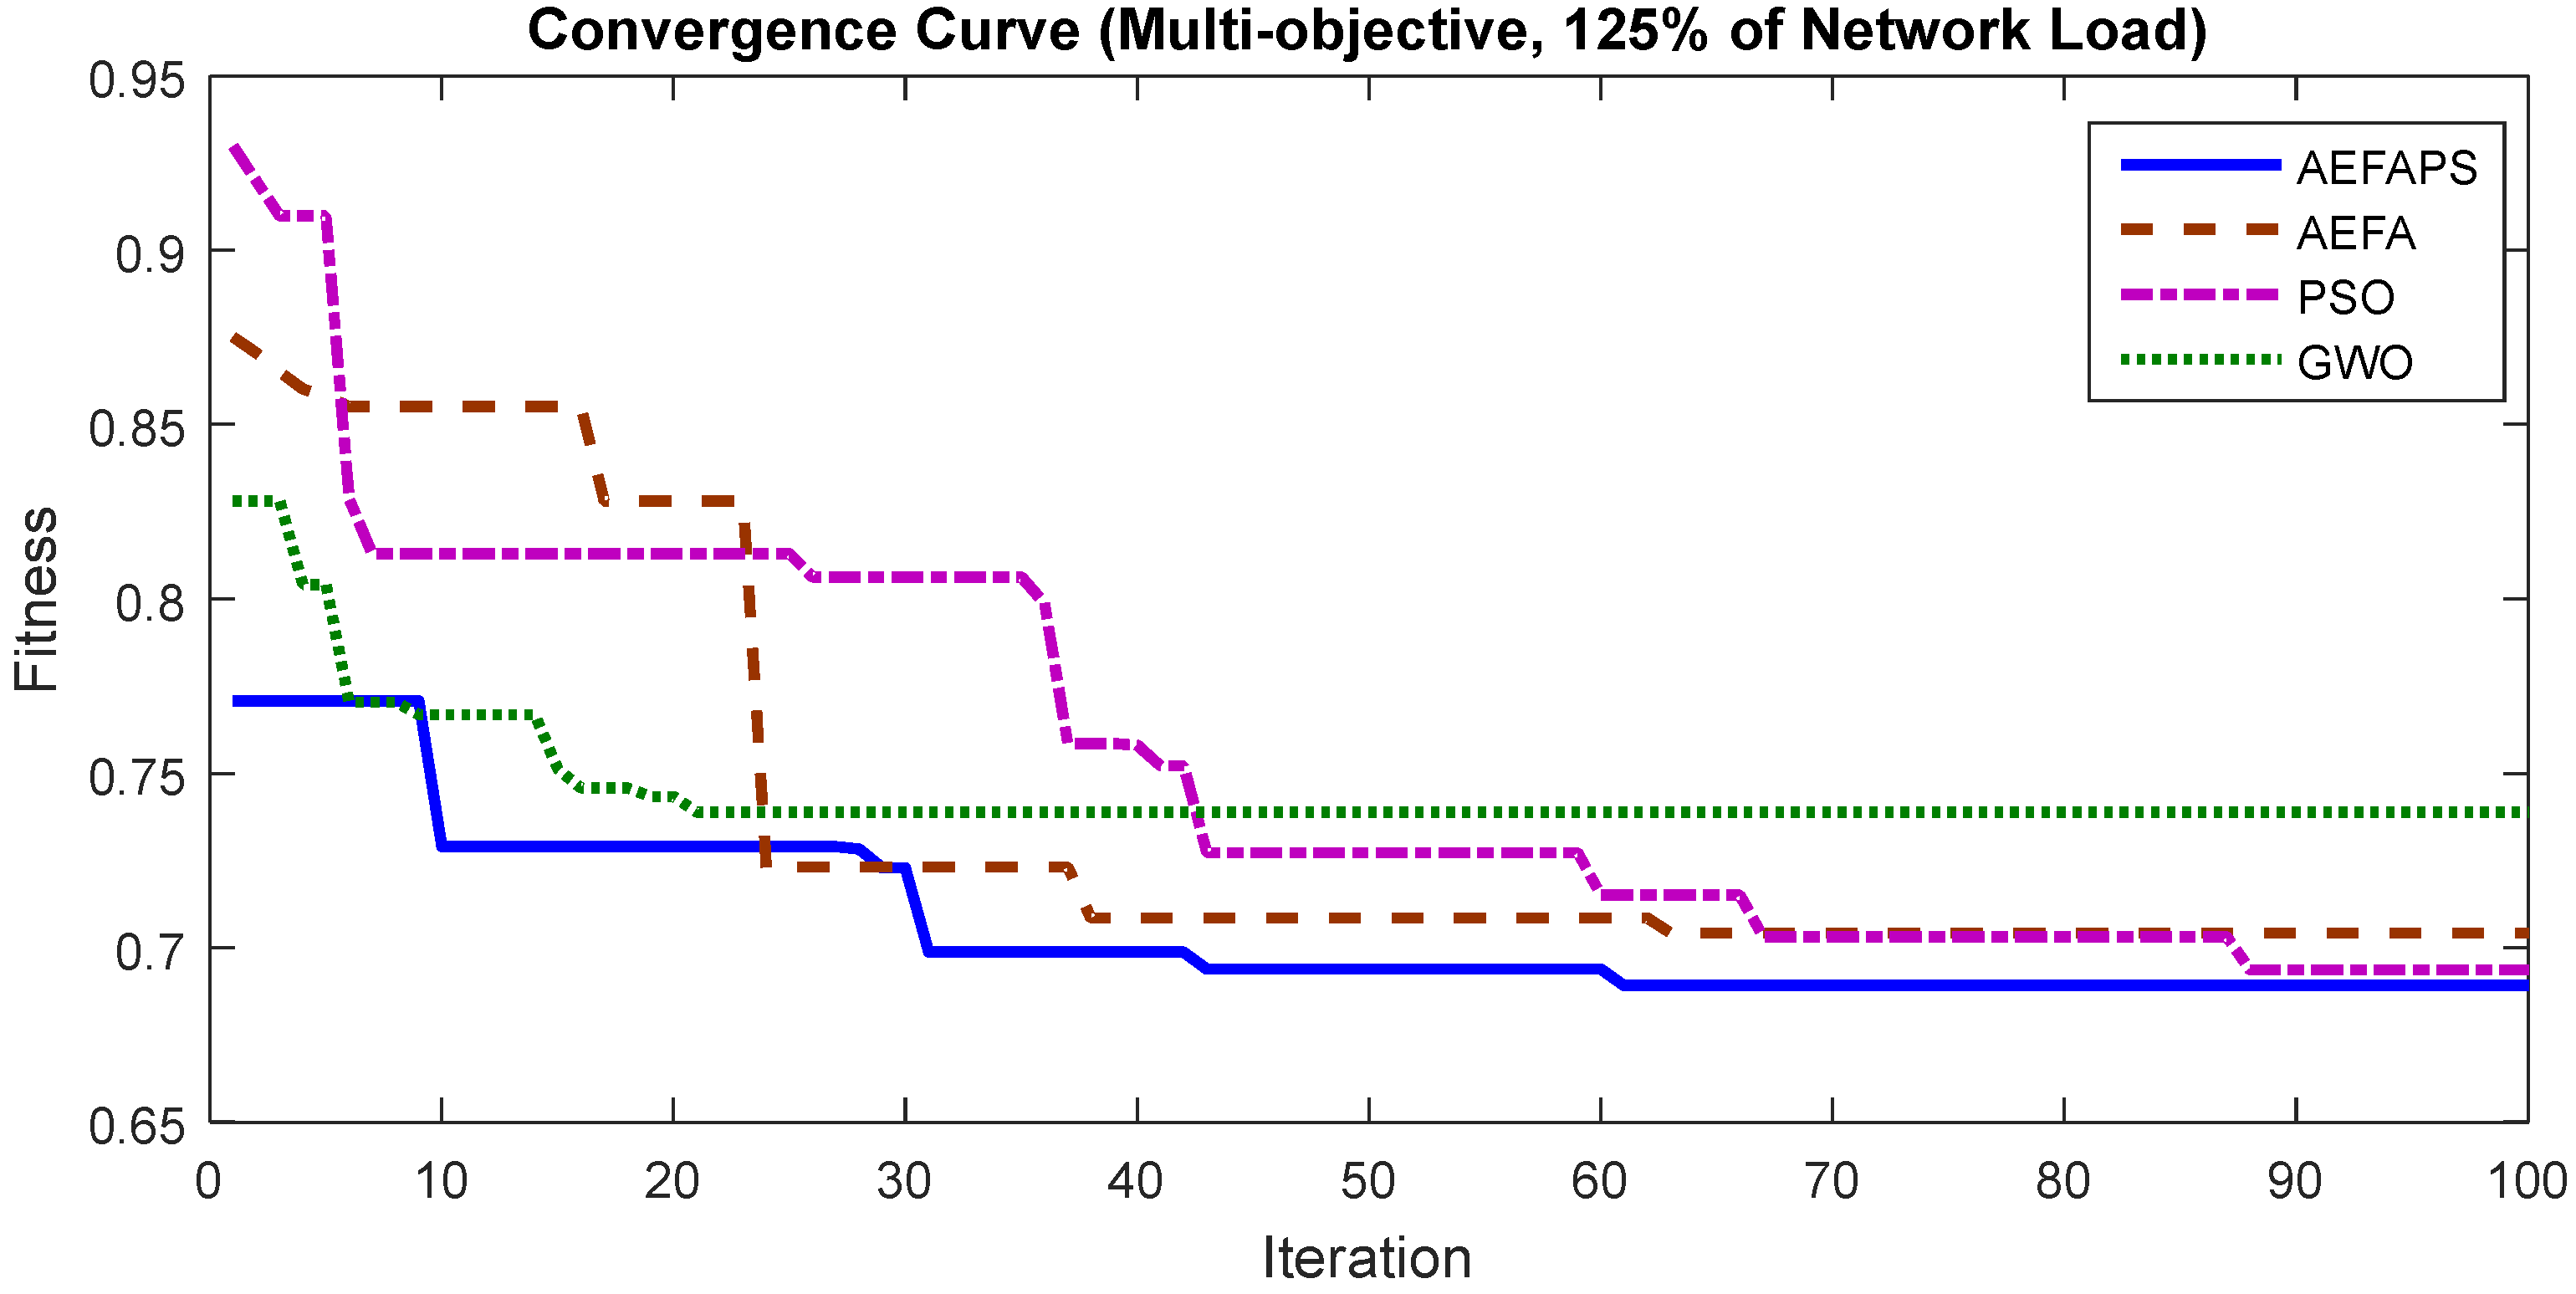
The results of single-criterion and many-criteria reconfiguration of the unbalanced 33-bus network in terms of load increase equal to 125% of the network peak load based on the AEFAPS method are given in Table 4. The convergence process obtained from the proposed method, conventional AEFA, PSO, and GWO are shown in Figure 13. The superiority of the AEFAPS method in solving the many-criteria reconfiguration problem is confirmed with lower convergence tolerance and achieving less objective function value than the other methods.
Table 4 shows that in the single-criterion reconfiguration to minimize voltage unbalance, the power loss, voltage sag, and ENS have been weakened and increased compared with the base state poor performance of the single-criterion approach. In contrast, the results obtained from many-criteria reconfiguration indicate the creation of a desirable compromise between different objectives and thus the improvement of all objectives based on the AEFAPS method compared to the base network. In the AEFAPS method, opened network lines including switches 7, 10, 28, 32, and 34 are determined optimal network configuration. In many-criteria reconfiguration, the power loss, voltage sag, voltage unbalance, and the ENS values are obtained at 232.98 kW, 0.833 p.u, 2.932%, and 8.074 MWh, respectively. In addition, according to Table 4, the AEFAPS method has performed better in single-criterion and many-criteria reconfiguration in terms of lower values of power losses, voltage sag, voltage unbalance, and ENS values compared to the conventional AEFA, PSO, and GWO methods.

5.1.2. Effect of Load Decreasing

The results of single-criterion and many-criteria reconfiguration of the 33-bus distribution network in terms of network load reduction (62.5% of network nominal load) are presented in Table 5. The convergence process of the optimization methods is shown in Figure 14. As can be observed, the AEFAPS method achieved a lower fuzzy fitness compared to the other methods with less convergence tolerance. Therefore, it succeeded in enhancing the probability of achieving the optimal response. In this case, in the same way as the nominal load conditions and the increase in network load, it is observed that the loss values, power quality indices, and ENS values obtained in many-criteria optimization are the closest values to the best values in single-criterion optimization obtained by AEFAPS. The AEFAPS results were compared with the conventional AEFA, PSO, and GWO methods’ performances, which confirmed the superiority of AEFAPS given an improvement in the objectives regarding loss reduction, power quality, and reliability enhancement.

5.1.3. Comparison of the Effect of Load Variations

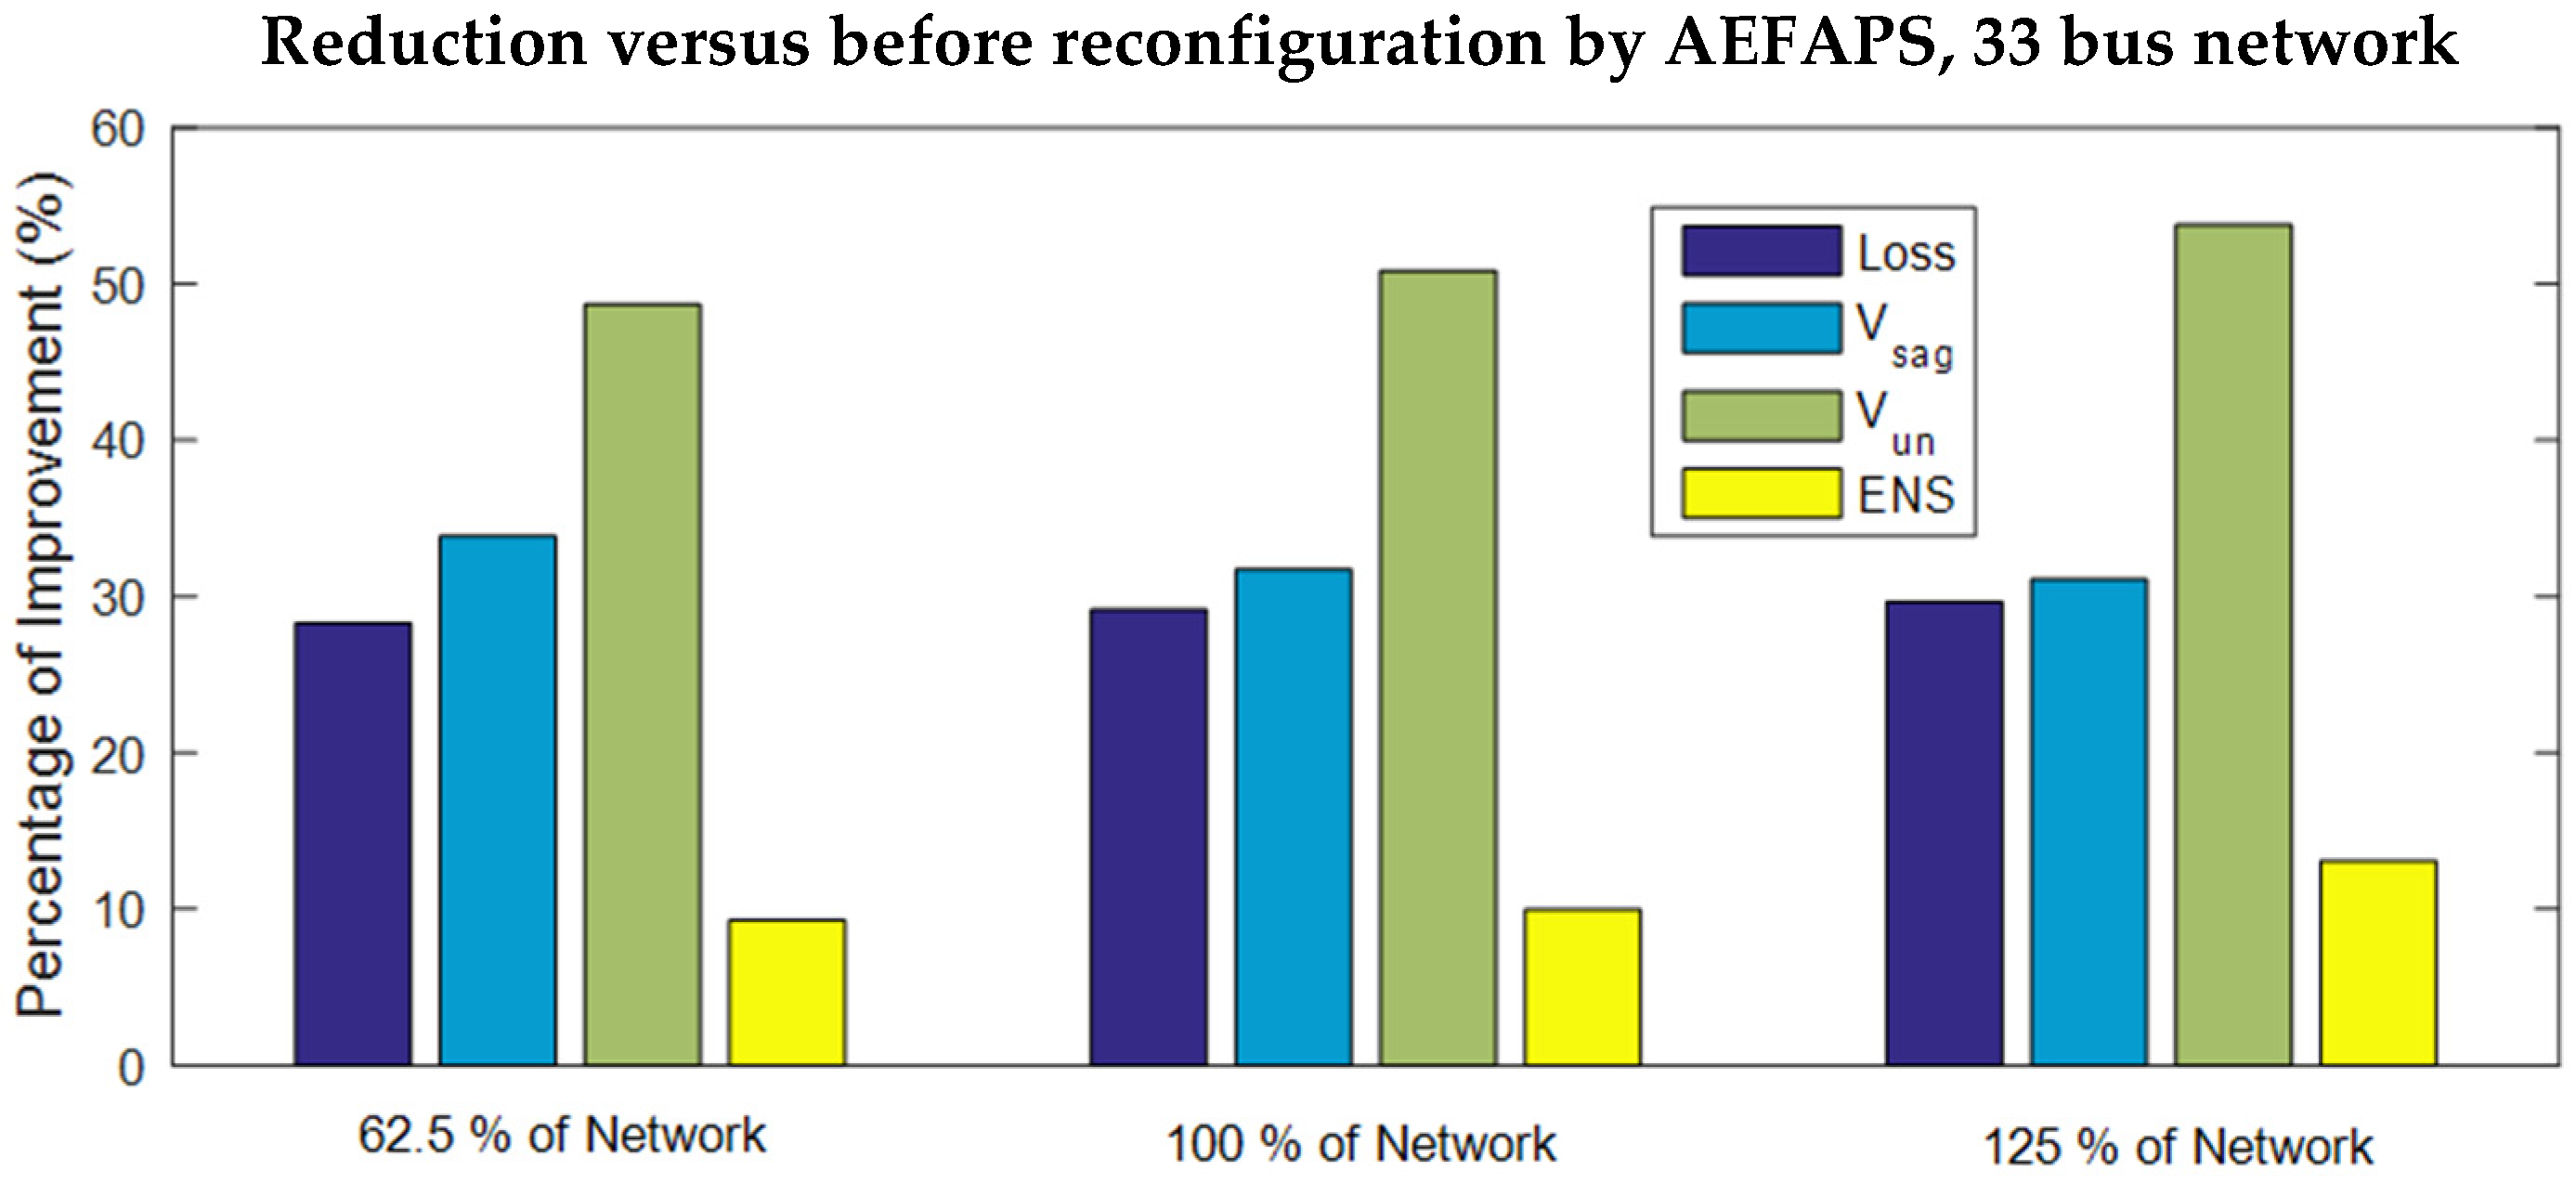
The results of many-criteria reconfiguration in different loading conditions as losses, power quality indices, and ENS and improvement percentage of each objective are presented in Table 6 compared with the base state before reconfiguration. The results showed that as demand increased, net loss also increased. In addition, the value of the voltage sag and unbalanced voltage also increased with the increasing demand, and vice versa. Furthermore, with the increase in network load, the reliability objective weakened. In the nominal load network, the objectives of losses, power quality indices, and ENS are improved by 29.15%, 31.73%, 50.83%, and 9.98%, respectively. The greatest improvement is for unbalanced voltage and the least improvement is for ENS. Table 6 shows that when increasing and decreasing the network load, similar to the nominal load condition, the most improvement is for unbalanced voltage and the least is for ENS.
In Figure 15, the improvement percentage of each objective is presented in different loadings. It is clear that increasing the network load demand increased loss and weakened power quality and reliability. Figure 16 shows that, in fuzzy many-criteria reconfiguration, the highest improvement percentage is obtained on voltage unbalance and the least improvement percentage is on network reliability.
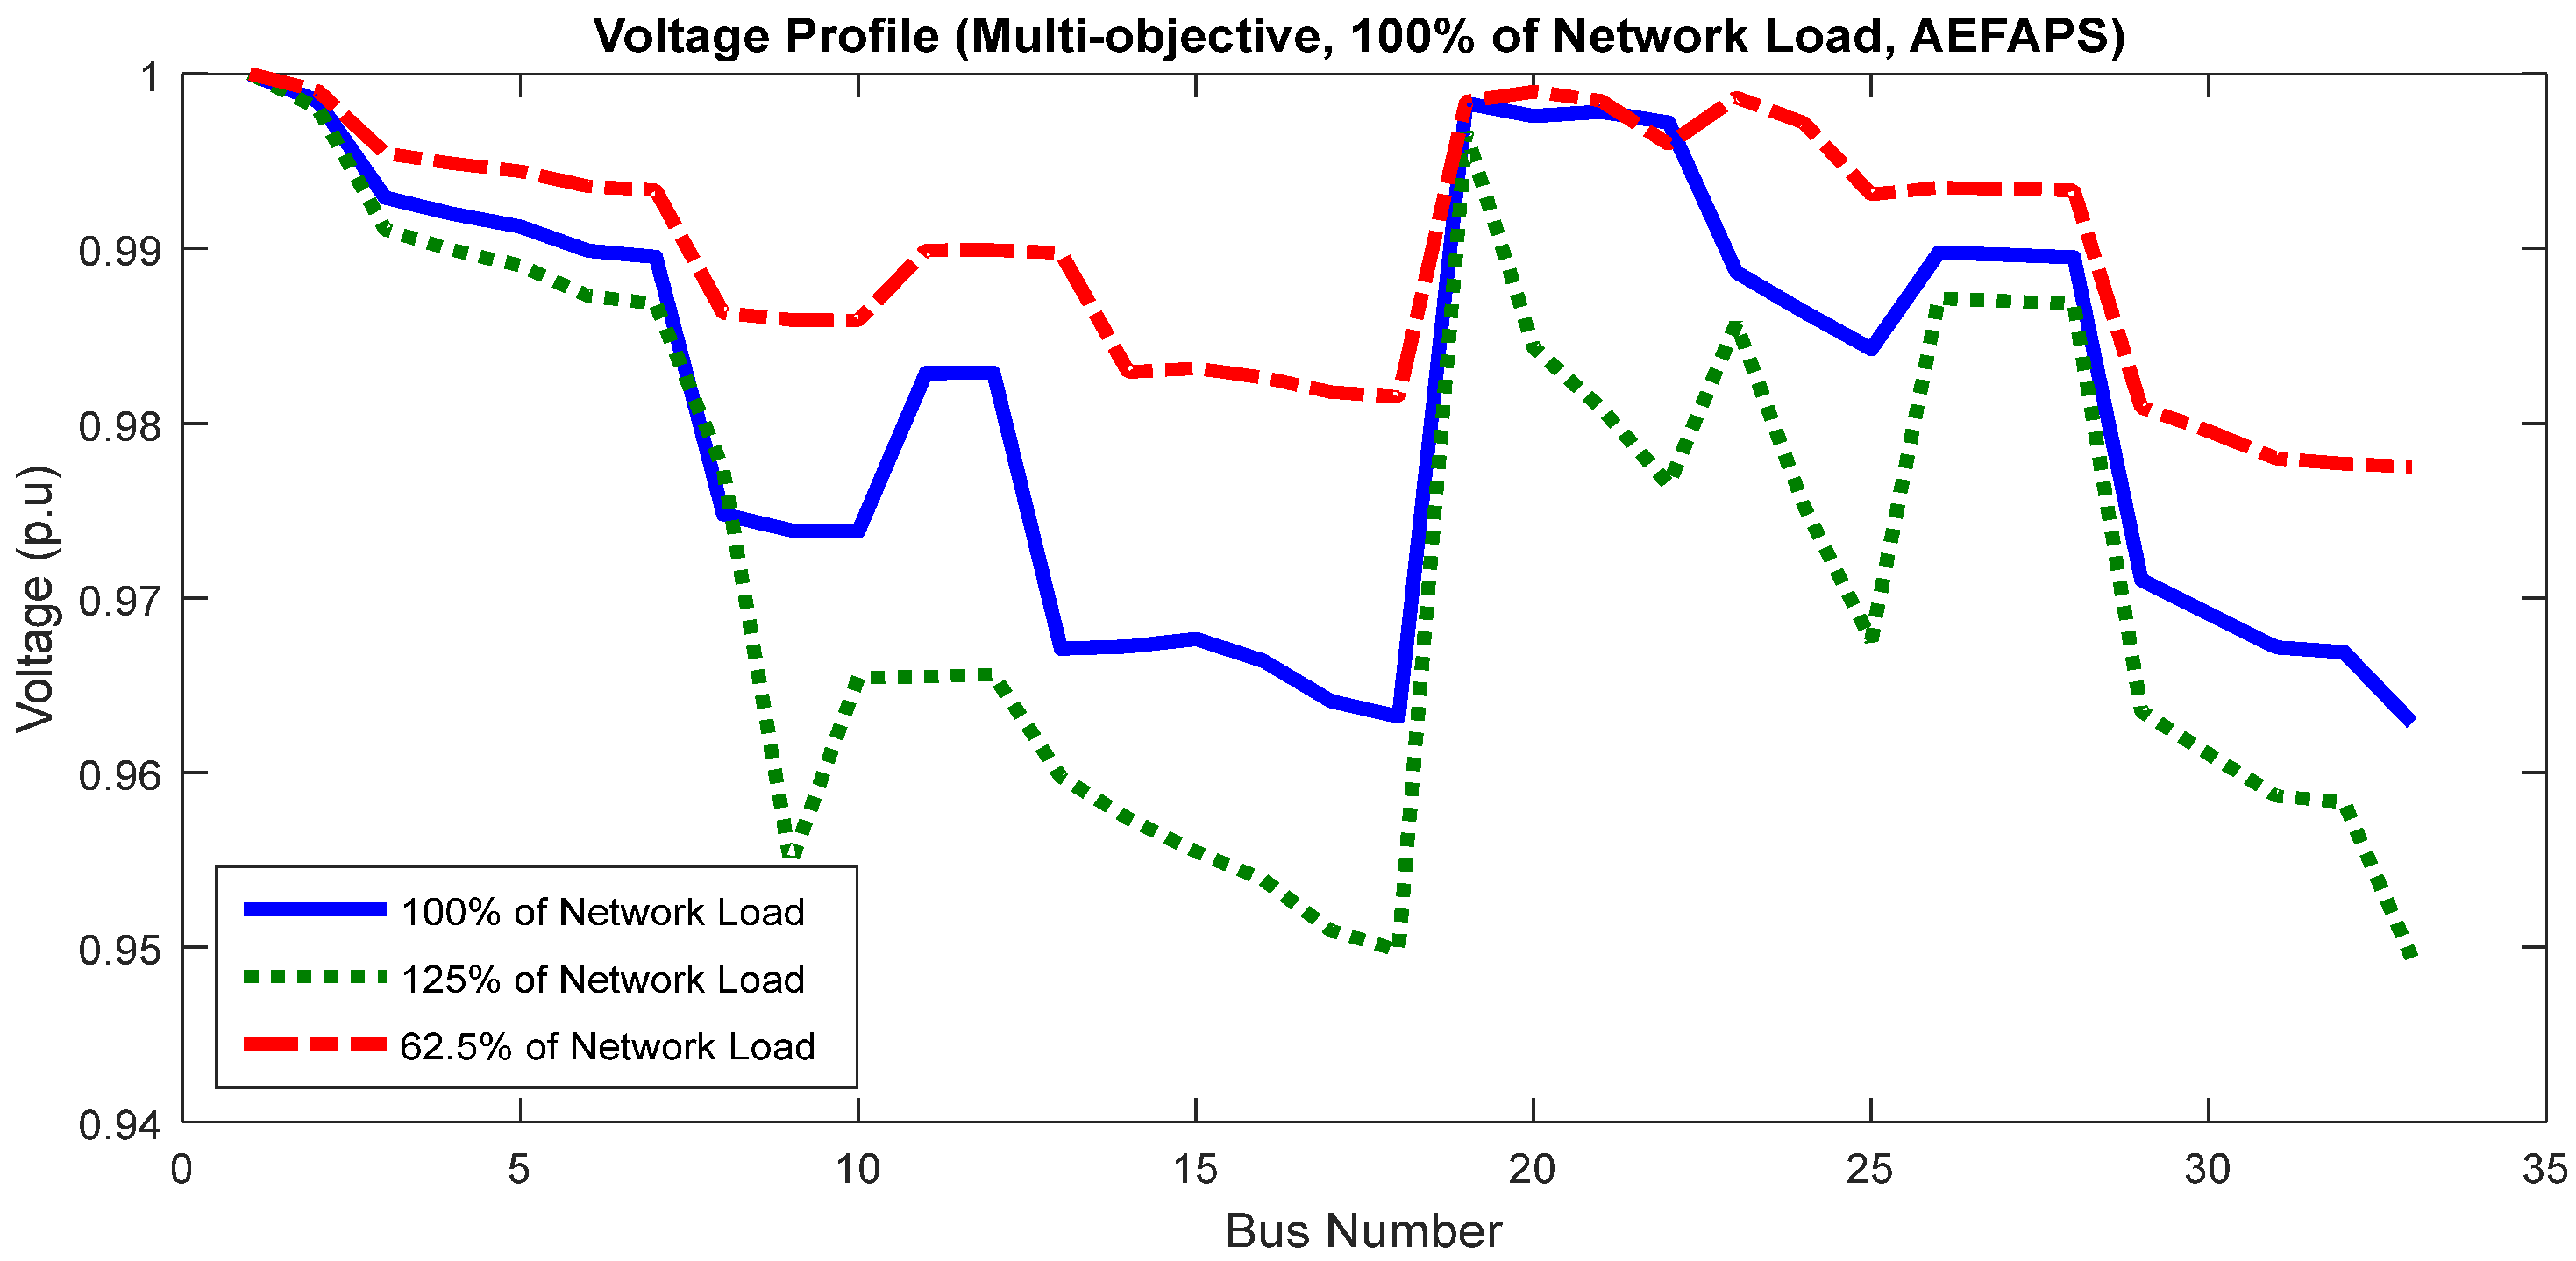
The network voltage profile for various loadings using the AEFAPS method for an unbalanced 33-bus network is shown in Figure 16. The graph shows that with demand increasing, voltage deviations increased and the network voltage profile weakened, and vice versa.

5.2. Results of Unbalanced 13-Bus Network

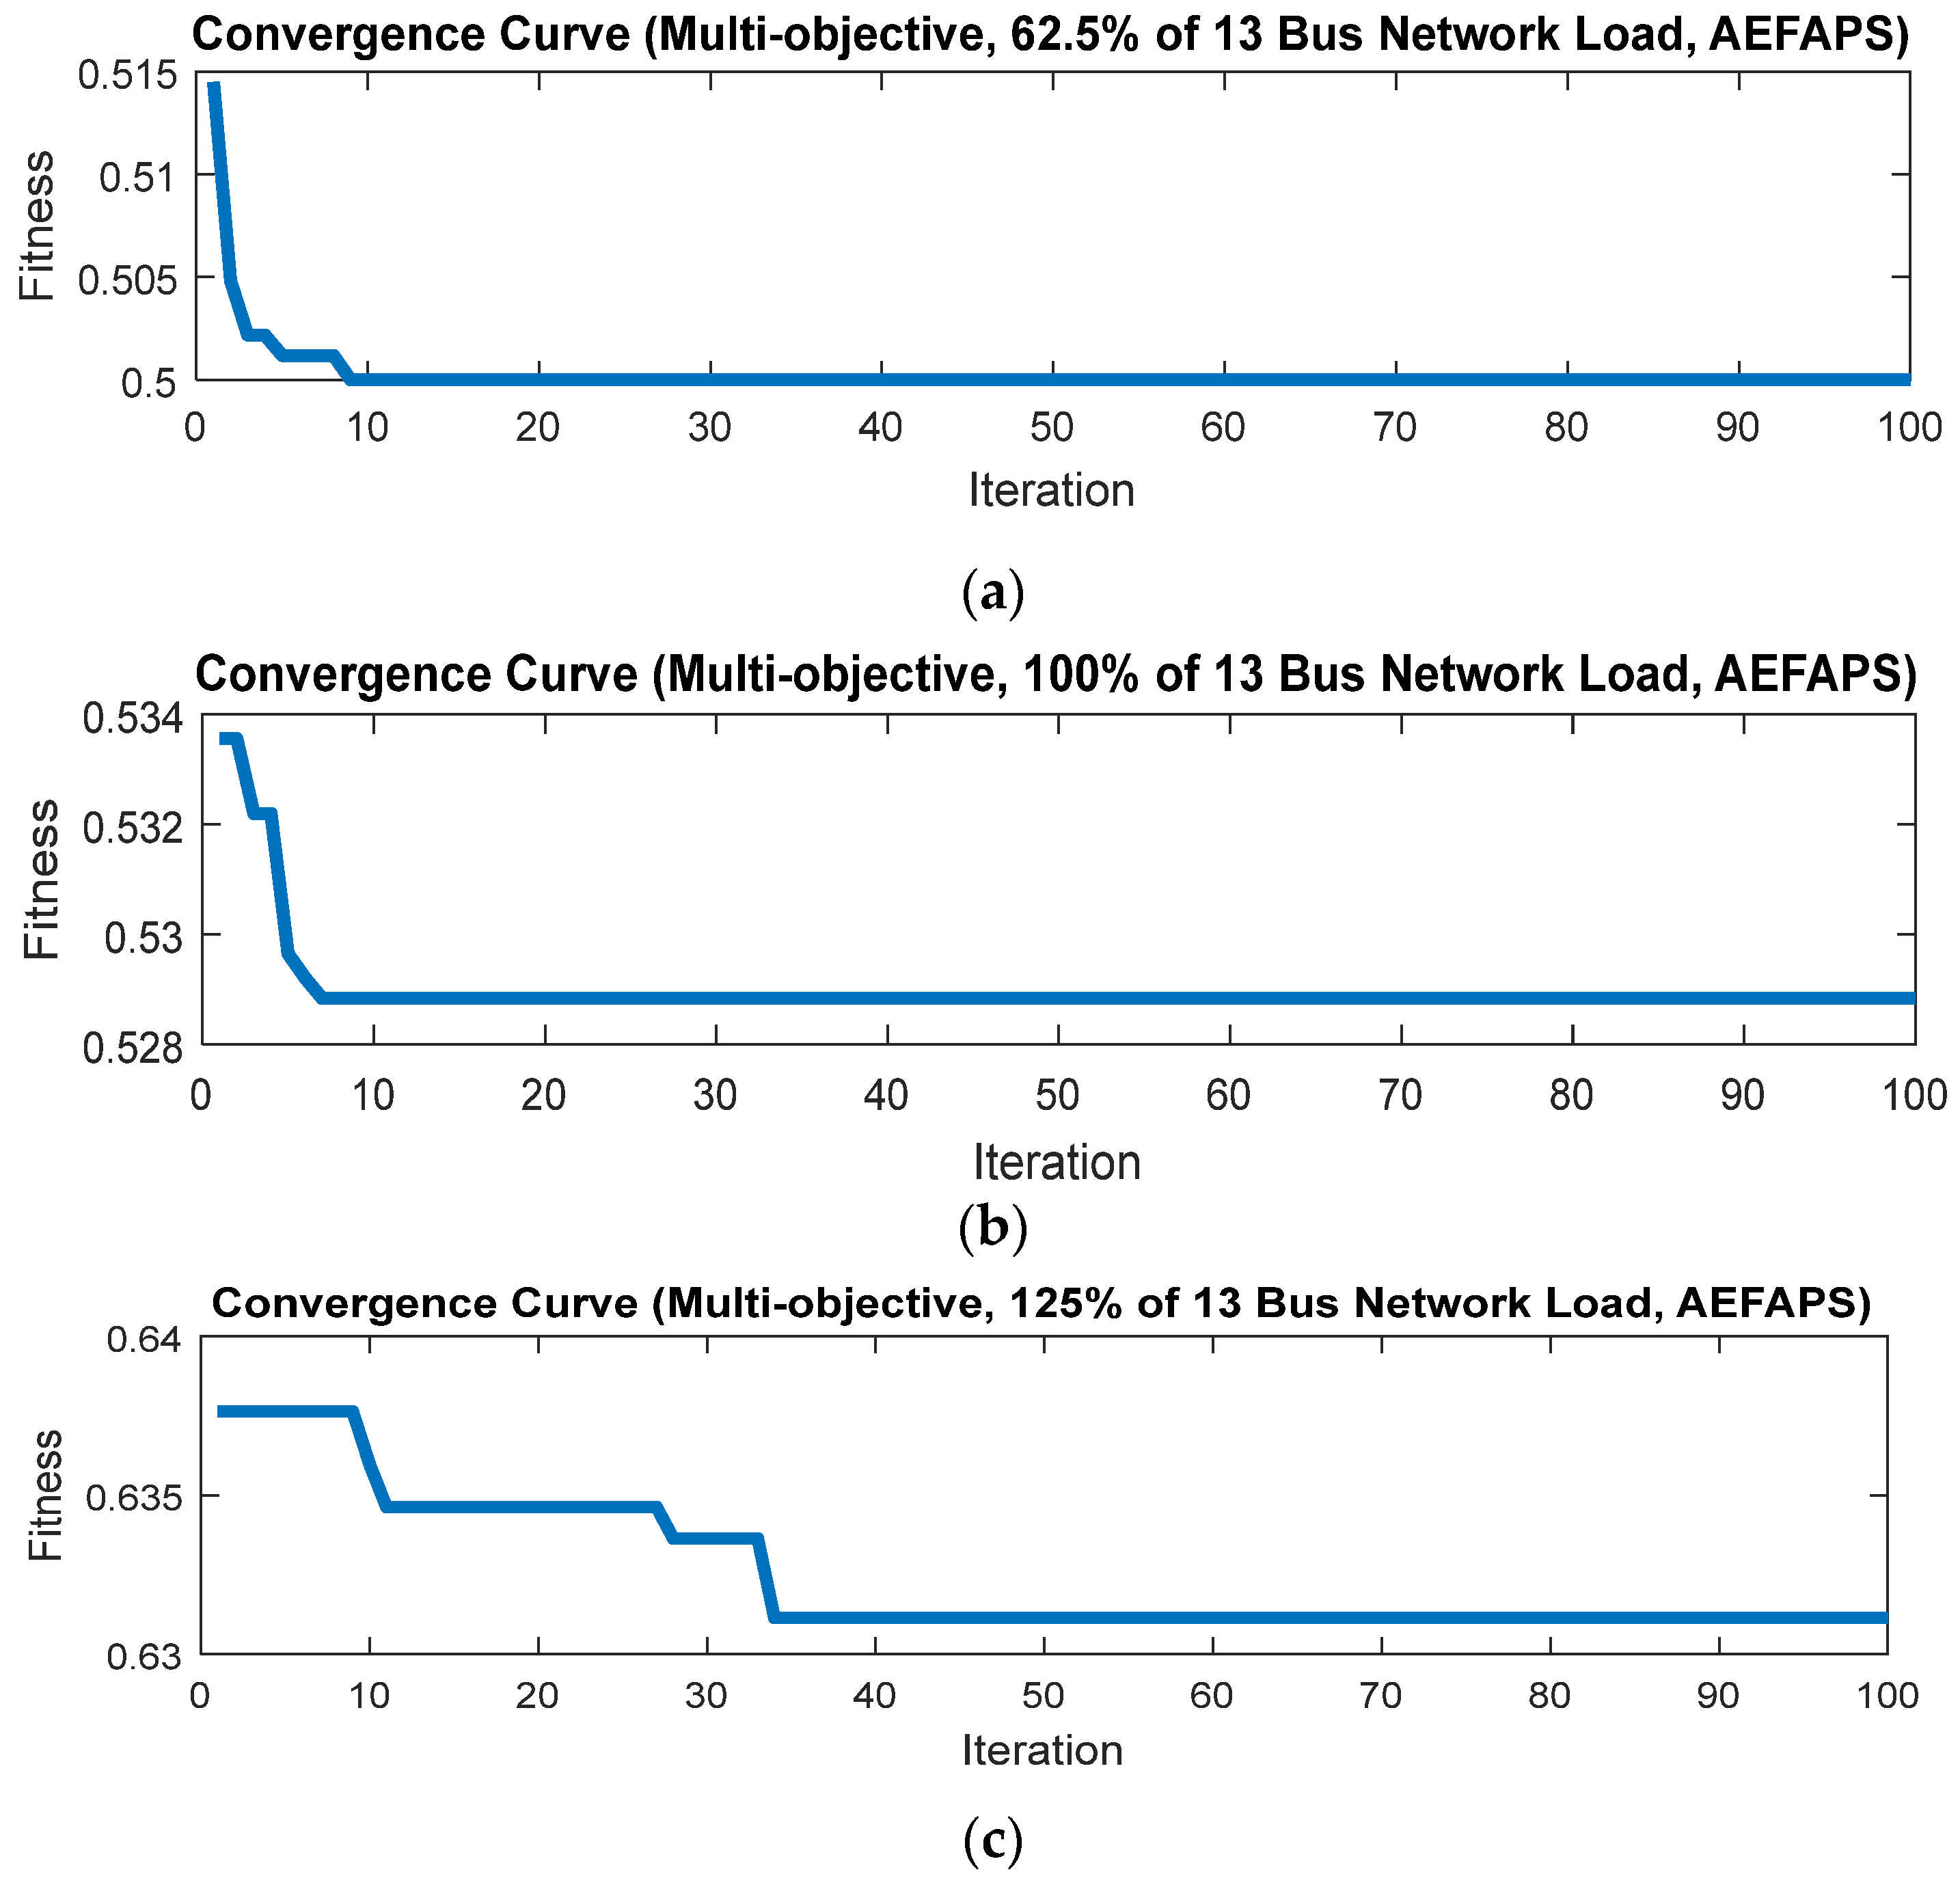
The many-criteria reconfiguration is performed to minimize the losses, voltage sag, voltage unbalance, and ENS on a real 13-bus network. The convergence process of AEFAPS in various loadings of the many-criteria reconfiguration is shown in Figure 17. Moreover, the reconfiguration results are presented in different loadings based on the AEFAPS method in Table 7, Table 8 and Table 9.
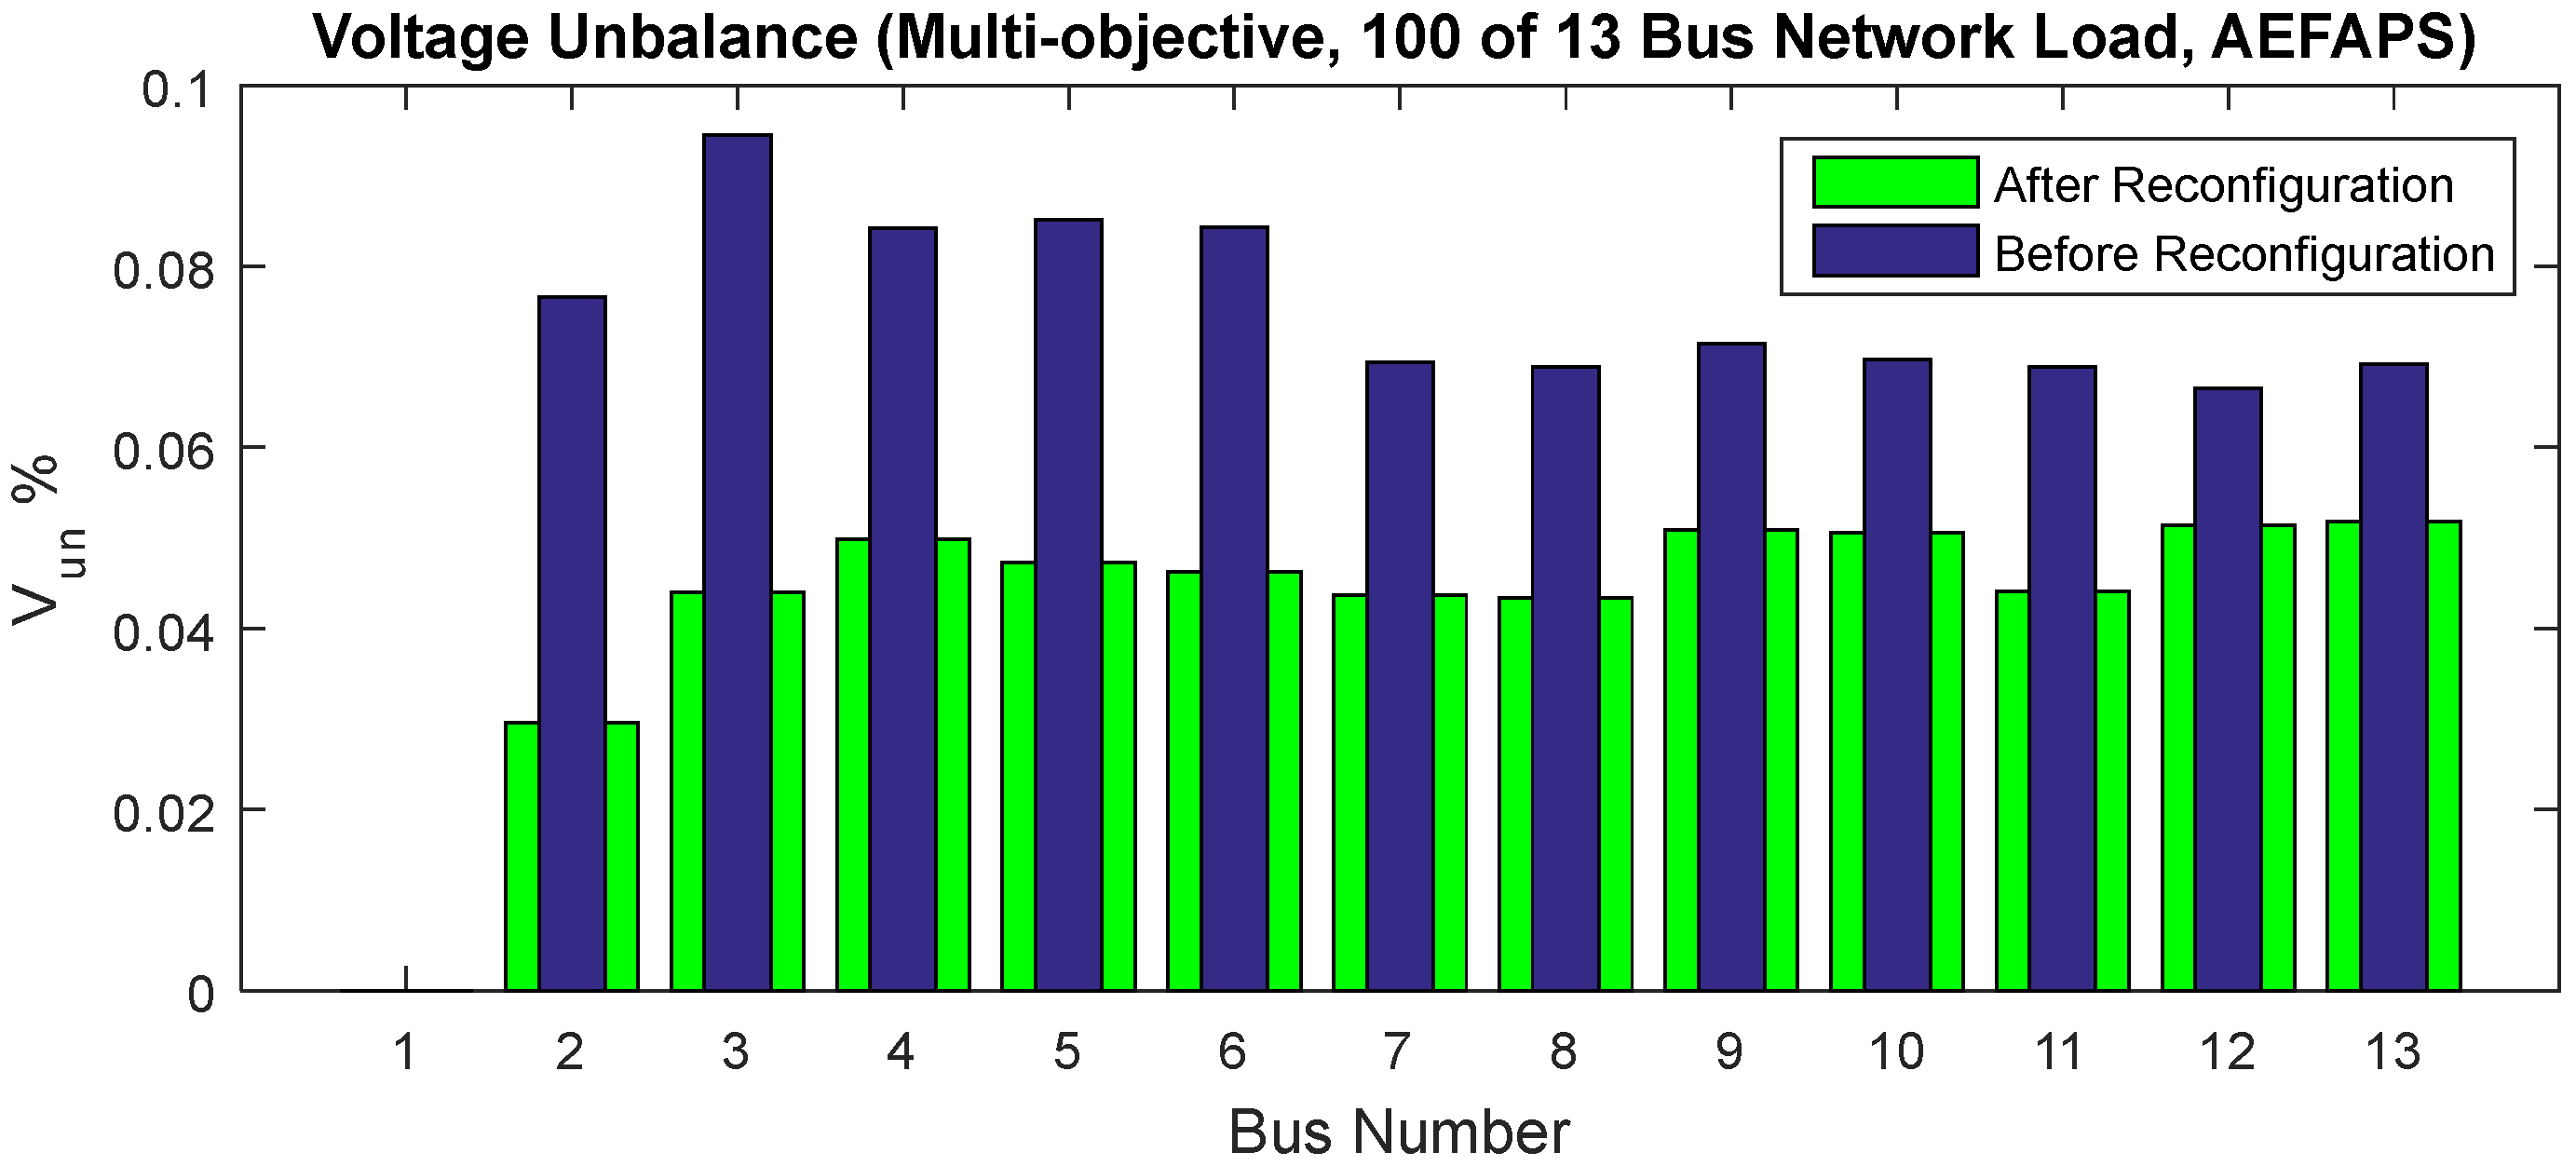
The obtained results showed that according to Table 7, Table 8 and Table 9, the objectives of losses, voltage sag and unbalance, and ENS of the 13-bus network are enhanced after reconfiguration. The value of the net losses in the base case in 100% of the network load is 175.58 kW, which after reconfiguration reached 127.5 kW. The switches 6,8,9,10, and 14 are determined as open switches by AEFAPS. Moreover, the voltage sag, voltage unbalance, and ENS values before reconfiguration are 0.980 p.u, 0.81%, and 4.348 MWh, respectively, which decreased to 0.31 p.u, 0.552%, and 1.860 kWh, respectively, after many-criteria reconfiguration. The power quality indices variations without and with many-criteria reconfiguration are displayed in Figure 18 and Figure 19, respectively. It is clear that the voltage sag and voltage unbalance values are reduced after reconfiguration in different network buses due to the positive effect of AEFAPS on the power quality of the 13-bus network.

5.3. Comparison the Results with Previous Studies

The superior ability of AEFAPS in many-criteria reconfiguration of unbalanced 13- and 33-bus networks to minimize power losses and improve power quality and reliability indices is confirmed considering different loadings compared to conventional AEFA, PSO, and GWO methods as given in Table 10. The performance of AEFAPS is analyzed and compared with previous studies. In [33], the optimal reconfiguration of the unbalanced 33-bus network is performed to minimize power losses based on adaptive ant colony optimization (AACO). Moreover, in [13], reconfiguration of the 33-bus network has been developed to improve power quality using the MINLP approach. A comparison of the proposed method’s results in terms of power losses with AACO and MINLP methods has shown that AEFAPS has fewer losses than the other methods, indicating its better performance.
In [34], the balanced 33-bus network reconfiguration to minimize power losses and ENS is presented using ant colony optimization (MACO). According to Table 11, the ENS value is obtained using AEFAPS for the unbalanced 33-bus network (unbalanced) equal to 6.48 MWh and the balanced 33-bus network (balanced) equal to 6.21 MWh. A comparison of Table 11 shows that AEFAPS performs better than the MACO method in [34] in achieving a lower ENS value for the balanced 33-bus network. Moreover, the ENS results of balanced and unbalanced 33-bus networks indicate lower reliability (higher ENS value) in the unbalanced distribution network. In addition, according to Table 12, it can be seen that the value of power losses using the AEFAPS method for the unbalanced 33-bus network (unbalanced) was 142.85 kW, while for the balanced 33-bus network (balanced) it was 139.55 kW. A comparison of the results according to Table 11 shows that AEFAPS has better capability than the RGA [18], AACO [35], MINLP [36], and CSA [37] methods in achieving lower power losses for the balanced 33-bus network. The results also show that network unbalances increase network losses compared to those with a balanced load. The results comparison of the proposed method with previous studies has confirmed the superiority of AEFAPS in solving the reconfiguration problem with desirable capability.

6. Conclusions

In this study, many-criteria reconfiguration of unbalanced networks was performed to minimize the losses and enhance power quality indices and ENS minimization using the AEFAPS method considering different loadings. A hybrid meta-heuristic optimization algorithm named AEFAPS was presented to determine the open switches of the network and the optimal configuration of the distribution network. The proposed methodology was implemented on a 33-bus IEEE unbalanced network and a real unbalanced 13-bus network. The reconfiguration results, including losses, voltage sag, and unbalance, and the ENS are presented without and with the reconfiguration based on single-criterion and many-criteria reconfiguration approaches. The results highlighted the better performance of the proposed AEFAPS in achieving a lower (better) value of different objectives than the conventional AEFA, PSO, and GWO methods based on the many-criteria reconfiguration. AEFAPS obtained optimal network configuration with open switches of 7, 11, 13, 28, and 32. In this condition, the losses, voltage sag, voltage unbalance, and ENS were determined at 146.96 kW, 0.653 p.u, 2.42%, and 6.69 MWh/year, respectively. Furthermore, the results showed that the combination of the pattern search with the AEFA achieved a better fuzzy fitness than the traditional AEFA in solving the reconfiguration problem in single-criterion and many-criteria reconfiguration approaches while achieving better values of different objectives. The results confirmed that the many-criteria decision-making optimization-based reconfiguration, in contrast to the single-criterion reconfiguration, provided satisfactory results by compromising different parts of the objective function, and each objective was within its allowable range. The results also showed that the network demand increasing caused losses, increasing and weakening of the voltage sag and unbalance, and also lower reliability of the network, and vice versa. The superior capability of AEFAPS was proved compared with the AEFA, PSO, and GWO methods with lower objective function value, lower convergence tolerance, and more convergence accuracy when compared with previous studies. A reconfiguration of the distribution network integrated with the planning of renewable energy resources to improve the reliability and power quality indices is suggested for future work.

Author Contributions

Conceptualization, A.A. and M.A.; theoretical analysis, A.A. and M.A.; modeling, A.A. and M.A.; simulation, A.A. and M.A.; writing—original draft preparation, A.A. and M.A.; writing—review and editing, A.A. and M.A. All authors have read and agreed to the published version of the manuscript.

Funding

This research received no external funding.

Institutional Review Board Statement

Not applicable.

Informed Consent Statement

Not applicable.

Data Availability Statement

Data sharing is not applicable to this article as no new data were created or analyzed in this study.

Conflicts of Interest

The authors declare no conflict of interest.

Nomenclature

P l o s s Power loss
R k Ohmic resistance of the k-th line
X k Reactance of the k-th line
V i Voltage of bus i
V j Voltage of bus j
I k Current of the k-th line
V   i   j Bus voltage i in the condition of the fault in bus j
V   s a g . a v Average voltage sag
I p ( F a u l t ) a , b , c Fault current for a fault at bus p
Y F a , b , c Admittance matrix with fault
Z p p a , b , c S-impedance of bus p
E p ( o ) a , b , c Pre-fault voltage at bus p
V N e g , i Negative sequence voltage of bus i
V P o s , i Positive sequence voltage of bus i
V u n b , a v Average of voltage unbalance
E N S Energy not supplied
P i Average of active power at load point i
U i Unavailability of load point i
λ i Line outage rate
r i Average outage time of load point i
V m i n Minimum voltage
V m a x Maximum voltage
I p l m a x Maximum allowable current
V u n b m a x Maximum voltage unbalance
V s a g m i n Minimum voltage sag
A Index matrix
μ l o s s Membership function of loss
μ E N S Membership function of ENS
μ U N Membership function of voltage unbalance
μ V Membership function of voltage sag
V d o w n a , b , c Voltage of each phase of the bus
Z u p ,   d o w n a ,   b ,   c Branch impedance of each phase of the bus
I u p ,   d o w n a ,   b ,   c Current of the line between up and down buses
p i d Best fitness position achieved by any particle i
PbestOptimal fitness
QiCharged particles of i
QjCharged particles of j
KConstant of Coulomb
RijEuclidean distance among two charged particles, i and j
NNumber of particles
V i d Velocity of the charged particle
X O Initial point
AEFAPSArtificial electric field algorithm-pattern search
AEFAArtificial electric field algorithm
PSPattern search
ENSEnergy not supplied
PSOParticle swarm optimization
GWOGrey wolf optimizer
DGDistributed generation
ACOAnt colony optimization
TSTaboo search
ACSAAdaptive cuckoo search algorithm
CSACuckoo search algorithm
BABat algorithm
FAFirefly algorithm
GAGenetic algorithm

References

  1. Naderipour, A.; Abdul-Malek, Z.; Vahid, M.Z.; Seifabad, Z.M.; Hajivand, M.; Arabi-Nowdeh, S. Optimal, Reliable and Cost-Effective Framework of Photovoltaic-Wind-Battery Energy System Design Considering Outage Concept Using Grey Wolf Optimizer Algorithm—Case Study for Iran. IEEE Access 2019, 7, 182611–182623. [Google Scholar] [CrossRef]
  2. Moghaddam, M.J.H.; Kalam, A.; Shi, J.; Nowdeh, S.A.; Gandoman, F.H.; Ahmadi, A. A New Model for Reconfiguration and Distributed Generation Allocation in Distribution Network Considering Power Quality Indices and Network Losses. IEEE Syst. J. 2020, 14, 3530–3538. [Google Scholar] [CrossRef]
  3. Naderipour, A.; Abdullah, A.; Marzbali, M.H.; Nowdeh, S.A. An improved corona-virus herd immunity optimizer algorithm for network reconfiguration based on fuzzy multi-criteria approach. Expert Syst. Appl. 2021, 187, 115914. [Google Scholar] [CrossRef] [PubMed]
  4. Shaheen, A.; Elsayed, A.; El-Sehiemy, R.A.; Abdelaziz, A.Y. Equilibrium optimization algorithm for network reconfiguration and distributed generation allocation in power systems. Appl. Soft Comput. 2020, 98, 106867. [Google Scholar] [CrossRef]
  5. Naderipour, A.; Abdul-Malek, Z.; Nowdeh, S.A.; Ramachandaramurthy, V.K.; Kalam, A.; Guerrero, J. Optimal allocation for combined heat and power system with respect to maximum allowable capacity for reduced losses and improved voltage profile and reliability of microgrids considering loading condition. Energy 2020, 196, 117124. [Google Scholar] [CrossRef]
  6. Aziz, T.; Lin, Z.; Waseem, M.; Liu, S. Review on optimization methodologies in transmission network reconfiguration of power systems for grid resilience. Int. Trans. Electr. Energy Syst. 2020, 31, e12704. [Google Scholar] [CrossRef]
  7. Naderipour, A.; Abdul-Malek, Z.; Ramachandaramurthy, V.K.; Kalam, A.; Miveh, M.R. Hierarchical control strategy for a three-phase 4-wire microgrid under unbalanced and nonlinear load conditions. ISA Trans. 2019, 94, 352–369. [Google Scholar] [CrossRef]
  8. Moghaddam, M.J.H.; Kalam, A.; Nowdeh, S.A.; Ahmadi, A.; Babanezhad, M.; Saha, S. Optimal sizing and energy management of stand-alone hybrid photovoltaic/wind system based on hydrogen storage considering LOEE and LOLE reliability indices using flower pollination algorithm. Renew. Energy 2018, 135, 1412–1434. [Google Scholar] [CrossRef]
  9. Hadidian-Moghaddam, M.J.; Nowdeh, S.A.; Bigdeli, M. Optimal sizing of a stand-alone hybrid photovoltaic/wind system using new grey wolf optimizer considering reliability. J. Renew. Sustain. Energy 2016, 8, 035903. [Google Scholar] [CrossRef]
  10. Gerez, C.; Costa, E.C.M.; Filho, A.J.S. Distribution Network Reconfiguration Considering Voltage and Current Unbalance Indexes and Variable Demand Solved through a Selective Bio-Inspired Metaheuristic. Energies 2022, 15, 1686. [Google Scholar] [CrossRef]
  11. Shaheen, A.M.; Elsayed, A.M.; El-Sehiemy, R.A.; Kamel, S.; Ghoneim, S.S.M. A modified marine predators optimization algorithm for simultaneous network reconfiguration and distributed generator allocation in distribution systems under different loading conditions. Eng. Optim. 2021, 54, 687–708. [Google Scholar] [CrossRef]
  12. Shaheen, A.; Elsayed, A.; Ginidi, A.; El-Sehiemy, R.; Elattar, E. A heap-based algorithm with deeper exploitative feature for optimal allocations of distributed generations with feeder reconfiguration in power distribution networks. Knowl.-Based Syst. 2022, 241, 108269. [Google Scholar] [CrossRef]
  13. Ch, Y.; Goswami, S.; Chatterjee, D. Effect of network reconfiguration on power quality of distribution system. Int. J. Electr. Power Energy Syst. 2016, 83, 87–95. [Google Scholar] [CrossRef]
  14. Mazza, A.; Chicco, G.; Russo, A.; Virjoghe, E.O. Multi-Objective Distribution Network Reconfiguration Based on Pareto Front Ranking. Intell. Ind. Syst. 2016, 2, 287–302. [Google Scholar] [CrossRef] [Green Version]
  15. Su, C.-T.; Chang, C.-F.; Chiou, J.-P. Distribution network reconfiguration for loss reduction by ant colony search algorithm. Electr. Power Syst. Res. 2005, 75, 190–199. [Google Scholar] [CrossRef]
  16. Abdelaziz, A.; Mohamed, F.; Mekhamer, S.; Badr, M. Distribution system reconfiguration using a modified Tabu Search algorithm. Electr. Power Syst. Res. 2010, 80, 943–953. [Google Scholar] [CrossRef]
  17. Nguyen, T.T.; Truong, A.V.; Phung, T.A. A novel method based on adaptive cuckoo search for optimal network reconfiguration and distributed generation allocation in distribution network. Int. J. Electr. Power Energy Syst. 2016, 78, 801–815. [Google Scholar] [CrossRef]
  18. Nguyen, T.T.; Truong, A.V. Distribution network reconfiguration for power loss minimization and voltage profile improvement using cuckoo search algorithm. Int. J. Electr. Power Energy Syst. 2015, 68, 233–242. [Google Scholar] [CrossRef]
  19. Diaaeldin, I.M.; Aleem, S.H.E.A.; El-Rafei, A.; Abdelaziz, A.Y.; Zobaa, A.F. Enhancement of Hosting Capacity with Soft Open Points and Distribution System Reconfiguration: Multi-Objective Bilevel Stochastic Optimization. Energies 2020, 13, 5446. [Google Scholar] [CrossRef]
  20. Lotfipour, A.; Afrakhte, H. A discrete Teaching–Learning-Based Optimization algorithm to solve distribution system reconfiguration in presence of distributed generation. Int. J. Electr. Power Energy Syst. 2016, 82, 264–273. [Google Scholar] [CrossRef]
  21. Kavousi-Fard, A.; Niknam, T. Multi-objective stochastic Distribution Feeder Reconfiguration from the reliability point of view. Energy 2014, 64, 342–354. [Google Scholar] [CrossRef]
  22. Shareef, H.; Ibrahim, A.A.; Salman, N.; Mohamed, A.; Ai, W.L. Power quality and reliability enhancement in distribution systems via optimum network reconfiguration by using quantum firefly algorithm. Int. J. Electr. Power Energy Syst. 2014, 58, 160–169. [Google Scholar] [CrossRef]
  23. Shariatkhah, M.-H.; Haghifam, M.-R.; Salehi, J.; Moser, A. Duration based reconfiguration of electric distribution networks using dynamic programming and harmony search algorithm. Int. J. Electr. Power Energy Syst. 2012, 41, 1–10. [Google Scholar] [CrossRef]
  24. Rajaram, R.; Kumar, K.S.; Rajasekar, N. Power system reconfiguration in a radial distribution network for reducing losses and to improve voltage profile using modified plant growth simulation algorithm with Distributed Generation (DG). Energy Rep. 2015, 1, 116–122. [Google Scholar] [CrossRef] [Green Version]
  25. Jafar-Nowdeh, A.; Babanezhad, M.; Arabi-Nowdeh, S.; Naderipour, A.; Kamyab, H.; Abdul-Malek, Z.; Ramachandaramurthy, V.K. Meta-heuristic matrix moth–flame algorithm for optimal reconfiguration of distribution networks and placement of solar and wind renewable sources considering reliability. Environ. Technol. Innov. 2020, 20, 101118. [Google Scholar] [CrossRef]
  26. Anita; Yadav, A. AEFA: Artificial electric field algorithm for global optimization. Swarm Evol. Comput. 2019, 48, 93–108. [Google Scholar] [CrossRef]
  27. Li, W.-M.; Jiang, Z.-H.; Wang, T.-L.; Zhu, H.-P. Optimization method based on Generalized Pattern Search Algorithm to identify bridge parameters indirectly by a passing vehicle. J. Sound Vib. 2014, 333, 364–380. [Google Scholar] [CrossRef]
  28. Wu, M.; Li, K.; Kwong, S.; Zhang, Q. Evolutionary Many-Objective Optimization Based on Adversarial Decomposition. IEEE Trans. Cybern. 2018, 50, 753–764. [Google Scholar] [CrossRef] [Green Version]
  29. Shi, Y. Particle swarm optimization: Developments, applications and resources. In Proceedings of the 2001 Congress on Evolutionary Computation (IEEE Cat. No. 01TH8546), Seoul, Korea, 27–30 May 2001; Volume 1, pp. 81–86. [Google Scholar]
  30. Mirjalili, S.; Mirjalili, S.M.; Lewis, A. Grey wolf optimizer. Adv. Eng. Softw. 2014, 69, 46–61. [Google Scholar] [CrossRef] [Green Version]
  31. Gunther, E.; Mebta, H. A survey of distribution system power quality-preliminary results. IEEE Trans. Power Deliv. 1995, 10, 322–329. [Google Scholar] [CrossRef]
  32. Nowdeh, S.A.; Davoudkhani, I.F.; Moghaddam, M.H.; Najmi, E.S.; Abdelaziz, A.Y.; Ahmadi, A.; Razavi, S.; Gandoman, F.H. Fuzzy multi-objective placement of renewable energy sources in distribution system with objective of loss reduction and reliability improvement using a novel hybrid method. Appl. Soft Comput. 2019, 77, 761–779. [Google Scholar] [CrossRef]
  33. Swarnkar, A.; Gupta, N.; Niazi, K. Adapted ant colony optimization for efficient reconfiguration of balanced and unbalanced distribution systems for loss minimization. Swarm Evol. Comput. 2011, 1, 129–137. [Google Scholar] [CrossRef]
  34. Mirhoseini, S.H.; Hosseini, S.M.; Ghanbari, M.; Gandomkar, M. Multi-objective Reconfiguration of Distribution Network Using a Heuristic Modified Ant Colony Optimization Algorithm. Modeling Simul. Electr. Electron. Eng. 2015, 1, 23–33. [Google Scholar] [CrossRef]
  35. Kasaei, M.J.; Nikoukar, J. DG allocation with consideration of costs and losses in distribution networks using ant colony algorithm. Majlesi J. Electr. Eng. 2016, 10, 51–56. [Google Scholar]
  36. Wu, Y.-K.; Lee, C.-Y.; Liu, L.-C.; Tsai, S.-H. Study of Reconfiguration for the Distribution System With Distributed Generators. IEEE Trans. Power Deliv. 2010, 25, 1678–1685. [Google Scholar] [CrossRef]
  37. Taher, S.A.; Karimi, M.H. Optimal reconfiguration and DG allocation in balanced and unbalanced distribution systems. Ain Shams Eng. J. 2014, 5, 735–749. [Google Scholar] [CrossRef] [Green Version]
  38. El Ela, A.A.; Allam, S.; Shatla, M. Maximal optimal benefits of distributed generation using genetic algorithms. Electr. Power Syst. Res. 2010, 80, 869–877. [Google Scholar] [CrossRef]
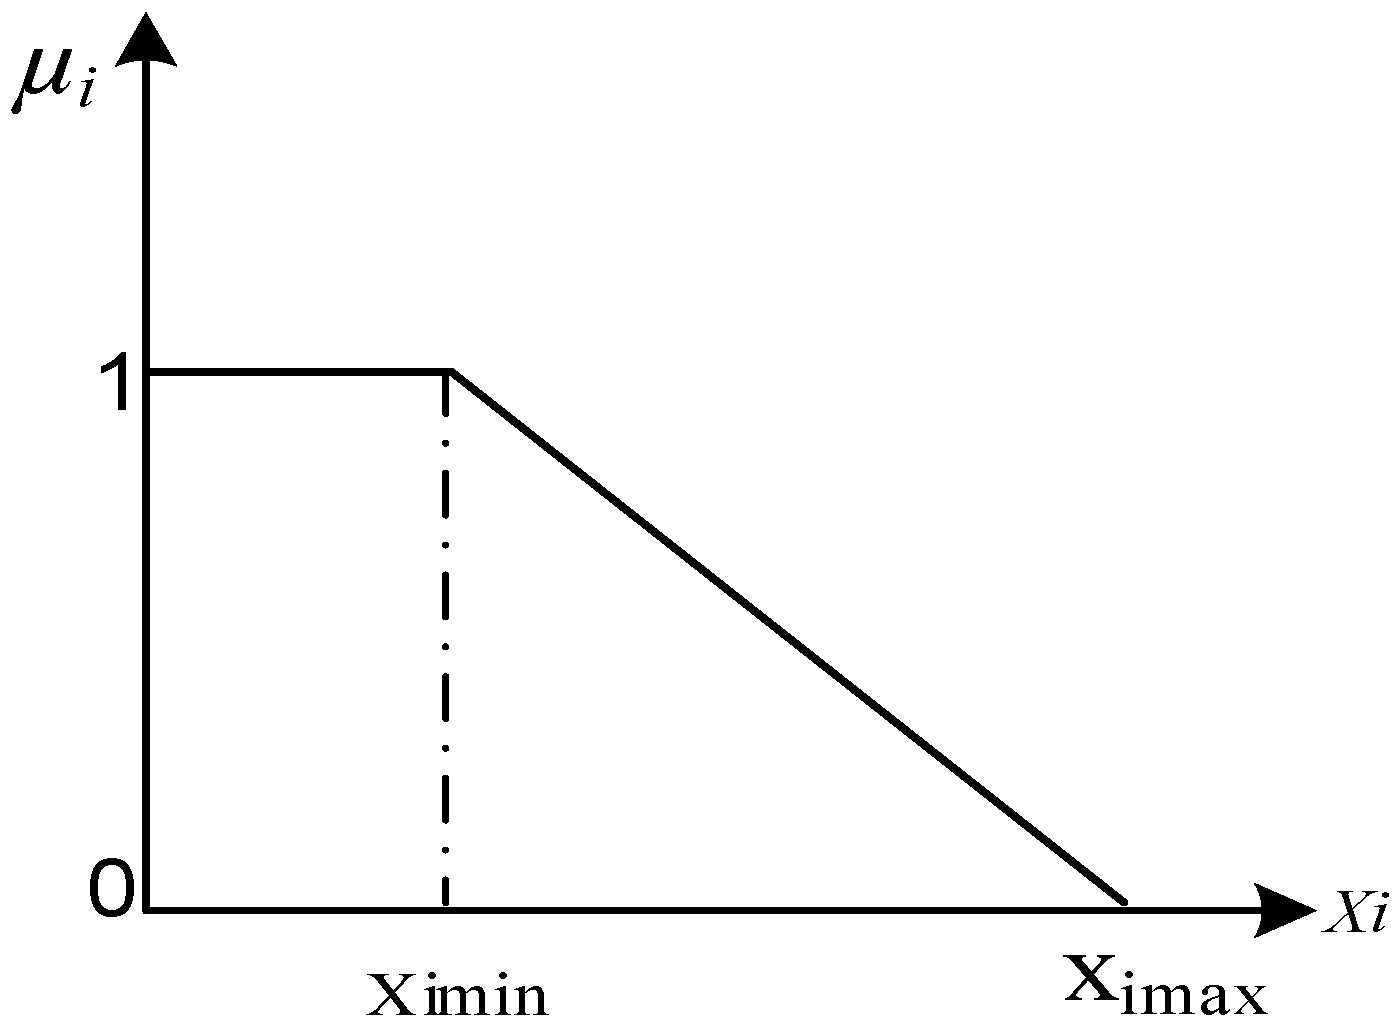
Figure 1. Values of μ for each objective function.
Energies 15 05269 g001
Figure 2. Load flow paths (a) before and (b) after the distribution network reconfiguration.
Energies 15 05269 g002
Figure 3. The mesh formation process.
Energies 15 05269 g003
Figure 4. Flowchart of the AEFAPS method.
Energies 15 05269 g004
Figure 5. Convergence curve of different methods in a many-criteria reconfiguration solution for a 33-bus network (100% of network load).
Energies 15 05269 g005
Figure 6. The power loss in single-criterion and many-criteria optimizations using AEFAPS.
Energies 15 05269 g006
Figure 7. The voltage sag in single-criterion and many-criteria optimizations using AEFAPS.
Energies 15 05269 g007
Figure 8. The voltage unbalance in single-criterion and many-criteria optimizations using AEFAPS.
Energies 15 05269 g008
Figure 9. The ENS in single-criterion and many-criteria optimizations using AEFAPS.
Energies 15 05269 g009
Figure 10. Voltage sag variations for an unbalanced 33-bus network using AEFAPS before and after many-criteria reconfiguration (nominal load).
Energies 15 05269 g010
Figure 11. Voltage unbalances for an unbalanced 33-bus network via AEFAPS before and after reconfiguration (nominal load).
Energies 15 05269 g011
Figure 12. Voltage profile of a 33-bus network using AEFAPS before and after fuzzy many-criteria reconfiguration (nominal load).
Energies 15 05269 g012
Figure 13. Convergence curve of the four methods in many-criteria reconfiguration of an unbalanced 33-bus network (125% of network nominal load).
Energies 15 05269 g013
Figure 14. Convergence curve of the four methods in many-criteria reconfiguration of an unbalanced 33-bus network (62.5% of network nominal load).
Energies 15 05269 g014
Figure 15. Percentage of improvement of objective function indices by AEFAPS for an unbalanced 33-bus network.
Energies 15 05269 g015
Figure 16. The 33-bus network voltage profile in loadings via AEFAPS with reconfiguration.
Energies 15 05269 g016
Figure 17. Convergence curve of the AEFAPS method in many-criteria reconfiguration: (a) 62.5%, (b) 100%, and (c) 125% of network load.
Energies 15 05269 g017
Figure 18. Voltage sag before and after many-criteria reconfiguration of an unbalanced 13-bus network using AEFAPS.
Energies 15 05269 g018
Figure 19. Voltage unbalances before and after many-criteria reconfiguration of an unbalanced 13-bus network using AEFAPS.
Energies 15 05269 g019
Table 1. Summary of previous studies on reconfiguration.
Ref.Power LossVoltage SagVoltage UnbalanceENSMulti-ObjectiveUnbalanced NetworkImproved/Hybrid AlgorithmResearch Gap
[10]Not considering the power quality and reliability indices
[4]Not evaluating the power quality and reliability indices
[11]Without the power quality and reliability indices
[12]Not studying the power quality and reliability indices
[13]Not incorporating power quality and reliability indices
[14]Without the power quality indices
[15]Without the power quality and reliability indices
[16]Not investigating the power quality and reliability indices
[17]Without the power quality and reliability indices
[18]Not considering the power quality and reliability indices
[19]Without the power quality and reliability indices
[20]Without studying the power quality and reliability indices
[21]Without the power quality and reliability indices
[22]Not considering the voltage sag and unbalanced network
[23]Not considering the power quality and reliability indices
[24]Without the power quality and reliability indices
This paperConsidering power quality, reliability, unbalanced network, and hybrid algorithm
Table 2. The results of base unbalanced IEEE 33-bus distribution network.
ENS (kWh)Vun (%)Vsag (p.u)Loss (kW)Item
7.434.920.9566207.44Value
Table 3. Results of single-criterion and many-criteria reconfiguration of an unbalanced 33-bus network (rated load, 100%).
ItemInitialMethodMin LossMin VsagMin VunMin ENSMany-Criteria
Solution33, 34, 35, 36, 37AEFAPS7, 9, 14, 32, 379, 14, 28, 32, 337, 12, 21, 27, 327, 9, 14, 16, 287, 11, 13, 28, 32
AEFA7, 10, 28, 32, 347, 10, 13, 17, 286, 8, 10, 28, 307, 10, 14, 16, 278, 14, 28, 32, 33
PSO7, 14, 21, 28, 327, 10, 14, 17, 2811, 12, 20, 28, 3013, 16, 20, 21, 288, 13, 28, 32, 33
GWO9, 14, 28, 31, 339, 14, 17, 28, 3312, 20, 21, 28, 3013, 16, 21, 28, 337, 14, 21, 28, 32
Loss
(kW)
207.44AEFAPS142.85147.61167.96158.17146.96
AEFA147.59172.64207.73165.11148.51
PSO148.19153.12204.02186.87150.57
GWO147.54154.14203.38179.69153.19
Vsag
(p.u)
0.9566AEFAPS0.710.600.860.660.653
AEFA0.6650.6260.9630.7270.667
PSO0.7130.6151.0140.8230.684
GWO0.6440.6171.0140.7780.713
Vun
(%)
4.922AEFAPS3.734.062.053.782.42
AEFA3.797.172.113.712.47
PSO2.413.622.244.372.42
GWO3.844.282.214.092.42
ENS (MWh/year)7.432AEFAPS6.716.757.816.486.69
AEFA8.088.347.856.516.90
PSO7.256.5577.506.607.02
GWO6.936.357.516.517.25
Table 4. Simulation results of single-criterion and many-criteria reconfiguration of an unbalanced 33-bus network (125% of network nominal load).
ItemInitialMethodMin LossMin VsagMin VunMin ENSMany-Criteria
Solution33, 34, 35, 36, 37AEFAPS7, 9, 14, 32, 377, 10, 14, 17, 287, 12, 21, 27, 3210, 13, 16, 28, 337, 10, 28, 32, 34
AEFA9, 7, 14, 28, 317, 9, 14, 17, 286, 8, 12, 28, 307, 10, 14, 16, 288, 14, 28, 32, 33
PSO7, 14, 17, 21, 289, 14, 17, 28, 3311, 12, 20, 28, 307, 9, 14, 16, 288, 14, 28, 32, 33
GWO7, 10, 17, 14, 287, 11, 17, 28, 347, 12, 21, 27, 327, 9, 14, 16, 287, 10, 13, 17, 28
Loss
(kW)
331.19AEFAPS226.38236.92302.25259.63232.98
AEFA229.18237.09300.76243.10240.88
PSO239.36244.65324.54243.45241.46
GWO236.92239.29251.22243.45239.10
Vsag
(p.u)
1.209AEFAPS0.8390.7751.2700.8380.833
AEFA0.8590.7771.2640.7980.894
PSO0.8660.7781.2830.8010.841
GWO0.7750.7950.9450.8010.838
Vun
(%)
6.341AEFAPS4.9394.6132.4464.4492.932
AEFA3.9824.7462.5244.6492.943
PSO5.1375.4542.8394.8063.156
GWO4.6134.4582.6244.8064.329
ENS (MWh/year)9.291AEFAPS9.0908.19610.1437.8818.074
AEFA9.0988.17410.5178.1288.666
PSO8.7317.9439.3948.1078.630
GWO8.1968.2459.0158.1078.156
Table 5. The results of single-criterion and many-criteria reconfiguration of an unbalanced 33-bus network (62.5% of network nominal load).
ItemInitialMethodMin LossMin VsagMin VunMin ENSMany-Criteria
Solution33, 34, 35, 36, 37AEFAPS7, 9, 14, 32, 377, 9, 14, 28, 366, 8, 10, 28, 3010, 13, 16, 28, 337, 10, 13, 28, 36
AEFA7, 10, 14, 36, 377, 9, 12, 17, 286, 8, 9, 27, 3011, 13, 17, 25, 338, 14, 28, 32, 33
PSO7, 11, 28, 32, 347, 14, 17, 21, 287, 8, 10, 12, 2711, 12, 16, 20, 287, 13, 21, 28, 32
GWO7, 10, 14, 17, 287, 10, 14, 17, 2812, 21, 27, 30, 337, 11, 14, 16, 287, 10, 13, 17, 28
Loss
(kW)
331.19AEFAPS54.6656.4971.3162.3056.35
AEFA55.7257.9071.3265.6457.01
PSO56.1259.9779.6771.6158.85
GWO57.0657.0673.4558.4457.57
Vsag
(p.u)
1.209AEFAPS0.4070.3780.6130.4090.389
AEFA0.4080.3920.6190.4490.424
PSO0.4040.4250.6100.5120.444
GWO0.3810.3810.5850.3930.388
Vun
(%)
6.341AEFAPS2.3581.9261.1612.1091.513
AEFA2.4152.1651.2131.9821.504
PSO1.5222.4411.9332.6651.330
GWO2.2072.2071.2182.1722.069
ENS (MWh/year)9.291AEFAPS4.5454.2735.0713.9404.214
AEFA4.4914.1485.1014.0464.372
PSO4.3024.3654.3674.1214.501
GWO4.0984.0984.6414.0794.128
Table 6. Comparison of results of different loadings by AEFAPS for an unbalanced 33-bus network.
ItemSolutionLoss (Kw)Vsag (p.u)Vun (%)ENS (kWh)
62.5%7, 10, 13, 28, 3656.35
28.29%
0.389
33.84%
1.513
48.67%
4.214
9.27%
100%7, 10, 13, 28, 36146.96
29.15%
0.653
31.73%
2.42
50.83%
6.69
9.98%
125%7, 10, 28, 32, 34232.98
29.65%
0.833
31.10%
2.932
53.76%
8.074
13.09%
Table 7. The results of many-criteria reconfiguration of an unbalanced 13-bus network (100% of network load).
ItemSolutionLoss (kW)Vsag (p.u)Vun (%)ENS (kWh)
Initial13,14,15,16,17175.580.9800.814.346
100% of Network Load6,8,9,10,14127.510.310.5521.860
Table 8. The results of many objective reconfigurations of an unbalanced 13-bus network (62.5% of network load).
ItemSolutionLoss (kW)Vsag (p.u)Vun (%)ENS (kWh)
Initial13,14,15,16,17191.671.2041.1425.433
62.5% of Network Load6,8,9,11,14143.480.490.7402.505
Table 9. The results of many-criteria reconfiguration of an unbalanced 13-bus network (125% of network load).
ItemSolutionLoss (kW)Vsag (p.u)Vun (%)ENS (kWh)
Initial13,14,15,16,17191.671.2041.1425.433
125% of Network Load6,8,9,11,14143.480.490.7402.505
Table 10. Comparative results of the 33-bus network considering the active loss.
ItemOpen SwitchesLoss (kW)
AEFAPS7, 9, 14, 32, 37142.85
AEFA7, 10, 28, 32, 34147.59
PSO7, 14, 21, 28, 32153.19
GWO9, 14, 28, 31, 33147.54
AACO [33]7, 9, 14, 28, 32143.87
MINLP [13]7, 9, 14, 28, 36144.49
Table 11. Comparative results of the unbalanced 33-bus network incorporating reliability.
ItemOpen SwitchesLoss (kW)
AEFAPS (unbalanced)7, 9, 14, 16, 286.48
AEFAPS (balanced)7, 9, 11, 28, 366.21
AEFA (unbalanced)7, 10, 14, 16, 276.51
PSO (unbalanced)13, 16, 20, 21, 286.60
GWO (unbalanced)13, 16, 21, 28, 336.51
MACO (balanced) [34]7, 11, 14, 36, 376.446
Table 12. Comparative results of the balanced and unbalanced 33-bus network incorporating active losses.
ItemOpen SwitchesLoss (kW)
AEFAPS (unbalanced)7, 9, 14, 32, 37142.85
AEFAPS (balanced)7, 9, 14, 32, 37139.55
ACS (balanced)7, 9, 14, 28, 32139.98
AACO (balanced) [35]7, 9, 14, 28, 32139.98
MINLP (balanced) [36]7, 9, 14, 32, 37139.55
CSA (balanced) [37]7, 9, 14, 32, 37139.84
RGA (balanced) [18]7, 9, 14, 32, 37139.84
GA (balanced) [38]7, 9, 14, 32, 37139.84
Publisher’s Note: MDPI stays neutral with regard to jurisdictional claims in published maps and institutional affiliations.