Abstract
Refrigerant maldistribution severely deteriorates the heat transfer performance of a microchannel evaporator. Compared with the refrigerant distribution among flat tubes along the header, refrigerant distribution among microchannels in the flat tube in the airflow direction has barely been paid attention. In this paper, a heat transfer mathematical model of a microchannel evaporator’s flat tube composed of vertically placed parallel microchannels in the airflow direction was developed. The Refrigerant distribution among the microchannels was evaluated and its influence on heat transfer between air and refrigerant was analyzed. The results showed that the refrigerant distribution and heat transfer performance between air and refrigerant were interrelated and interacted with each other. The temperature of the air leaving the microchannel evaporator changed along the microchannel because of uneven refrigerant distribution among the microchannels, and the air temperature difference between air leaving out of the bottom and the top of the evaporator was approximately 2.13 °C. Ignoring the heat transfer from adjacent microchannels will lead to a small heat transfer deviation for the flat tube; thus, heat transfer among microchannels can be neglected.
1. Introduction
The application of microchannel heat exchangers in air source heat pumps (ASHPs) has attracted scholars’ attention for a long time because of the advantages of good heat transfer performance, lower refrigerant charge, and less copper consumption. When the microchannel heat exchanger works as a condenser of an ASHP, higher energy efficiency can be achieved. However, when the microchannel heat exchanger was used as an evaporator of an ASHP, its heat transfer performance decreased sharply [1,2], even up to 23% [3]. The deteriorated heat transfer performance of the microchannel evaporator led to a reduction in ASHP’s energy efficiency by approximately 20–30% [4]. Research by many scholars shows that refrigerant maldistribution is one of the most important reasons for the deteriorated heat transfer performance of the microchannel evaporator. Therefore, refrigerant maldistribution attracts extensive attention from scholars. The results of a study by T. Kulkarni et al. [5] showed that mass flow maldistribution could not be controlled by changing either the port/header diameter or the refrigerant state at the inlet but only by minimizing the pressure gradients along the header. There are numerous factors that affect refrigerant distribution in a microchannel evaporator, such as the header geometry and orientation, fluid properties, and inlet conditions.
The orientation is very important for the refrigerant’s even distribution among microchannels. When the header is vertical and the microchannel is horizontal, phase separation easily occurs. The superheated refrigerant always appears at the top in each pass, while the liquid appears at the bottom. Phase separation caused by gravity is the main reason for refrigerant maldistribution, which will eventually deteriorate the heat transfer performance of a microchannel evaporator. An experimental study by Cho et al. [6] indicated that a horizontal header with a vertical upward flow showed better refrigerant distribution than a vertical header with horizontal flow. Bowers et al. [7] and Y. Liu [8] studied the distribution of two-phase refrigerant in heat exchangers with different orientations. The experimental results of Liu et al. [8] showed that when the inlet refrigerant was slug flow, the refrigerant distribution of a horizontal header with upward refrigerant flow in the microchannels was the most uniform, and when the inlet refrigerant was slug annular flow, the refrigerant distribution of a vertical header was the best. A study by Dario et al. [9] showed that the refrigerant distribution became more uniform as the flow rate increased when the header was placed horizontally. In contrast, the distribution of the refrigerant became worse when the header was vertical. Kim et al. [10] studied the distribution of refrigerant when the header and channel were horizontally placed with different inclination angles, and they found that the distribution of the refrigerant worsened with the increase of the inclination angle. Won-Jong Lee et al. [11] developed phase-distribution models for a vertical header, and the results showed that the heat transfer could decrease by a maximum of approximately 63% for a microchannel evaporator compared with the ideal uniform distribution case. Wenju Hu et al. [12] experimentally studied the influence of the header’s placement on refrigerant distribution, and the results showed that horizontal headers were beneficial to refrigerant distribution compared to a microchannel evaporator with vertical headers.
To improve the refrigerant distribution in microchannel evaporators, measures have also been taken in terms of the geometry of header. Lee et al. [13] studied the effects on refrigerant distribution of a flat tube’s insertion depth into the header, and they argue that the a uniform refrigerant distribution can be achieved by adjusting the depth of the flat tube inserted into the header. Kim et al. [14,15,16] studied the influence of inserted devices, such as wire mesh, a perforated plate, and a perforated tube, on the refrigerant distribution, and they found that a perforated tube was effective for the uniform distribution of refrigerant. Lately, N.-H. Kim et al. [17] studied various combinations of perforated tubes, including perforated tubes, perforated tubes with a perforated plate, an orifice and perforated tubes, and concentric perforated tubes, and the experimental results showed that a better refrigerant distribution could be obtained by using a concentric perforated tube. Ahmad et al. [18] experimentally studied the effects of the expansion orifice and splashing grid on the uniform distribution of refrigerant. The results showed that the expansion orifice could cause the two-phase flow to produce a high-speed jet, which made the distribution of the two-phase flow more uniform. Wu et al. [19] proposed a novel embedded-clapboard header, and the experimental results showed that when the inlet quality was 0.2, and the header was arranged vertically, slanting and horizontally, the average unevenness of the two-phase flow was 42.5%, 45.9% and 41.4% lower than that of the conventional header distributor.
Refrigerant distribution is not only related to header geometry and orientation, but also to fluid properties and inlet conditions. An experimental study by A.T. Wijayanta et al. [20] indicated that the refrigerant distribution strongly depended on the local momentum of the fluid and the geometry of the header. Lee et al. [13] studied the influence of the refrigerant flow rate and dryness in the header on the refrigerant distribution, and they found that the effect of the mass quality on the refrigerant distribution was minor when the intrusion depth of the flat tube became larger. Zou et al. [21] compared the refrigerant distribution of R245fa, R134a, R410A, and R32 in the vertical header, and the experimental results showed that R245fa had the best distribution, followed by R134a, R410A and R32. Fei et al. [22] studied the influence of the refrigerant’s inlet conditions, including vapor quality, velocity and inlet flow development status, on the refrigerant distribution in a horizontal header with vertical-downward channels. The results indicated that when the inlet quality and the velocity were higher, the distribution effect was the best. Mahvi et al. [23,24] showed that the distribution uniformity of the two-phase refrigerant flow largely depended on the flow pattern in the header. Zou et al. [25,26] visualized the vertical header and showed that increased refrigerant quality would result in poor refrigerant distribution.
In addition to the above factors affecting refrigerant distribution, Long Huang et al. [27] pointed out that uneven heat transfer was also one of the main reasons leading to refrigerant maldistribution. As a matter of fact, uneven heat transfer not only exists among flat tubes, but it also exists among microchannels of a flat tube in the air flowing direction in which the air temperature decreases gradually. However, the refrigerant distribution in a flat tube with microchannels in the air flowing direction has never been reported in the published literature. Traditionally, it is often assumed that the refrigerant flow in different microchannels within a tube is identical and uniformly distributed [28,29]. In this paper, a mathematical model of a flat tube with microchannels for a microchannel heat exchanger was developed, and the coupling effect of heat transfer and refrigerant distribution was studied, which will be useful for heat transfer performance improvement of microchannel heat exchanger via structural optimization.
2. Mathematical Model
2.1. Physical Model
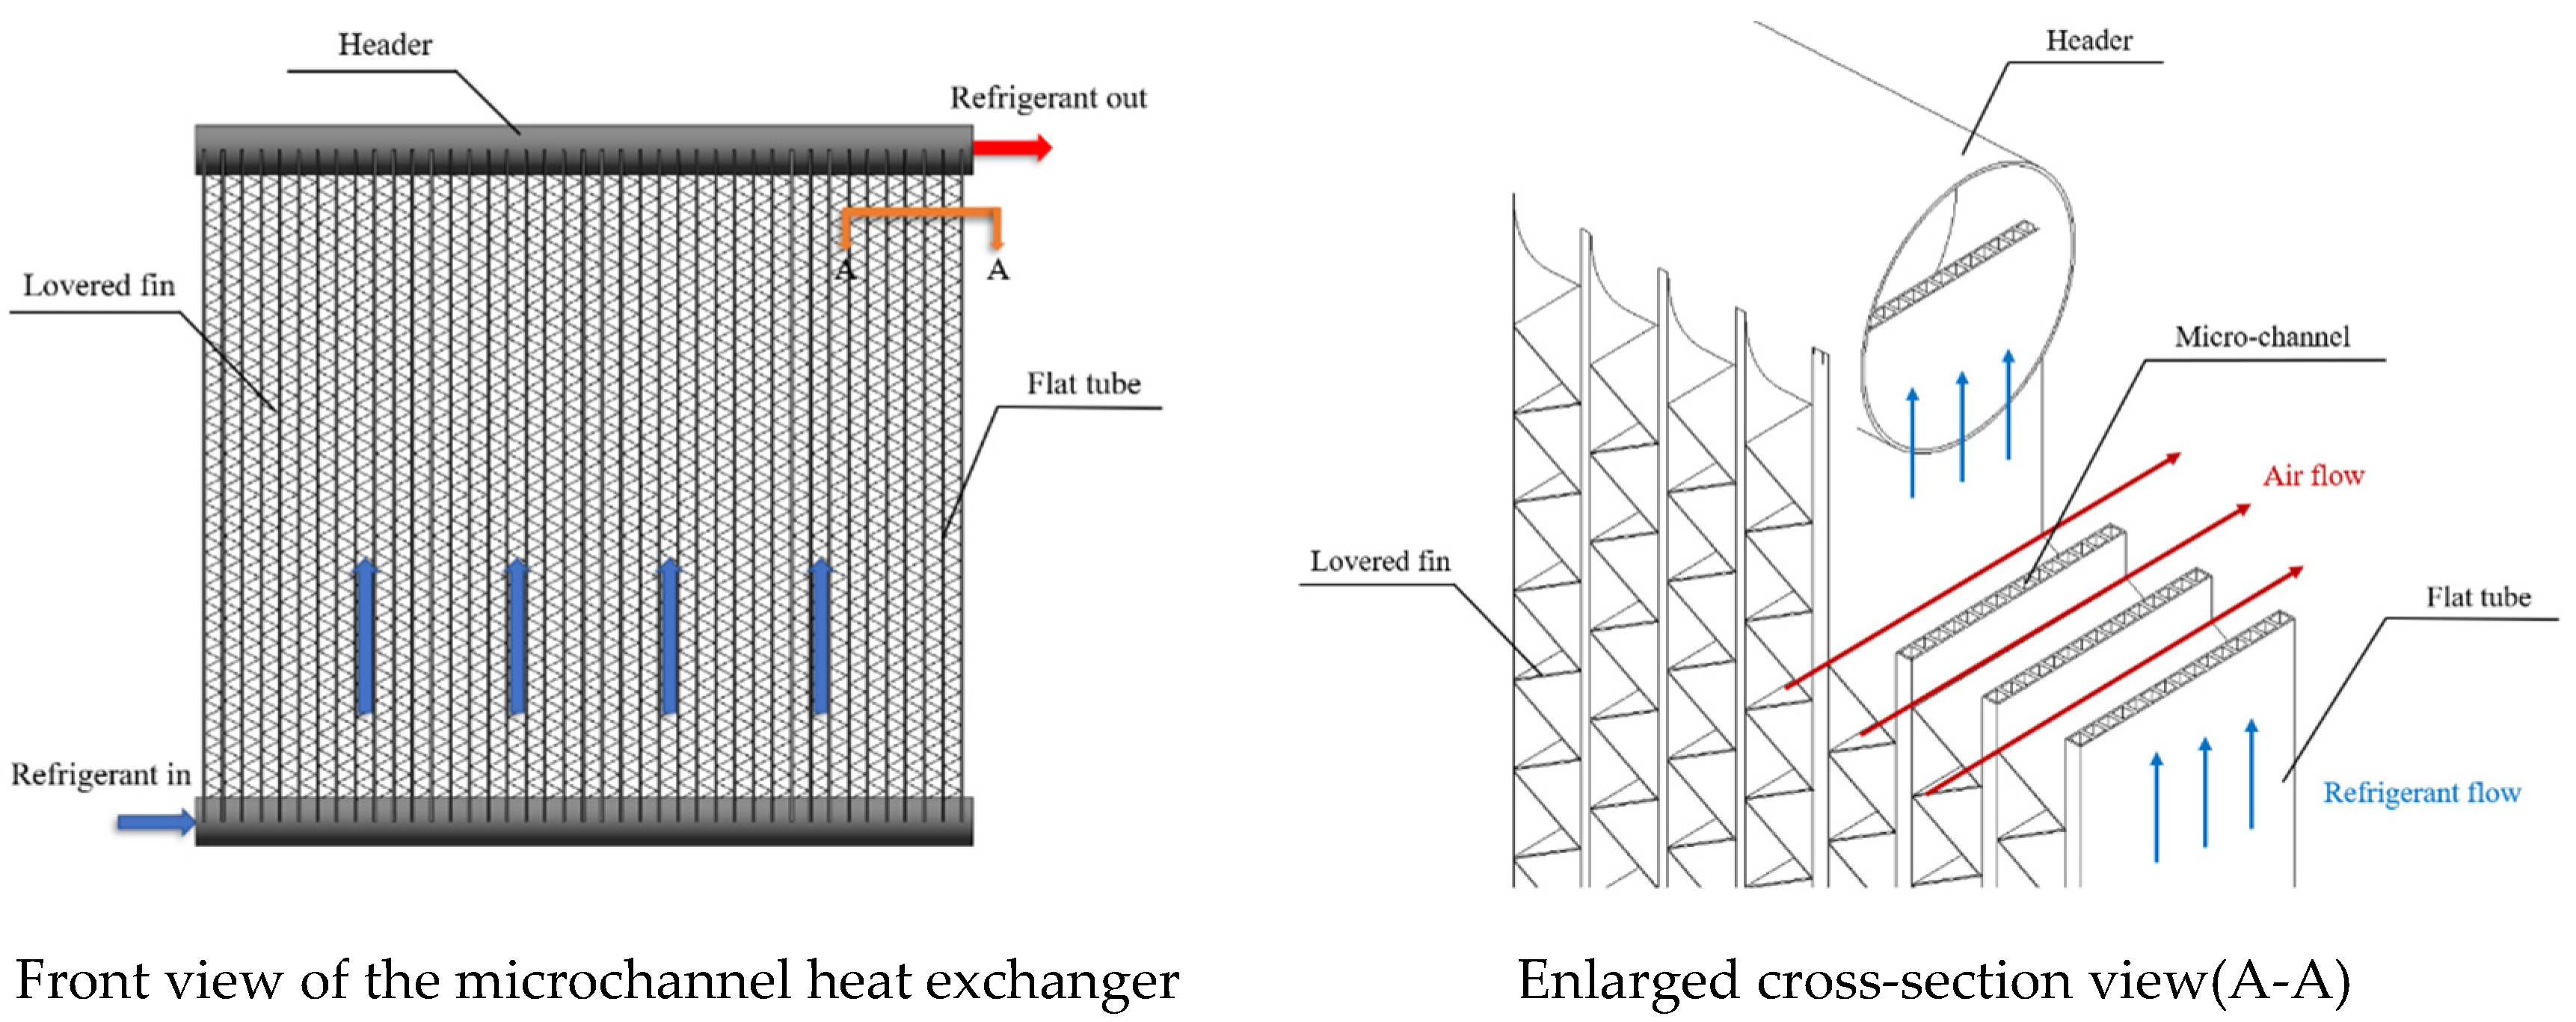
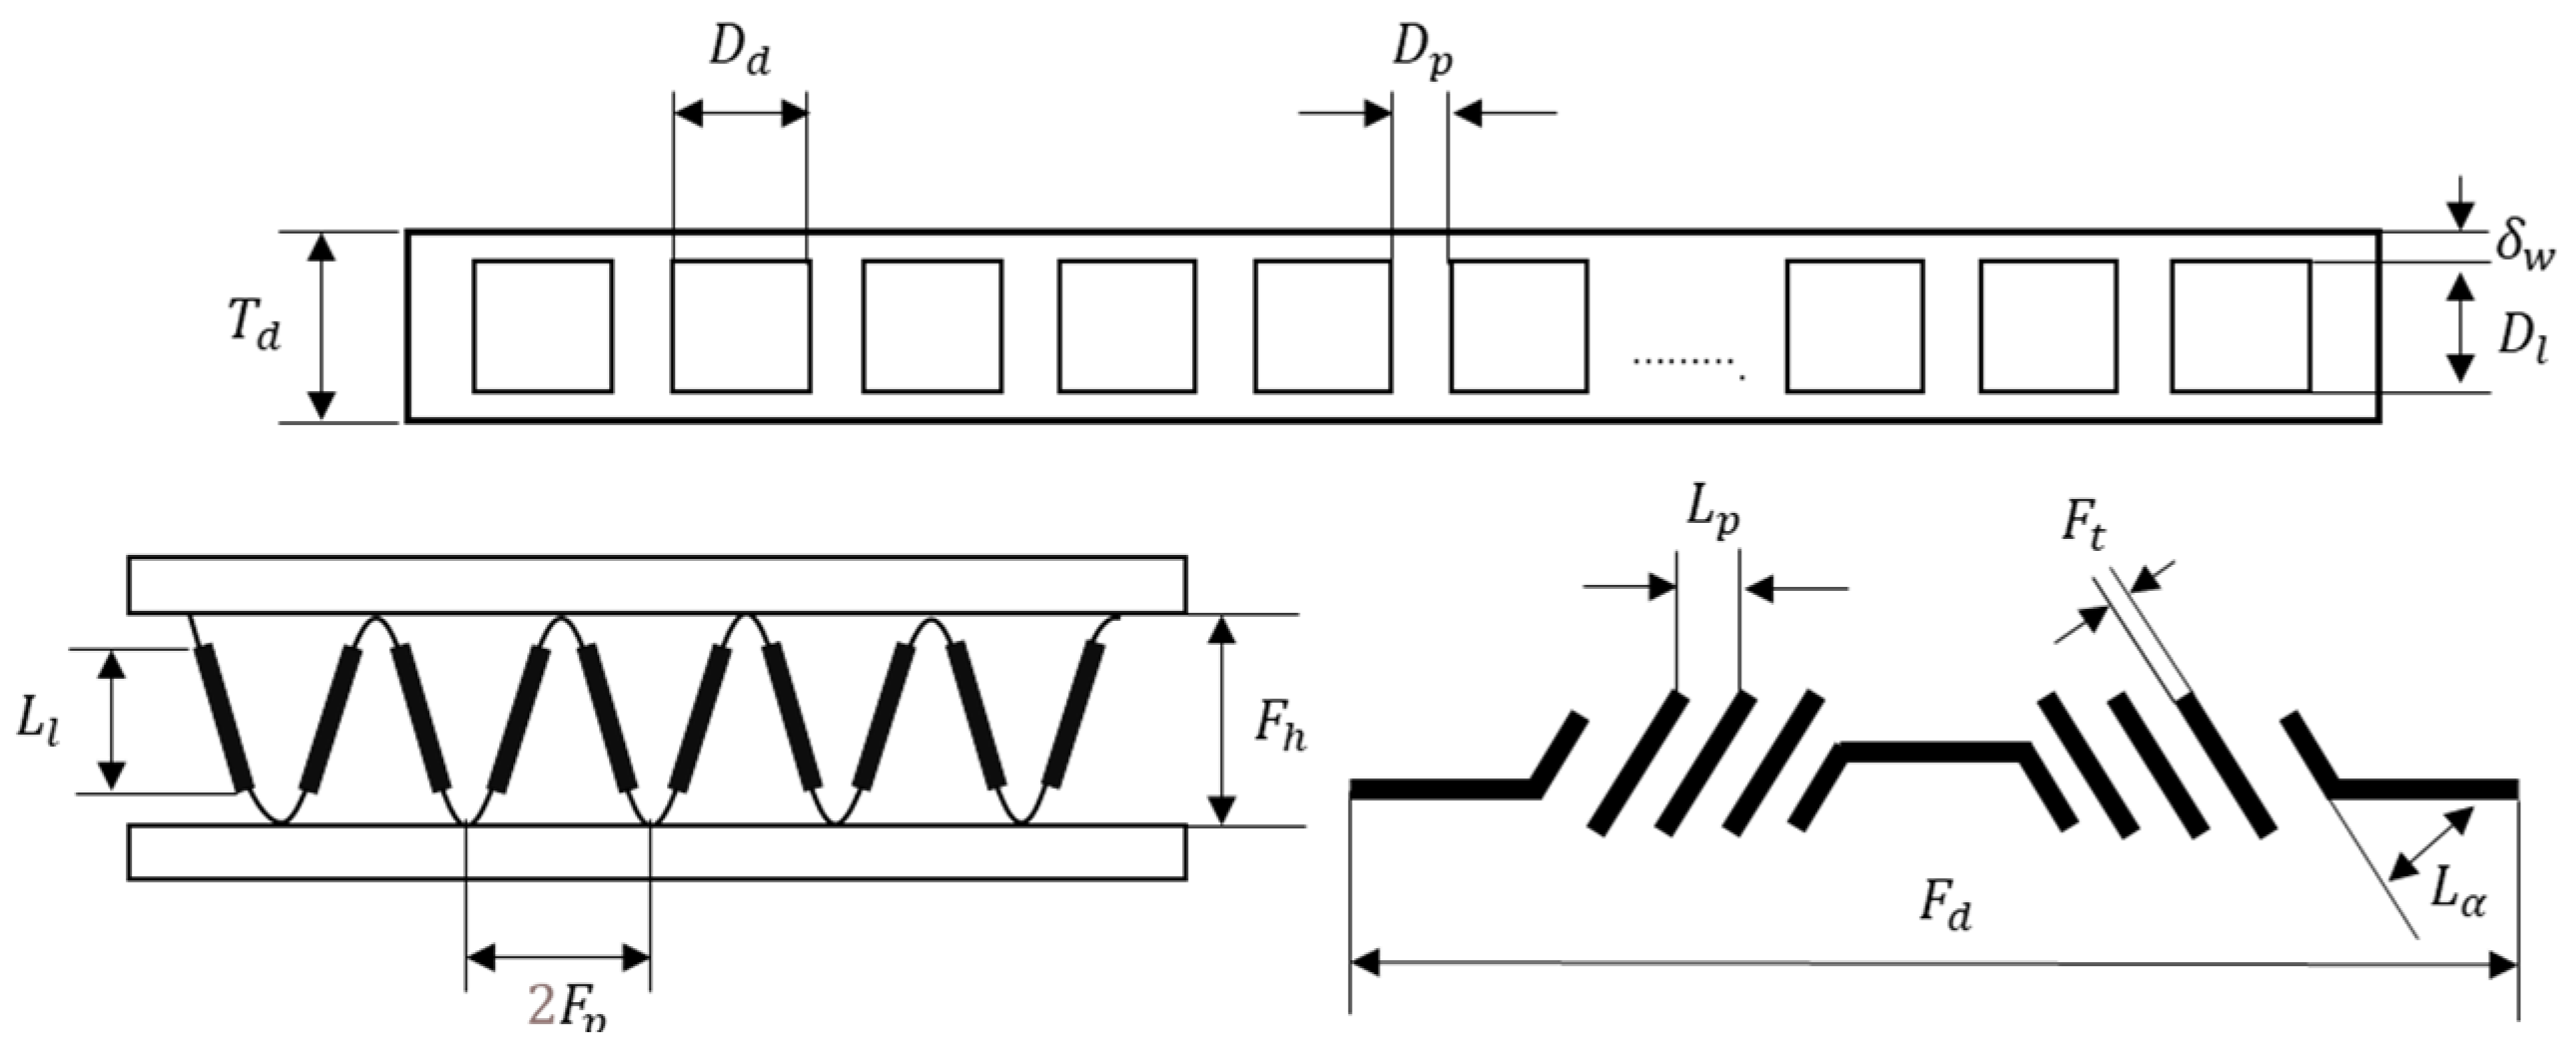
The microchannel heat exchanger was composed of headers, flat tubes with microchannels inside and louvered fins arranged between the flat tubes to enhance heat transfer performance. The microchannels with refrigerant flowing inside is shown in Figure 1. In this paper, a microchannel evaporator of a residential building air conditioner working in summer condition was selected for study. The structural parameters of the fins and microchannels for the flat tube are shown in Figure 2 and Table 1.
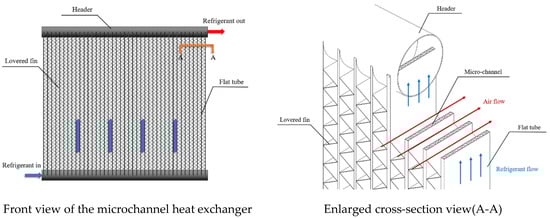
Figure 1.
Microchannel heat exchanger and a cross-section view of the flat tubes.
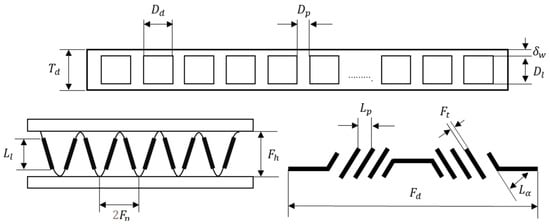
Figure 2.
Structural parameters of the fins and microchannels of a flat tube.

Table 1.
Structural parameters of the fins and microchannels of a flat tube.
2.2. Mathematical Model of the Refrigerant
Figure 3 shows the heat transfer mechanism of a microchannel. For refrigerant flowing inside a microchannel, it extracts heat from the air though the flat tube’s walls and also from adjacent microchannels.
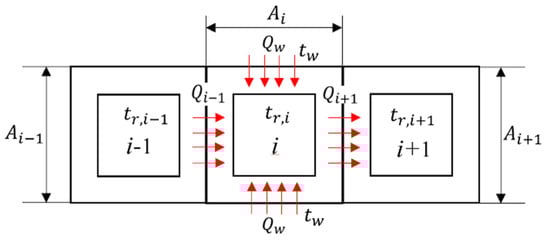
Figure 3.
Heat transfer mechanism of a microchannel.
For an evaporator, there is a superheated region and a two-phase region for the refrigerant. Therefore, in the refrigerant mathematical model, mathematical models for the superheated region and the two-phase region were developed, respectively. Here, the following assumptions are given:
- (1)
- Both the refrigerant-side and air-side flows are one dimensional flows;
- (2)
- The vapor–liquid phase is in a state of thermodynamic equilibrium;
- (3)
- All of the physical parameters of the single-phase refrigerant in the cross sections are of the same values, and the physical parameters only change in the flow direction;
- (4)
- The gravity of the refrigerant in the microchannel is to be neglected;
- (5)
- Heat conduction in the axial direction is negligible because of the minimal temperature gradient in the direction of the refrigerant flow;
- (6)
- For refrigerant inside the tube, the heat exchange process is continuous and stable.
2.2.1. Mathematical Model of the Two-Phase Region
For the two-phase region of the refrigerant, mass, momentum and energy equations exist. Firstly, the mass conservation equation can be written as:
where is the refrigerant’s void coefficient; and are the densities of the refrigerant in the vapor and liquid states, respectively, kg/m3; and are the velocities of the refrigerant in the vapor and liquid states, respectively, m/s.
The momentum and energy conservation equations can be expressed, separately, as:
and,
where is the shear stress, N/m2; is the wetted perimeter of the aluminum tube, m; and are the enthalpy of saturated gas and liquid phases, J/kg; is the heat that the refrigerant obtains through per unit length of the microchannel, W/m.
The heat in Equation (3) can be expressed as:
where is the heat that the refrigerant obtains through the per unit length of the two sidewalls adjacent to the air, W/m; is the heat that the refrigerant obtains through per unit length of the sidewall adjacent to the microchannel (i − 1), W/m; is the heat that the refrigerant obtains through per unit length of the sidewalls adjacent to the microchannel (i + 1), W/m.
Heat exchange between the refrigerant and the microchannel wall adjacent to air can be expressed as:
where is the heat transfer area of the per unit length of the two sidewalls adjacent to the air, m2/m; δw is the thickness of the wall, m; is the thermal conductivity of the microchannel wall, W/(m·K); is the refrigerant convective heat transfer coefficient on the inner surface of the microchannel (i ), W/(m2·K); is the outer surface temperature of the microchannel wall adjacent to the air, °C; is the temperature of the refrigerant in the microchannel (i), °C.
The heat exchange between the refrigerant and the microchannel (i − 1) can be expressed as:
where is the heat transfer area between microchannel (i) and microchannel (i − 1), m2/m; is the refrigerant convective heat transfer coefficient on the inner surface of the microchannel (i − 1) or the air convective heat transfer coefficient on the outer surface of the 1st microchannel, W/(m2·K); is the temperature of the refrigerant in the microchannel (i − 1) or the temperature of the outside air flowing to the 1st microchannel, °C.
The heat from the microchannel (i + 1) can be expressed as:
where is the heat transfer area between microchannel (i) and microchannel (i + 1), m2/m; is the refrigerant convective heat transfer coefficient on the inner surface of the microchannel (i + 1) or the air convective heat transfer coefficient on the outer surface of the last microchannel, W/(m2·K); is the temperature of the refrigerant in the microchannel (i + 1) or the temperature of the outside air leaving the last microchannel, °C.
2.2.2. Mathematical Model of the Superheated Region
For the superheated region of the refrigerant, mass, momentum and energy equations exist. Firstly, the mass conservation equation can be written as:
where is the density of the superheated refrigerant, kg/m3; is the velocity of superheated refrigerant, m/s.
The momentum and energy conservation equation can be expressed, separately, as,
Where is the enthalpy of the superheated refrigerant, J/kg.
2.2.3. Heat Transfer Coefficient and Pressure Drop on the Refrigerant Side
(1) Superheated region
The convective heat transfer of the refrigerant in the superheated region adopted the widely recognized Dittus-Boelter correlation formula.
where is the Nusselt number; is the convective heat transfer coefficient on the refrigerant side, W/(m2·K); is the hydraulic diameter, m; is the thermal conductivity of the refrigerant; Revap is the Reynolds number of the refrigerant in the vapor state; is the Prandtl number; is the frictional pressure drop; is the friction resistance coefficient; is the length of the microchannel, m; is specific volume of refrigerant, m3/kg; is the mass flux of the refrigerant, kg/(m2s).
(2) Two-phase region
The model used the flow boiling heat transfer coefficient correlation equation based on the convective heat transfer enhancement factor,, and the nucleate boiling suppression factor, [30], as follows:
where is the convective heat transfer coefficient when the flowing refrigerant is in the two-phase state, W/(m2·K); is the convective heat transfer coefficient when the flowing refrigerant is in the liquid state, W/(m2·K); is the nucleate boiling heat transfer coefficient, W/(m2·K). In Equation (14), and can be obtained by [31,32]:
where λlip is the thermal conductivity of the liquid refrigerant, W/(m·K); is the thermal conductivity of the liquid refrigerant, W/(m·K); is the Reynolds number of the refrigerant in the liquid state; is the Prandtl number of the refrigerant in the liquid state; is the critical pressure of the refrigerant; M is the molecular mass of the fluid, kg/kmol; is the heat flux on the microchannel wall, W/m2.
In Equation (14), and Snew can be obtained by [30],
where is the Lockhart–Martinelli number; is the Weber number; is the Froude number; is the boiling number.
The Lockhart–Martinelli number, , can be expressed as Equation (19):
where is the vapor quality of the refrigerant; and are the density of the vapor refrigerant and the liquid refrigerant, respectively, kg/m3; is the dynamic viscosity coefficient of the vapor refrigerant, N·s/m2; is the dynamic viscosity coefficient of the liquid refrigerant, N·s/m2.
The pressure drop of the refrigerant in the two-phase region used the correlation formula of Zhao [33], and it can be expressed as Equation (20)
where is the acceleration pressure drop, Pa; is the friction pressure drop, Pa; is the gravitational pressure drop, Pa.
In Equation (20), the acceleration pressure drop is:
where is the mass flux of the refrigerant, kg/(m2·s); and are the vapor quality of the refrigerant at the outlet and inlet, respectively; and are the void coefficients of the refrigerant at the outlet and at the inlet, respectively, and can be calculated by Equation (22):
In Equation (20), the frictional pressure drop is:
where
where flip is the frictional factor for treating the two-phase refrigerant as the liquid refrigerant.
2.3. Mathematical Model of the Air Side
For the air side, the mass and energy equations exist. Firstly, the mass conservation equation could be written as:
where is the mass flow rate of air, kg/s; is the mass transfer coefficient on the fins, m/s; is the surface efficiency of microchannel exchanger; is the total surface area of the fin and the microchannel wall, m2; is the absolute humidity of the air, kg/kg.a; is the absolute humidity of the saturated air with the surface temperature of the fins, kg/kg.a.
The fins of the microchannel evaporator in this paper were louvered fins. Thus, the surface efficiency can be calculated as follows:
where is the surface area of the folded louver fins, m2; is the fin efficiency, which can be expressed as Equation(29):
where
where is the convective heat transfer coefficient of the air side, W/(m2·K); is the thermal conductivity of the fin, W/(m·K).
The energy conservation equation of the air side can be expressed as:
where
where is the enthalpy of air, J/kg; is the moisture separation coefficient; ta is the air temperature, °C; is the specific heat of the air, J/(kg °C).
For the mathematical model of louvered fins, this paper adopted the fitting correlation equation of the air-side heat transfer factor j. Therefore, the convective heat transfer coefficient of the air can be obtained using [34]:
where j is the air-side heat transfer factor; is the velocity of the air, m/s; is the density of the air, kg/m3; is the Prandtl number of the air.
For the heat transfer on the outside surface of the microchannel exchanger, there were dry and wet conditions. The heat transfer factor, j should be given separately.
(1) Dry condition
The air heat transfer was predicted by Kim and Bullard [35], and their models are widely used with high accuracy and recognition.
where is the kinematic viscosity coefficient of the air, m2/s; is the air-side Reynolds number.
(2) Wet condition
Under the wet condition, both sensible heat exchange and latent heat exchange occur. The heat transfer calculation formula [36] on the air side is:
2.4. Numerical Solution of the Mathematical Model
There were 25 microchannels in the flat tube used in this paper, because when the element number of a microchannel is larger than 45, the element number has almost no effect of on the numerical results. Thus, each microchannel was divided into 45 micro-control elements in the direction of refrigerant flowing, as shown as in Figure 4a. For each element, the refrigerant flowed into the element from the bottom and flowed out of the element from the top. Meanwhile, air flowed into the element from the left and flowed out of the element to the right.
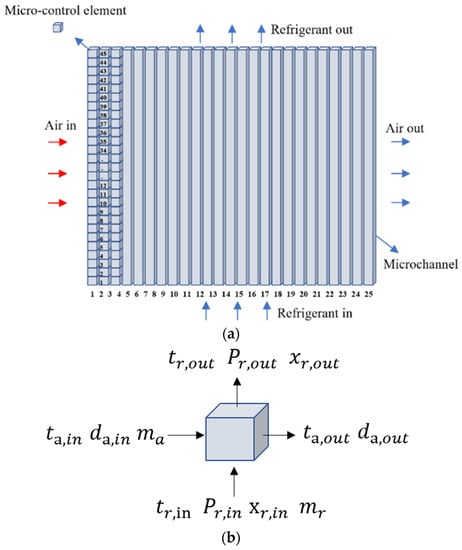
Figure 4.
Schematic illustration of the microchannel evaporator model segment discretization: (a) segment discretization of a microchannel heat exchanger flat tube; (b) micro-control element.
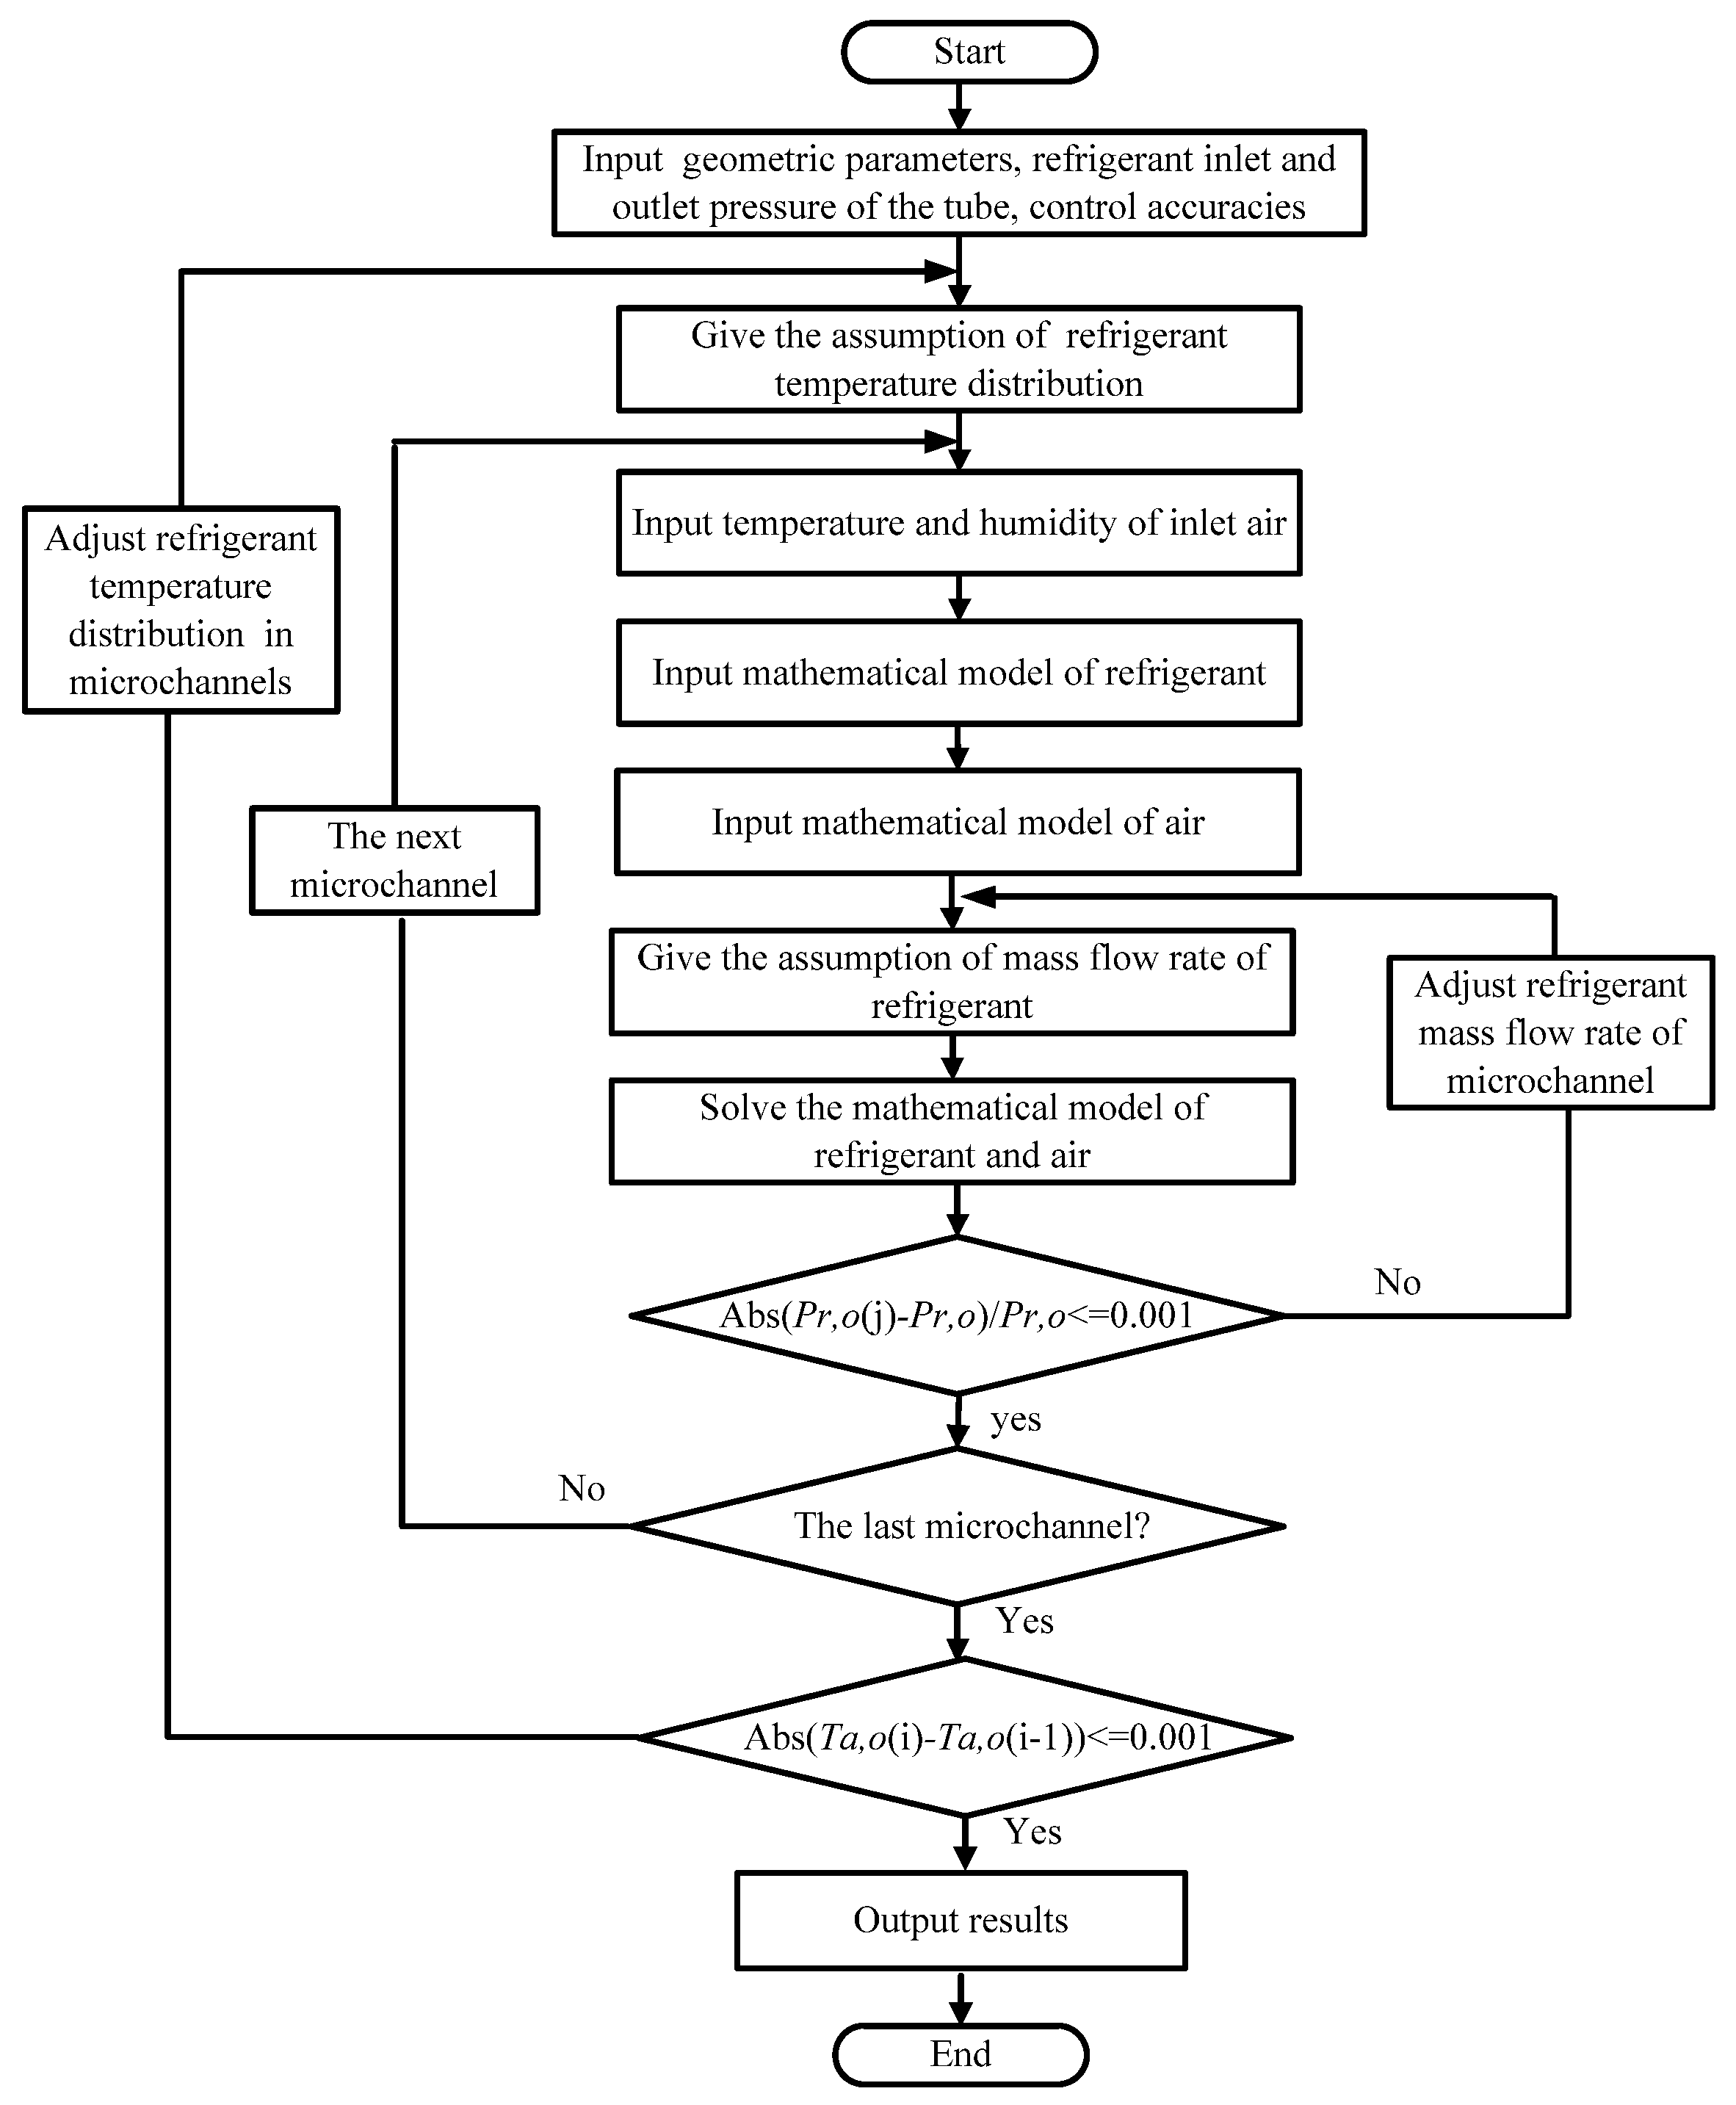
The numerical simulation flowchart of a microchannel tube is illustrated in Figure 5. Firstly, the mass, momentum, and energy equations on the refrigerant side and the energy equation on the air side for each microchannel were discretized. Next, the unknown parameters, such as the mass flow rate in each microchannel, the refrigerant state and the temperature distribution in the adjacent microchannels were assumed prior to calculating the numerical solution. Then, using the input parameters, such as the input air temperature, humidity, the input refrigerant parameters and the assumed parameters mentioned above, the numerical solution for the 1st microchannel was carried out from the micro-control element at the microchannel inlet to the micro-control element at the microchannel outlet. When the numerical solution for the 1st microchannel was completed, the output air temperature for each micro-control element was used as the input air temperature for the micro-control element of the second microchannel. In this way, the numerical solutions for the microchannels in the flat tubes were completed one by one.

Figure 5.
Flowchart of the numerical solution for the mathematical model.
It should be noted that an iterative solution was necessary in the process of the numerical solution. Firstly, the wall temperature of each element should be assumed and then calculated iteratively, because the wall temperature decides the state of the surface, i.e., dry or wet. Secondly, the refrigerant mass flow rate of each microchannel was calculated iteratively until the difference between the calculated refrigerant pressure drop and the given pressure drop was sufficiently small. Thirdly, the iterative numerical solution for a whole flat tube was carried out until the refrigerant temperature, refrigerant dryness, and air outlet temperature difference between the two calculations was sufficiently small. The numerical scheme described above was implemented into a self-written MATLAB code for numerical calculation.
The input parameters of the refrigerant and air in the paper are shown in Table 2.
Table 2.
Parameters of the inlet refrigerant and air microchannel heat exchanger.
2.5. Validation of Mathematical Model
The microchannel evaporator model of this paper was validated against the results of the model by B. Wiebke [3] and the results obtained using the modeling software CoilDesigner [37]. However, it should be noted that both B. Wiebke [3] and Jiang [37] considered the refrigerant to be evenly distributed among the microchannels in a flat tube. The microchannel evaporator in References [3,37] were calculated using the mathematical model in this paper. The refrigerant temperature in the middle microchannel of the flat tube and the air outlet temperature of the flat tube were selected to be compared with the refrigerant temperature and air outlet temperature in References [3,37], as shown as Figure 6 and Figure 7. From Figure 6 and Figure 7, it can be seen that the air temperature and refrigerant temperature had similar tends as References [3,37] when the height of the microchannel was less than 0.33 m. When the height was larger than 0.33 m, both refrigerant and air outlet temperature difference appeared, because uneven refrigerant mass flow distribution was considered in the model of this paper. Thus, on the basis of the results of the comparison with References [3,37], it can be considered that the model in this paper is reliable.
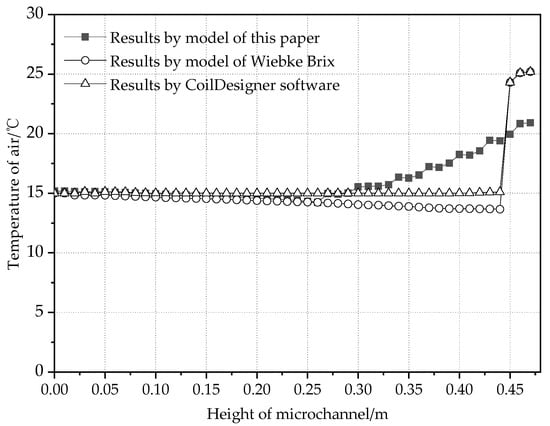
Figure 6.
Comparison of the air outlet temperatures along the channel.
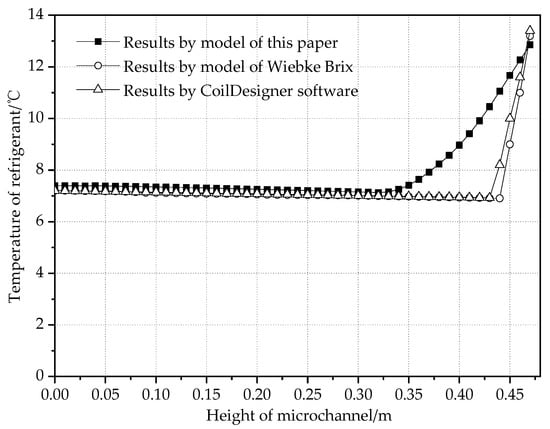
Figure 7.
Comparison of the refrigerant temperatures along the channel.
3. Results and Discussions
3.1. Refrigerant Side
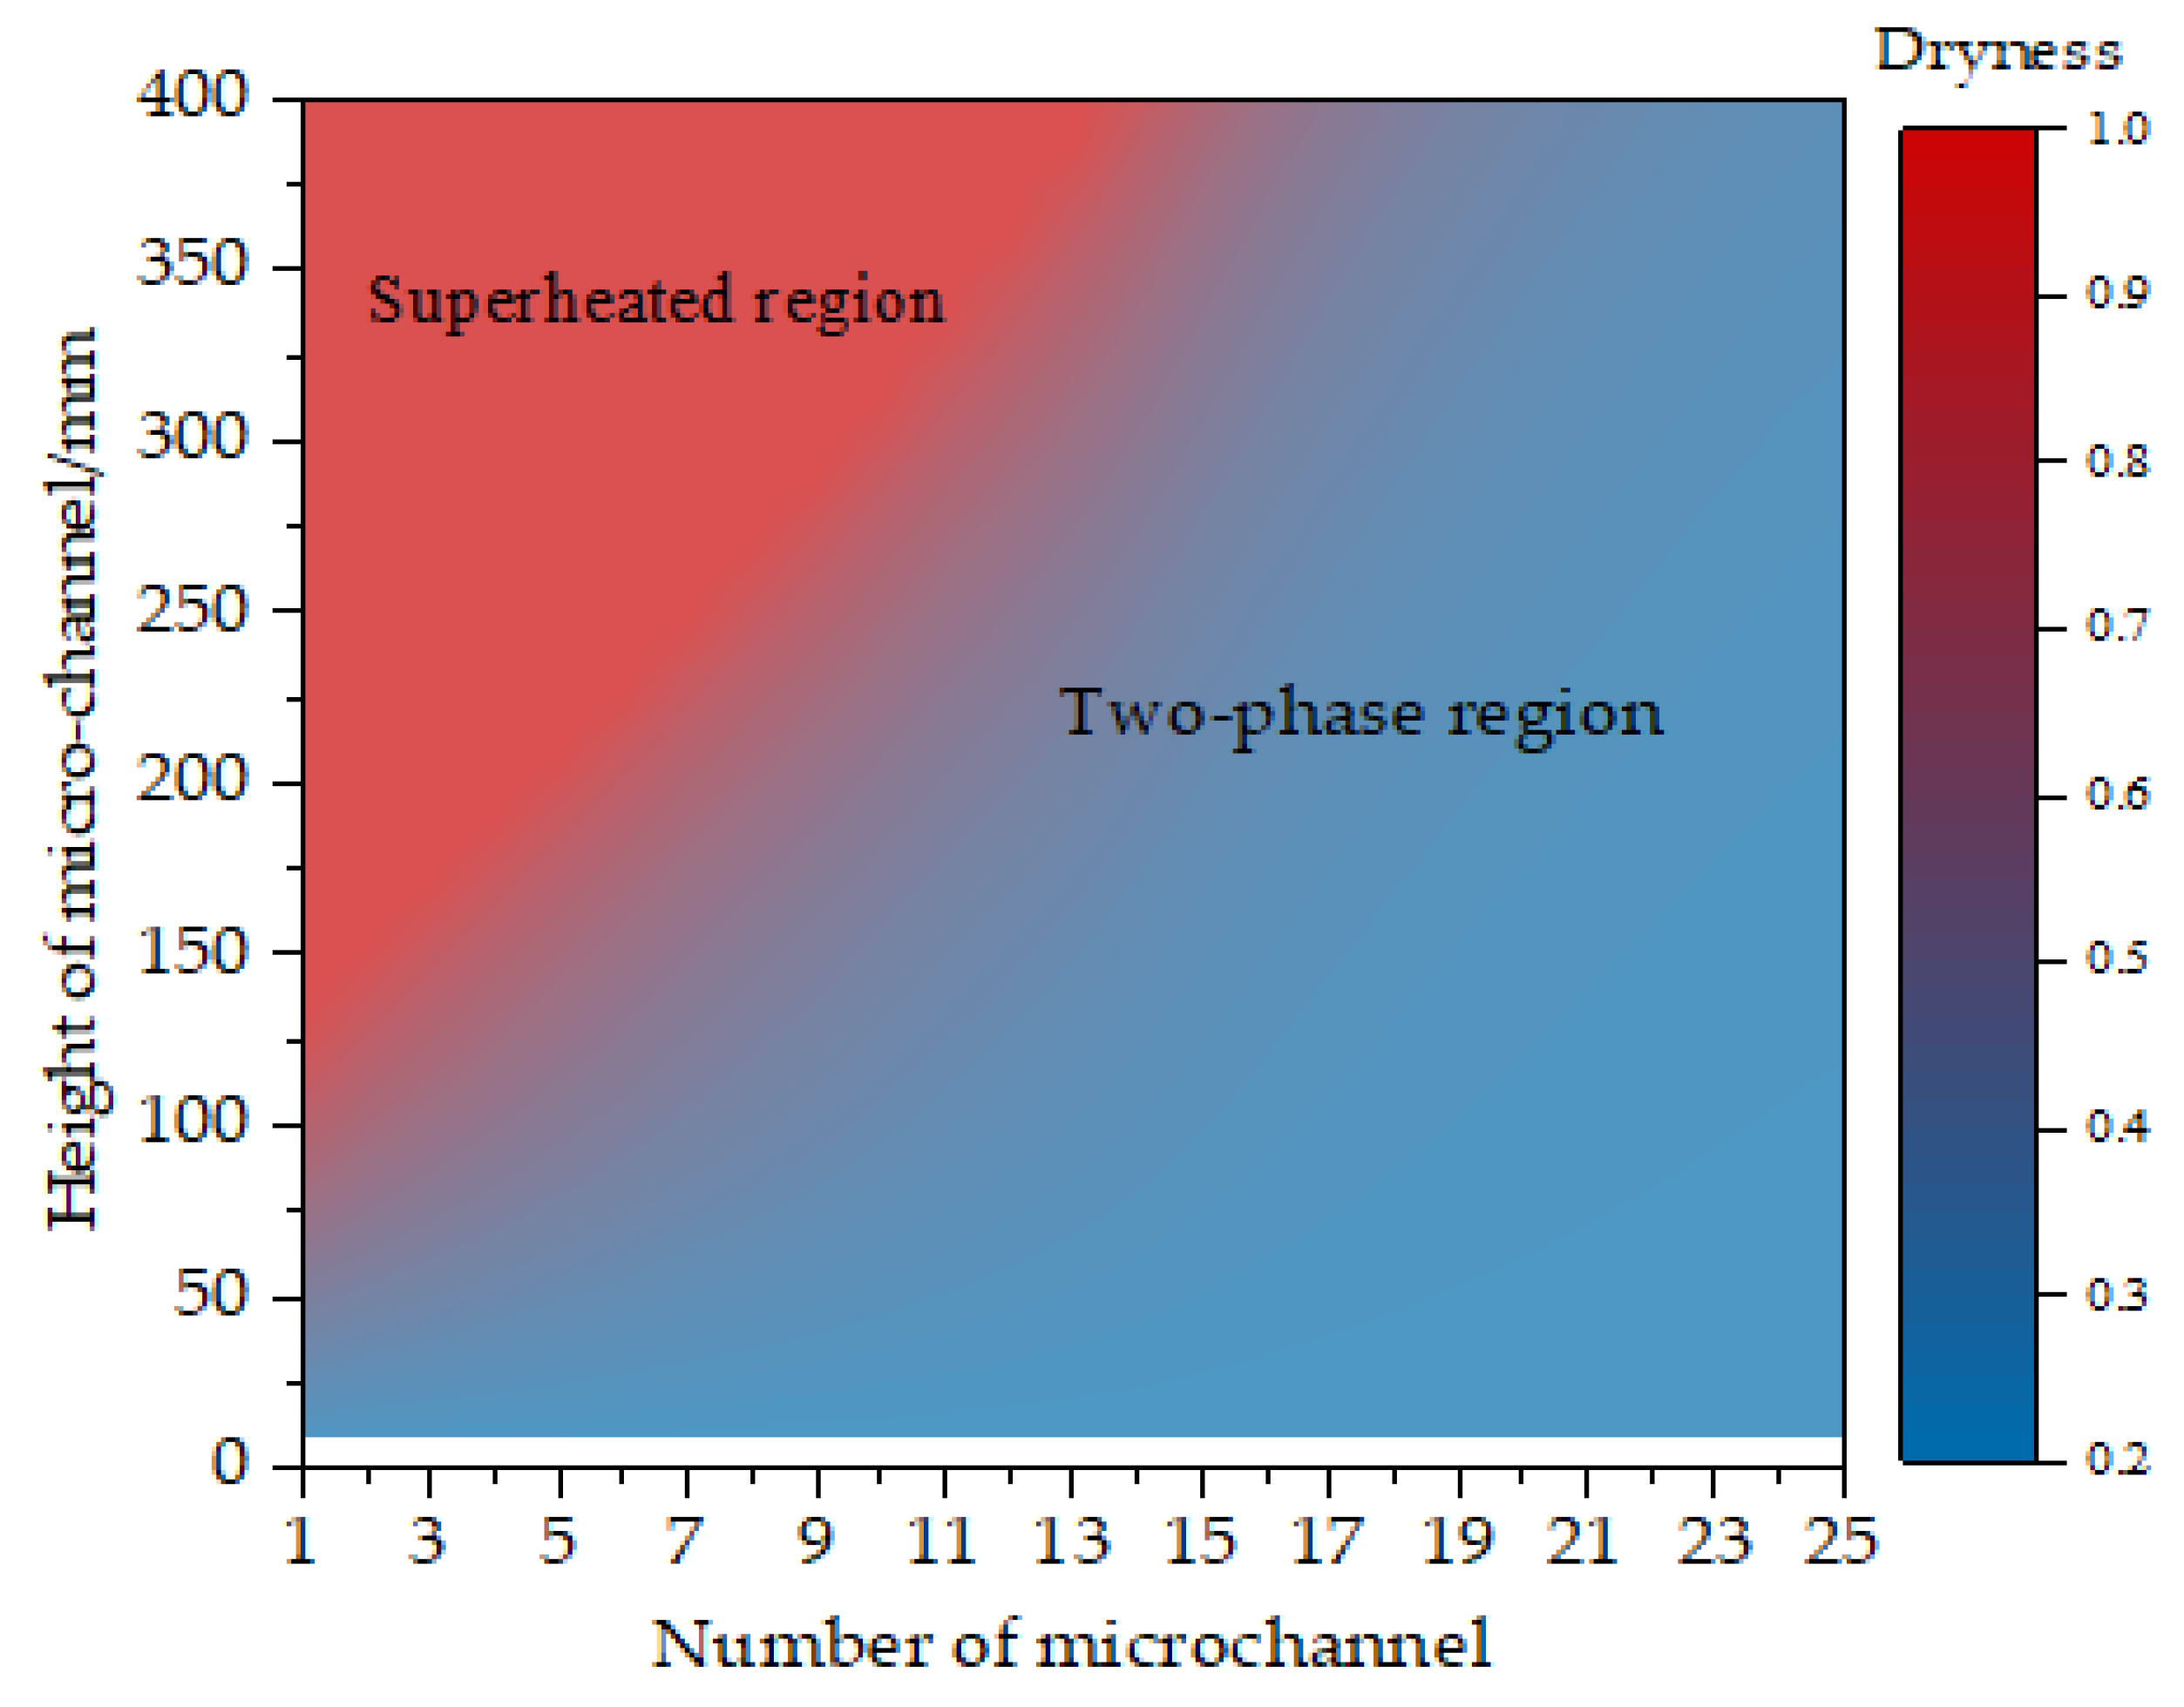
3.1.1. Refrigerant Dryness and Temperature
Figure 8 shows the refrigerant dryness in the microchannels, and Figure 9 shows the refrigerant temperature distribution in the microchannels. From Figure 8 and Figure 9, it can be seen that for the first 13 microchannels, the whole microchannel flat tube was obviously divided into a superheat region and a two-phase region, respectively. In addition, from the 14th microchannel, the entire microchannel was completely occupied by the two-phase refrigerant, although the dryness of the refrigerant in the microchannel gradually increased along the microchannel’s length. These results indicate that the outlet refrigerant of the 1st microchannel was up to 24.5 °C, which is very close to the 26 °C of the inlet air temperature, while for the 25th microchannel, the dryness of the refrigerant only increased from 0.2 to 0.3. The statistics show that the length of the superheated region was approximately 267 mm for the first microchannel, which means approximately 66.7% of the microchannel’s length was occupied by the superheated refrigerant, and the superheated region accounted for 19.3% of all of the microchannels’ heat transfer area. Figure 8 and Figure 9 also show that the length of the superheated region gradually reduced, and the length of the two-phase region gradually increased. The reasons for this are that the air temperature reduction and refrigerant mass flow rate increased in the microchannels in the direction of the air flow, which is discussed later in this paper.
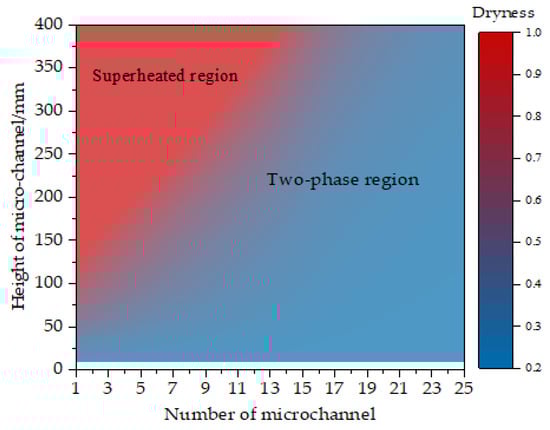
Figure 8.
Refrigerant dryness in the microchannels.
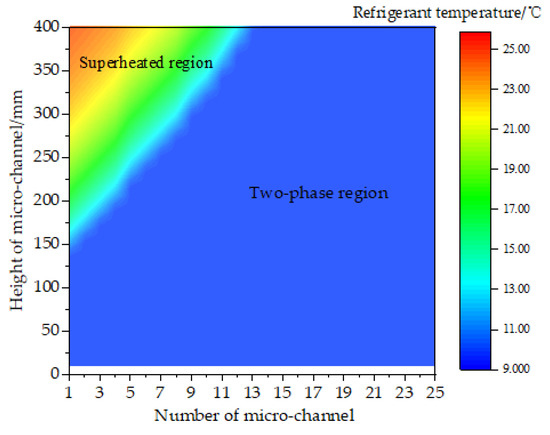
Figure 9.
Refrigerant temperatures in the microchannels.
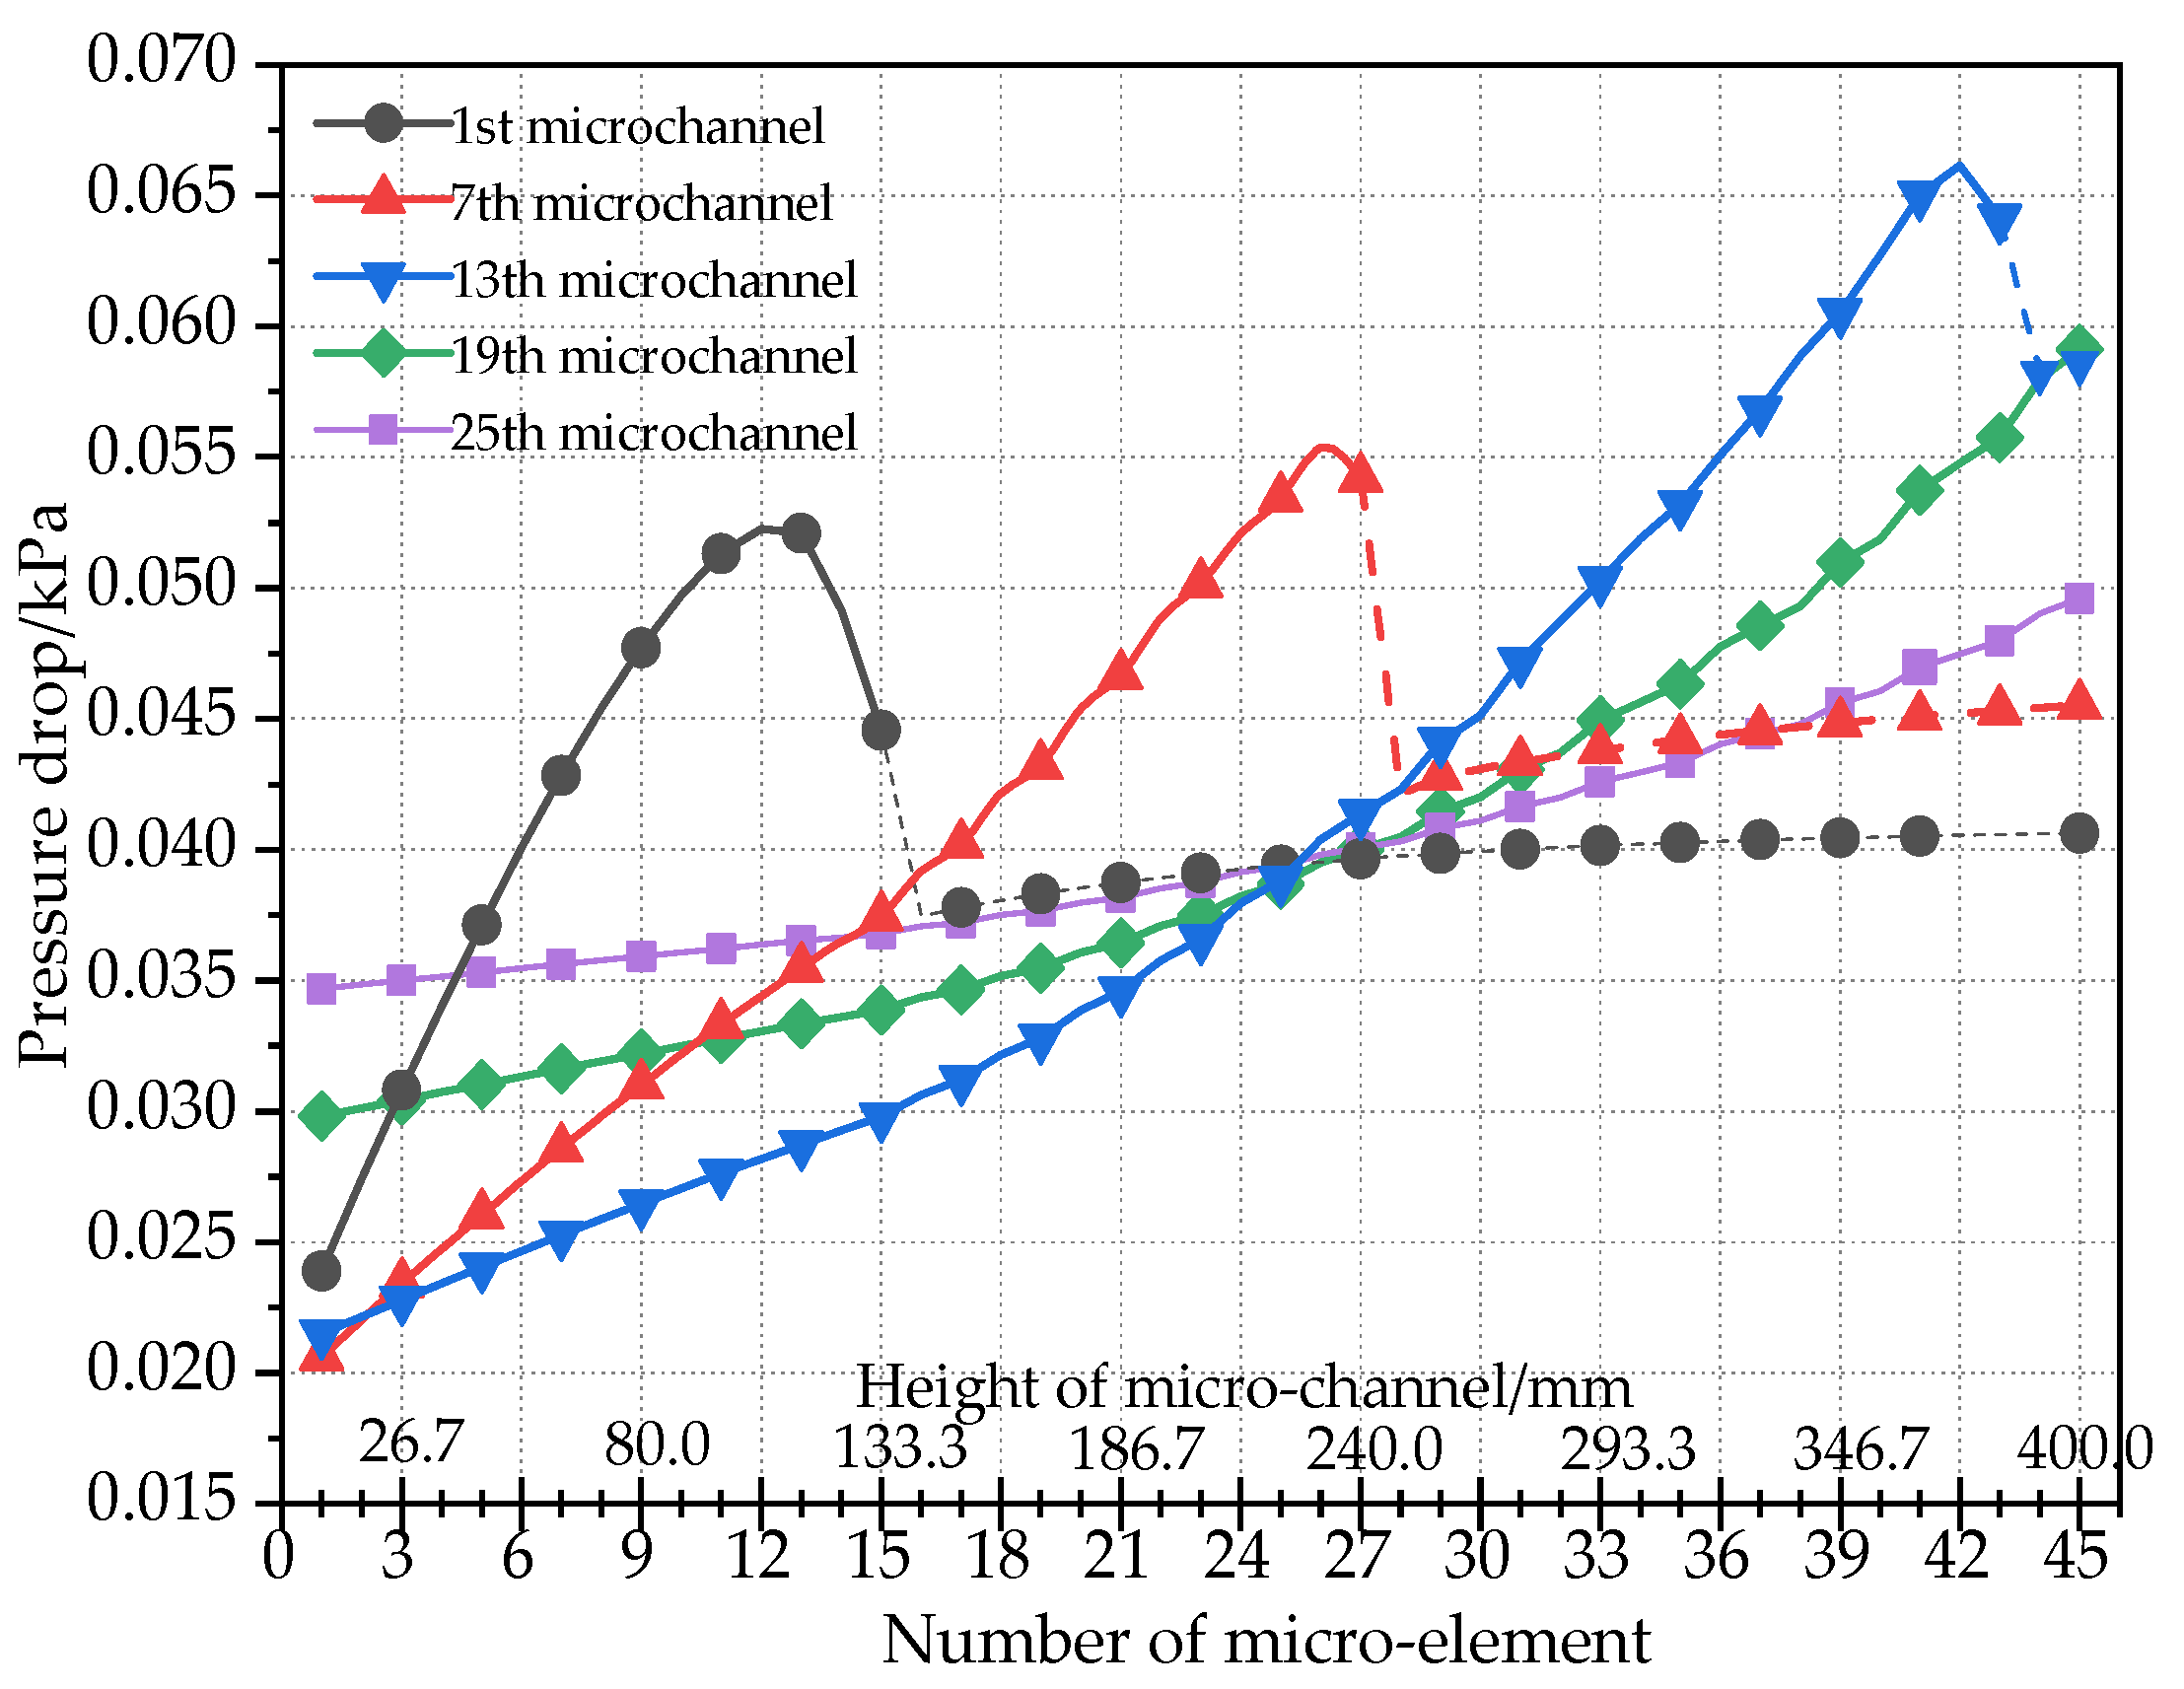
3.1.2. Refrigerant Pressure Drop
Figure 10 shows that the pressure drop of the refrigerant in the two-phase of the 1st microchannel first increased with the increase in dryness, and then reached the maximum value when the dryness equaled 0.85, after which, it decreased sharply. The pressure drop in the two-phase region of this paper was very similar to that given by Kim [38]. Because of the refrigerant pressure drop change with the dryness in the two-phase region, there was a pressure drop change in the refrigerant with the number of micro-element, as shown in Figure 11. When the refrigerant changed from the two-phase state into the superheated state, the pressure drop increased slowly with the number of micro-elements because of the increase in the refrigerant temperature. The pressure drop in the superheated region was almost equal to the pressure drop when the refrigerant dryness was 0.45, which coincides well with the conclusion of J.H. Yun [39].
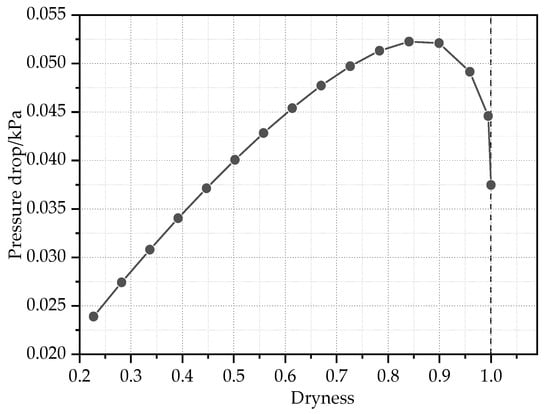
Figure 10.
Refrigerant pressure drop changing with the dryness in the two-phase region of the 1st microchannel.
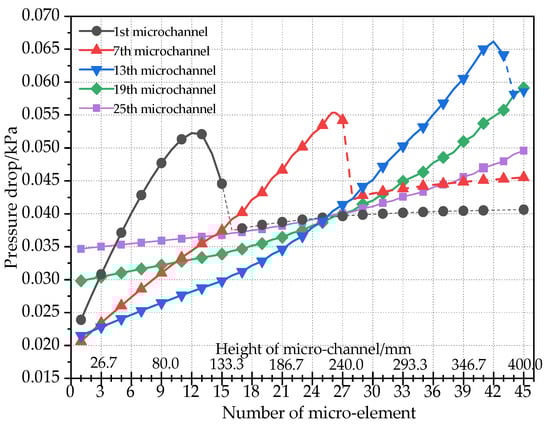
Figure 11.
Pressure drop change in the refrigerant with the number of micro-elements.
To analyze the pressure drop in the two-phase and superheated regions, the pressure drop in the two-phase and superheated regions for all microchannels were calculated, as shown in Figure 12. From Figure 12, it can be seen that for the 1st microchannel, the two-phase region pressure drop was approximately 0.6 kPa, accounting for approximately 67.1% of the total pressure drop. Then, the pressure drop in the two-phase region increased gradually in the direction of the airflow until the 13th microchannel.
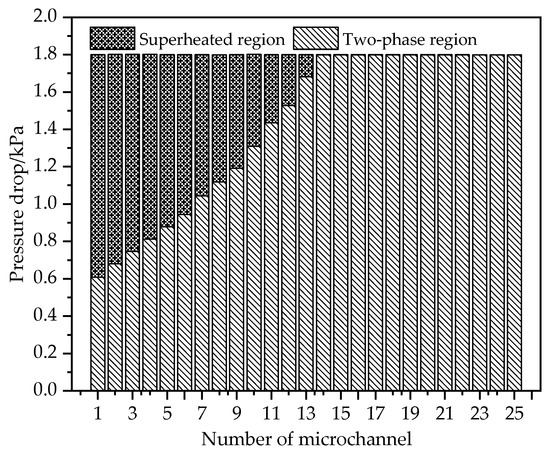
Figure 12.
Pressure drop of the refrigerant in the microchannels.
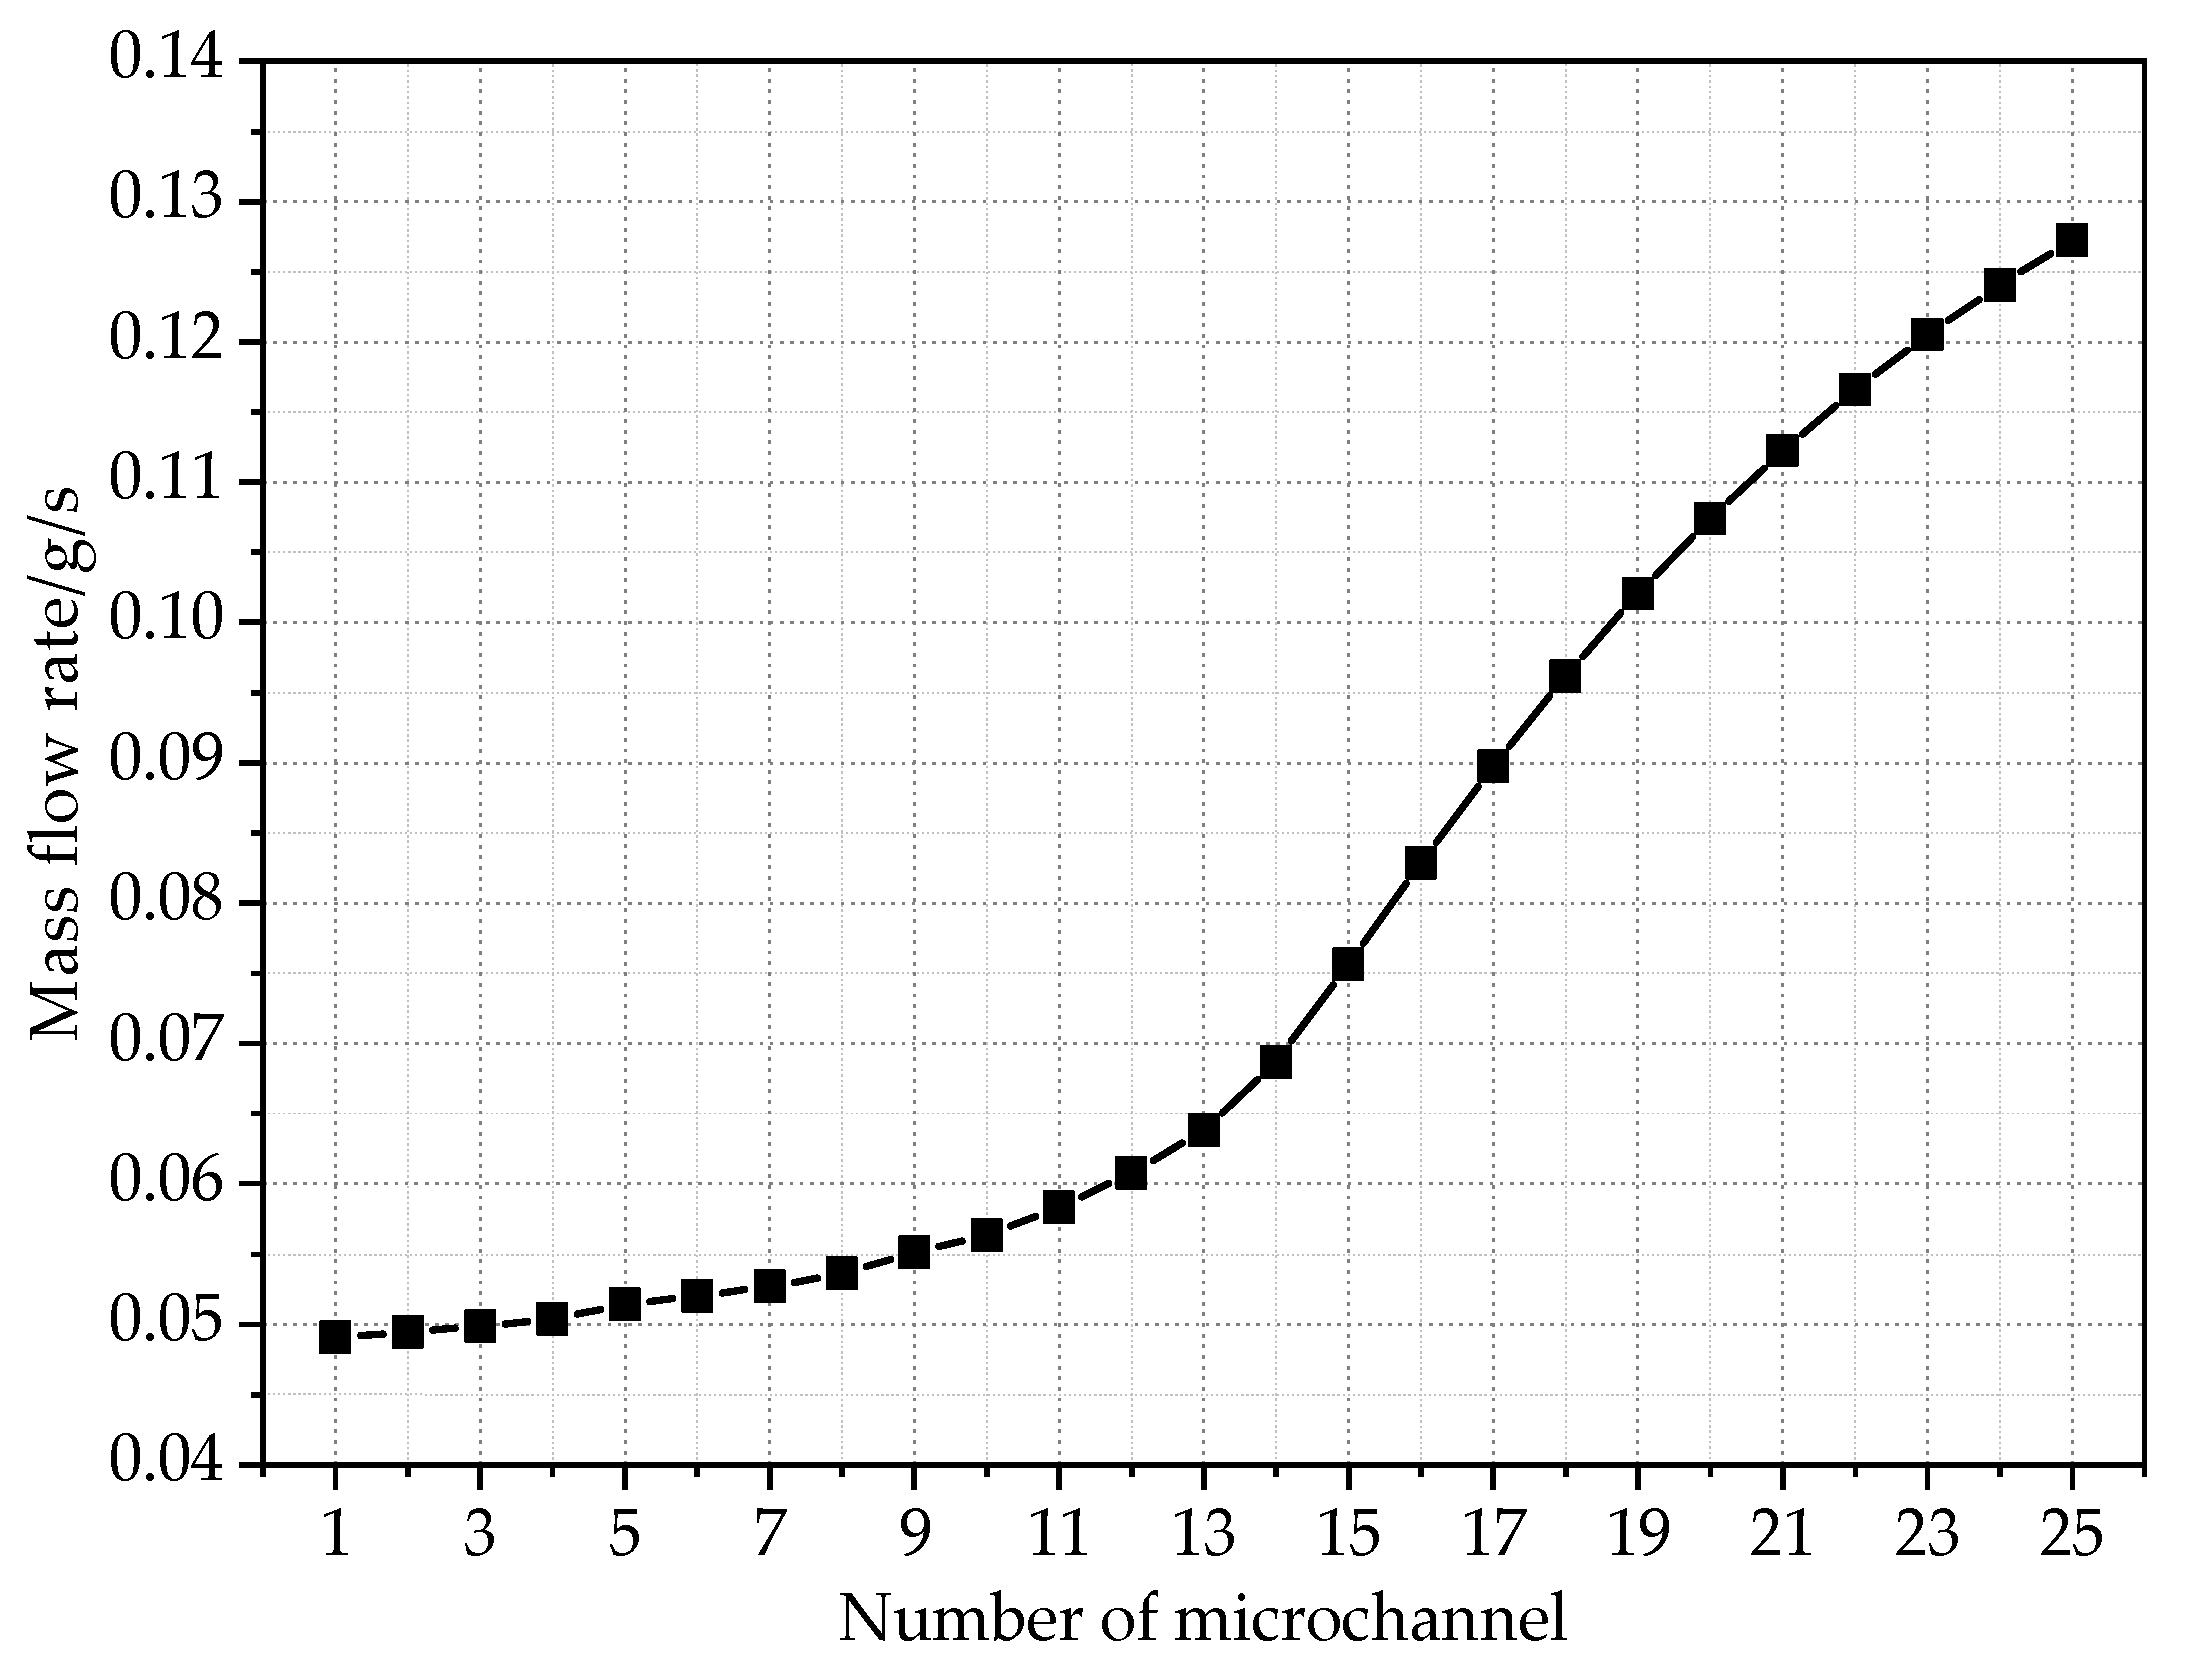
3.1.3. Refrigerant Mass Flow Rate
Figure 13 shows the mass flow rate of refrigerant in the microchannels. From Figure 13, it can be seen that the mass flow rate of the refrigerant in the microchannels increased in the direction of the air flow, and the mass flow rate of the first 13 microchannels increased much more slowly than in the other 12 microchannels. For the 1st microchannel, the refrigerant mass flow rate was only approximately 0.049 kg/s, while the refrigerant mass flow rate of the 25th microchannel increased to approximately 0.127 kg/s, which is approximately 2.59 times that of the 1st microchannel. The main reason for the uneven refrigerant mass distribution is the uneven heat transfer among the microchannels, which finally determines the distribution of the refrigerant dryness and pressure loss in the microchannels. As shown in Figure 10, the pressure drop of the refrigerant increased with the dryness in the refrigerant when the dryness was lower than 0.85, even in the superheated region, the pressure drop was higher than when the dryness equaled 0.45. For the microchannels in the front part of the flat tube, the longer the superheated region, the lower the refrigerant mass flow rate. On the contrary, for the microchannels in the rear part of the flat tube, the microchannel was occupied by the two-phase refrigerant, and the dryness decreased gradually in the direction of the air flow. According to the relationship between the refrigerant dryness and the pressure drop in Figure 10, more refrigerant will flow through microchannels under equal pressure drop conditions.
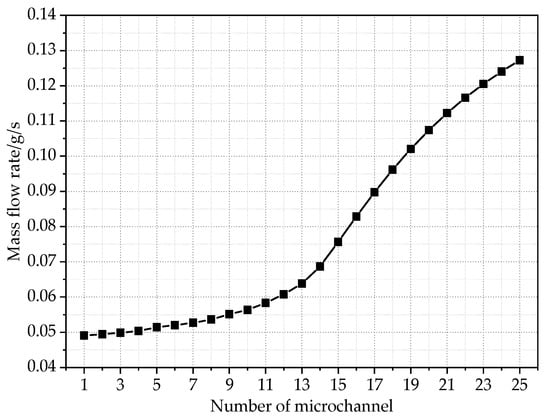
Figure 13.
Mass flow rate of the refrigerant in the microchannels.
In the published literature, three values are used to evaluate the uniformity of the mass flow rate distribution. The first one can be calculated by Equation (40):
where is the average refrigerant mass flow rate for the microchannels, kg/s; is the refrigerant mass flow rate for the microchannel i, kg/s; Therefore, in Equation (40), the value of is smaller, and the flow distribution is more uniform.
In [40], the flow maldistribution was evaluated through the standard deviation in the mass flow rate distribution. The standard deviation of a variable, S, is given as:
In Equation (41), when the unevenness value S is smaller, the flow distribution is more uniform.
In [41], the refrigerant distribution parameter (RDP) was used to evaluate the uniformity of the refrigerant distribution in the heat exchanger. The RDP is calculated by Equation (42):
From Equation (42), it can be seen that RDP is calculated on the basis of the average relative deviation between the actual refrigerant mass flow rate and the average refrigerant mass flow rate in the microchannels of the flat tube. RDP stands for the refrigerant distribution uniformity of the flat tube. The range of RDP is (0, 1). The larger the RDP, the better the refrigerant distribution uniformity.
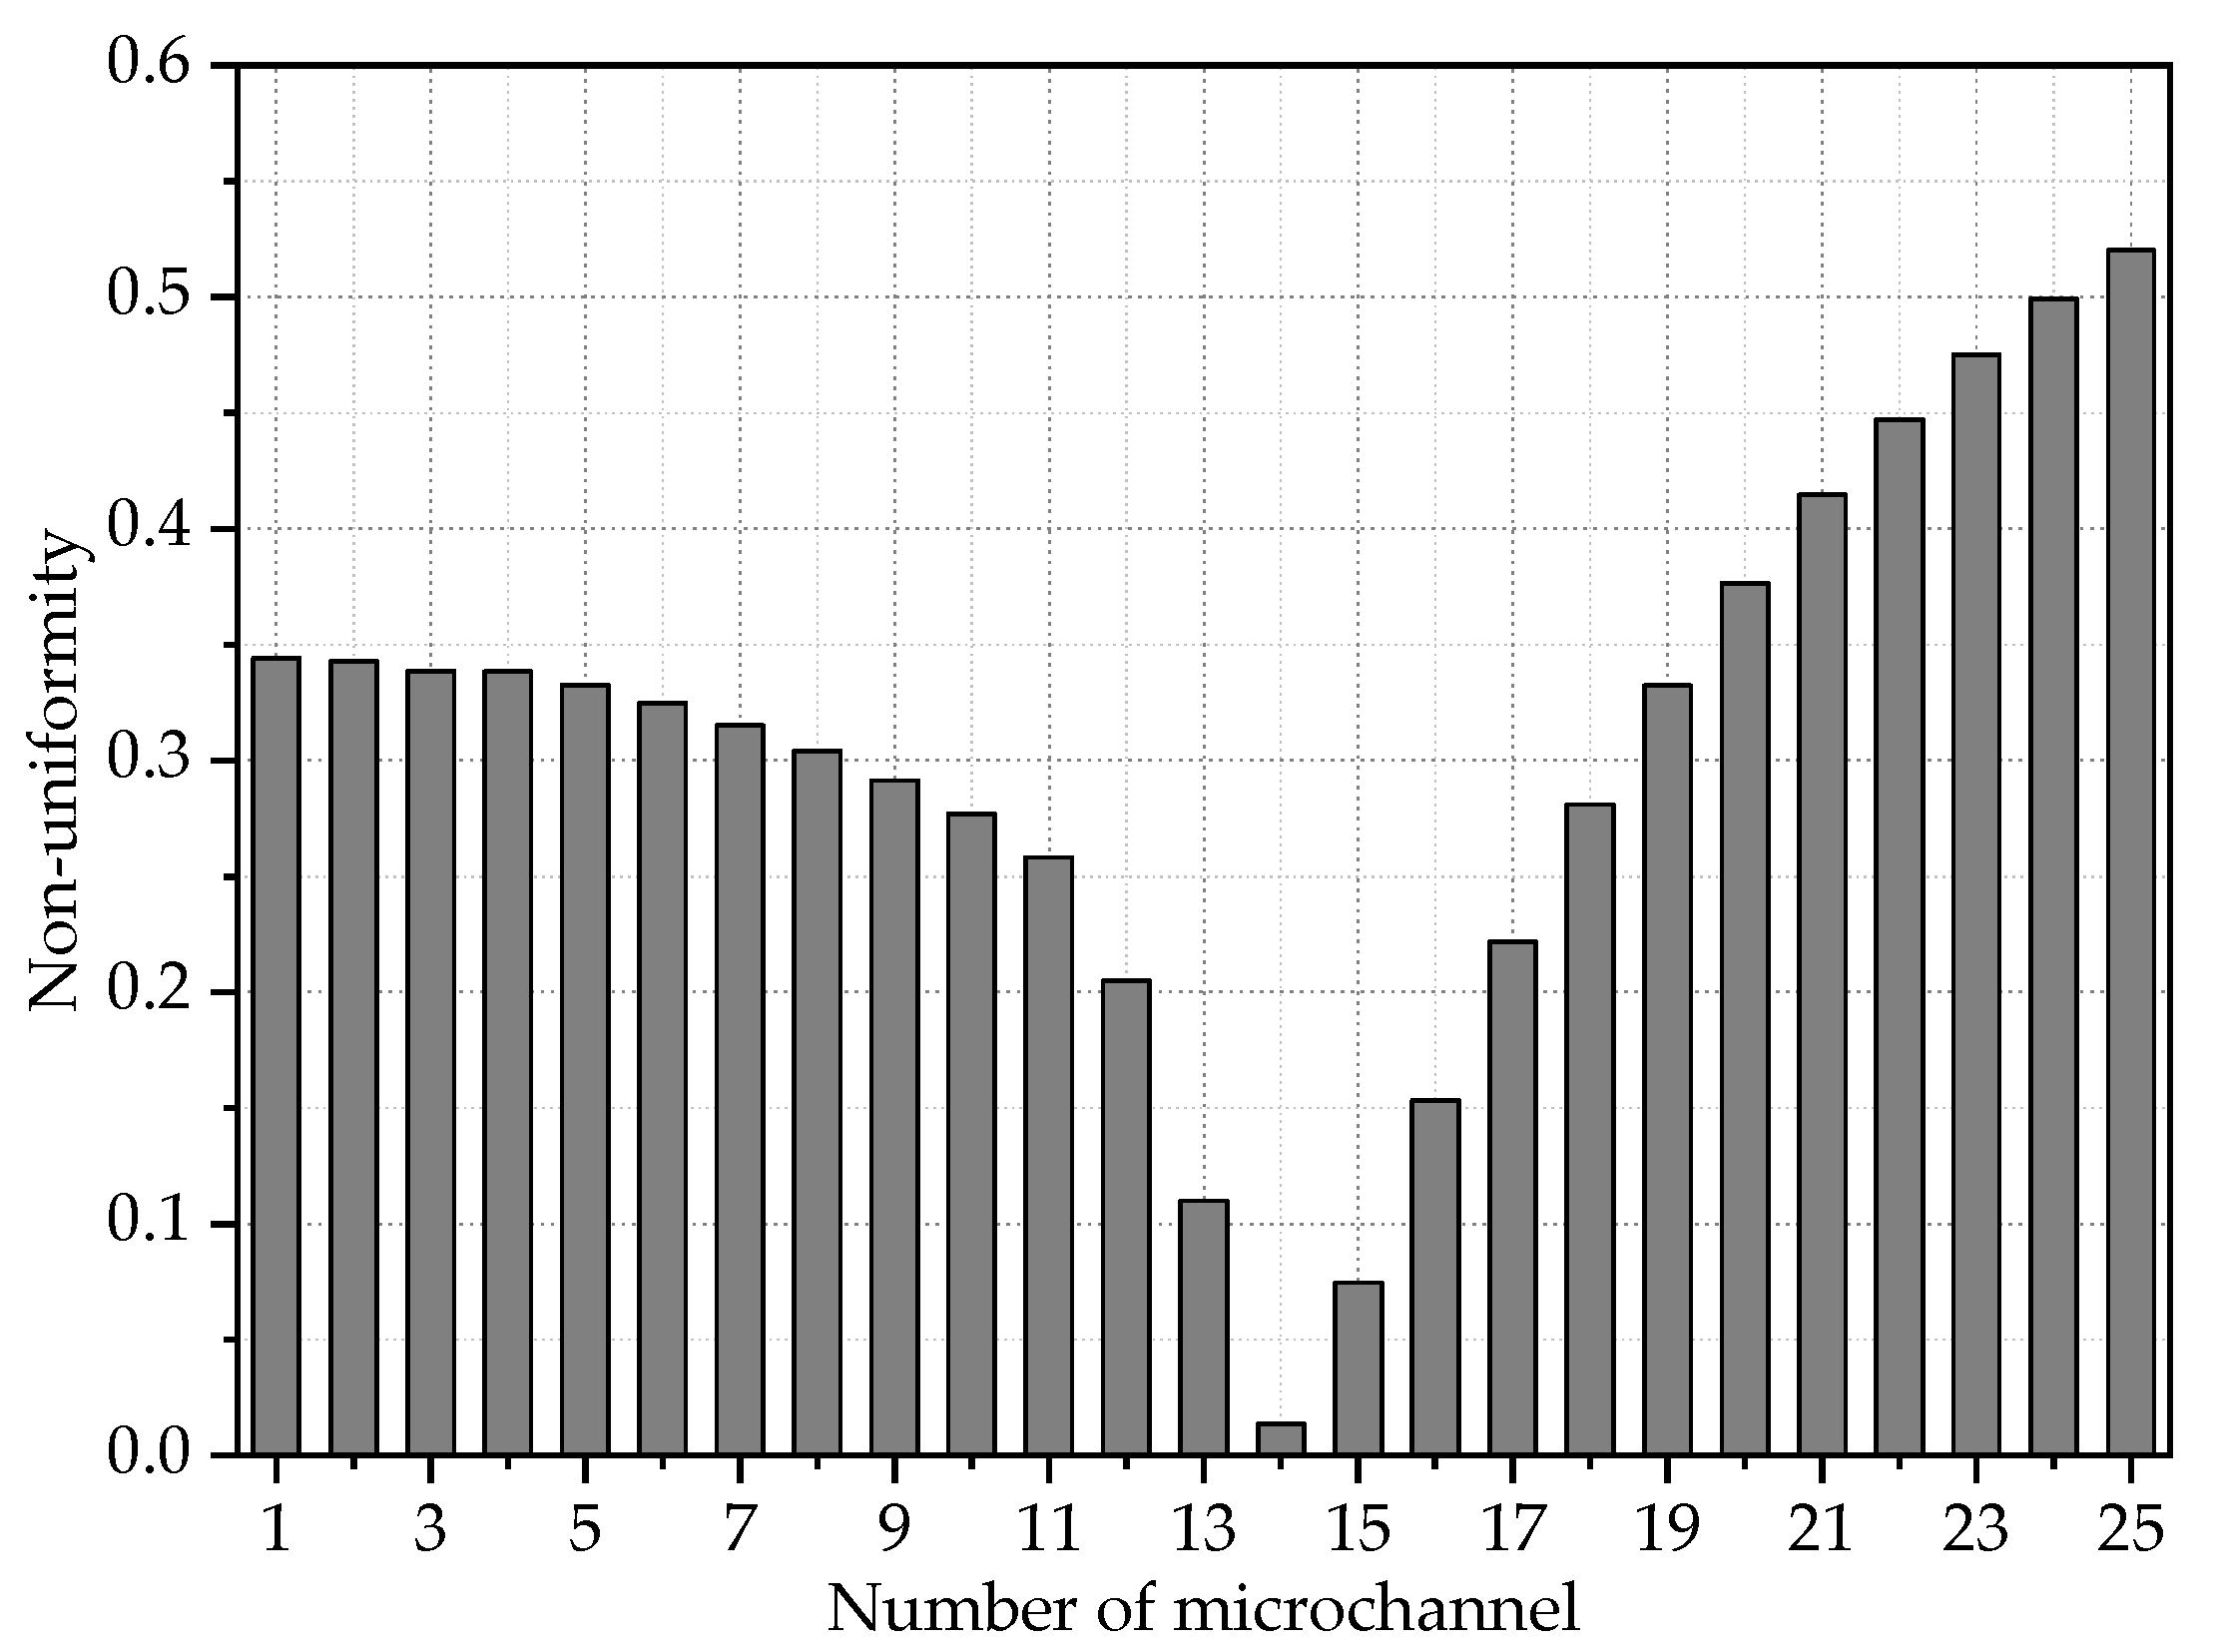
Figure 14 shows the non-uniformity among the microchannels and Table 3 shows three indicators to evaluate the uniformity of the mass flow rate of the refrigerant for the microchannel heat exchanger. It can be seen from Figure 14 that the non-uniformity for both the microchannels in the front and the back of the flat tube was large, and the largest non-uniformity value reached 0.52. The results in Table 3 show that the value was 1.67 and the value was 0.85, which deviate greatly from the ideal values of 0 and 1.
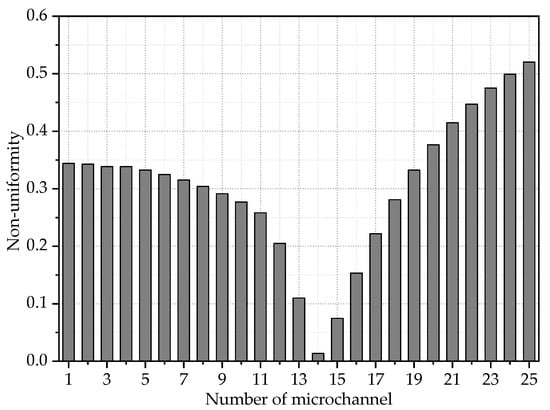
Figure 14.
Non-uniformity of the microchannel tube.
Table 3.
Evaluation of the refrigerant distribution uniformity.
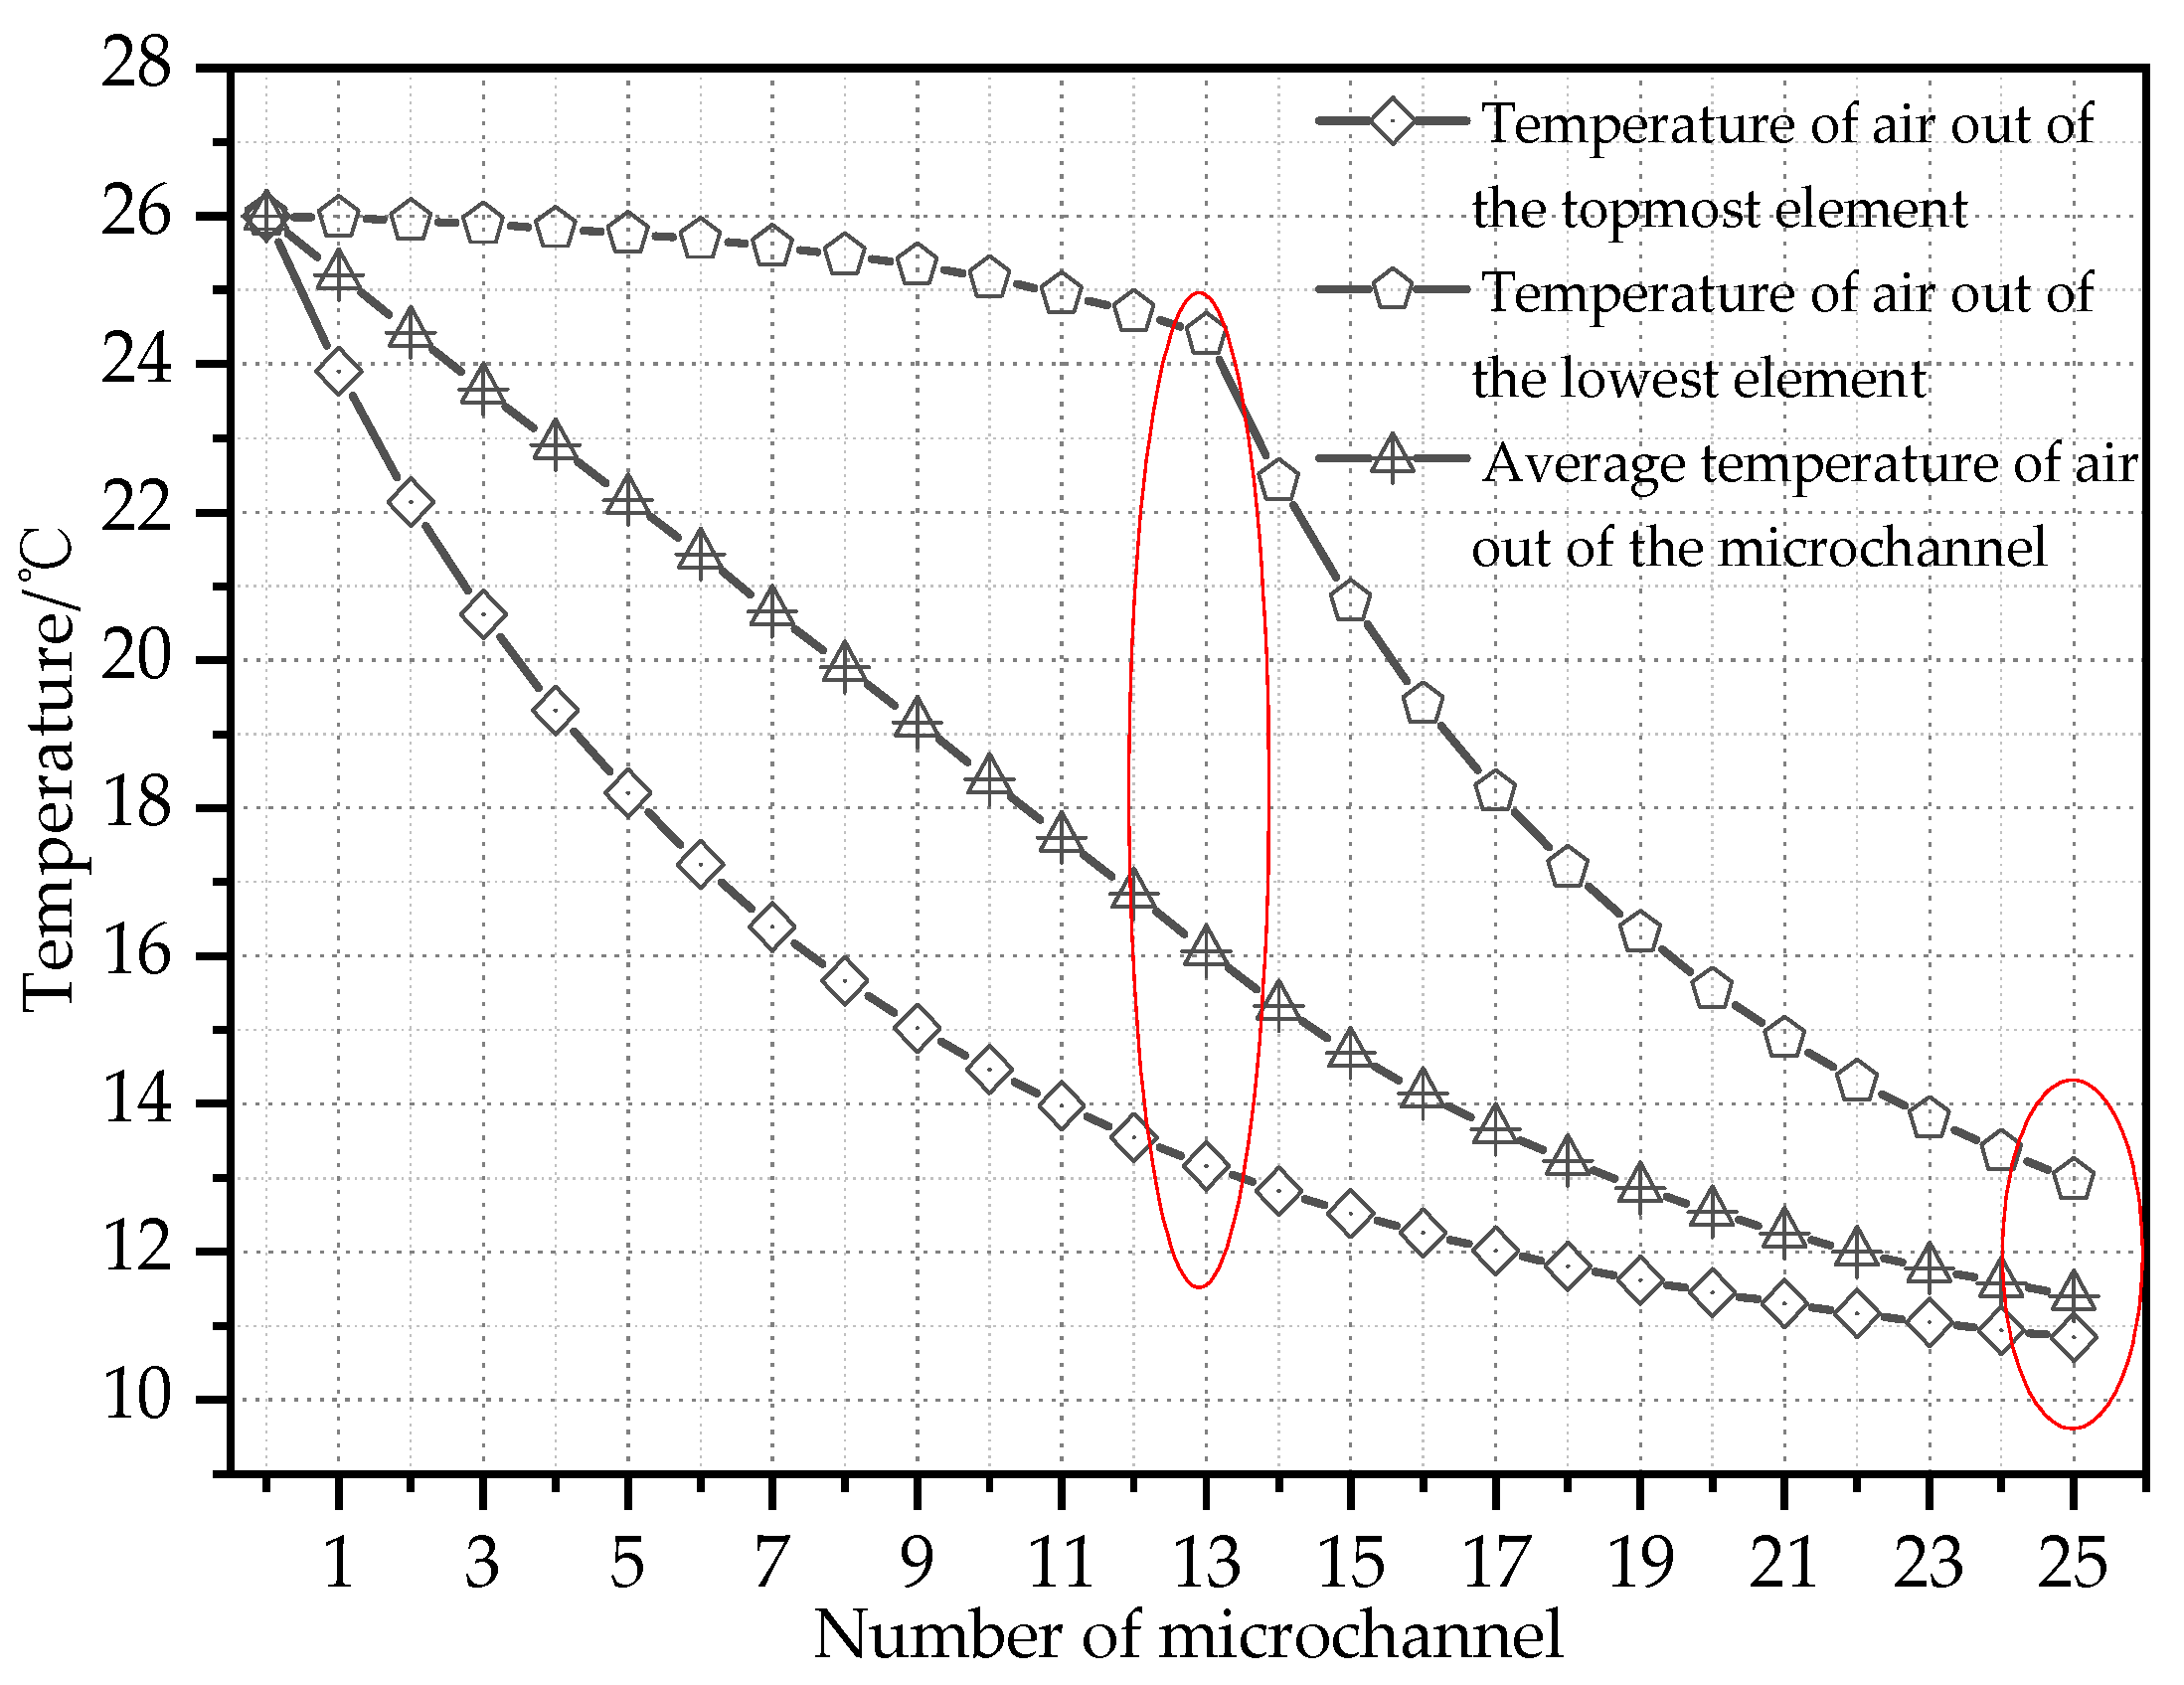
3.2. Air Side
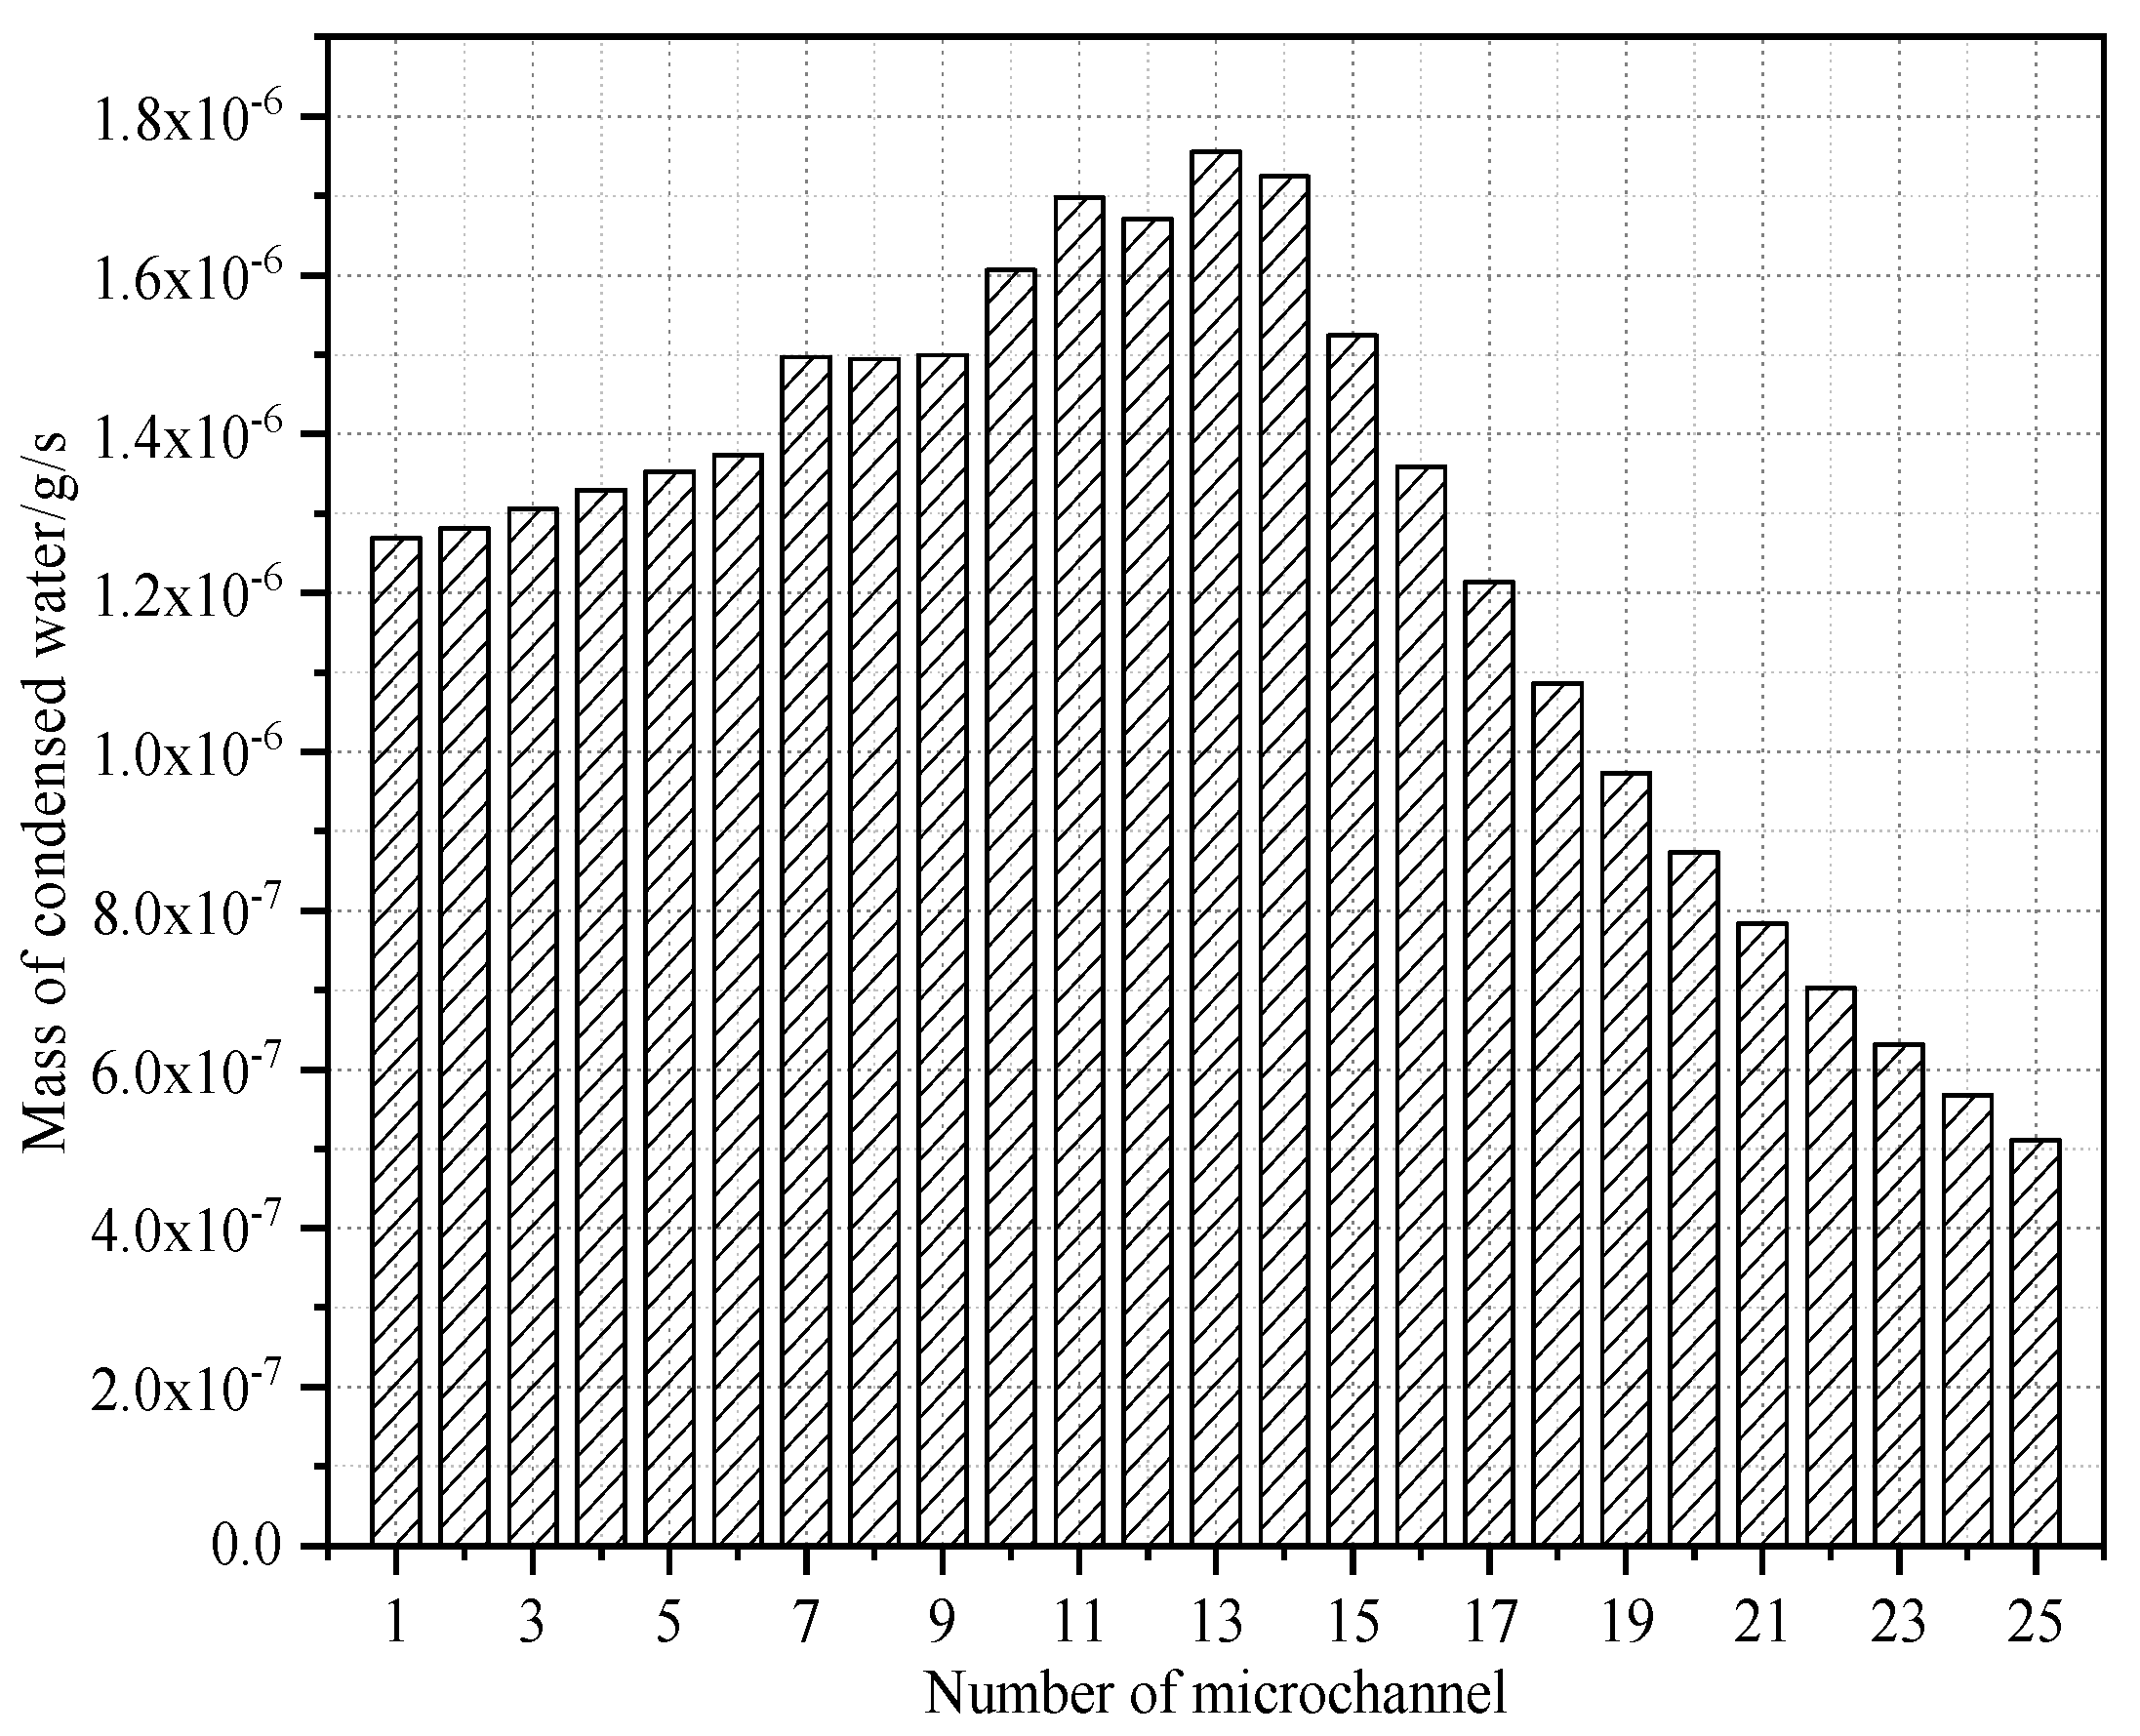
Figure 15 shows the air temperature distribution of the microchannel, and Figure 16 shows the air temperature change in the airflow direction. The temperature difference between the air out of the bottom and the top was 2.13 °C. Figure 17 shows the condensation water distribution on the microchannels, which may be important for condensate water drainage during structural optimization in the future. From Figure 17 it can be obviously noticed that the mass of condensation water first increased in the front 13 microchannels and then decreased gradually. The main reason for this is that the refrigerant distribution in microchannels, as shown in Figure 7, led to air temperature decrease, as shown in Figure 15 and Figure 16, and finally led to an increase in water condensation. For the other 12 microchannels that were filled with two-phase refrigerant, the humidity of the air became increasingly and lower; thus the condensate water gradually decreased.
Figure 15.
Air temperature out of the microchannels.

Figure 16.
Air temperature change in the airflow direction.
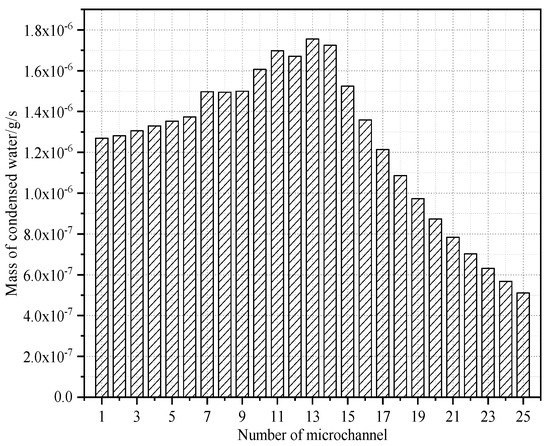
Figure 17.
Condensation water distribution on the microchannels.
3.3. Heat Transfer Rate
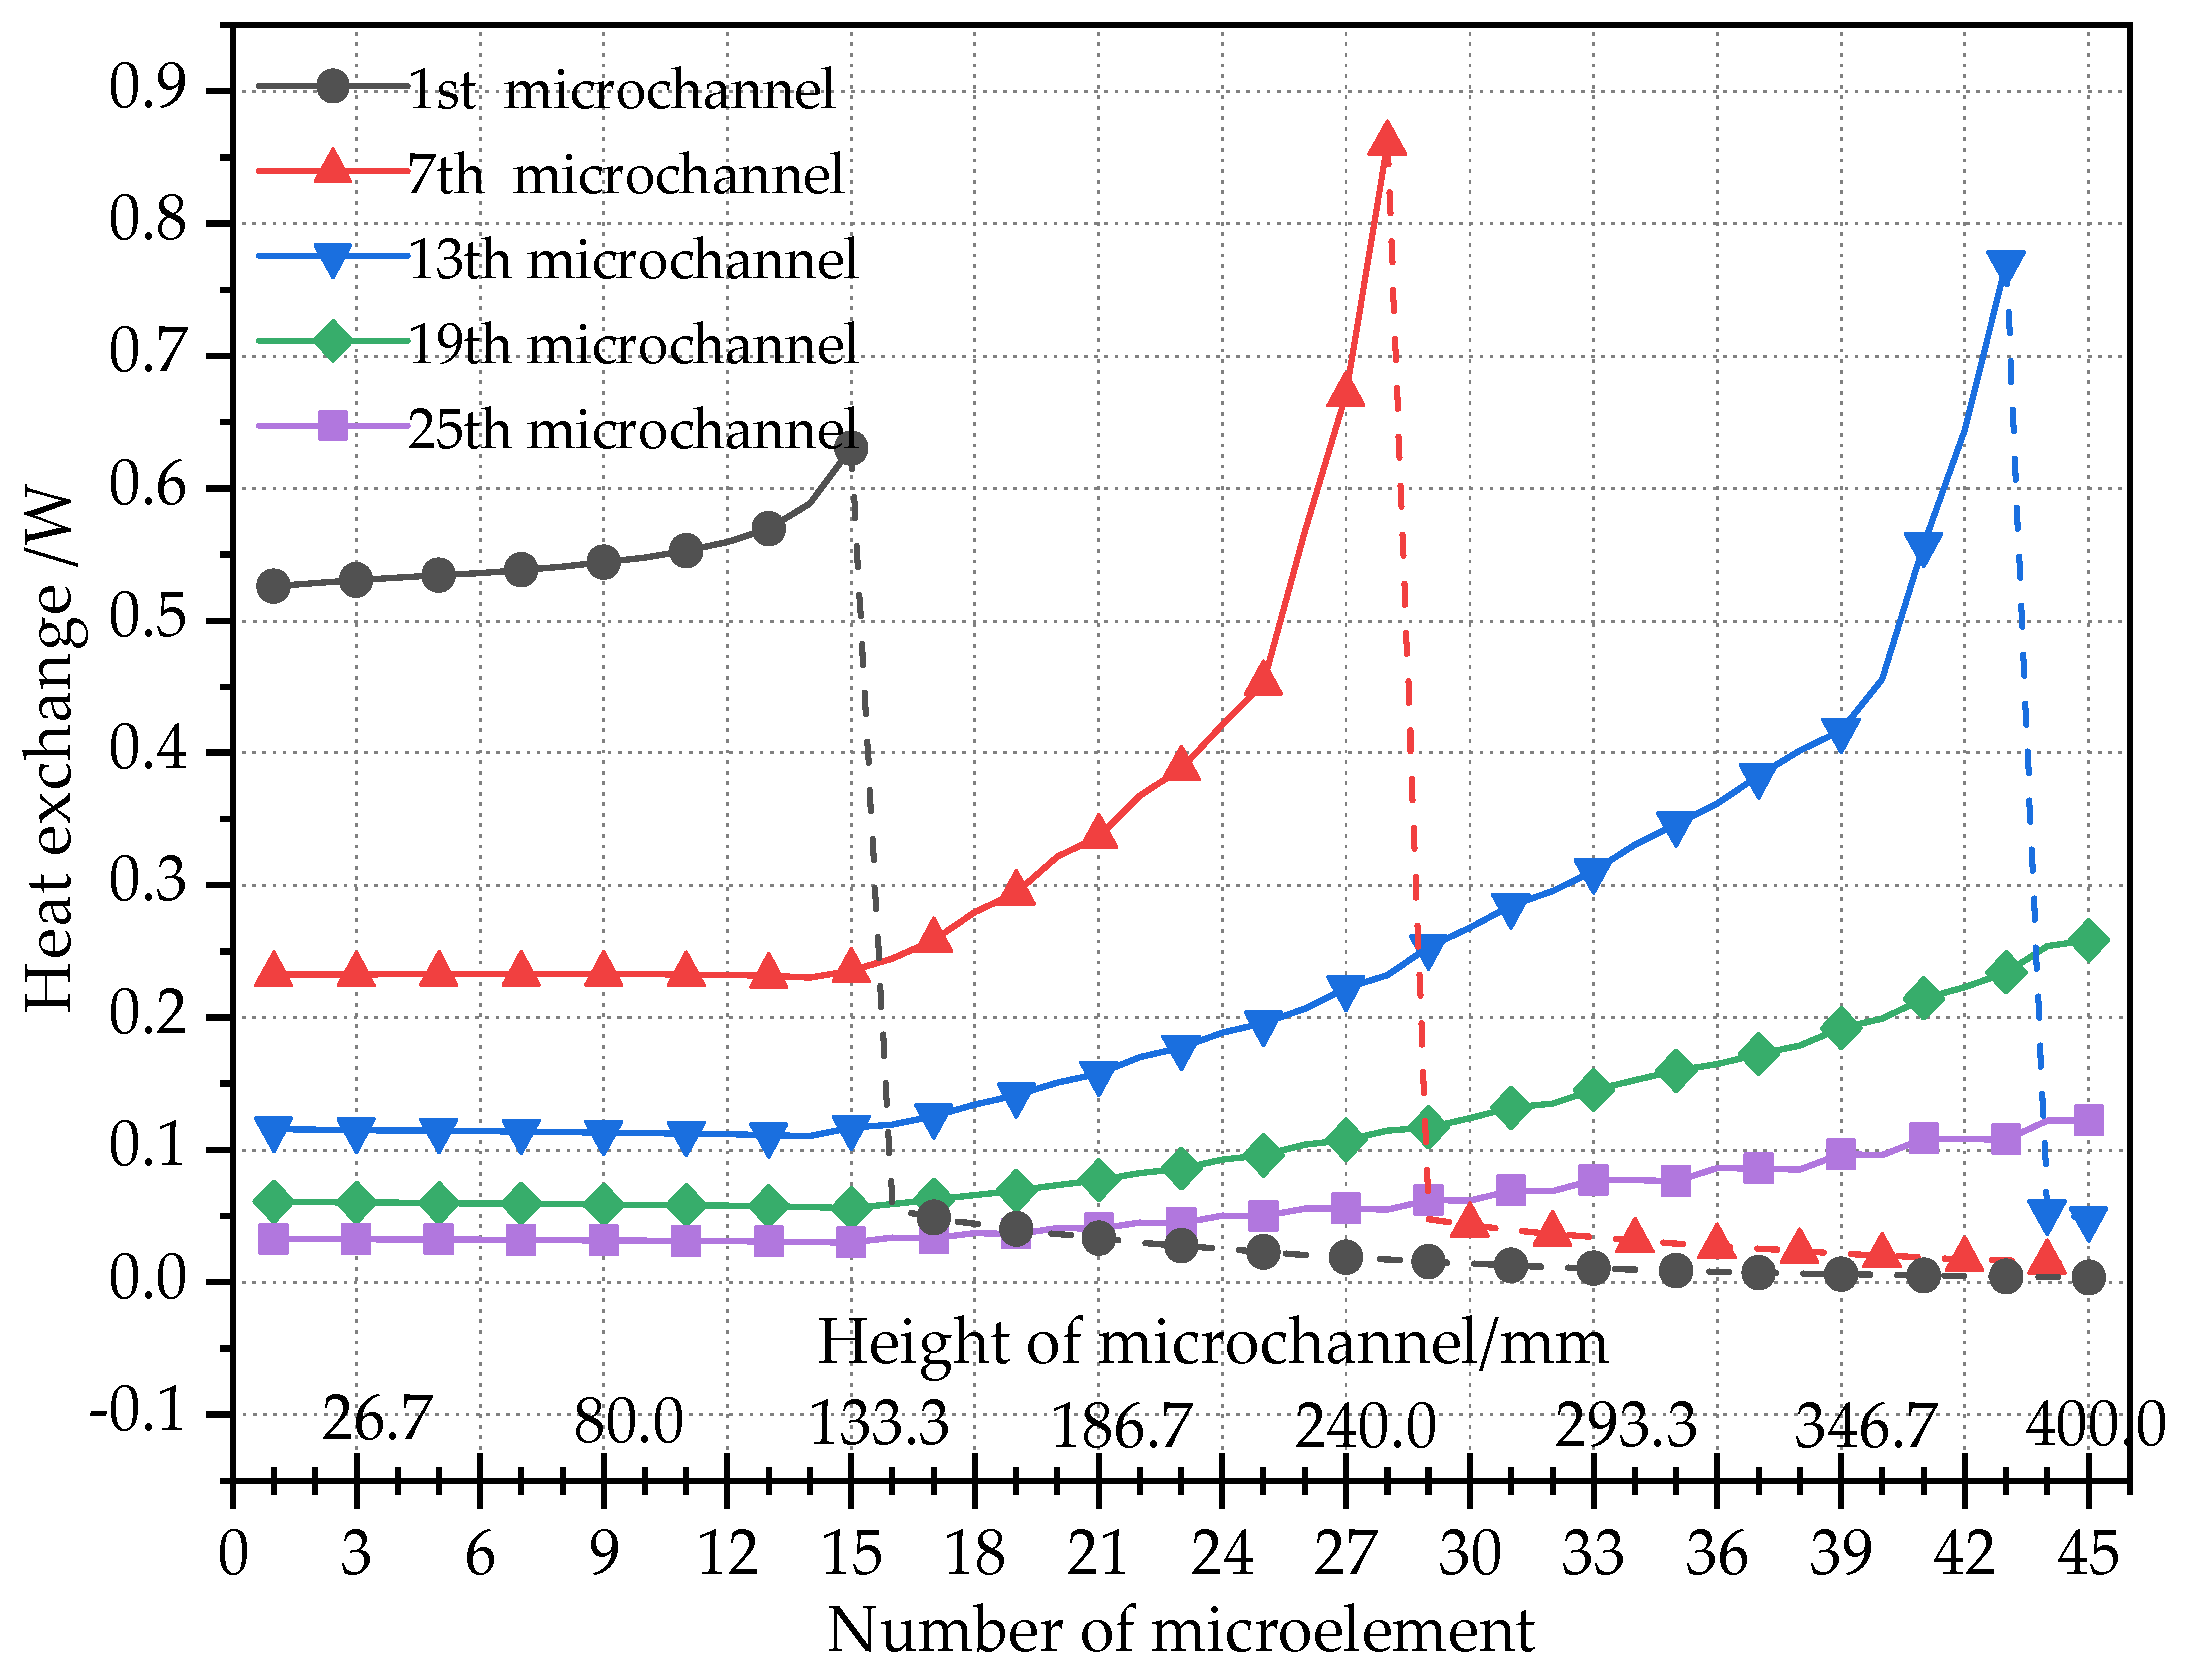
Figure 18 shows that the heat exchange between the air and the refrigerant changed with the number of micro-elements. It can apparently be known that the heat exchange in the two-phase region increased with the height because of the increase in the tworefrigerant dryness, which may increase the convection coefficient of the refrigerant. However, when the refrigerant state changed from the two-phase state to the superheated state, the heat exchange of the elements decreased sharply due to the lower convection coefficient of refrigerant in the superheated state. Combined with refrigerant dryness in Figure 6 and heat exchange of the 1st, 7th, 13th, 19th and 25th in Figure 18, it can be concluded that the dryness of the refrigerant was a crucial factor influencing the heat transfer rate between the air and refrigerant.
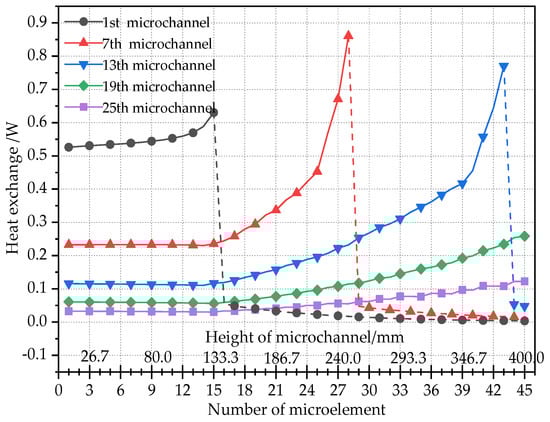
Figure 18.
Heat exchange between the air and refrigerant changing with the number of micro-elements.
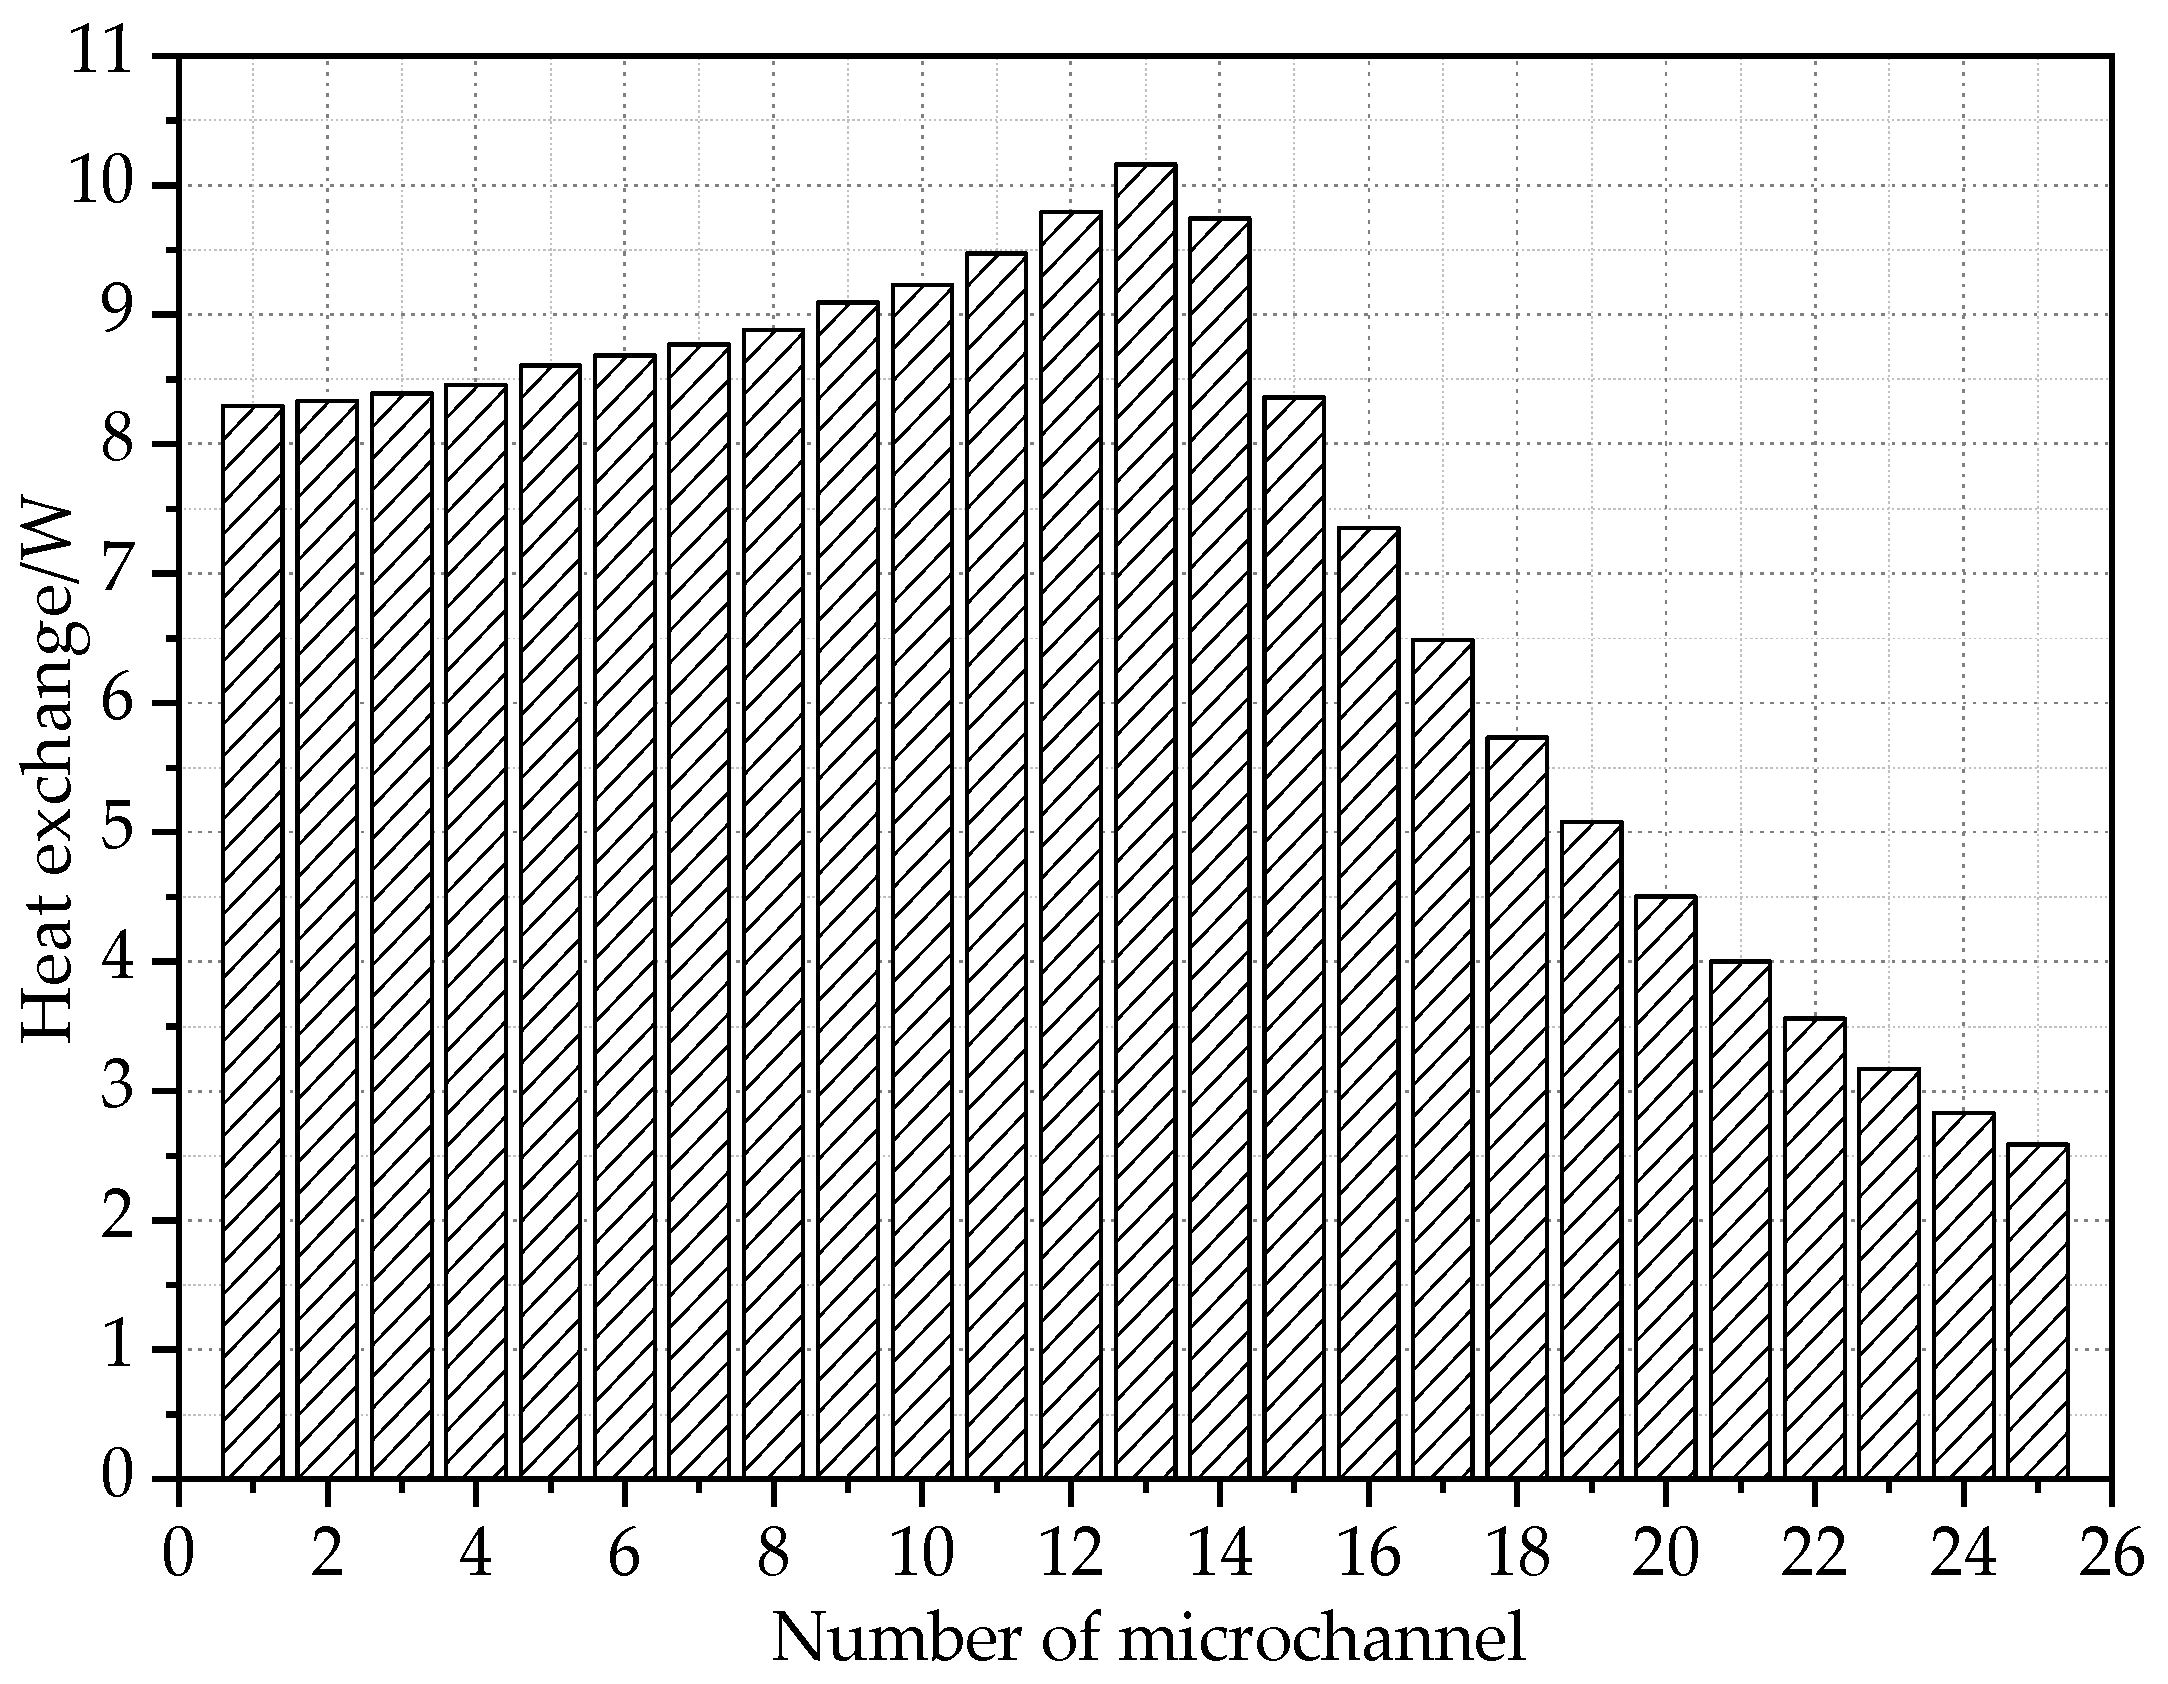
Figure 19 shows the heat transfer rate of the microchannel. The heat transfer rate of the microchannel first increased slowly in the 13 front microchannels and then decreased quickly and then gradually. For the 25th microchannel, the heat transfer rate was only 2.58 W, which is only approximately one-quarter of the 13th microchannel. Combined with the refrigerant mass flow rate distribution in Figure 13, it can be seen that the refrigerant distribution in the microchannels was influenced greatly by the heat transfer rate of the microchannels. For the first 13 microchannels, higher refrigerant mass flow rate led to higher heat transfer intensities. However, for the last 12 microchannels, lower heat transfer intensities led to higher refrigerant mass flow rates.

Figure 19.
Heat transfer rate of the microchannels.
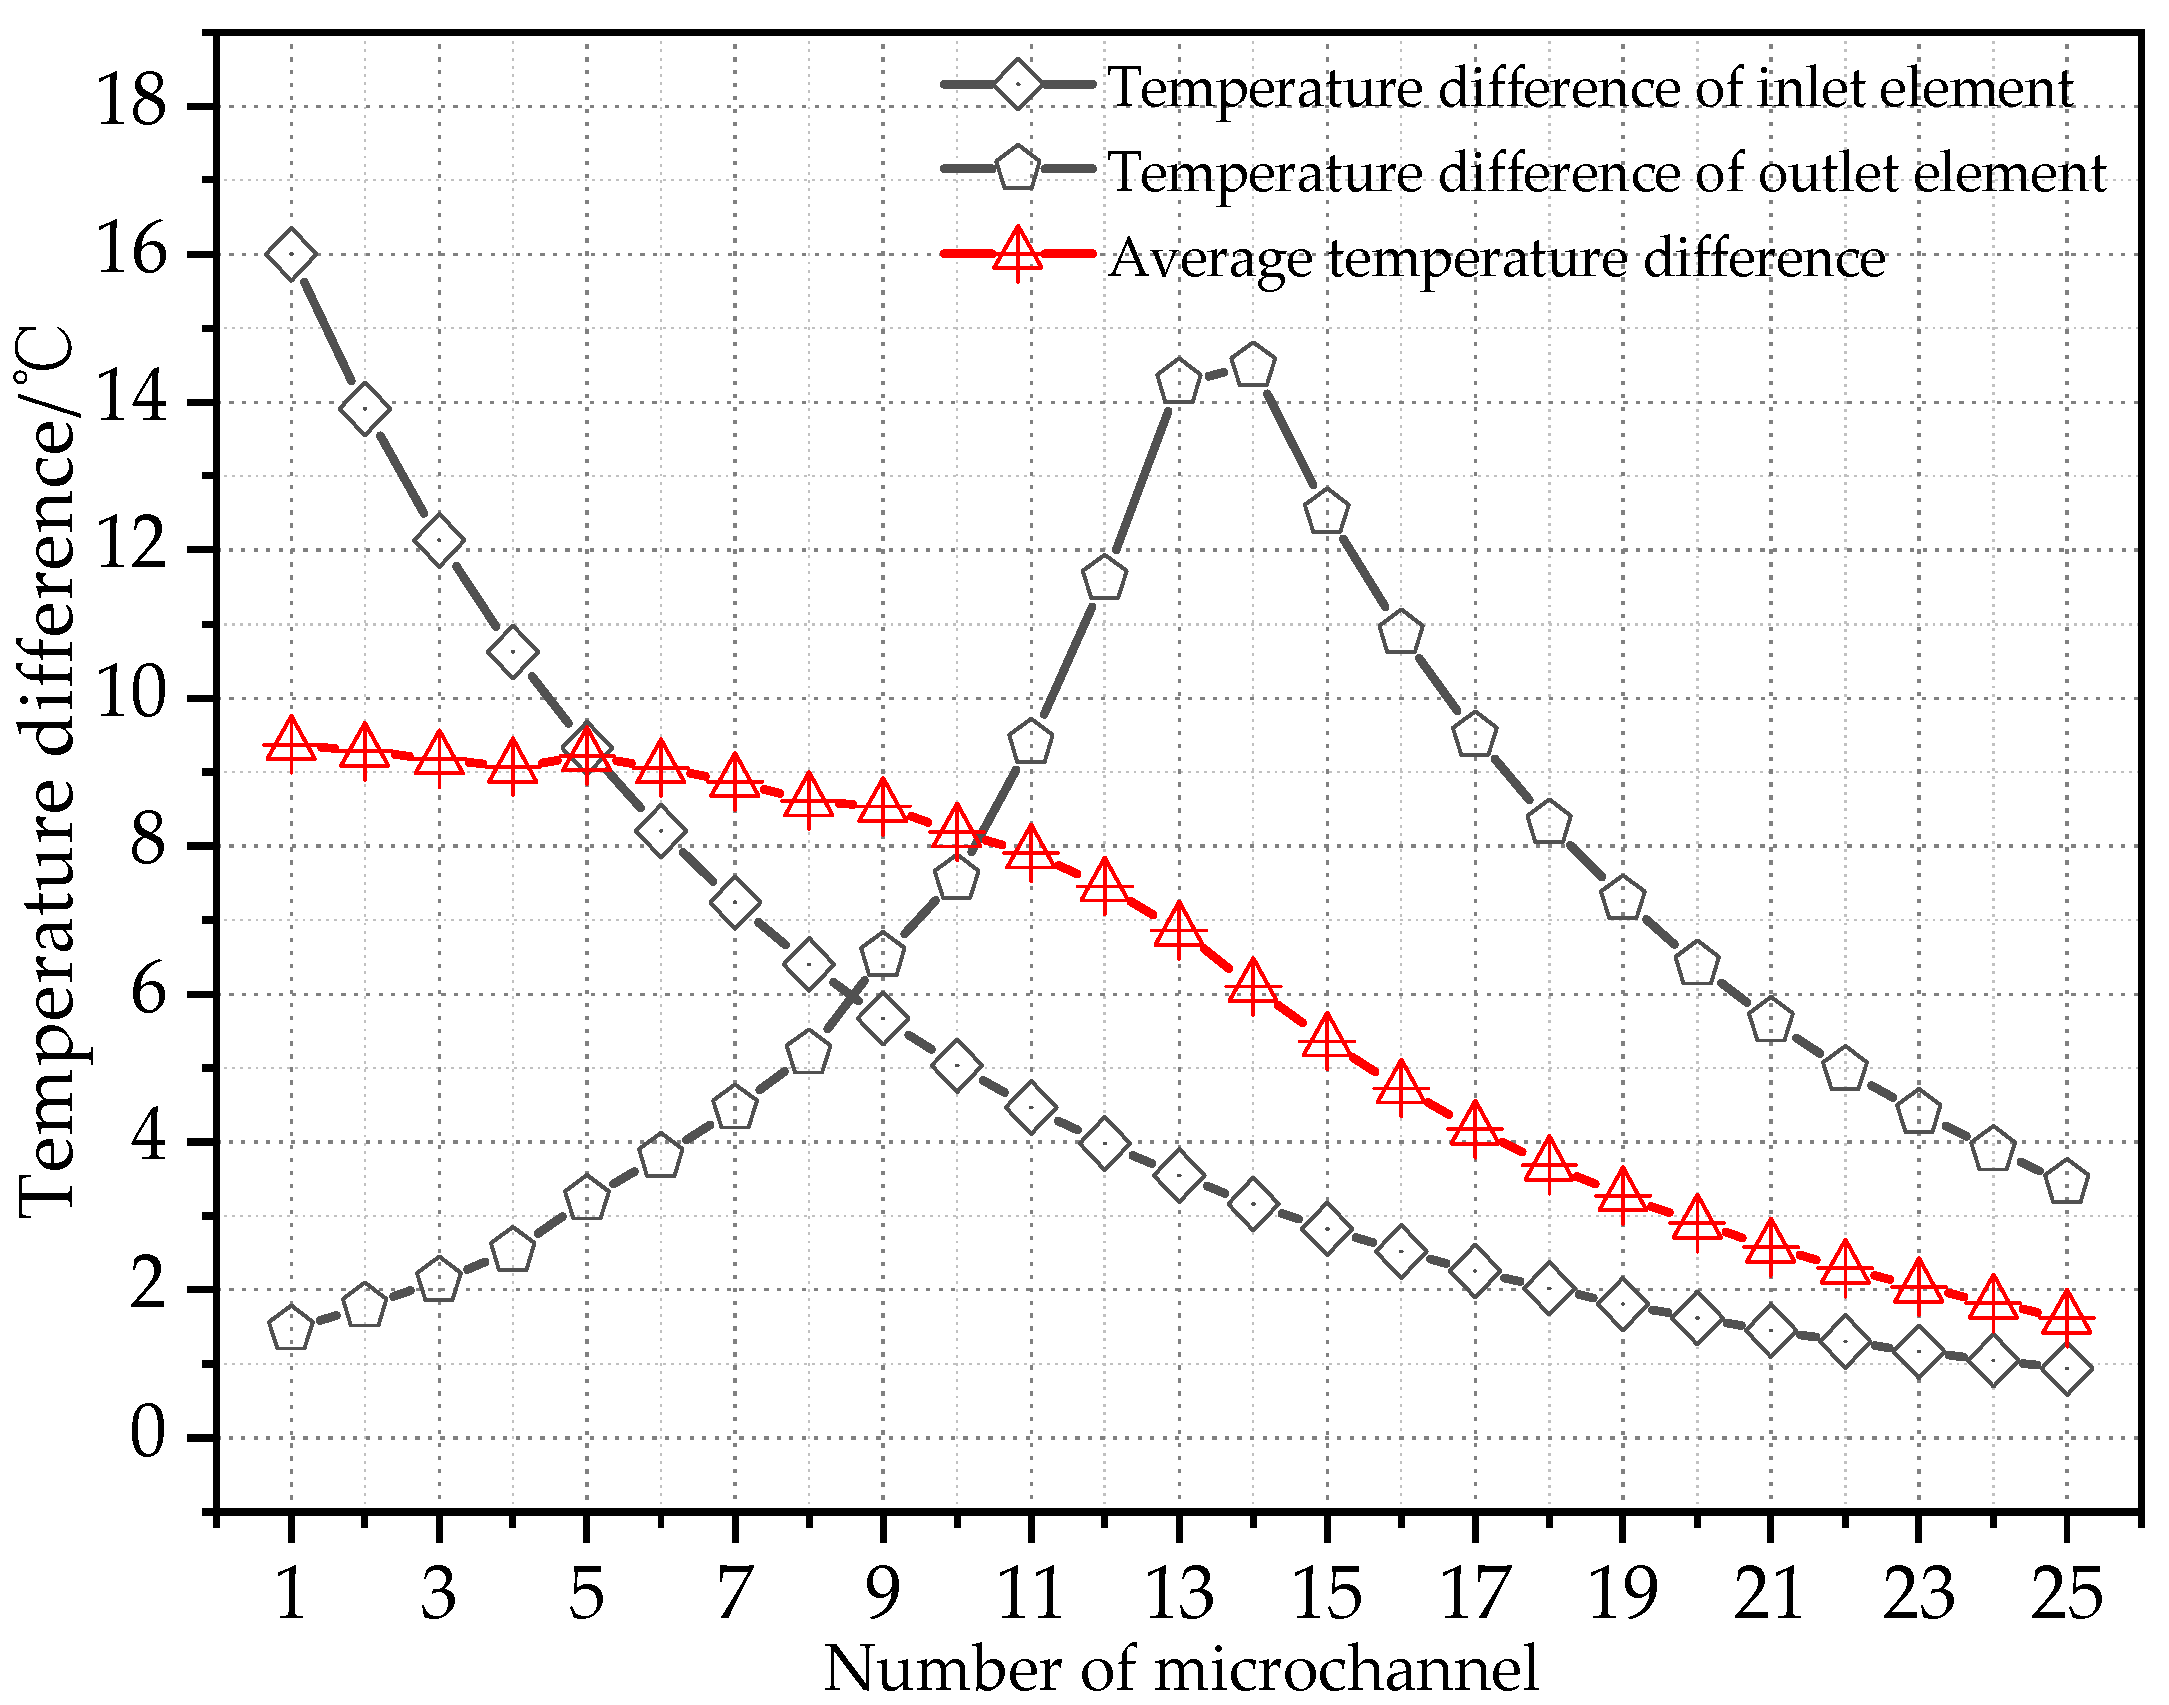
Figure 20 shows the temperature difference between air and refrigerant change with the number of microchannels. Combined with the condensation distribution on the microchannels in Figure 17, the heat transfer rate of the microchannel in Figure 19 can be explained. Although a larger temperature difference is beneficial for heat transfer between the air and the refrigerant, condensation water on the air side is also a non-negligible factor. For the first 13 microchannels, although the temperature difference between the air and refrigerant decreased, the condensate water increased. However, for the last 12 microchannels in which the refrigerant was not completely evaporated, both the temperature difference and the mass of the condensate water decreased. Thus, it can be concluded that the microchannels’ refrigerant mass flow rate should be optimized by the microchannels’ structural optimization.
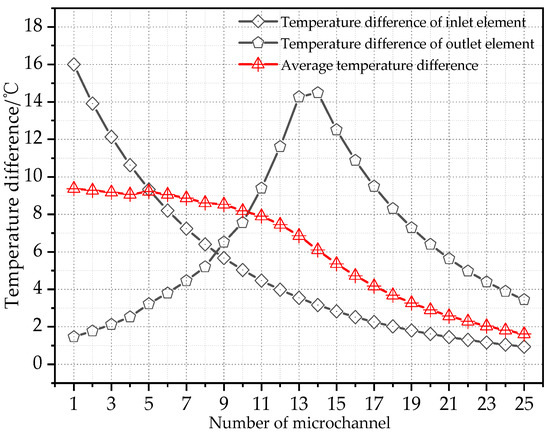
Figure 20.
Temperature difference between air and refrigerant changing with the number of microchannels.
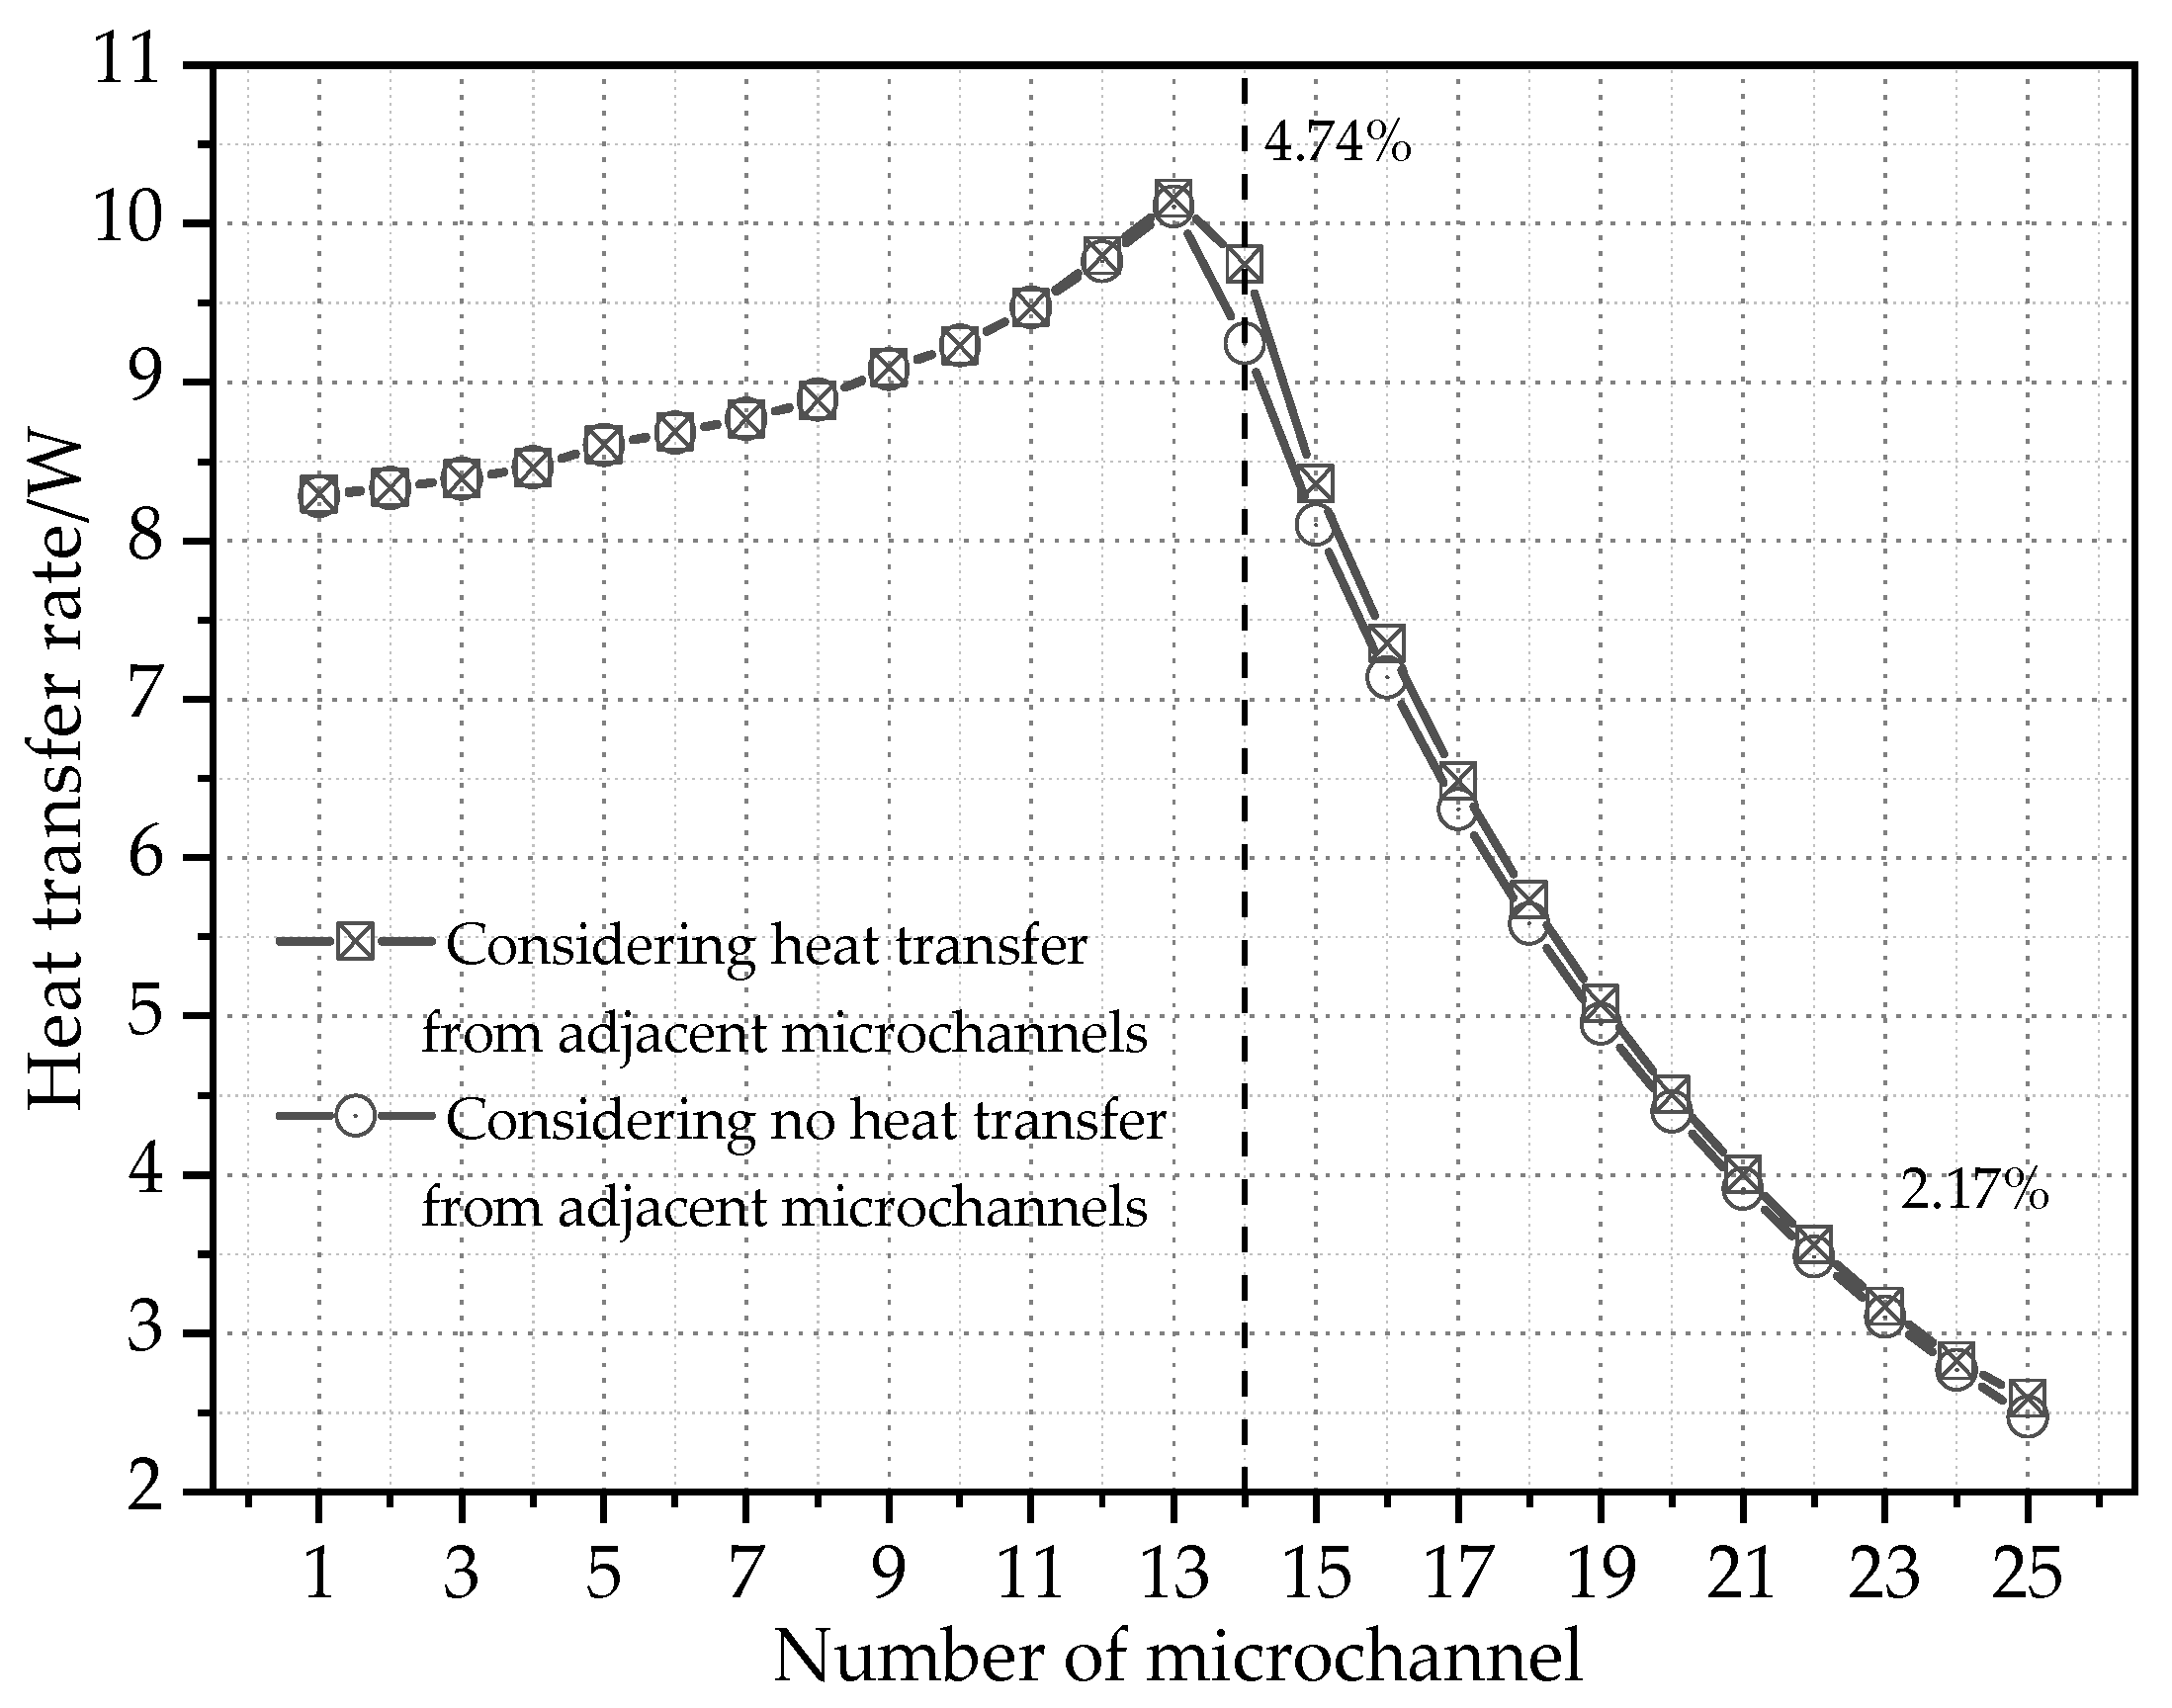
Heat transfer between adjacent microchannels was also analyzed in this paper. Figure 21 and Table 4 shows the influence of heat transfer from adjacent microchannels. The rsults show that for the first 13th microchannels, the heat transfer between two adjacent microchannels had almost no effect on the heat transfer, because the influence of the left and right microchannels on the middle microchannel can be almost offset. For the last 12 microchannels filled completely by the two-phase refrigerant, the largest deviation was 4.47% which occurred in the 14th microchannel. The smallest deviation was 2.17% which occurred in the 25th microchannel. However, the total heat exchange deviation for the entire flat tube was only 1.17%, as shown as in Table 4. Therefore, it can be concluded that heat exchange from adjacent microchannels is small and can be neglected.
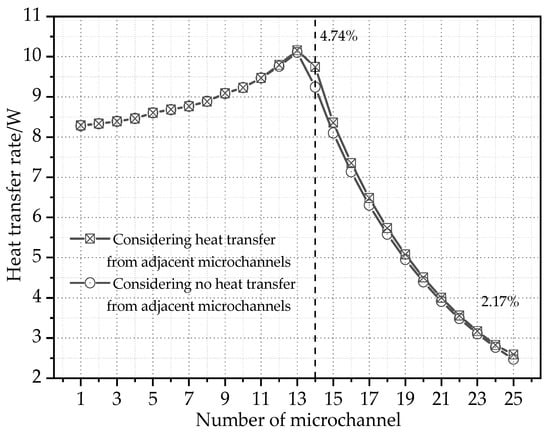
Figure 21.
Influence of the heat transfer from adjacent microchannels.
Table 4.
Deviation considering the heat from adjacent microchannels.
4. Conclusions
In this paper, a heat transfer mathematical model of a microchannel evaporator’s flat tube, which had vertically placed parallel microchannels inside in the airflow direction was developed. The refrigerant distribution among the microchannels and its influence on the heat transfer between the air and the refrigerant were studied. The following conclusions can be drawn for the microchannel evaporator in summer conditions.
1. The refrigerant mass flow rate among the microchannels with the same structural parameters in a flat tube was obviously nonuniform in the airflow direction, and the refrigerant mass flow rate of the last microchannel was approximately 2.59 times that of the first microchannel. The refrigerant in the microchannels of the first half could completely evaporate, while the refrigerant in the microchannels of the second half incompletely evaporated, which means the heat exchange between air and refrigerant was inadequate;
2. Refrigerant distribution and heat exchange between air and refrigerant were interrelated and interacted with each other. For the first 13 microchannels, higher refrigerant mass flow rate led to a higher heat transfer intensity. However, for the last 12 microchannels, lower heat transfer intensities led to a larger refrigerant mass flow rate. The heat exchange rate of the 25th microchannel was only approximately one-quarter of the 13th microchannel. The microchannels’ refrigerant mass flow rate should be optimized via structural optimization of the microchannels;
3. There existed a temperature difference between the air out of the bottom and the top of the flat tube, and the temperature difference was approximately 2.13 °C. The microchannel in the middle of the flat tube had the most condensate water;
4. Ignoring the heat transfer between microchannels will cause a deviation of 1.17% for the numerical results of the heat transfer rate of the flat tube, which means that heat transfer from adjacent microchannels can be neglected in the mathematical model.
Author Contributions
Results analysis, W.H. and X.Z.; writing—original draft preparation, W.H. and X.Z. All authors have read and agreed to the published version of the manuscript.
Funding
The paper was financially supported by the Fundamental Research Funds for Beijing Universities(grant no. X18242 and X18243), the Opening Funds of the State Key Laboratory of Building Safety and Built Environment and National Engineering Research Center of Building Technology (grant no. BSBE2017-06), and the National Key Research and Development Plan of China (grant no. 2021YFF0306305 and grant no. 2019YFE0103000).
Institutional Review Board Statement
Not applicable.
Informed Consent Statement
Not applicable.
Data Availability Statement
Not applicable.
Conflicts of Interest
The authors declare no conflict of interest.
Nomenclature
| A | Area, m2 | Greek symbols | |
| Bo | Boiling number | α | Convective heat transfer coefficient, W/(m2·K) |
| C | Specific heat of air, J/(kg·K) | Void coefficient of refrigerant | |
| Dh | Hydraulic diameter, m | β | Correction factor |
| Enew | Convection heat transfer enhancement factor | ρ | Density, kg/m3 |
| Fr | Froude number | τ0 | Shear force, Pa |
| G | Mass flux, kg/(m2s) | δ | Thickness of wall, m |
| Nu | Nusselt number | ΔP | Pressure drop, Pa |
| P | Pressure of refrigerant, Pa | ΔPacc | Acceleration pressure drop, Pa |
| Pr | Prandtl number | ΔPf | Frictional pressure drop, Pa |
| Q | Heat transfer per length, W/m | ΔPg | Gravitational pressure drop, Pa |
| RDP | Evaluating indicator of uniformity | Thermal conductivity, W/(m·K) | |
| Re | Reynolds number | μ | Dynamic viscosity coefficient, N·s/m2 |
| Snew | Nucleate boiling suppression factor | ν | Kinematic viscosity coefficient of air, m2/s |
| We | Weber number | η | Fin efficiency |
| Xtt | Lockhart–Martinelli number | Moisture separation coefficient | |
| d | Absolute humidity of air, g/kg | Subscripts | |
| f | Friction factor | a | Air |
| h | Enthalpy, kJ/kg | f | Fin |
| j | Air-side heat transfer factor | i | Number of microchannel or node |
| m | Mass flow rate, kg/s | liq | Liquid refrigerant |
| q | Heat flux density, W/m2 | r | Refrigerant |
| x | Vapor quality of refrigerant | s | Superheated |
| S0 | Wetted perimeter, m | vap | Refrigerant in vapor state |
| t | Temperature, °C | w | Wall |
| μ | Velocity, m/s | ||
References
- Liu, C.K.; Yang, S.J.; Chao, Y.L.; Liou, K.Y.; Wang, C.C. Effect of non-uniform heating on the performance of the microchannel heat sinks. Int. Commun. Heat Mass Transf. 2013, 43, 57–62. [Google Scholar] [CrossRef]
- Nielsen, K.K.; Engelbrecht, K.; Christensen, D.V.; Jensen, J.B.; Smith, A.; Bahl, C.R.H. Degradation of the performance of microchannel heat exchangers due to flow maldistribution. Appl. Therm. Eng. 2012, 40, 236–247. [Google Scholar] [CrossRef] [Green Version]
- Wiebke, B.; Martin, R.K.; Brian, E. Modelling refrigerant distribution in microchannel evaporators. Int. J. Refrig. 2009, 32, 1736–1743. [Google Scholar]
- Zou, Y.; Tuo, H.; Hrnjak, P.S. Modeling refrigerant maldistribution in microchannel heat exchangers with vertical headers based on experimentally developed distribution results. Appl. Therm. Eng. 2014, 64, 172–181. [Google Scholar] [CrossRef]
- Kulkarni, T.; Bullard, C.W.; Cho, K. Header design tradeoffs in microchannel evaporators. Appl. Therm. Eng. 2004, 24, 759–776. [Google Scholar] [CrossRef]
- Cho, H.; Cho, K. Mass Flow Rate Distribution and Phase Separation of R-22 in Multi-Microchannel Tubes under Adiabatic Condition. Microscale Thermophys. Eng. 2004, 8, 129–139. [Google Scholar] [CrossRef]
- Bowers, C.D.; Mai, H.; Elbel, S.; Hrnjak, P.S. Refrigerant Distribution Effects on the Performance of Microchannel Evaporators. In Proceedings of the International Refrigeration and Air Conditioning Conference, Purdue, IN, USA, 16–19 July 2012. [Google Scholar]
- Liu, Y.; Sun, W.; Wu, W.; Wang, S. Gas-liquid two-phase flow distribution in parallel microchannels with different header and channels’ orientations. Int. J. Heat Mass Transf. 2017, 112, 767–778. [Google Scholar] [CrossRef]
- Dario, E.R.; Tadrist, L.; Oliveira, J.L.G.; Passos, J.C. Measuring maldistribution of two-phase flows in multi-parallel microchannels. Appl. Therm. Eng. 2015, 91, 924–937. [Google Scholar] [CrossRef]
- Kim, N.-H.; Go, M.-G. Horizontal distribution of two-phase refrigerant in parallel flat mini-channels. Exp. Therm. Fluid Sci. 2019, 93, 139–152. [Google Scholar] [CrossRef]
- Lee, W.J.; Lee, H.; Ji, H.J. Numerical evaluation of the range of performance deterioration in a multi-port mini-channel heat exchanger due to refrigerant mal-distribution in the header. Appl. Therm. Eng. 2021, 185, 116429. [Google Scholar] [CrossRef]
- Hu, W.; Fan, J.; Song, M.; Jia, P.; Gao, Y. An experimental study on the frosting characteristic and performance of a microchannel evaporator in an air source heat pump unit. Energy Build. 2020, 224, 110254. [Google Scholar] [CrossRef]
- Lee, J.K.; Lee, S.Y. Distribution of two-phase annular flow at header–channel junctions. Exp. Therm. Fluid Sci. 2004, 28, 217–222. [Google Scholar] [CrossRef]
- Kim, N.-H.; Lee, E.-J.; Byun, H.-W. Improvement of two-phase refrigerant distribution in a parallel flow minichannel heat exchanger using insertion devices. Appl. Therm. Eng. 2013, 59, 116–130. [Google Scholar] [CrossRef]
- Kim, N.H.; Lee, E.J.; Byun, H.W. Two-phase refrigerant distribution in a parallel flow minichannel heat exchanger having horizontal headers. Int. J. Heat Mass Transf. 2012, 55, 7747–7759. [Google Scholar] [CrossRef]
- Kim, N.H.; Byun, H.W. Effect of inlet configuration on upward branching of two-phase refrigerant in a parallel flow heat ex-changer. Int. J. Refrig. 2013, 36, 1062–1077. [Google Scholar] [CrossRef]
- Kim, N.-H.; Kim, C.-H.; Shah, Y.; Li, W. Improvement of two-phase refrigerant distribution for upward flow of a parallel flow minichannel heat exchanger using insertion devices. Appl. Therm. Eng. 2019, 160, 114065. [Google Scholar] [CrossRef]
- Ahmad, M.; Berthoud, G.; Mercier, P. General characteristics of two-phase flow distribution in a compact heat exchanger. Int. J. Heat Mass Transf. 2009, 52, 442–450. [Google Scholar] [CrossRef]
- Wu, G.; Yan, Z.; Zhuang, D.; Ding, G.; Cao, F.; Meng, J. Design method and application effects of embedded-clapboard distributor on refrigerant distribution among multi-tubes of microchannel heat exchangers. Int. J. Refrig. 2020, 119, 20–433. [Google Scholar] [CrossRef]
- Wijayanta, A.T.; Miyazaki, T.; Koyama, S. Refrigerant distribution in horizontal headers with downward mini-channel branching conduits: Experiment, empirical correlation and two-phase flow pattern map. Exp. Therm. Fluid Sci. 2017, 81, 430–444. [Google Scholar] [CrossRef]
- Zou, Y.; Hrnjak, P.S. Effects of fluid properties on two-phase flow and refrigerant distribution in the vertical header of a reversible microchannel heat exchanger–Comparing R245fa, R134a, R410A, and R32. Appl. Therm. Eng. 2014, 70, 966–976. [Google Scholar] [CrossRef]
- Fei, P.; Hrnjak, P.S. Adiabatic Developing Two-Phase Refrigerant Flow in Manifolds of Heat Exchangers; University of Illinois at Urbana-Champaign ACRC: Champaign, IL, USA, 2004. [Google Scholar]
- Mahvi, A.J.; Garimella, S. Visualization of flow distribution in rectangular and triangular header geometries. Int. J. Refrig. 2017, 76, 170–183. [Google Scholar] [CrossRef]
- Mahvi, A.J.; Garimella, S. Two-phase flow distribution of saturated refrigerants in microchannel heat exchanger headers. Int. J. Refrig. 2019, 104, 84–94. [Google Scholar] [CrossRef]
- Zou, Y.; Hrnjak, P.S. Experiment and visualization on R134a upward flow in the vertical header of microchannel heat exchanger and its effect on distribution. Int. J. Heat Mass Transf. 2013, 62, 124–134. [Google Scholar] [CrossRef]
- Zou, Y.; Hrnjak, P.S. Refrigerant distribution in the vertical header of the microchannel heat exchanger-Measurement and visualization of R410A flow. Int. J. Refrig. 2013, 36, 2196–2208. [Google Scholar] [CrossRef]
- Long, H.; Lee, M.S.; Saleh, K.; Aute, V.; Radermacher, R. A computational fluid dynamics and effectiveness-NTU based co-simulation approach for flow mal-distribution analysis in microchannel heat exchanger headers. Appl. Therm. Eng. 2014, 65, 447–457. [Google Scholar]
- Yun, R.; Kim, Y.C.; Park, C. Numerical analysis on a microchannel evaporator designed for CO2 air-conditioning systems. Appl. Therm. Eng. 2006, 27, 1320–1326. [Google Scholar] [CrossRef]
- Gossard, J.J.; Han, X.; Ramalingam, M.; Sommers, A.D. Investigating the thermal-hydraulic performance of new refrigerant mixtures through numerical simulation of minichannel and microchannel evaporators. Appl. Therm. Eng. 2013, 50, 1291–1298. [Google Scholar] [CrossRef]
- Tian, Z.; Ma, L.; Gu, B.; Yang, L.; Liu, F. Numerical model of a parallel flow minichannel evaporator with new flow boiling heat transfer correlation. Int. J. Refrig. 2016, 63, 1–13. [Google Scholar] [CrossRef]
- Kandlikar, S.G.; Balasubramanian, P. An extension of the flow boiling correlation to transition, laminar, and deep laminar flows in minichannels and microchannels. Heat Transf. Eng. 2004, 25, 86–93. [Google Scholar] [CrossRef]
- Bertsch, S.S.; Groll, E.A.; Garimella, S.V. A composite heat transfer correlation for saturated flow boiling in small channels. Int. J. Heat Mass Transf.. 2009, 52, 2110–2118. [Google Scholar] [CrossRef] [Green Version]
- Zhao, Y.; Liang, Y.; Sun, Y.; Chen, J. Development of a mini-channel evaporator model using R1234yf as working fluid. Int. J. Refrig. 2012, 35, 2166–2178. [Google Scholar] [CrossRef]
- Kim, M.; Bullard, C.W. Development of a microchannel evaporator model for a CO2 air-conditioning system. Energy. 2001, 26, 931–948. [Google Scholar] [CrossRef]
- Kim, M.; Bullard, C.W. Air-side thermal hydraulic performance of multi-louvered fin aluminum heat exchangers. Int. J. Refrig. 2002, 25, 390–400. [Google Scholar] [CrossRef]
- Kim, M.; Bullard, C.W. Air-side performance of brazed aluminum heat exchangers under dehumidifying conditions. Int. J. Refrig. 2002, 25, 924–934. [Google Scholar] [CrossRef]
- Jiang, H.; Aute, V.; Radermacher, R. Coildesigner: A generalpurpose simulation and design tool for air-to-refrigerant heat exchangers. Int. J. Refrig. 2006, 29, 601. [Google Scholar] [CrossRef]
- Kim, S.M.; Mudawar, I. Review of databases and predictive methods for pressure drop in adiabatic, condensing and boiling mini/microchannel flows. Int. J. Heat Mass Transf. 2014, 77, 74–97. [Google Scholar] [CrossRef]
- Yun, J.H.; Jeong, J.H. A review of prediction methods for two-phase pressure loss in mini/microchannels. Int. J. Air-Condit. Refrig. 2016, 24, 1630002. [Google Scholar] [CrossRef]
- Habib, M.A.; Ben-Mansour, R.; Said, S.A.M.; Al-Qahtani, M.S.; Al-Bagawi, J.J.; Al-Mansour, K.M. Evaluation of flow maldistribution in air-cooled heat exchangers. Comput. Fluids 2009, 38, 677–690. [Google Scholar] [CrossRef]
- Li, H.; Hrnjak, P. Quantification of liquid refrigerant distribution in parallel flow microchannel heat exchanger using infrared thermography. Appl. Therm. Eng. 2015, 78, 410–418. [Google Scholar] [CrossRef] [Green Version]


Publisher’s Note: MDPI stays neutral with regard to jurisdictional claims in published maps and institutional affiliations. |
© 2022 by the authors. Licensee MDPI, Basel, Switzerland. This article is an open access article distributed under the terms and conditions of the Creative Commons Attribution (CC BY) license (https://creativecommons.org/licenses/by/4.0/).