Article

Geological Controls on Geochemical Anomaly of the Carbonaceous Mudstones in Xian’an Coalfield, Guangxi Province, China

1
Key Laboratory of Tectonics and Petroleum Resources, China University of Geosciences, Ministry of Education, Wuhan 430074, China
2
Guangxi Bureau of Coal Geology, Liuzhou 545005, China
3
Institute of Environmental Assessment and Water Research, IDÆA-CSIC C/Jordi Girona, 18–26, 08034 Barcelona, Spain
*
Author to whom correspondence should be addressed.
Energies 2022, 15(14), 5196; https://doi.org/10.3390/en15145196
Submission received: 28 June 2022 / Revised: 15 July 2022 / Accepted: 16 July 2022 / Published: 18 July 2022

Abstract

:
The anomalous enrichment of the rare earth elements and yttrium (REY), U, Mo, As, Se, and V in the coal-bearing intervals intercalated within the carbonate successions in South China has attracted much attention due to the highly promising recovery potential for these elements. This study investigates the mineralogical and geochemical characteristics of the late Permian coal-bearing intervals (layers A–F) intercalated in marine carbonate strata in the Xian’an Coalfield in Guangxi Province to elucidate the mode of occurrence and enrichment process of highly elevated elements. There are two mineralogical assemblages, including quartz-albite-kaolinite-carbonates assemblage in layers D–F and quartz-illite-kaolinite-carbonates assemblage in layers A–C. Compared to the upper continental crust composition (UCC), the REY, U, Mo, As, Se, and V are predominantly enriched in layers A and B, of which layer A displays the REY–V–Se–As assemblage while layer B shows the Mo–U–V assemblage. The elevated REY contents in layer B are primarily hosted by clay minerals, zircon, and monazite; Mo, U, and V show organic association; and As and Se primarily display Fe-sulfide association. Three geological factors are most likely responsible for geochemical anomaly: (1) the more intensive seawater invasion gives rise to higher sulfur, Co, Ni, As, and Se contents, as well as higher Sr/Ba ratio in layers A–C than in layers D–F; (2) both the input of alkaline pyroclastic materials and the solution/rock interaction jointly govern the anomalous enrichment of REY; and (3) the influx of syngenetic or early diagenetic hydrothermal fluids is the predominant source of U, Mo, V, Se, and As.

1. Introduction

Coals formed in marine carbonate platforms are primarily distributed in South China, including Heshan [1,2,3,4], Fuisu [5], Xian’an [6], Yishan [7], Guiding [8], Yanshan (Yunnan Province) [9], and Chenxi (Hunan Province) coalfields [10], of which the first four are located within Guangxi Province, South China. These coals mostly contain highly enhanced concentrations of sulfur (especially organic sulfur) and, thus are classified as super-high-organic-sulfur (SHOS) coals [11,12].
The Late Permian is an important coal-forming period in Guangxi Province, South China. In recent years, the late Permian coal-bearing strata intercalated in marine carbonate strata in Guangxi Province, South China, have attracted much attention mainly due to the elevated concentrations of some critical elements, such as rare earth element and yttrium (REY), U, Mo, Se, V, and so on [3,5,6]. For example, the coals from the Heshan and Yishan Coalfields are enriched in Mo, U, Se, and V [1,2,3,13] while those from the Fusui, Xian’an, and Yishan Coalfields are characterized by the elevated concentrations of REY, Zr (Hf), and Li [5,6,13].
The geological factors controlling the geochemical anomaly are still controversial. Dai et al. [3] attributed the elevated concentrations of Mo–U–Se–V assemblage in the coals from the Heshan and Yishan Coalfields in Guangxi Province to the joint influence of terrigenous detrital materials from Yunkai Upland and multistage low-temperature hydrothermal fluids. However, the marine invasion is also considered as being the predominant factor controlling the enrichment of Mo–U–Se–V assemblage in the coals from the Heshan Coalfield in Guangxi Province [1]. Additionally, Zeng et al. [13] attributed the enrichment of Mo, U, Se, and V in the coals from the Heshan Coalfield to the soil horizon at top of the middle Permian Maokou Formation. The anomalous enrichment of REY in the coals from the Yishan Coalfield is attributed to the influx of high-temperature hydrothermal fluids [13]. However, the joint influence of volcanic ash fall and water/rock interaction is regarded as a predominant factor influencing the enrichment of REY in the coals from the Xian’an Coalfield in Guangxi Province [6].
The Xian’an Coalfield contains relatively abundant coal resources, but the mineralogical and geochemical compositions of the coals are limitedly investigated [6] and report the enrichment of REY, Sc, U, Pb, and Mo in the lowermost coal seam of the Heshan Formation. However, whether the rare metals are enriched in other coal seams in the Xian’an Coalfield is still unclear. This study investigates the mineralogy and geochemistry of the late Permian coal-bearing intervals located in the middle and upper portions of the Heshan Formation in the Xian’an Coalfield, Guangxi Province, China, with an emphasis on the mode of occurrence and enrichment mechanism of some elements highly enriched in the coal-bearing intervals studied. It also provides an opportunity to determine whether the coal-bearing intervals in the Xian’an Coalfield can be considered as promising raw materials for certain rare metals.

2. Geological Setting

Late Permian is an important coal-forming period in South China, including Guizhou, Yunnan, Sichuan, and Guangxi Provinces [14]. The late Permian coalfields in Guangxi Province, South China, mainly include the Heshan, Fusui, Yishan, Xian’an, and Baiwang Coalfields (Figure 1A). The Shanglin exploration region studied is located within the Xian’an Coalfield in Guangxi Province.
The palaeogeographic environment of the late Permian in Guangxi Province is mainly represented by a series of isolated carbonate platforms surrounded by deep flume basins (Figure 1B). The late Permian strata include the Heshan and Dalong Formations, the former of which is approximately 140 m thick and consists mainly of carbonates intercalated with coal seam, mudstone, and carbonaceous mudstone while the latter of which is mainly composed of siliceous rocks and siltstones intercalated with tuffaceous sandstone and marlstone.
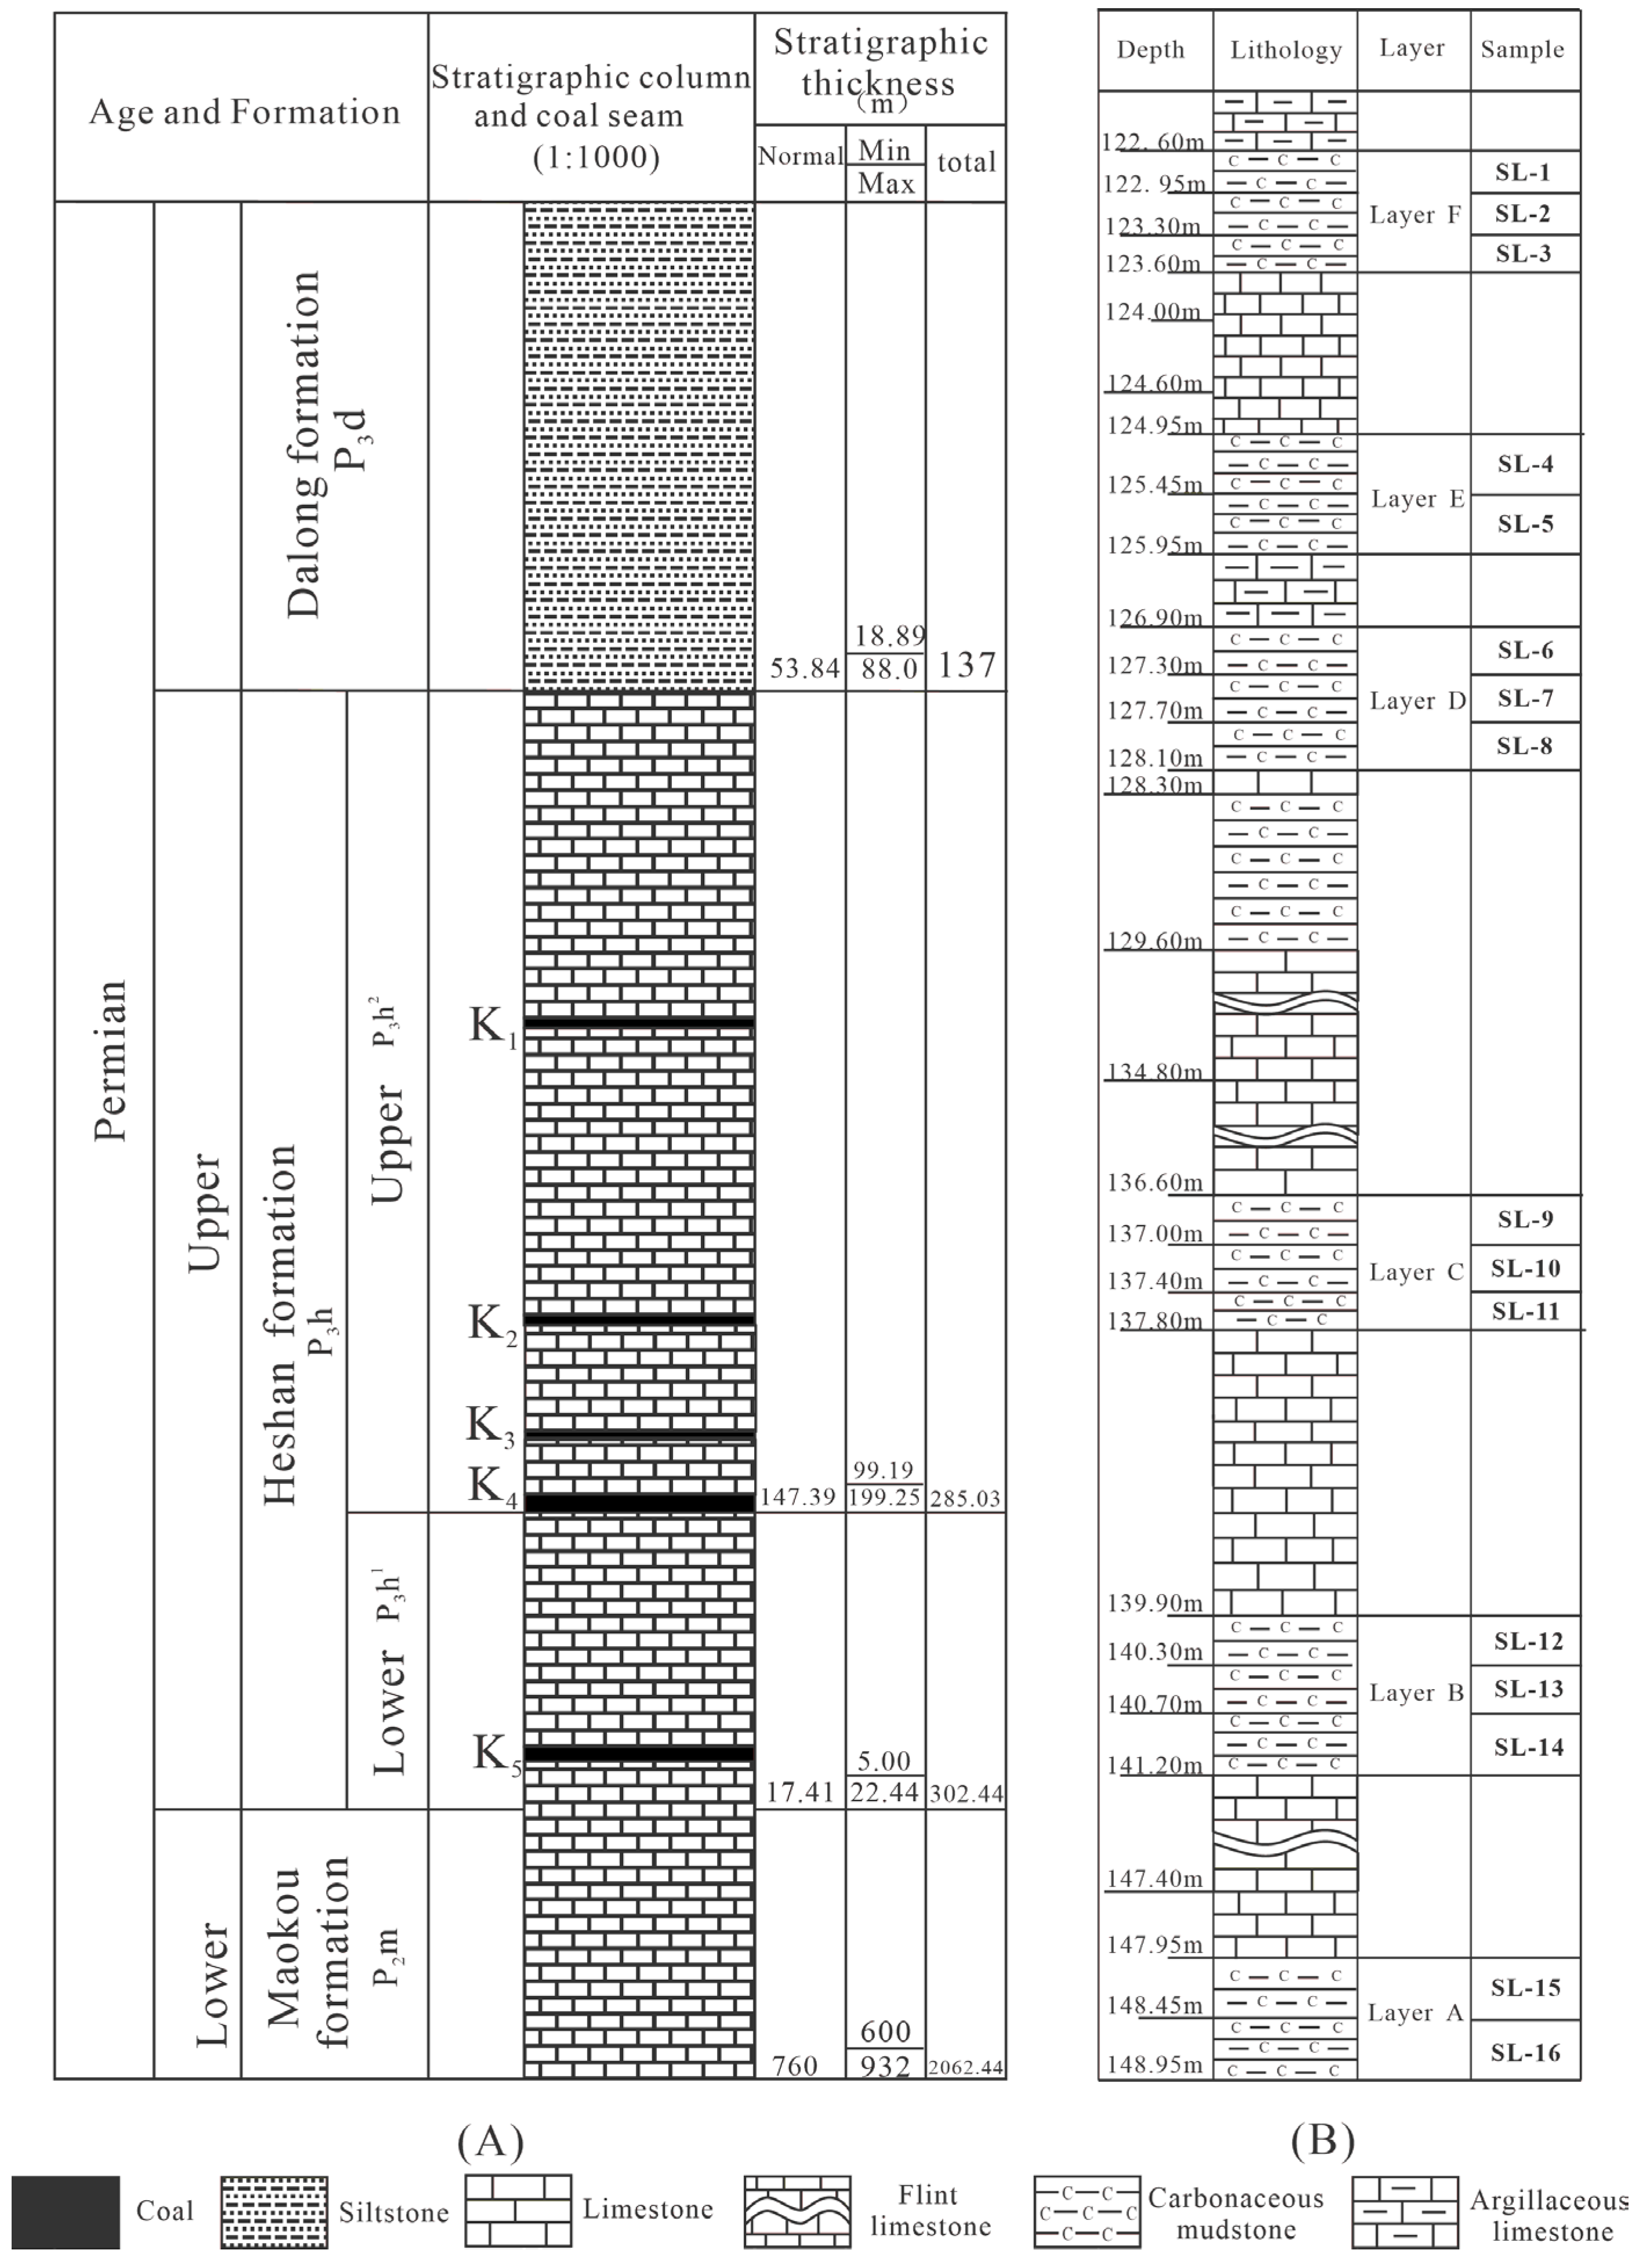
The late Permian coal-bearing stratum in the Xian’an Coalfield is primarily the Heshan Formation. There are mainly five layers of coal in the Heshan Formation, which are numbered from top to bottom as K1, K2, K3, K4, and K5 coals, respectively (Figure 2). The K3 and K4 coals are divided into two or three layers in this area. The lithology of the roof and floor of the coals is limestone or flint (Figure 2). Based on the lithological and coal-bearing characteristics, the Heshan Formation is subdivided into the upper and lower sections (Figure 2). The upper section of the Heshan Formation is the primary coal-bearing stratum and consists of bioclastic limestone and four coal seams while the lower section is a secondary coal-bearing stratum and composed of limestone, biolimestone, and gravel clastic limestone intercalated with one locally mined coal seam K5. The total thickness of the coal seam is 11.6 m, and the total recoverable thickness is 6.4 m, among which the K4 coal seam is the main mineable coal seam with an average of 1.80 m, and the K3 and K2 coal seams are locally workable or unworkable [1].

3. Methodology

Sixteen samples of carbonaceous mudstone were collected from borehole SL located in the Wanfu exploration region of the Xian’an Coalfield in Guangxi Province, SW China (Figure 2B). The samples collected were then put in plastic bags to avoid contamination and oxidation.
The individual samples were ground to ≤0.2 mm and split into two representative portions. A portion of the sample (<0.2 mm) was directly used for proximate analysis based on the ASTM Standards D3173-11 (2011), D3174-11 (2011), and D3175-11 (2011) [17,18,19], while another portion was ground further to ≤0.076 mm (200 mesh) using an agate mortar and pestle for mineralogical and geochemical analysis. Mineralogical analyses of the sample powders were performed by powder X-ray Diffraction (XRD) using a Bruker D8 A25 Advance (Bruker D8 A25 Advance, Leipzig, Germany) at Institute of Environmental Assessment and Water Research (Barcelona, Spain). The detailed XRD analysis procedure and semi-quantitative analysis were reported in the previous study [20]. The diffractograms were obtained at a 2θ interval of 5–90°, with a step size of 0.01°.
Approximately, a 0.1 g sample was weighed and digested based on the method proposed by Querol et al. [21] for geochemical analysis. Major elements (Al, Ti, Fe, Mg, Ca, Na, K, and P) and trace elements were performed by inductively coupled plasma atomic-emission spectrometry (ICP-AES, Iris Advantage TJA Solutions, Thermo Fisher Scientific, Waltham, MA, USA) and inductively coupled plasma mass spectrometry (ICP-MS, X-Series II Thermo, Thermo Fisher Scientific, Waltham, MA, USA). Silicon content was measured by wavelength dispersive X-ray fluorescence spectrometry (XRF; ZSXPrimus II) following the methods for chemical analysis of silicate rocks (GB/T14506.28-2010).
A small portion of representative block samples was used to prepare the polished sections for the SEM-EDS analysis. The modes of occurrence of minerals were studied using field emission-scanning electron microscope (ZEISS Sigma300, Carl Zeiss AG, Jena, Germany), equipped with an energy-dispersive X-ray spectrometer (EDS) in the State Key Laboratory of Geological Processes and Mineral Resources (China).

4. Results

4.1. Coal Chemistry

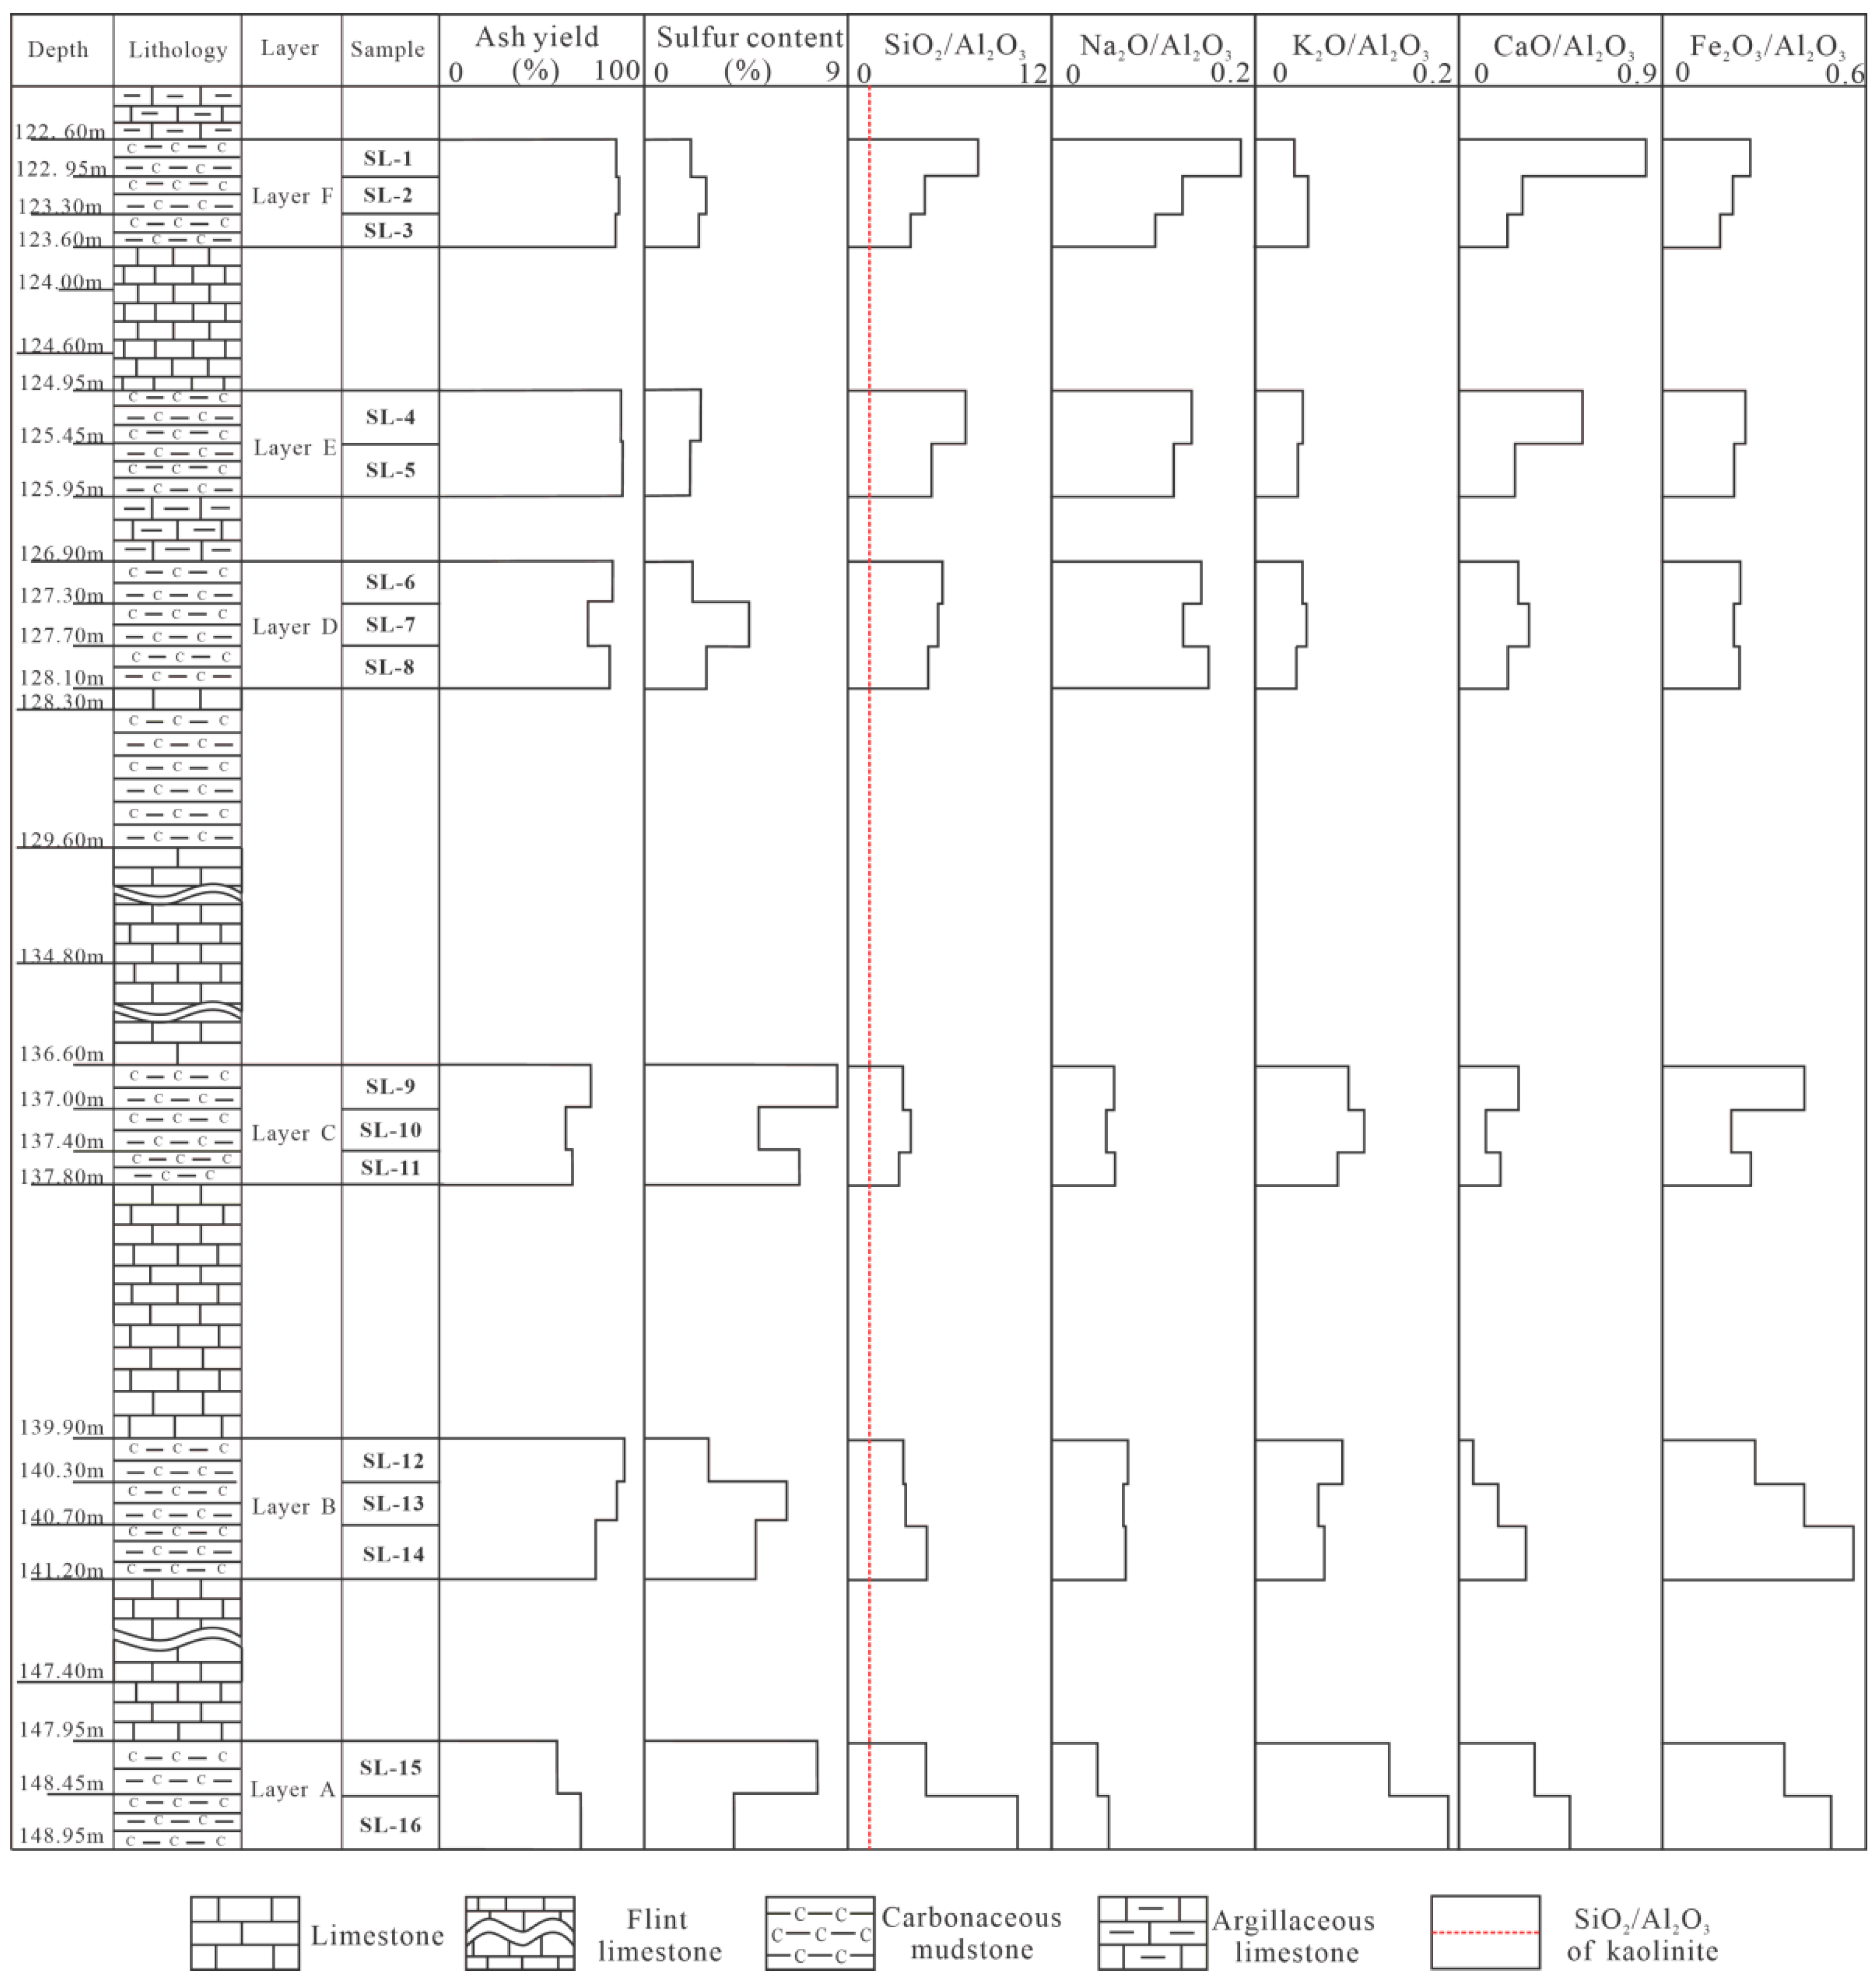
The moisture content, ash yield, volatile matter yield, and total sulfur content of the samples from borehole SL are tabulated in Table 1. The moisture content and volatile matter yield of the samples range from 0.4% to 2.1% and 8.4% to 16.3%, respectively. The samples are characterized by high ash yield, which ranges from 54.4% to 86.9% with an average of 75.8% exceeding 50%, and thus are classified as carbonaceous mudstone rather than coal according to Chinese standard (>50% ash yield indicative of noncoal rock, GB/T 15224.1-2018). However, these carbonaceous mudstones are used as high-ash coals due to relatively rare coal resources in Guangxi Province. Vertically, the ash yield is distinctly lower in layers A and C than in the other layers (Figure 3). The low-temperature ash yield (LTA) of the investigated samples is higher than the high-temperature ash yield (Table 1). The difference is partly due to dehydration of the clay minerals, oxidation of the pyrite, and/or CO2 release from the carbonate minerals during the high-temperature ashing process [3].
The total sulfur contents of the samples from borehole SL vary between 2.0% and 8.6%, with an average of 4.2%, indicating a high sulfur content for them (<1.0, 1.0–3.0, and >3.0% indicative of low, medium, and high sulfur content, respectively) [12]. The sulfur content shows a distinct variation throughout the profile and displays higher sulfur contents in layers A–C than in layers D–F (Figure 3). Layer A (5.8% on average), B (4.7%), C (6.8%), and D (3.2%) contain a high sulfur content (>3.0%) while layers E (2.2%) and F (2.4%) are characterized by medium sulfur content.

4.2. Mineralogy

4.2.1. Mineral Phases

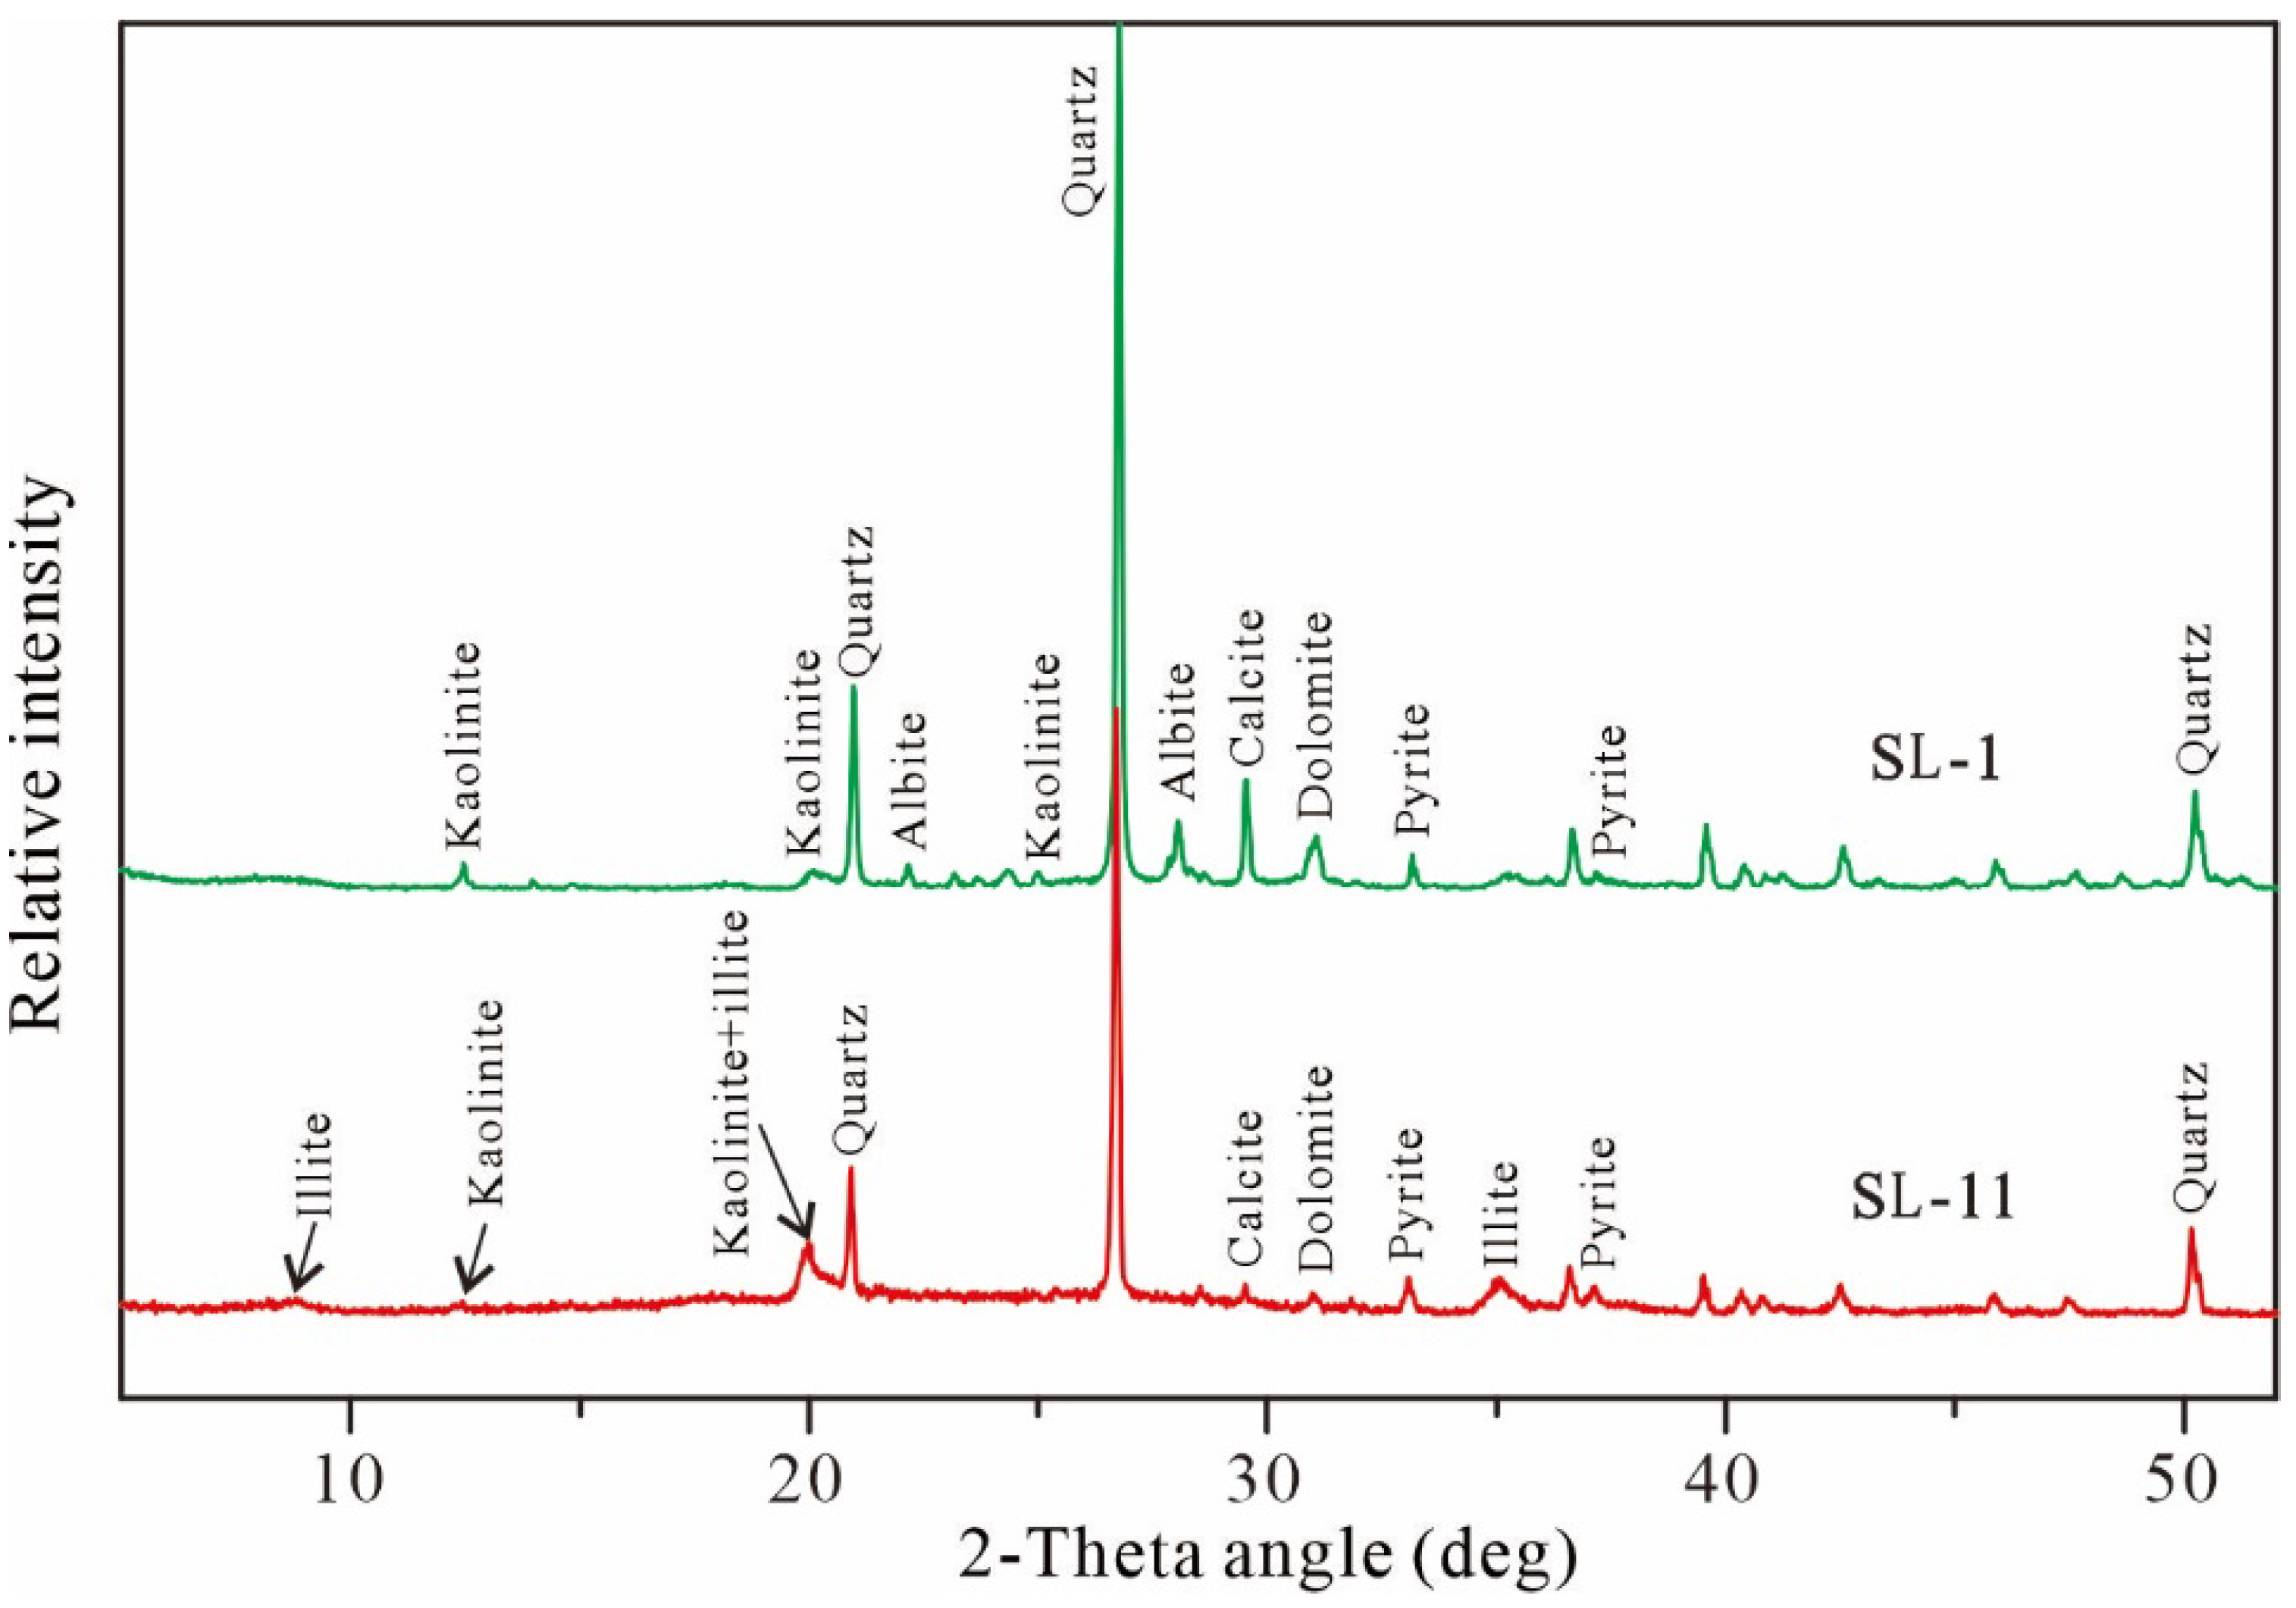
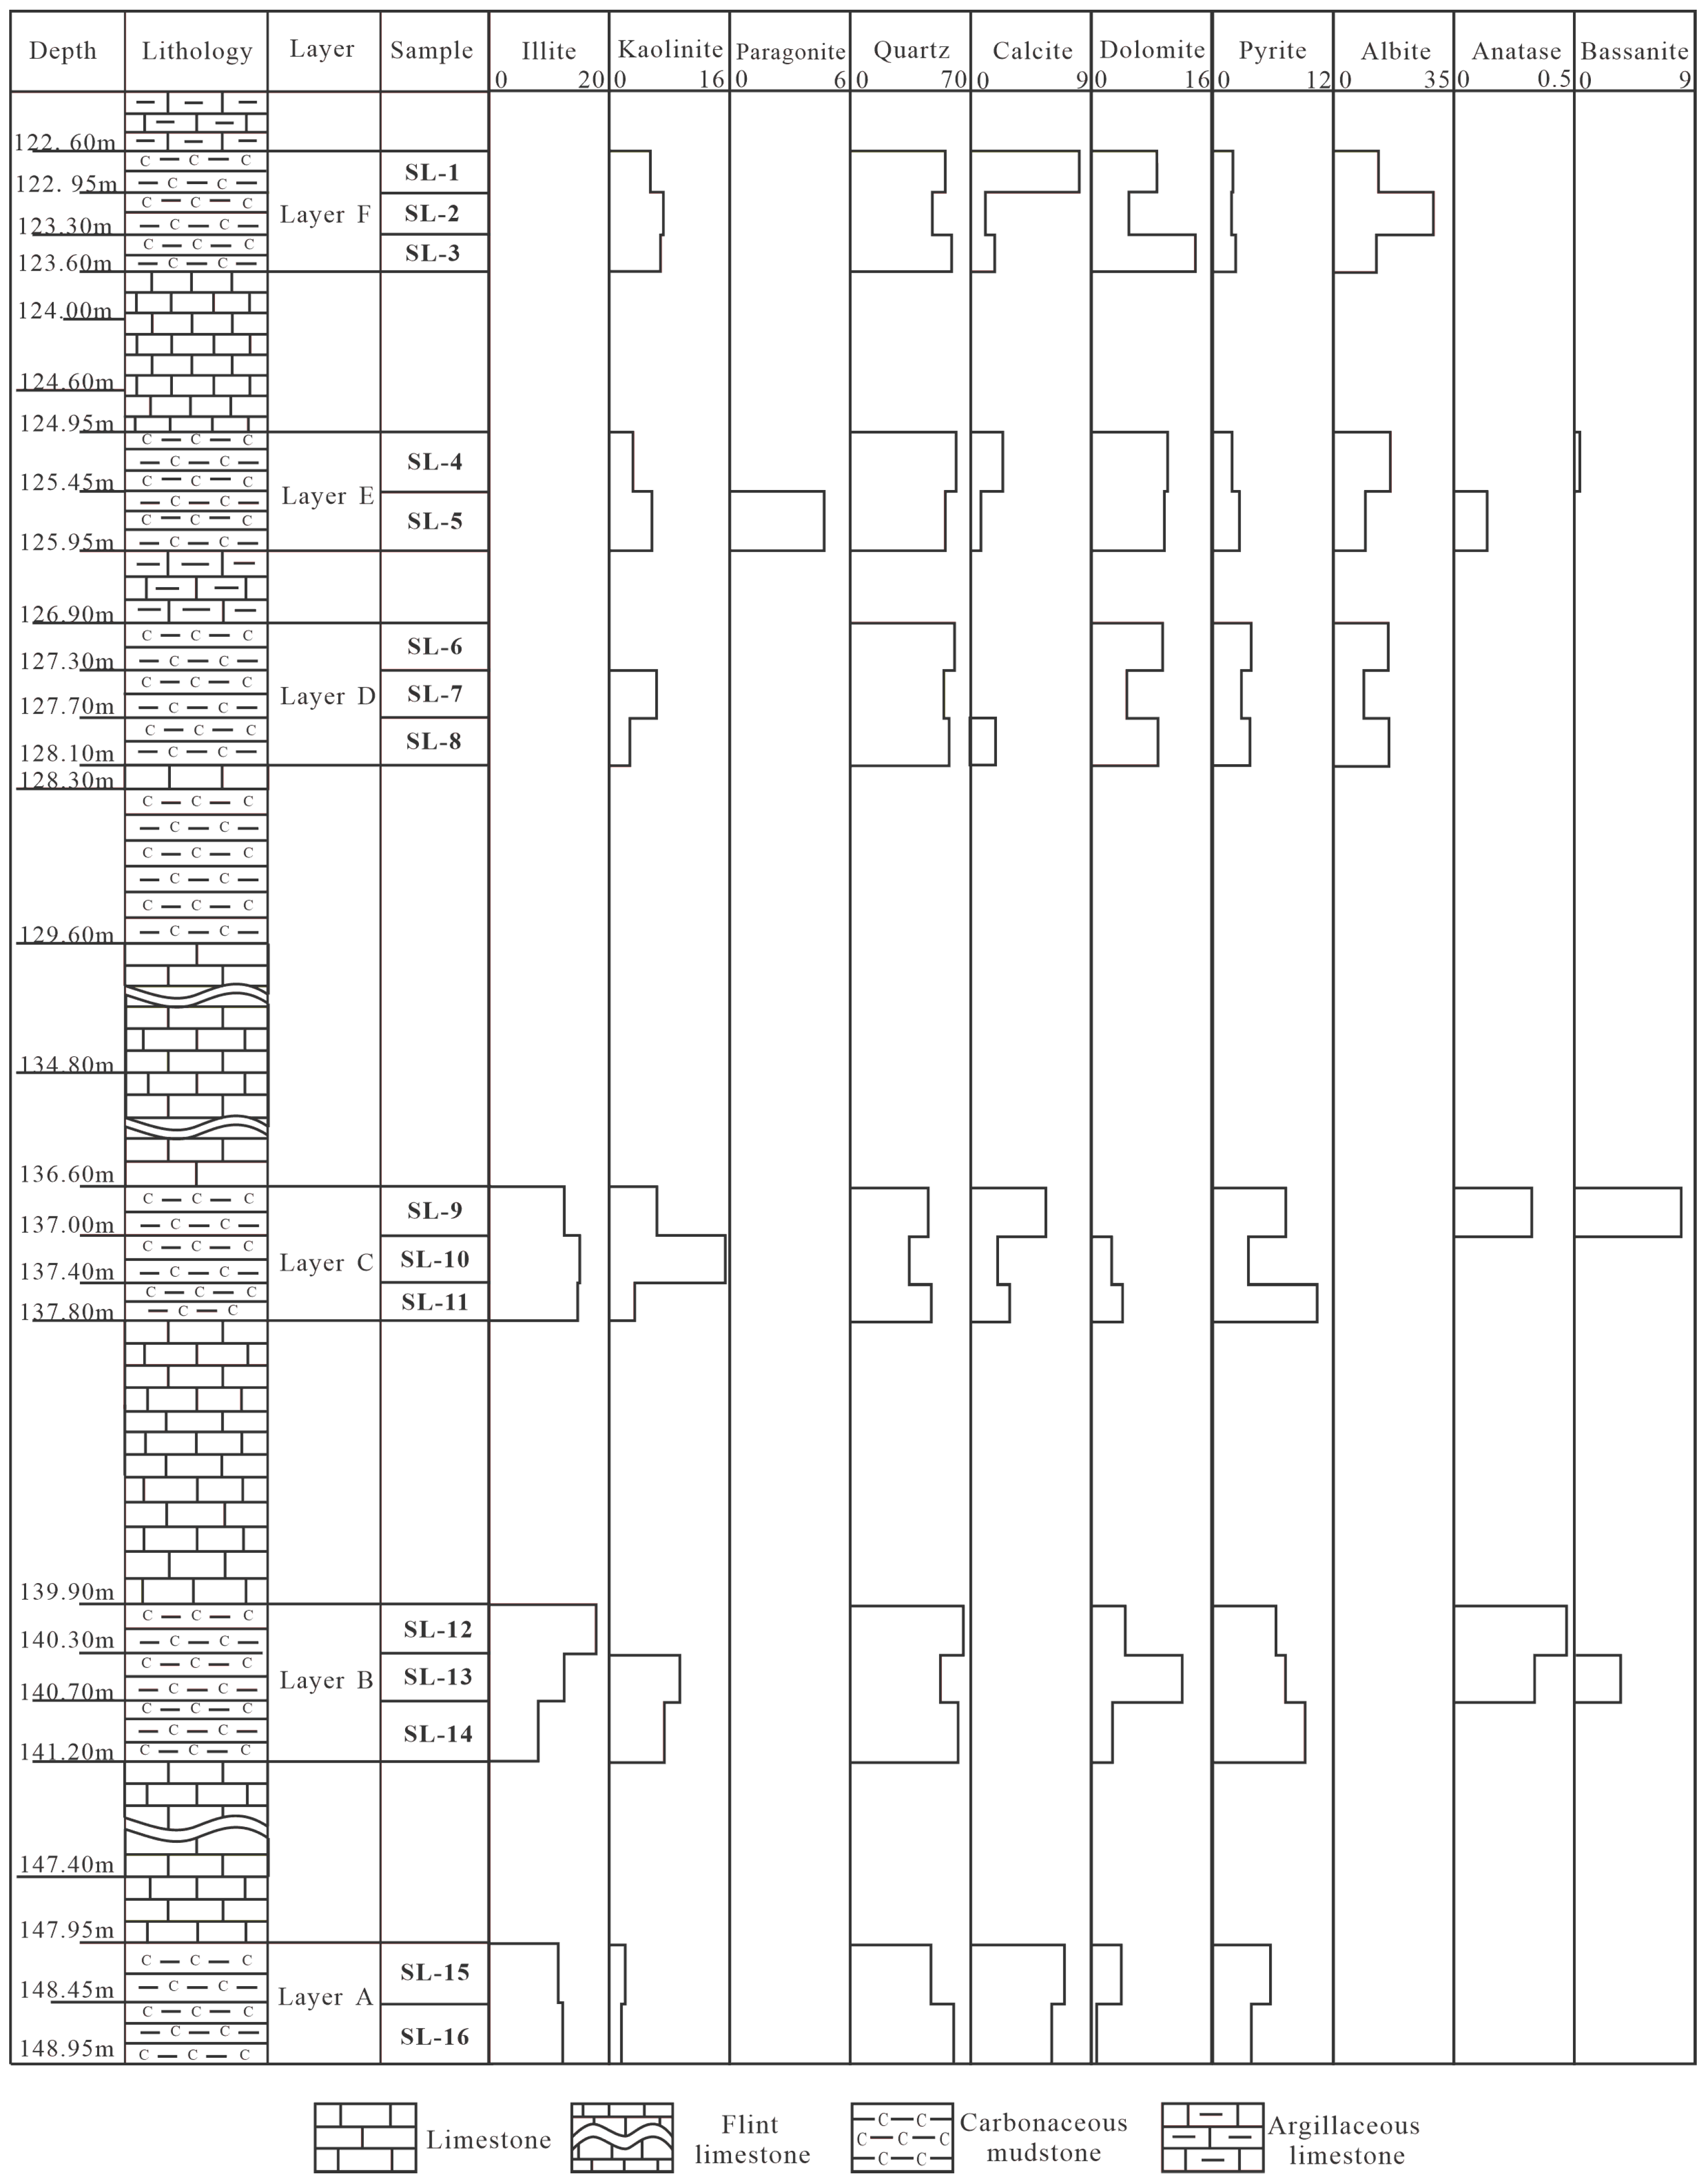
The contents of the crystalline mineral phases of the samples taken from borehole SL are tabulated in Table 2. The minerals in the investigated samples consist mainly of quartz, and to a lesser extent, illite, albite, calcite, dolomite, kaolinite, and pyrite, along with trace amounts of bassanite and anatase (Figure 4). Paragonite is only present in sample SL-5. There are two types of mineral assemblage throughout the borehole SL profile. The first mineral assemblage (pyrite-quartz-albite-kaolinite-carbonates) is only present in layers D–F (Figure 5) while the second assemblage (pyrite-quartz-illite-kaolinite-carbonates) occurs in layers A–C (Figure 5).
Illite is only distributed in layer A (11.7% on average), layer B (12.6%), and layer C (14.0%) while kaolinite universally occurs in all layers (Figure 5). Similarly, pyrite is also abundant in layers A–C relative to layers D–F. Dolomite is more abundant in layers B, D, E, and F compared to layers A and C. The distribution of calcite, however, is different from that of dolomite. Notably, albite is a major mineral constituent in layers D–F but is absent in layers A–C (Figure 5).

4.2.2. Mode of Occurrence of Minerals

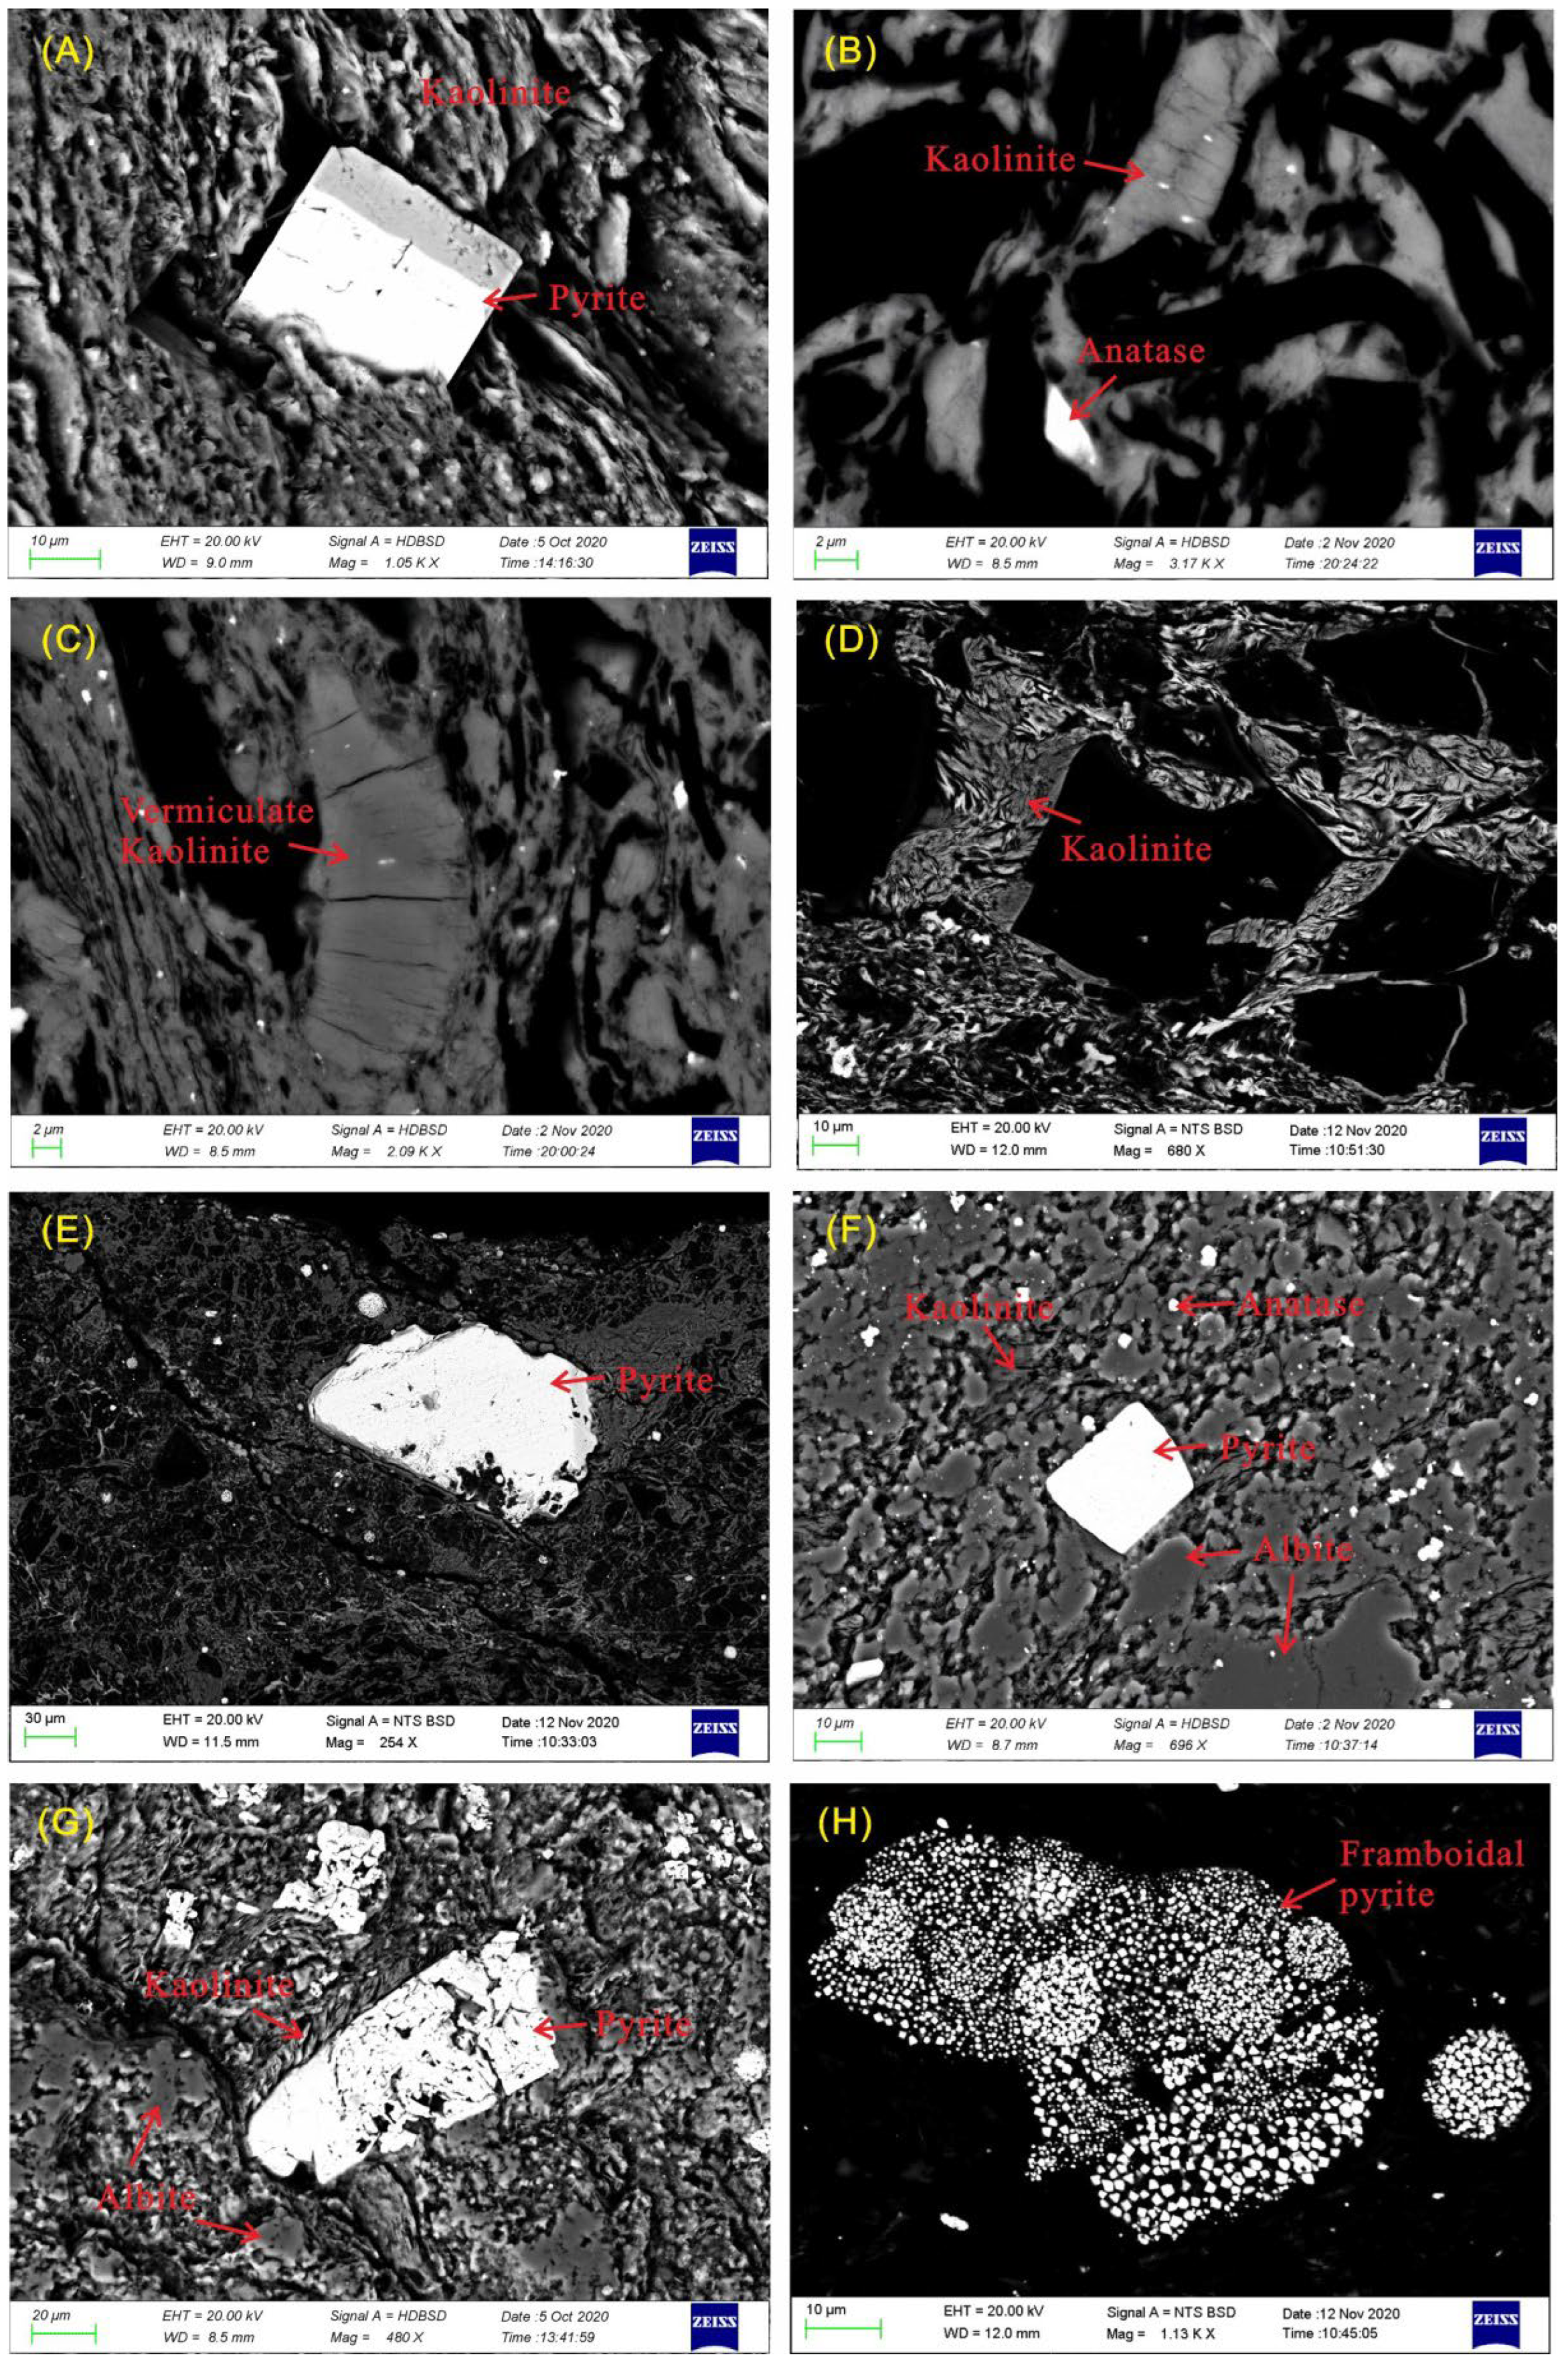
Kaolinite mainly occurs in the following forms: kaolinite matrix (Figure 6A), pore/cavity-filling kaolinite (Figure 6B), vermiculate kaolinite (Figure 6C), and fracture-filling kaolinite (Figure 6D), of which the former three forms indicate the syngenetic to early diagenetic stage while the fourth suggests epigenetic stage.
Pyrite is a primary mineral phase in samples studied. Pyrite primarily occurs as single euhedral crystals (Figure 6A) or massive forms (Figure 6E–G) embedded in the kaolinite matrix, which indicates an approximately contemporaneous early diagenetic formation. In a few cases, framboidal pyrite aggregates are also observed in the samples studied (Figure 6H).
Albite is an important mineral constituent in layers D–F. Albite predominantly occurs as disseminated particles with irregular corroded borders (Figure 6F,G), indicating the alteration of albite. In most cases, albite is surrounded by flaky kaolinite, revealing the transformation of albite to kaolinite.
Anatase is also found in some samples and primarily occurs as dispersed particles embedded within a clay minerals matrix (Figure 6F), indicating a detrital origin. In a few cases, anatase is embedded within organic matter (Figure 6B), indicating an authigenic origin.

4.3. Geochemistry

The major and trace elements contents of the samples collected from borehole SL are listed in Table 3.

4.3.1. Major Elements

The major elements in the investigated samples are predominantly composed of SiO2, and, to a lesser extent, Al2O3, with the remaining Fe2O3, CaO, MgO, Na2O, and K2O as minor or trace components. The SiO2/Al2O3 ratio (4.2–15.1, 6.6 on average) in the studied samples is evidently higher than the theoretical value of kaolinite (1.2) (Figure 3), illite (3.2), and albite (3.3), which would be explained by quartz-dominated mineral assemblage. The Na2O/Al2O3 value is obviously higher in layers D–F than in layers A–C (Figure 3), coinciding with the mineral assemblage where albite is an abundant constituent in layers D–F but is absent in layers A–C as mentioned above. The higher K2O/Al2O3 and Fe2O3/Al2O3 ratios in layers A–C than in layers D–F (Figure 3) would be ascribed to much more abundant occurrence of illite and pyrite, respectively, in layers A–C than layers D–F (Figure 5). Compared to layers A–C, layers D–F exhibit a distinctly higher CaO/Al2O3 ratio (Figure 3), which is due to the relatively abundant occurrence of carbonate minerals in layers D–F. This is also attested by the relatively significant correlation between MgO and dolomite (Figure 7A).
K2O significantly positively correlates with illite in layers A–C (Figure 7B), indicating an illite affinity of K2O. Fe2O3 and pyrite have a relatively significant linear correlation (Figure 7C), suggesting a sulfide affinity for Fe. Additionally, Fe and sulfur display a relatively significant correlation (Figure 7D); however, the slope (0.72) of the Fe–S regression equation is distinctly lower than the theoretical Fe/S ratio (0.87), appearing to indicate that other forms of sulfur (e.g., organic sulfur) contribute to the total sulfur.

4.3.2. Trace Elements

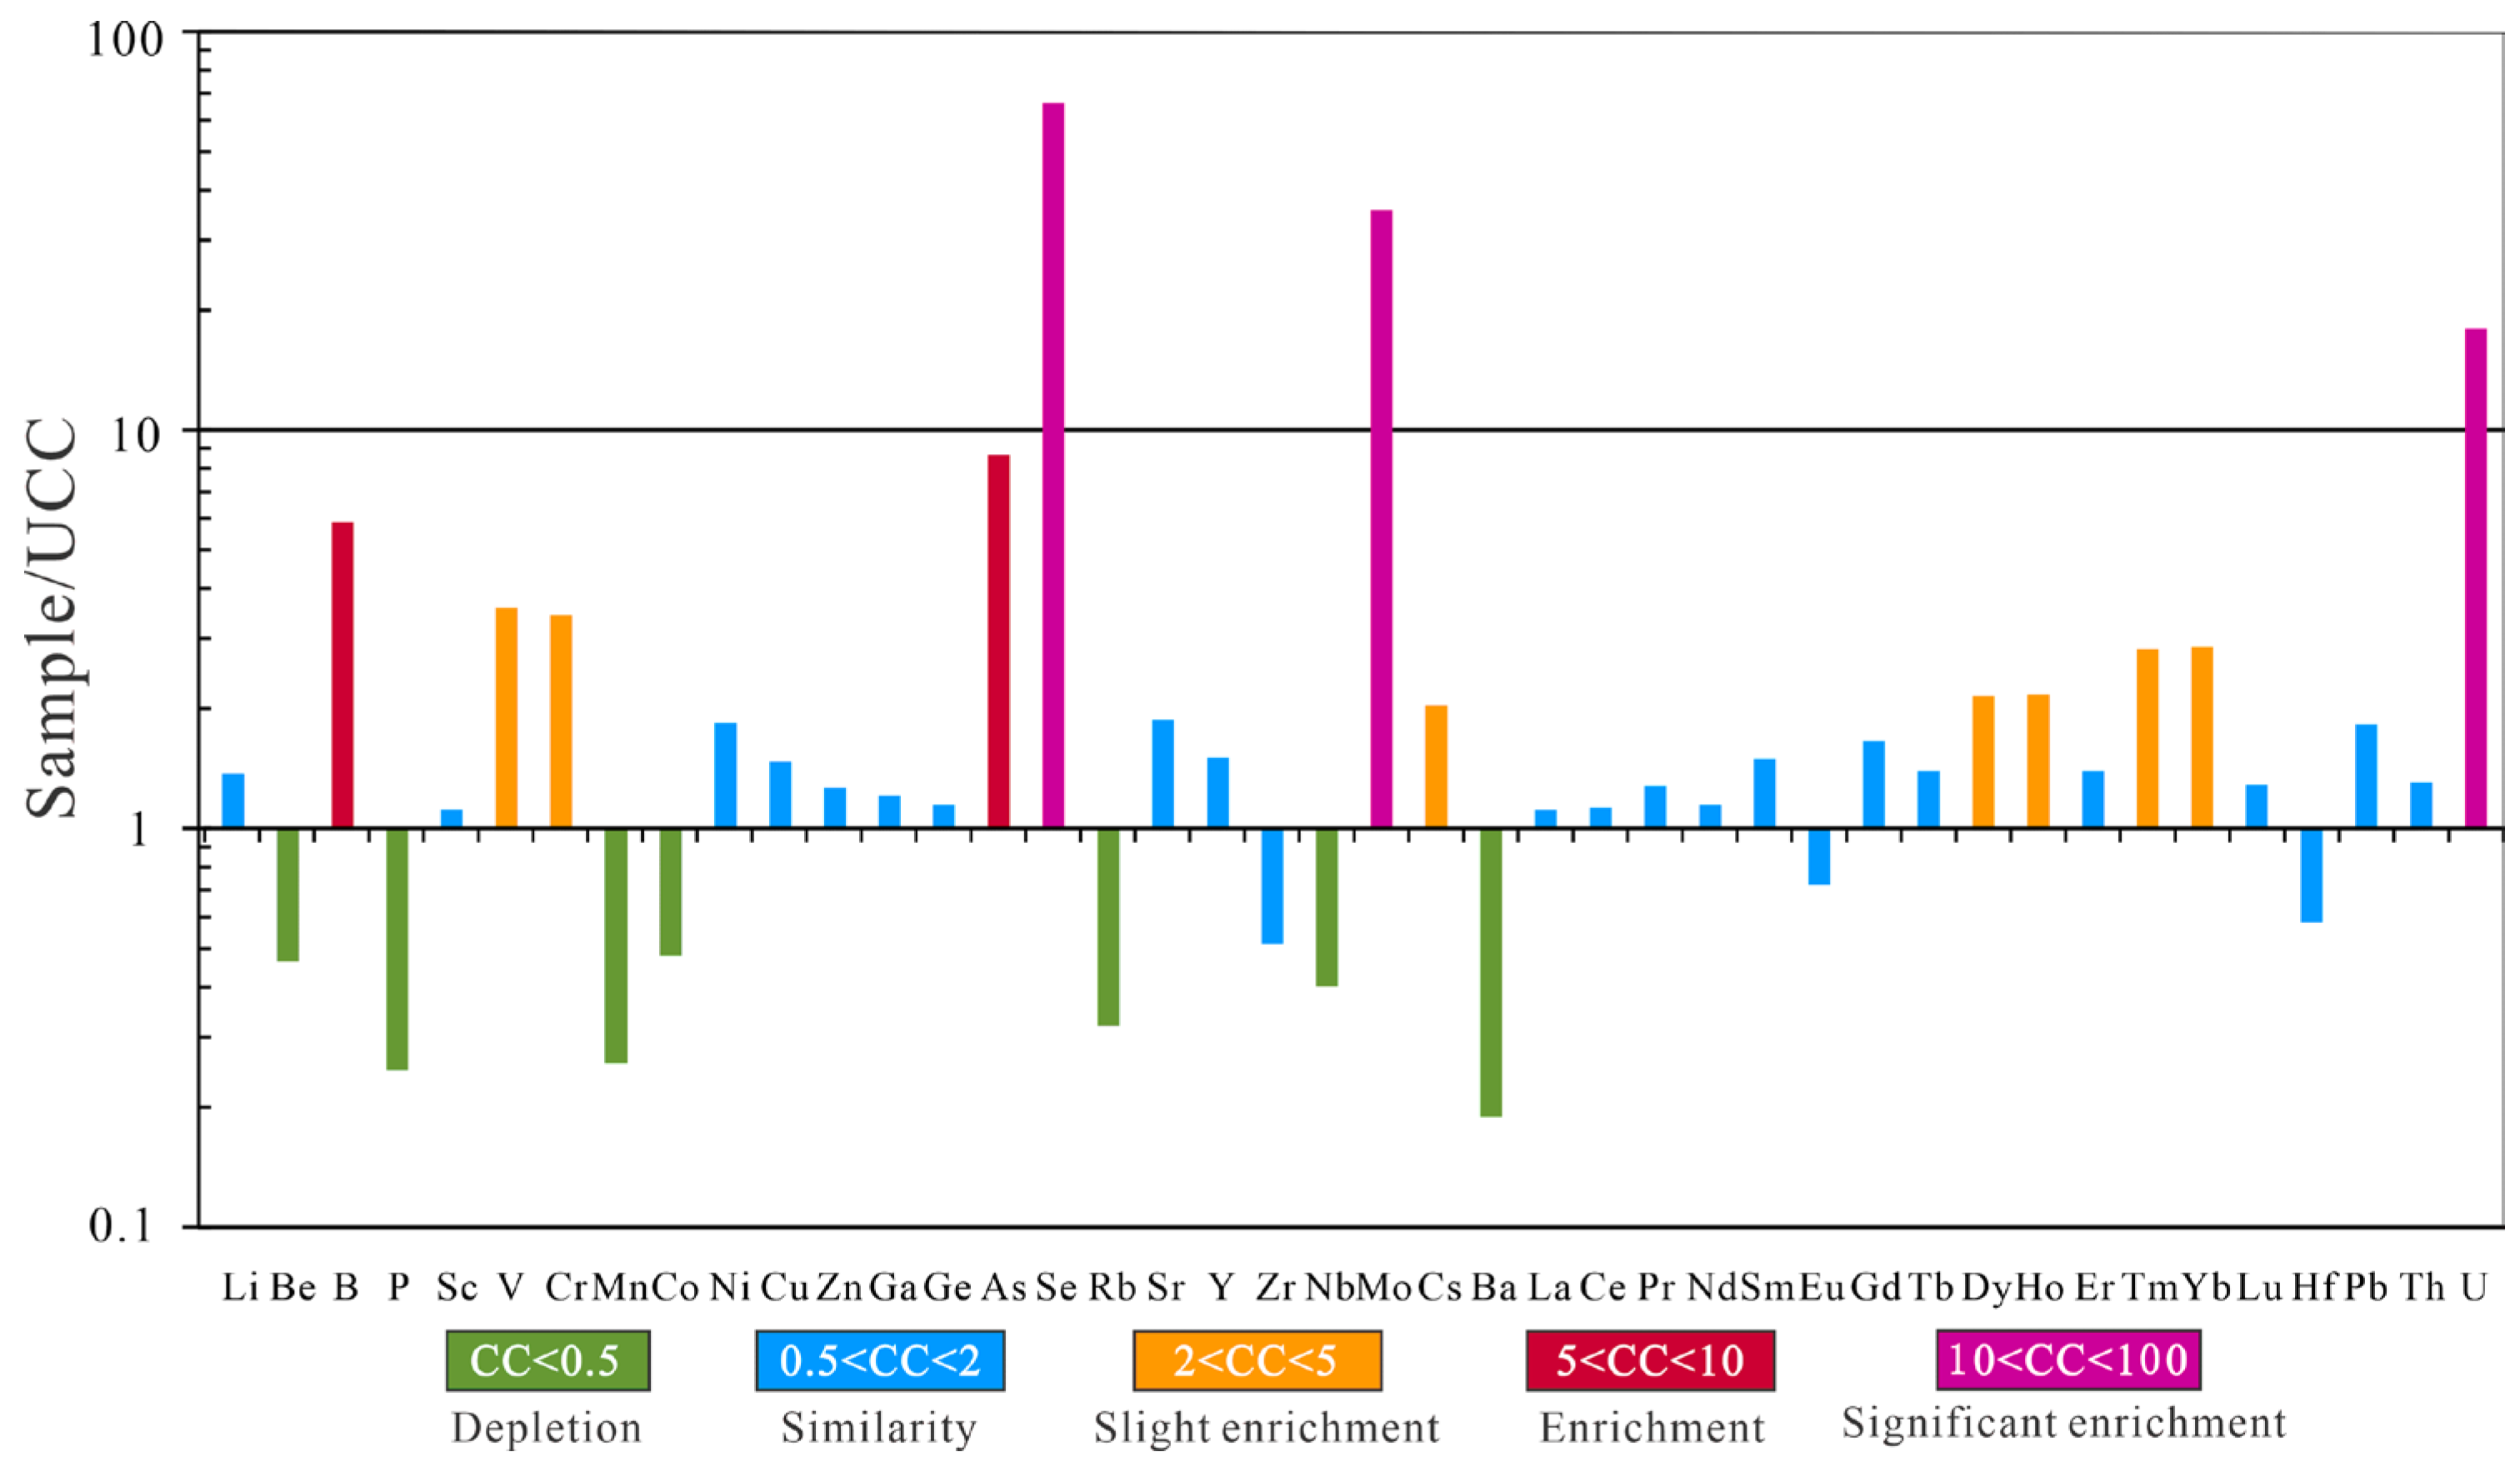
To better elucidate the degree of enrichment or depletion of trace elements in coal-bearing strata, the concentration coefficient (CC) is used in the present study; the CC is a ratio of the studied samples versus referenced rocks, such as upper continental crust composition (UCC) [22] and world coal [23], with CC < 0.5, 0.5–2, 2–5, 5–10, and >10 indicative of depletion, similarity, slight enrichment, enrichment, and significant enrichment, respectively [8]. Compared to the average of trace elements in UCC [22], Se, Mo, and U are significantly enriched in the studied samples; As and B are enriched; V, Cr, Cs, Dy, Ho, Tm, and Yb are slightly enriched; and the remaining trace elements are depletion or similar to the values of UCC (Figure 8).
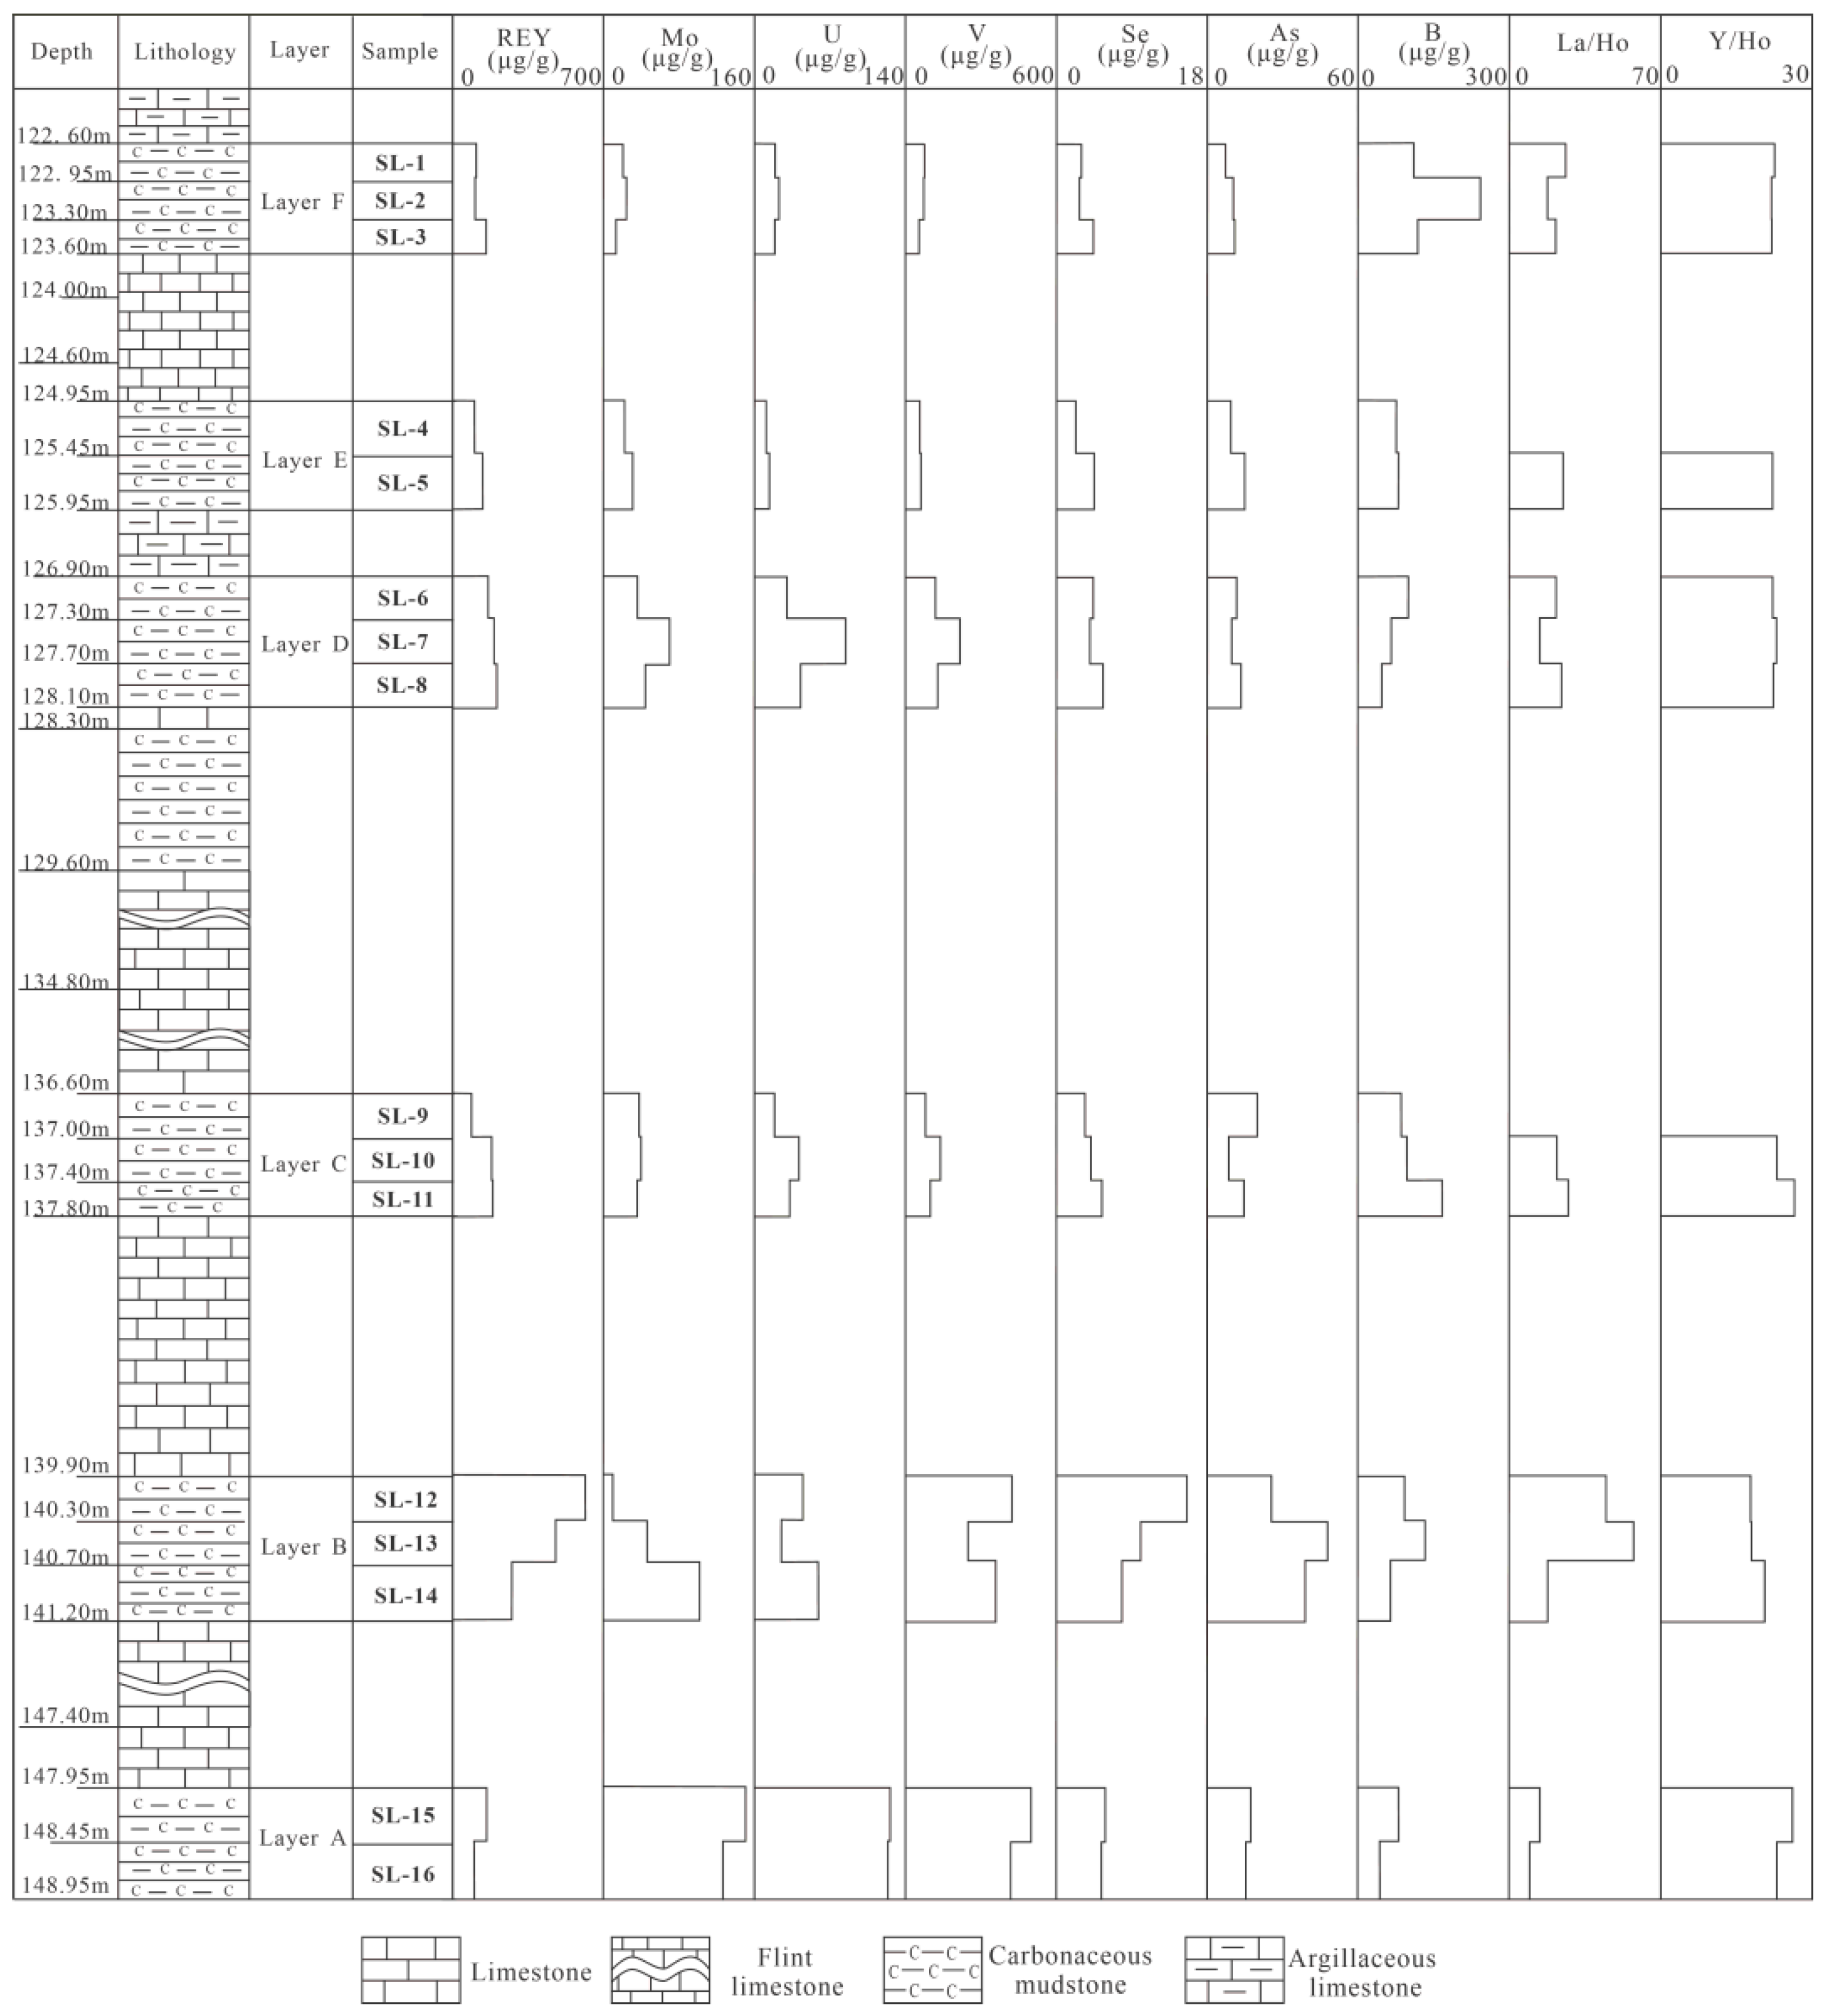
Elements U, Mo, and Se in abundance show distinct variations throughout the vertical profile (Figure 9). The significantly enriched-U intervals are distributed in layer A (CC = 41.7), layer B (13.0), layer C (12.5), and layer D (CC = 21.2); enriched-U intervals are vertically located within layer E (CC = 5.1) and layer F (CC = 8.2). Mo and Se are significantly enriched among layers A–F, but they appear to be more elevated in layers A–D relative to layers E–F. As is significantly concentrated in layers A (CC = 11.9) and B (12.0), and other layers reach the enriched or slightly enriched level. Boron in abundance is enriched in layers B (CC = 6.8), C (CC = 6.8), and F (CC = 9.1) and slightly elevated in other horizons. Elements V, Cr, Dy, Ho, Tm, and Yb contents reach the enriched or slightly enriched level within layers A, B, and D.

4.3.3. Rare Earth Element and Yttrium (REY)

The rare earth elements and yttrium (REY) contents in the investigated samples range from 92 μg/g to 625 μg/g (625 μg/g; sample SL-12) with an average of 208 μg/g, which is similar to that of UCC (168 μg/g; [22]) but higher than that of world coal (68.5 μg/g; [23]).
A three-fold REY classification, namely LREY (La, Ce, Pr, Nd, and Sm), MREY (Eu, Gd, Tb, Dy, and Y), and HREY (Ho, Er, Tm, Yb, and Lu), is used in the present study. The UCC-normalized REY distribution pattern is used in the present study to elucidate the distribution and fractionation of REY. The REY distribution pattern can be represented by three types, namely LREE distribution type (L-type), MREY distribution type (M-type), and HREY distribution type (H-type) [24]. The UCC-normalized REY distribution of the investigated samples shows two patterns of REY distribution (Figure 10). The first pattern is represented by the HREY distribution type (H-type) in the samples containing REY content similar to that of UCC (Figure 10A). The second pattern is represented by the LREY distribution type (L-type) in the samples (e.g., SL-12, SL-13) with elevated concentrations of REY (Figure 10B). Moreover, all samples are universally characterized by weakly negative Eu anomaly (0.67–0.95, 0.77 on average) and slightly negative Y anomaly (0.63–0.95, 0.80 on average) (Figure 10). Except for samples SL-12 and SL-13 showing a pronounced positive Ce anomaly and no Ce anomaly, respectively, other samples display slightly negative Ce anomaly (0.82–0.95, 0.85 on average).

5. Discussion

5.1. The Nature of Detrital Materials

Some previous studies have indicated that the Yunkai Upland located to the east of the Heshan, Yishan, Fusui, and Xian’an Coalfields (Figure 1B) is the dominant sediment source region providing felsic detrital materials into the late Permian coal-bearing basins in Guangxi Province, China [5,6]. However, a few studies have demonstrated that some detrital materials within the late Permian coal-bearing strata in Guangxi Province are probably derived from the basaltic materials from the Kangdian Upland [25], the eroded materials from the felsic igneous rocks at the top of the Kangdian Upland [26,27]. The investigated samples are most likely derived from the eroded felsic detrital materials from the Yunkai Upland based on the following evidence:
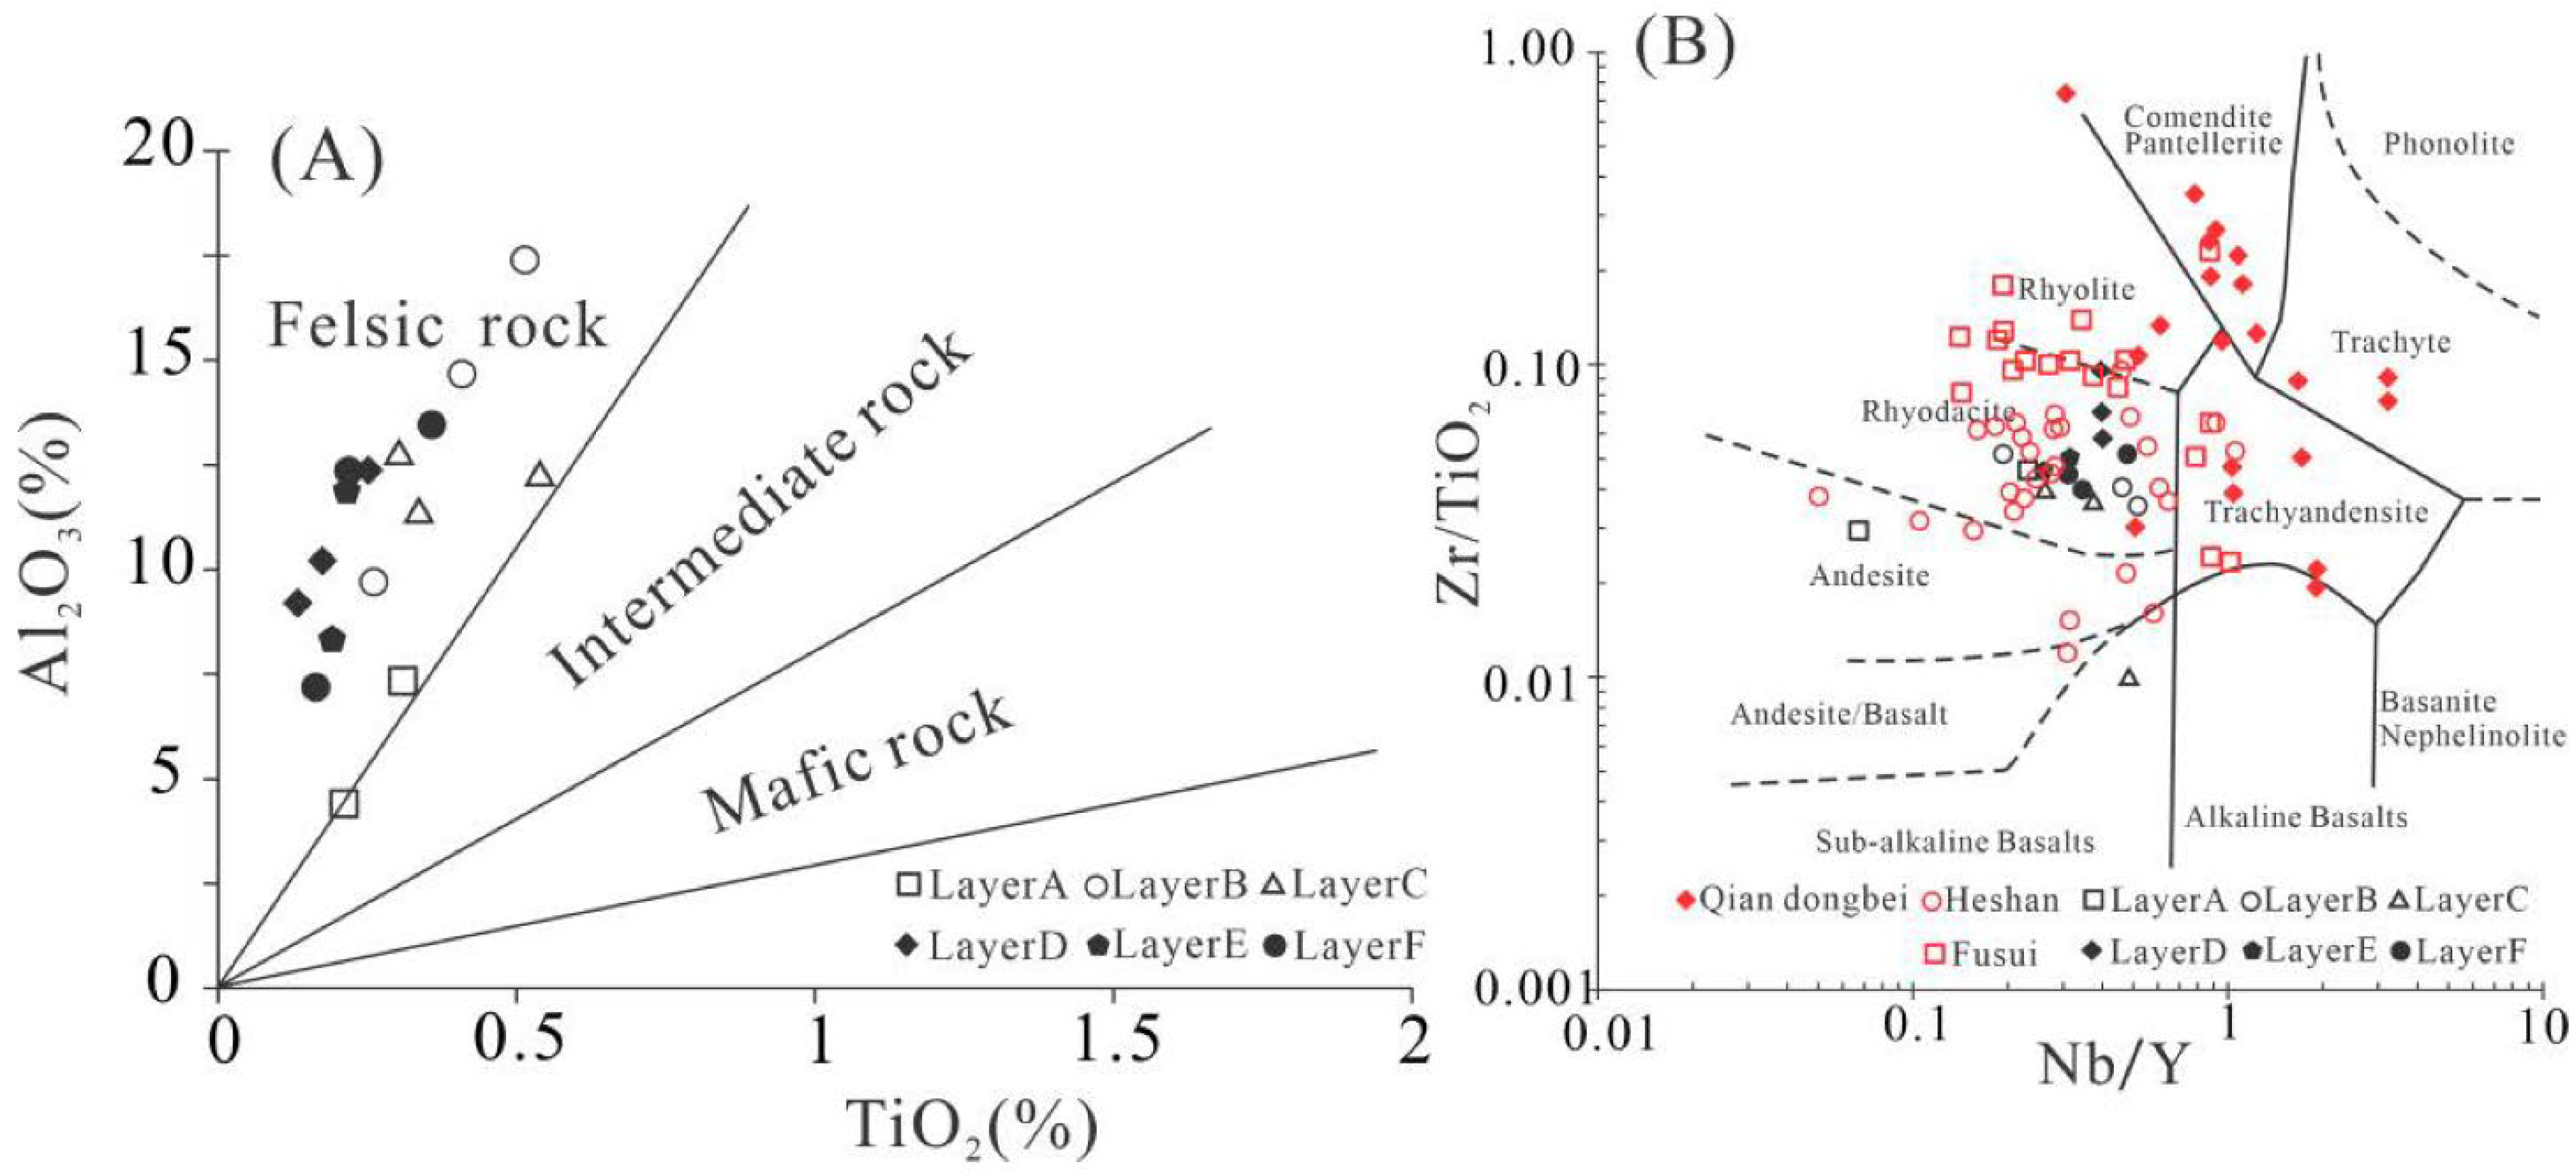
(1) The Al2O3/TiO2 ratio has been extensively used to infer the parent rock composition of mudstones [28] and coals [20,29,30,31], with 3–8, 8–21, and 21–70 indicative of mafic, intermediate, and felsic igneous rocks, respectively [28]. The plot of Al2O3 versus TiO2 shows that the samples studied all fall within the category of felsic rocks (Figure 11A), indicating the input of felsic detrital materials. However, the samples from layers A–C display distinctly low Al2O3/TiO2 (20.6–41.7, 30.9) compared to those from layers D–F (37.7–67.7, 50.6 on average), appearing to indicate that the detrital materials in layers A–C are possibly derived from a mixture of much more felsic constituents and much less mafic materials.
(2) The Eu anomaly is also commonly used in monitoring parent rocks. In most cases, the coals with the input of mafic detrital materials display a positive Eu anomaly while the coals with the input of felsic detrital materials are characterized by a negative Eu anomaly [32]. The samples studied display negative Eu anomalies ranging from 0.67 to 0.95 with an average of 0.77, suggesting the input of felsic components. The Eu anomaly and Al2O3/TiO2 ratio in the samples studied appear to exclude the basaltic detrital materials from the Kangdian Upland as the predominant terrigenous sediment region.
(3) In the plot of Nb/Y versus Zr/TiO2 (Figure 11B), the samples studied fall within the field of rhyodacite-dacite, comparable to the late Permian Heshan, Fusui coals in Guangxi Province, China [3,5], indicating that the investigated samples have the same source region to the late Permian coals in Guangxi Province. Moreover, the studied samples differ from the felsic igneous rocks from the Kangdian Upland, which cluster within the field of alkaline rocks [31] (Figure 11B), appearing to exclude the possibility that the felsic constituents are sourced from the felsic rocks at the top of Kangdian Upland.
(4) The UCC-normalized REY distribution patterns in the investigated samples are very similar to that of Heshan coals with terrigenous materials from the Yunkai Upland [3,5] but distinctly differ from that of felsic igneous rocks from the Kangdian Upland [31], further confirming the input of felsic detrital materials from the Yunkai Upland.
(5) The samples studied are primarily composed of quartz, albite, clay minerals, and carbonate minerals. This mineral assemblage would correspond well to the Heshan and Fusui coals with a felsic detritus from the Yunkai Upland [3,5].

5.2. Influence of Seawater Invasion

The coal-bearing layers A–F studied are intercalated within the carbonate successions (Figure 2B), indicating a significant marine invasion during or shortly after coal-bearing deposition. The seawater invasion is also confirmed by geochemical indicators, such as sulfur content, boron content, and Sr/Ba ratio. The previous studies show that the medium- and high-sulfur coals are formed in marine-influenced environments, while the low-sulfur coals are deposited in freshwater-influenced environments [12,33]. The sulfur content in the investigated samples ranges from 2.1 to 8.6% with an average of 4.2% (high-S coal), indicating a significant seawater influence. The boron content in layers A–F range from 45 to 241 μg/g with an average of 100 μg/g, suggesting mildly brackish water-influenced coal-forming environments (B concentrations <50, 50–110, and >110 μg/g indicative of freshwater, mildly brackish water, and brackish water, respectively [34]). The Sr/Ba ratio is considered a useful index of depositional environments with Sr/Ba > 1 and Sr/Ba < 1 indicative of marine-influenced environments and freshwater-influenced environments, respectively [33]. In the present study, the Sr/Ba ratio in layers A–F ranges from 2.6 to 10.6 with an average of 5.9 evidently exceeding 1.0, revealing seawater-dominated-influenced environments, which is consistent with the sedimentary setting of an isolated carbonate platform.
Layers A–C exhibit higher sulfur content (2.8–8.6%, 5.8% on average), Sr/Ba ratio (5.5–10.6, 8.3) than sulfur content (2.1–4.6%, 2.6%), and Sr/Ba ratio (2.4–5.9, 3.5) in layers D–F, indicating a more intensive marine injection during the deposition of layers A–C than layers D–F. The various degrees of marine injection result in different geochemical patterns. For example, layers A–C display higher contents of illite, pyrite, Co, Ni, As, and Se than in layers D–F. This is because Co, Ni, As, and Se are primarily associated with pyrite and the formation of pyrite is intimately associated with the degree of seawater injection [12]. Higher illite abundance in layers A–C is ascribed to the marine-influenced environments because illite is preferentially deposited in brackish-influenced alkali conditions [30,35]. Although the REY content (264 μg/g on average) in layers A–C is higher than that (152 μg/g on average) in layers D–F, seawater is not the primary geological control on REY distribution in layers A–F; otherwise, the pronounced positive Y and Gd anomalies would be expected in layers A–F [36,37,38], which is in sharp contrast to results shown in Figure 10. Additionally, the Y/Ho molar ratio in the samples ranges from 32.0 to 48.6 with an average of 41.0, which is essentially identical to that in UCC (51.0) but lower than that reported in seawater (90–110; [36]), further indicating a negligible influence of seawater control on the REY content in the investigated samples.

5.3. Mode of Occurrence of Elements

Zirconium and Hf are commonly hosted in zircon [31]. The Zr and Hf in the samples studied show a significant positive correlation (r = 0.95, Figure 12A), indicating that Zr and Hf are hosted in the same mineral carrier and do not evidently fractionate during the formation of coal-bearing strata. The slope of the Zr-Hf regression equation (34.6) is very comparable to that of zircon in granite (38.5, [39]), revealing zircon as the major carrier of Zr and Hf.
The REY contents in the samples from layers C–F display a negative correlation with LTA (r = −0.52, Figure 12B), positive correlation with Zr (r = 0.74, Figure 12C), and slight correlation with Al2O3 (r = 0.26) and P (r = 0.14), appearing to indicate that REY is jointly hosted by organic matter and heavy minerals, such as zircon. In most cases, the MREY and HREY are preferentially adsorbed to organic matter, thus leading to the H-type REY distribution patterns in layers C–F (Figure 10A). Additionally, the negative correlation between low-temperature ash yield and (MREY + HREY)/REY (r = −0.52; Figure 12D) indicates that the MREY and HREY comprise more proportions of total REY with increasing organic matter. By contrast, the REY content in the samples from layers A–B is positively correlated with LTA (r = 0.86, Figure 12B), Al2O3 (r = 0.99, Figure 12E), and Zr (r = 0.86, Figure 12C), suggesting that REY is predominantly hosted by inorganic matters (e.g., clay minerals, zircon) rather than organic matter. Although the REY in layers A–F shows a relatively significant correlation with Zr, zircon is not the major carrier for REY because the UCC-normalized REY distribution of the samples studied (Figure 10) is not consistent with the REY distribution of zircon (HREY enrichment type, positive Ce anomaly, negative Eu anomaly, and positive Y anomaly [40]). The REY-rich samples SL-12 and SL-13 from layer B display a higher La/Ho ratio compared to other benches (Figure 9), probably indicating precipitation of LREY-enriched mineral phases, such as monazite, which preferentially incorporate the LREE but do not fractionate Y and Ho (a rather constant Y/Ho ratio) as reported by Bau and Dulski [36] and Chesley et al. [41]. Additionally, the L-type REY distribution (Figure 10B) and relatively high P and Th content in the REY-rich samples SL-12 and SL-13 appear to indicate the occurrence of phosphate minerals, such as monazite.
Mo, U, and V show a similar distribution throughout the borehole profile (Figure 9) and display a positive correlation between Mo and U (r = 0.91, Figure 12F), U and V (r = 0.82, Figure 12G), and Mo and V (r = 0.75, Figure 12H), indicating the same carrier for them or similar geological controls on their enrichment. Mo and U negatively correlate with LTA (Figure 12I) in all samples; in layers A–B and D–F, Mo, U, and V significantly and negatively correlate with LTA (Figure 12J–L), appearing to confirm that Mo, U, and V are predominantly hosted by organic matter, which is consistent with the previous studies indicating that Mo, U, and V in the coals intercalated within carbonate succession commonly show an organic affinity [24,28].
The distribution of As is comparable to that of Se, and they display a relatively significant correlation (r = 0.66, Figure 12M), indicating the same carrier for As and Se. The As and Se positively correlate with Fe2O3 (Figure 12N) and sulfur (Figure 12O), suggesting a primary Fe-sulfide affinity for them. The lower correlation coefficient of As–S and Se–S than As–Fe2O3 and Se–Fe2O3 is ascribed to the additional existence of organic sulfur.

5.4. Elevated Concentrations of Trace Elements

5.4.1. Rare Earth Elements and Yttrium (REY)

The REY content in layer B ranges from 278 to 619 μg/g with an average of 460 μg/g higher than the UCC (168 μg/g; [22]). The highly elevated concentration of REY in layer B is a joint result of the input of alkaline detrital materials and solution/rock interaction based on the following evidence:
(1) As mentioned above, the Yunkai Upland provides felsic detrital materials into the late Permian coal-bearing basin, which do not cause the geochemical anomaly of most lithophile elements in the samples except for those from layer B, appearing to indicate that the terrigenous felsic detrital materials from the Yunkai Upland contribute to normal geochemical background values and other geological factors possibly exert an important influence on REY enrichment in layer B.
(2) The REY-rich samples SL-12 and SL-13 in layer B have higher Nb/Y ratios compared to other bench samples (Figure 11B), appearing to indicate more input of alkaline detrital materials because alkaline rocks compared to sub-alkaline rocks have higher Nb/Y ratio [42]. Moreover, the elevated REY content in layer B is accompanied by elevated concentrations of Zr, Nb, and Ga, which are commonly found in the coals influenced by alkaline volcanic ash [13,24,31], also supporting the input of alkaline pyroclastic materials.
(3) The REY-rich samples SL-12 and SL-13 in layer B are characterized by L-type REY distribution (Figure 10B), which is commonly caused by the input of terrigenous clastic materials or pyroclastic materials [24]. As discussed above, terrigenous felsic detrital input is excluded as a predominant geological factor contributing to the REY enrichment, appearing to indicate that the pyroclastic material is responsible for the L-type REY distribution.
(4) The abundant occurrence of albite and vermicular kaolinite (Figure 6C,F,G), combined with the negative Eu anomaly, appears to indicate the influx of felsic pyroclastic materials because vermiculate kaolinite is commonly derived from the alteration of volcanic ash [43].
(5) The bench sample (sample SL-12) with the highest REY content shows a most notable feature of positive Ce anomaly compared to any of the other benches, revealing that the bench sample is subjected to the oxidation of oxygen-rich solutions, which oxidizes Ce3+ to Ce4+ that is preferentially adsorbed to clay minerals or deposits as cerianite [44]. In this case, the positive Ce anomaly is most likely caused by preferential adsorption of Ce4+ onto clay minerals rather than deposition of cerianite because Ce/La (3.2), Ce/Pr (13.2), and Ce/Nd (3.6) ratio in the bench sample SL-12 is markedly lower than Ce/La (222), Ce/Pr (257), and Ce/Nd (177) in cerianite [45]. The transformation from positive Ce anomaly, no Ce anomaly, to negative Ce anomaly in the upper, middle, and lower portions of layer B, respectively, are due to preferential adsorption of Ce4+ onto clay minerals in the upper portion of layer B and, consequently, Ce-poor solutions migrate downward into the lower portion. The lower Y/Ho ratio in the REY-rich benches (17.6) compared to other REY-poor benches (22.9) also confirms the solutions/rocks interaction during which Y and Ho are released, but Ho, relative to Y, is more readily adsorbed by clay minerals [36], causing a relatively low Y/Ho ratio in the REY-rich benches. During the interaction of solution/rock, the HREY are easily released and complexed relative to LREY; the released HREY ions migrate downward and are ultimately absorbed by clay minerals with the increasing pH due to reaction between HREY-containing solutions with detrital materials, which explains the L-type REY distribution in the upper portion and H-type REY distribution in the lower portion of layer B (Figure 10).
(6) Albite is relatively high in layers D–F, but it is absent in layers A–C, indicating more intensive chemical weathering or solution/rock reaction in layers A–C, which results in the transformation of albite to clay minerals.

5.4.2. Uranium, Mo, V, As, and Se

Uranium, Mo, and V are highly enriched in layer A and layer B and their contents are comparable to the U–Mo–V-rich coals intercalated within carbonate successions [3,5,8,46]. The highly elevated U content is commonly accompanied by Mo and V in the Heshan coals [1,2,3], Fusui coals [5], Yishan coals [13] (anomaly), and Shanglin coals [6], which were deposited in isolated carbonate platform environments. In the previous study, the highly enriched concentrations of U, Mo, and V are primarily governed by the infiltration of syngenetic or early diagenetic low-temperature hydrothermal fluids rather than the detrital materials from the sediment-source region and marine influence as confirmed by the following evidence:
(1) The felsic detrital materials can be excluded because the felsic rocks are usually depleted in compatible elements, such as V and Cr, which are enriched in the investigated samples (Figure 8).
(2) The previous studies demonstrate that seawater influence may exert an important effect on U and Mo enrichment [47]. In the present study, this is not the case because U (r = −0.67), Mo (r = −0.26), and V (r = −0.86) display a negative correlation with Sr/Ba ratio, which is a useful indicator of seawater invasion [3]. The negative correlation reveals an adverse influence of marine invasion on U, Mo, and V accumulation.
(3) The enhanced concentration of element assemblage of U–Mo–V–As–Se in the samples studied is essentially comparable to that in the coals subjected to the influence of hydrothermal fluids [3], revealing the infiltration of hydrothermal fluids. Moreover, the hydrothermal fluids infiltrating into the investigated samples are regarded as being low-temperature hydrothermal fluids because the high-U and low-U samples show similar negative Eu and Y anomaly, appearing to rule out the injection of high-temperature solutions; otherwise, the positive Eu and Y anomaly can be expected [44]. Furthermore, the low-temperature hydrothermal fluids most likely migrate and permeate into the coal-bearing strata during peat accumulation (syngenetic stage) or shortly after peat accumulation (early diagenetic stage) because the U-rich layers are intercalated among the impermeable clays and limestones, which hamper the infiltration of hydrothermal fluids at the late diagenetic stage.

6. Conclusions

Based on the study of the mineralogy and geochemical characteristics of samples in the studied area, the following conclusions can be drawn:
(1) The minerals in layers A–C consist mainly of quartz, illite, kaolinite, and carbonate phases while those in layers D–F are predominantly composed by quartz, albite, kaolinite, and carbonate phases.
(2) The REY, U, Mo, As, Se, and V are predominantly enriched in layers A and B. The REY is hosted primarily by clay minerals, and U, Mo, and V are primarily associated with organic matter while As and Se show an Fe-sulfide affinity.
(3) The more extensive marine invasion results in the higher contents of pyrite, sulfur, As, Se, Co, and Ni in layers A–C than layers D–F; the input of alkaline pyroclastic materials and the interaction of O2-rich solutions and detrital materials jointly govern the REY enrichment and distribution pattern; the influx of low-temperature hydrothermal fluids at the syngenetic or early diagenetic stage is the predominant source of U, Mo, As, Se, and V in layers A–B. The elements U, Mo, V, Se, and REY are highly promising for recovery.

Author Contributions

B.L. (Bo Li), B.L. (Baoqing Li), X.Z., F.Z., X.Q., Y.S. and J.L. collected the samples; X.Q. and N.M. conducted the experiments; B.L. (Bo Li) wrote the original draft; B.L. (Baoqing Li) revised and edited the manuscript. All authors have read and agreed to the published version of the manuscript.

Funding

This research was funded by the National Key Research and Development Program of China (No. 2021YFC2902005), National Science Foundation of China (No. 41972182), the National Science Foundation of Guangxi Province (No. 2018JJA150165), and Science Program of China National Administration of Coal Geology (no. ZMKJ-2021-ZX03).

Acknowledgments

The authors would like to give their sincere thanks to Guangxi Bureau of Coal Geology for assistance during sampling and Institute of Environmental Assessment and Water Research, CSIC, Spain, for assistance during the sample analysis.

Conflicts of Interest

The authors declare no conflict of interest.

References

  1. Shao, L.Y.; Jones, T.; Gayer, R.; Dai, S.F.; Li, S.S.; Jiang, Y.F.; Zhang, P.F. Petrology and geochemistry of the high-sulphur coals from the Upper Permian carbonate coal measures in the Heshan Coalfield, southern China. Int. J. Coal Geol. 2003, 55, 1–26. [Google Scholar] [CrossRef] [Green Version]
  2. Zeng, R.S.; Zhuang, X.G.; Koukouzas, N.; Xu, W.D. Characterization of trace elements in sulphur-rich Late Permian coals in the Heshan coal field, Guangxi, South China. Int. J. Coal Geol. 2005, 61, 87–95. [Google Scholar] [CrossRef]
  3. Dai, S.F.; Zhang, W.G.; Seredin, V.V.; Ward, C.R.; Hower, J.C.; Song, W.J.; Wang, X.B.; Li, X.; Zhao, L.X.; Kang, H.; et al. Factors controlling geochemical and mineralogical compositions of coals preserved within marine carbonate successions: A case study from the Heshan Coalfield, southern China. Int. J. Coal Geol. 2013, 109, 77–100. [Google Scholar] [CrossRef]
  4. Zhao, Y.Y.; Liang, H.Z.; Zeng, F.G.; Tang, Y.G.; Liang, L.T.; Takahashi, F. Origins and occurrences of Ti-nanominerals in a superhigh-organic-sulfur coal. Fuel 2020, 259, 116302. [Google Scholar] [CrossRef]
  5. Dai, S.F.; Zhang, W.G.; Ward, C.R.; Seredin, V.V.; Hower, J.C.; Li, X.; Song, W.J.; Wang, X.B.; Kang, H.; Zheng, L.C.; et al. Mineralogical and geochemical anomalies of late Permian coals from the Fusui Coalfield, Guangxi Province, southern China: Influences of terrigenous materials and hydrothermal fluids. Int. J. Coal Geol. 2013, 105, 60–84. [Google Scholar] [CrossRef]
  6. Zhang, F.Q.; Li, B.Q.; Zhuang, X.G.; Xavier, Q.; Natalia, M.; Shangguan, Y.F.; Zhou, J.M.; Liao, J.L. Geological Controls on Enrichment of Rare Earth Elements and Yttrium (REY) in Late Permian Coals and Non-Coal Rocks in the Xian’an Coalfield, Guangxi Province. Minerals 2021, 11, 301. [Google Scholar] [CrossRef]
  7. Dai, S.F.; Ji, D.P.; Ward, C.R.; French, D.; Hower, J.C.; Yan, X.Y.; Wei, Q. Mississippian anthracites in Guangxi Province, southern China: Petrological, mineralogical, and rare earth element evidence for high-temperature solutions. Int. J. Coal Geol. 2018, 197, 84–114. [Google Scholar] [CrossRef]
  8. Dai, S.F.; Seredin, V.V.; Ward, C.R.; Hower, J.C.; Xing, Y.W.; Zhang, W.G.; Song, W.J.; Wang, P.P. Enrichment of U-Se-Mo-Re-V in coals preserved within marine carbonate successions: Geochemical and mineralogical data from the Late Permian Guiding Coalfield, Guizhou, China. Min. Depos. 2015, 50, 159–186. [Google Scholar] [CrossRef]
  9. Dai, S.F.; Ren, D.Y.; Zhou, Y.P.; Chou, C.L.; Wang, X.B.; Zhao, L.; Zhu, X.W. Mineralogy and geochemistry of a superhigh-organic-sulfur coal, Yanshan Coalfield, Yunnan, China: Evidence for a volcanic ash component and influence by submarine exhalation. Chem. Geol. 2008, 255, 182–194. [Google Scholar] [CrossRef]
  10. Li, W.W.; Tang, Y.G. Sulfur isotopic composition of superhigh-organic-sulfur coals from the Chenxi coalfield, southern China. Int. J. Coal Geol. 2014, 127, 3–13. [Google Scholar] [CrossRef]
  11. Chou, C.L. Geologic factors affecting the abundance, distribution, and speciation of sulfur in coals. In Geology of Fossil Fuels—Coal; CRC Press: Boca Raton, FL, USA, 1997. [Google Scholar]
  12. Chou, C.L. Sulfur in coals: A review of geochemistry and origins. Int. J. Coal Geol. 2012, 100, 1–13. [Google Scholar] [CrossRef]
  13. Dai, S.F.; Xie, P.P.; Ward, C.R.; Yan, X.Y.; Guo, W.M.; French, D.; Graham, I.T. Anomalies of rare metals in Lopingian super-high-organic-sulfur coals from the Yishan Coalfield, Guangxi, China. Ore Geol. Rev. 2017, 88, 235–250. [Google Scholar] [CrossRef]
  14. Dai, S.F.; Ren, D.Y.; Chou, C.L.; Finkelman, R.B.; Seredin, V.V.; Zhou, Y.P. Geochemistry of trace elements in Chinese coals: A review of abundances, genetic types, impacts on human health, and industrial utilization. Int. J. Coal Geol. 2012, 94, 3–21. [Google Scholar] [CrossRef]
  15. Liao, J.L.; Zhang, F.Q.; Wei, S.M.; Liang, X.D. Lithium and gallium abundance and enrichment factors in typical Late Permian coal-accumulating basin in Guangxi. Coal Geol. Explor. 2020, 48, 1. [Google Scholar]
  16. Yang, H.Y. Devonian-Middle Triassic Tectono-Palaeogeographic Pattern and Its Evolution in Hunan-Guangxi Area; China University of Petroleum (East China): Beijingm, China, 2010. [Google Scholar]
  17. Standard D3175-11; Standard Test Method for Volatile Matter in the Analysis Sample of Coal and Coke. ASTM International: West Conshohocken, PA, USA, 2011.
  18. Standard D3174-11; Annual Book of ASTM Standards. Test Method for Ash in the Analysis Sample of Coal and Coke. ASTM International: West Conshohocken, PA, USA, 2011.
  19. Standard D3173-11; Standard Test Method for Moisture in the Analysis Sample of Coal and Coke. ASTM International: West Conshohocken, PA, USA, 2011.
  20. Li, B.Q.; Zhuang, X.G.; Querol, X.; Moreno, N.; Cordoba, P.; Li, J.; Zhou, J.B.; Ma, X.P.; Liu, S.B.; Shangguan, Y.F. The mode of occurrence and origin of minerals in the Early Permian high-rank coals of the Jimunai depression, Xinjiang Uygur Autonomous Region, NW China. Int. J. Coal Geol. 2019, 205, 58–74. [Google Scholar] [CrossRef]
  21. Querol, X.; Whateley, M.K.G.; FernandezTuriel, J.L.; Tuncali, E. Geological controls on the mineralogy and geochemistry of the Beypazari lignite, central Anatolia, Turkey. Int. J. Coal Geol. 1997, 33, 255–271. [Google Scholar] [CrossRef]
  22. Taylor, S.R.; Mclennan, S.M. The continental crust: Its composition and evolution. J. Geol. 1985, 94, 57–72. [Google Scholar]
  23. Ketris, M.P.; Yudovich, Y.E. Estimations of Clarkes for Carbonaceous biolithes: World averages for trace element contents in black shales and coals. Int. J. Coal Geol. 2009, 78, 135–148. [Google Scholar] [CrossRef]
  24. Seredin, V.V.; Dai, S.F. Coal deposits as potential alternative sources for lanthanides and yttrium. Int. J. Coal Geol. 2012, 94, 67–93. [Google Scholar] [CrossRef]
  25. Huang, H.; Du, Y.S.; Yang, J.H.; Zhou, L.; Hu, L.S.; Huang, H.W.; Huang, Z.Q.J.L. Origin of Permian basalts and clastic rocks in Napo, Southwest China: Implications for the erosion and eruption of the Emeishan large igneous province. Lithos 2014, 208–209, 324–338. [Google Scholar] [CrossRef]
  26. Yang, J.; Cawood, P.A.; Du, Y.J.E.; Letters, P.S. Voluminous silicic eruptions during late Permian Emeishan igneous province and link to climate cooling. Earth Planet. Sci. Lett. 2015, 432, 166–175. [Google Scholar] [CrossRef] [Green Version]
  27. Deng, J.; Wang, Q.; Yang, S.; Liu, X.; Zhang, Q.; Yang, L.; Yang, Y. Genetic relationship between the Emeishan plume and the bauxite deposits in Western Guangxi, China: Constraints from U–Pb and Lu–Hf isotopes of the detrital zircons in bauxite ores—ScienceDirect. J. Asian Earth Sci. 2010, 37, 412–424. [Google Scholar] [CrossRef]
  28. Hayashi, T.; Hinoda, Y.; Takahashi, T.; Adachi, M.; Miura, S.; Izumi, T.; Kojima, H.; Yano, S.; Imai, K.J.I.M. Idiopathic CD4+ T-lymphocytopenia with Bowen’s disease. Intern. Med. 1997, 36, 822–824. [Google Scholar] [CrossRef] [PubMed] [Green Version]
  29. Hower, J.C.; Dai, S.F. Petrology and chemistry of sized Pennsylvania anthracite, with emphasis on the distribution of rare earth elements. Fuel 2016, 185, 305–315. [Google Scholar] [CrossRef]
  30. Li, B.Q.; Zhuang, X.G.; Li, J.; Querol, X.; Font, O.; Moreno, N. Geological controls on mineralogy and geochemistry of the Late Permian coals in the Liulong Mine of the Liuzhi Coalfield, Guizhou Province, Southwest China. Int. J. Coal Geol. 2016, 154, 1–15. [Google Scholar] [CrossRef]
  31. Li, B.Q.; Zhuang, X.G.; Querol, X.; Moreno, N.; Zhang, F. Geological controls on the distribution of REY-Zr (Hf)-Nb (Ta) enrichment horizons in late Permian coals from the Qiandongbei Coalfield, Guizhou Province, SW China. Int. J. Coal Geol. 2020, 231, 103604. [Google Scholar] [CrossRef]
  32. Dai, S.F.; Chekryzhov, I.Y.; Seredin, V.V.; Nechaev, V.P.; Graham, I.T.; Hower, J.C.; Ward, C.R.; Ren, D.Y.; Wang, X.B. Metalliferous coal deposits in East Asia (Primorye of Russia and South China): A review of geodynamic controls and styles of mineralization. Gondwana Res. 2016, 29, 60–82. [Google Scholar] [CrossRef]
  33. Dai, S.F.; Bechtel, A.; Eble, C.F.; Flores, R.M.; French, D.; Graham, I.T.; Hood, M.M.; Hower, J.C.; Korasidis, V.A.; Moore, T.A.; et al. Recognition of peat depositional environments in coal: A review. Int. J. Coal Geol. 2020, 219, 103383. [Google Scholar]
  34. Golab, A.N.; Carr, P.F. Changes in geochemistry and mineralogy of thermally altered coal, Upper Hunter Valley, Australia. Int. J. Coal Geol. 2004, 57, 197–210. [Google Scholar] [CrossRef]
  35. Rimmer, S.M.; Davis, A. Geologic Controls on the Inorganic Composition of Lower Kittanning Coal. In Geology of Fossil Fuels—Coal; ACS Publication: Washington, DC, USA, 1986; pp. 41–52. [Google Scholar]
  36. Bau, M.; Dulski, P. Petrology, Comparative study of yttrium and rare-earth element behaviours in fluorine-rich hydrothermal fluids. Contrib. Mineral. Petrol. 1995, 119, 213–223. [Google Scholar] [CrossRef]
  37. Bau, M.; Koschinsky, A.; Dulski, P.; Hein, J.R. Comparison of the partitioning behaviours of yttrium, rare earth elements, and titanium between hydrogenetic marine ferromanganese crusts and seawater. Geochim. Cosmochim. Acta 1996, 60, 1709–1725. [Google Scholar] [CrossRef]
  38. Byrne, R.H.; Kim, K.-H. Rare earth element scavenging in seawater. Geochim. Cosmochim. Acta 1990, 54, 2645–2656. [Google Scholar] [CrossRef]
  39. Xu, C.; Kynicky, J.I.; Smith, M.P.; Kopriva, A.; Brtnicky, M.; Urubek, T.; Yang, Y.; Zhao, Z.; He, C.; Song, W.J.N.C. Origin of heavy rare earth mineralization in South China. Nat. Commun. 2017, 8, 14598. [Google Scholar] [CrossRef] [PubMed] [Green Version]
  40. Braun, J.J.; Riotte, J.; Battacharya, S.; Violette, A.; Oliva, P.; Prunier, J.; Subramanian, S. REY-Th-U Dynamics in the Critical Zone: Combined Influence of Reactive Bedrock Accessory Minerals, Authigenic Phases, and Hydrological Sorting (Mule Hole Watershed, South India). Geochem. Geophys. Geosyst. 2018, 19, 1611–1635. [Google Scholar] [CrossRef]
  41. Chesley, S.; Lumpkin, M.; Schatzki, A.; Galpern, W.R.; Greenblatt, D.J.; Shader, R.I.; Miller, L.G. Prenatal exposure to benzodiazepine—I. Prenatal exposure to lorazepam in mice alters open-field activity and GABAA receptor function. Neuropharmacology 1991, 30, 53–58. [Google Scholar] [CrossRef]
  42. Winchester, J.A.; Floyd, P.A. Geochemical discrimination of different magma series and their differentiation products using immobile elements. Chem. Geol. 1977, 20, 325–343. [Google Scholar] [CrossRef] [Green Version]
  43. Dai, S.F.; Ward, C.R.; Graham, I.T.; French, D.; Hower, J.C.; Zhao, L.; Wang, X.B. Altered volcanic ashes in coal and coal-bearing sequences: A review of their nature and significance. Earth-Sci. Rev. 2017, 175, 44–74. [Google Scholar] [CrossRef]
  44. Dai, S.F.; Graham, I.T.; Ward, C.R. A review of anomalous rare earth elements and yttrium in coal. Int. J. Coal Geol. 2016, 159, 82–95. [Google Scholar] [CrossRef]
  45. Ichimura, K.; Sanematsu, K.; Kon, Y.; Takagi, T.; Murakami, T.J.A.M. REE redistributions during granite weathering: Implications for Ce anomaly as a proxy for paleoredox states. Am. Mineral. 2020, 105, 848–859. [Google Scholar] [CrossRef]
  46. Dai, S.; Finkelman, R.B. Coal geology in China: An overview. Int. Geol. Rev. 2018, 60, 531–534. [Google Scholar] [CrossRef] [Green Version]
  47. Li, B.Q.; Zhuang, X.G.; Li, J.; Querol, X.; Font, O.; Moreno, N. Enrichment and distribution of elements in the Late Permian coals from the Zhina Coalfield, Guizhou Province, Southwest China. Int. J. Coal Geol. 2017, 171, 111–129. [Google Scholar] [CrossRef] [Green Version]
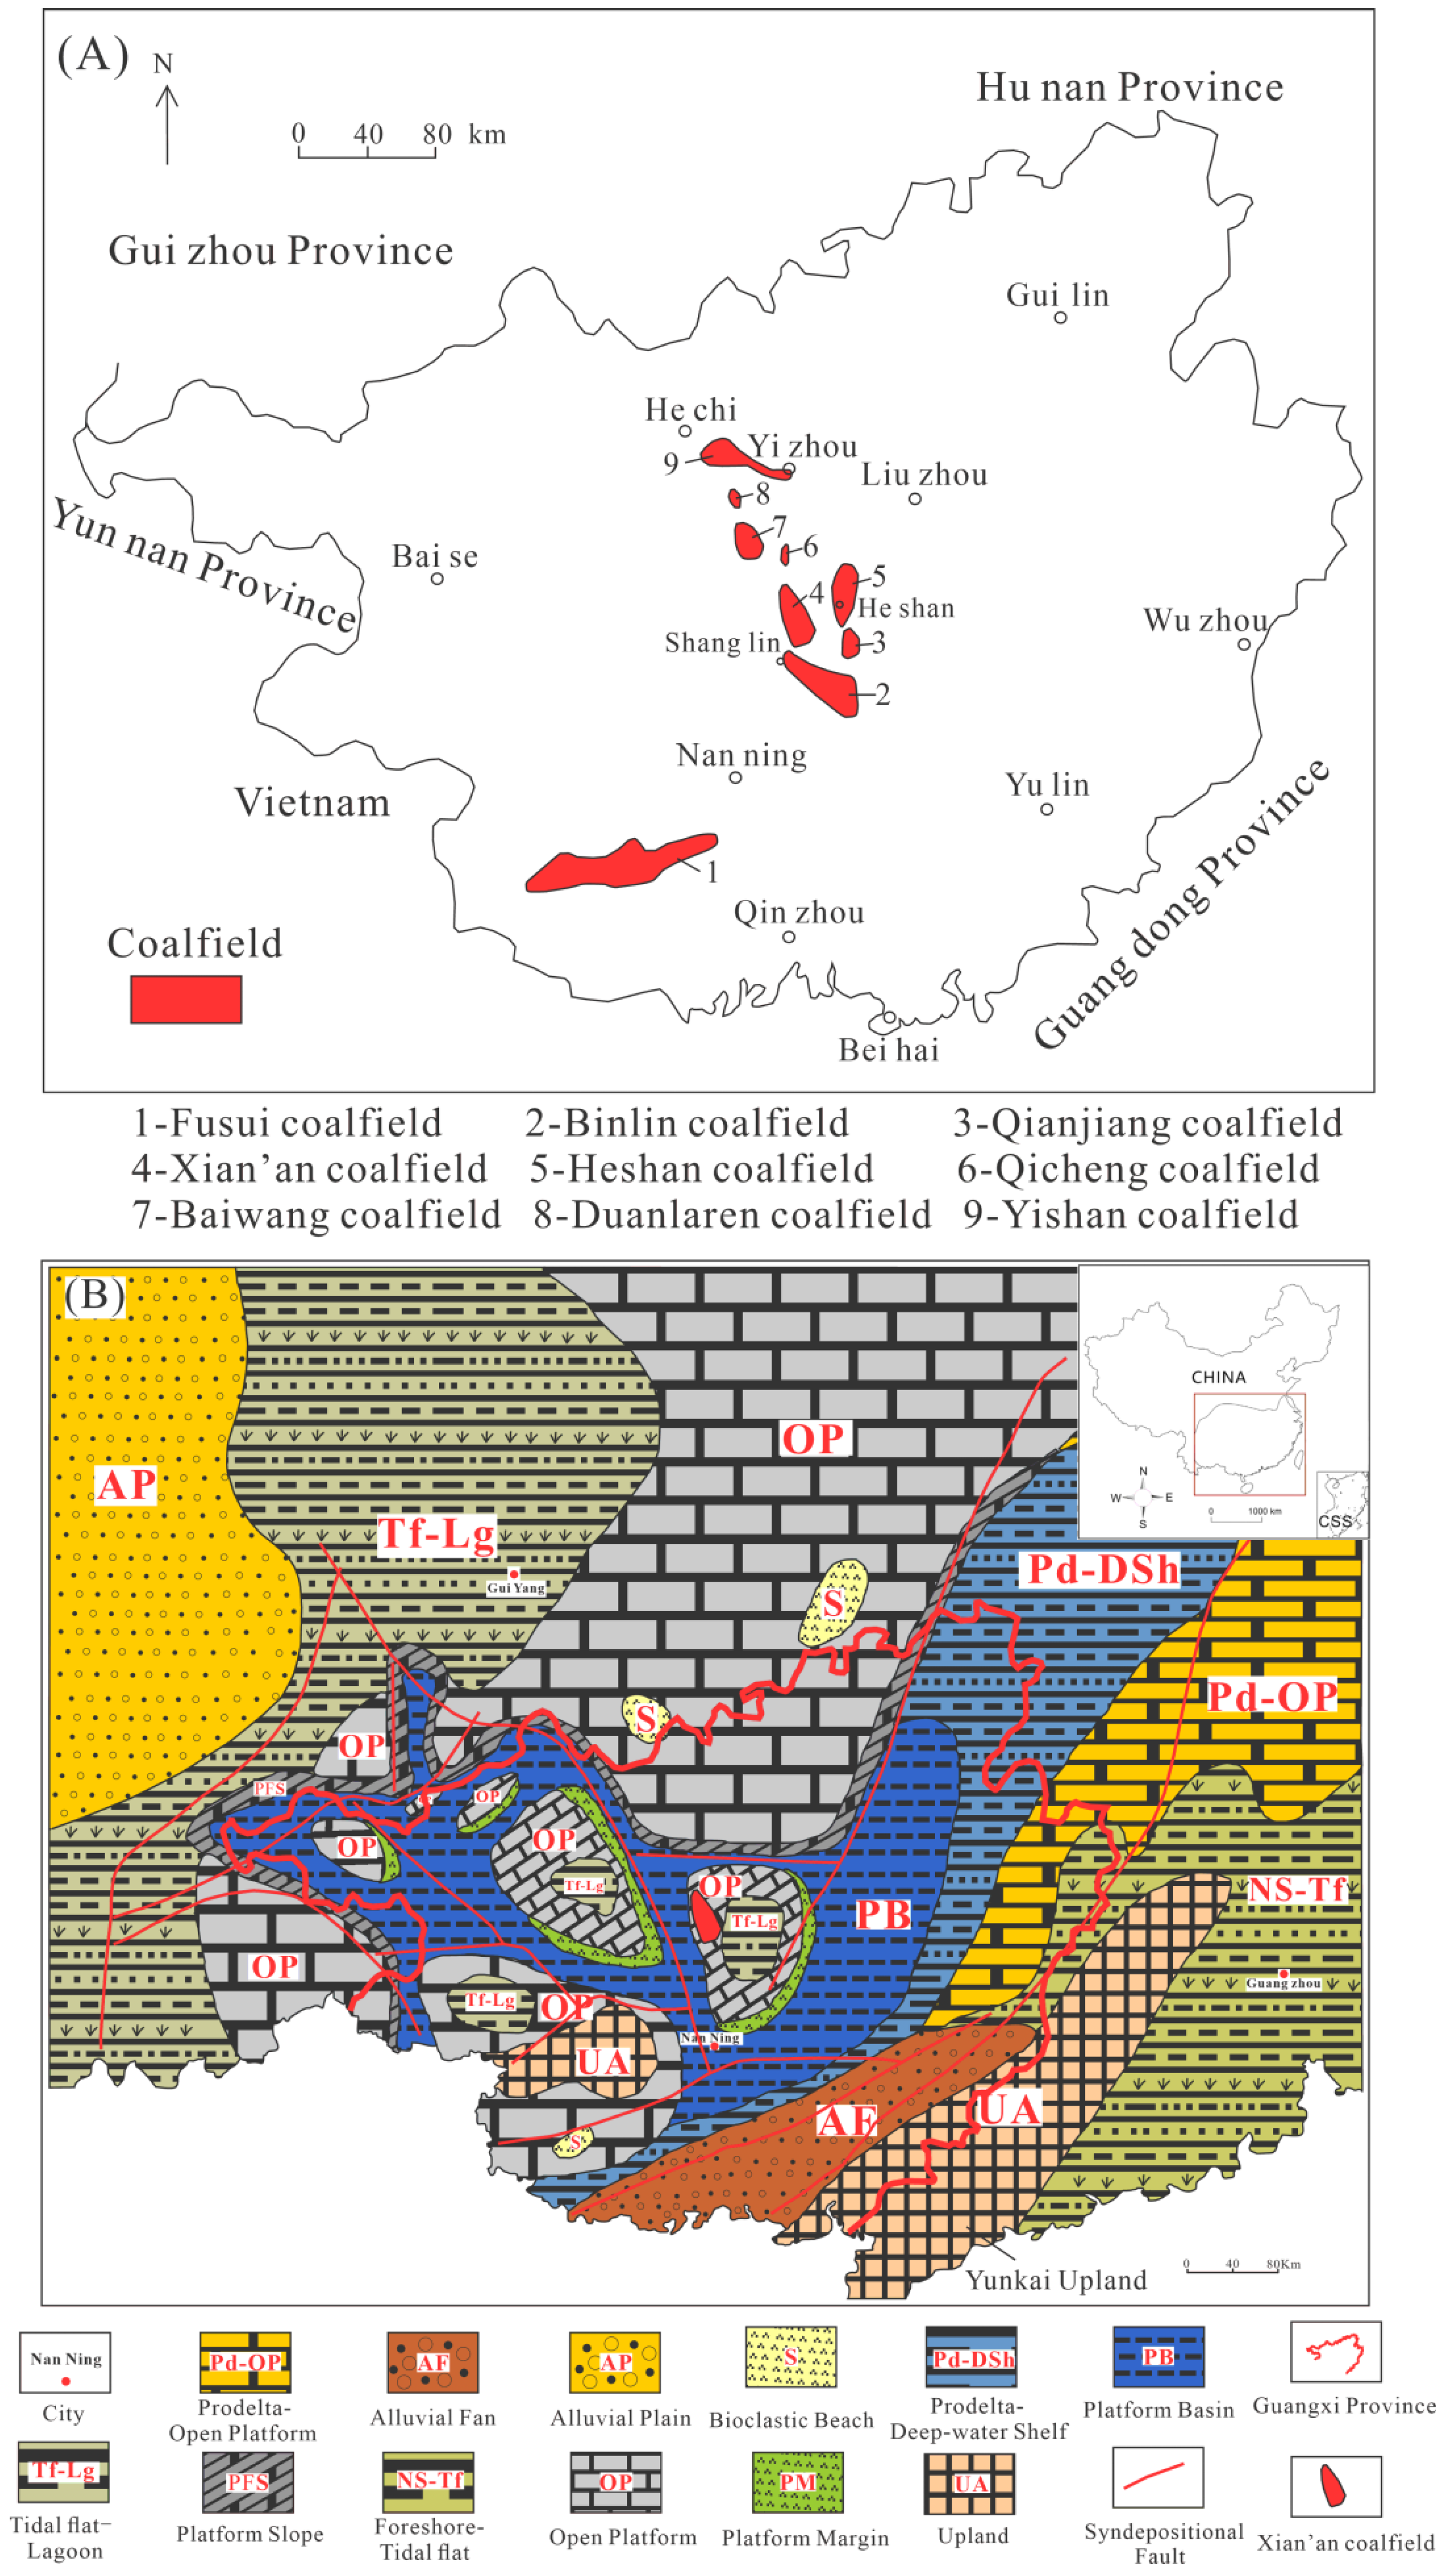
Figure 1. (A) Location of coalfields in Guangxi Province [15]; (B) location of the Xian’an Coalfield as well as the distribution of Late Permian sedimentary environments in southern China. CSS, China South Sea [16].
Energies 15 05196 g001
Figure 2. (A) The generalized stratigraphic column of the late Permian coal-bearing strata within the Xian’an Coalfield [6]; (B) sampling column of borehole SL.
Energies 15 05196 g002
Figure 3. Vertical distribution of ash yield, sulfur content, and the ratios of major element oxides throughout borehole SL profile.
Energies 15 05196 g003
Figure 4. X-ray diffractogram (XRD) patterns of minerals in selected samples to show mineral assemblage.
Energies 15 05196 g004
Figure 5. Vertical distribution of minerals throughout borehole SL profile.
Energies 15 05196 g005
Figure 6. Scanning electron microscope (SEM) back-scattered electron images of minerals (AH): (A) euhedral pyrite embedded within kaolinite matrix (sample SL-9); (B) kaolinite and anatase (sample SL-9); (C) vermiculate kaolinite (sample SL-12); (D) fracture-filling kaolinite (sample SL-5); (E) massive pyrite (sample SL-5); (F) albite, kaolinite, pyrite, and finely-grained disseminated anatase particles (sample SL-5); (G) kaolinite, albite, and pyrite (sample SL-5); and (H) framboidal pyrite aggregates (sample SL-16).
Energies 15 05196 g006
Figure 7. Relationship among selected elements and minerals: (A) plot of MgO vs. dolomite; (B) plot of K2O vs. illite; (C) plot of Fe2O3 vs. pyrite; and (D) plot of Fe2O3 vs. sulfur.
Energies 15 05196 g007
Figure 8. Concentration coefficient (CC) of trace elements in the studied samples, normalized to the respective average of upper continental crust composition (UCC; [22]).
Energies 15 05196 g008
Figure 9. Vertical distribution of selected trace elements, La/Ho and Y/Ho, throughout borehole SL profile.
Energies 15 05196 g009
Figure 10. UCC-normalized REY distribution patterns in the studied samples (A,B). UCC data from Taylor and McLennan [22].
Energies 15 05196 g010
Figure 11. (A) the plot of Al2O3 versus TiO2 contents for the investigated samples; (B) the plot of Zr/TiO2 versus Nb/Y contents for the investigated samples, the data of Qiandongbei [31], Heshan [3], and Fusui [5] are cited to compare.
Energies 15 05196 g011
Figure 12. Correlation among selected elements and LTA: (A) plot of Zr vs. Hf; (B) plot of REY vs. LTA; (C) plot of REY vs. Zr; (D) plot of (MREY + HREY)/REY vs. LTA; (E) plot of REY vs. Al2O3; (F) plot of U vs. Mo; (G) plot of U vs. V; (H) plot of Mo vs. V; (I) plot of Mo(U) vs. LTA; (J) plot of Mo vs. LTA; (K) plot of U vs. LTA; (L) plot of V vs. LTA; (M) plot of Se vs. As; (N) plot of As(Se) vs. Fe2O3; and (O) plot of As(Se) vs. Sulfur.
Energies 15 05196 g012
Table 1. Proximate analysis, total sulfur content, and low-temperature ash yield (LTA) of the samples from borehole SL.
LayerSampleLTA
(d, wt%)
Moisture
(ad, wt%)
Ash Yield
(d, wt%)
Volatile Matter Yield
(daf, wt%)
Total Sulfur Content
(d, wt%)
Layer FSL-193.20.3984.812.02.1
SL-293.00.7384.110.02.7
SL-396.31.1783.210.72.4
Layer ESL-496.10.5886.310.22.5
SL-588.90.8086.910.62.0
Layer DSL-689.70.5982.59.62.1
SL-777.60.3769.010.14.6
SL-888.70.7980.09.82.7
Layer CSL-985.61.3270.013.28.6
SL-1072.01.3359.210.85.1
SL-1183.61.5963.314.36.9
Layer BSL-1293.82.1486.212.22.8
SL-1397.52.0083.216.16.3
SL-1489.71.1872.315.44.9
Layer ASL-1578.70.6054.49.87.7
SL-1683.00.6065.48.44.0
Note: ad, air-dry basis; d, dry basis; daf, dry and ash-free basis.
Table 2. Mineralogical proportions and low-temperature ash yield (LTA) of the samples from the borehole SL (on whole-coal basis; unit in wt%).
SampleLTAIlliteKaoliniteParagoniteQuartzCalciteDolomitePyriteAlbiteAnataseBassanite
SL-193.2<dL5.6<dL55.28.48.62.113.4<dl<dL
SL-293.0<dL7.1<dL48.31.14.92.029.6<dl<dL
SL-396.3<dL6.9<dL58.81.614.02.212.9<dl<dL
SL-496.1<dL3.2<dL60.62.510.22.017.1<dl0.4
SL-588.9<dL5.75.355.10.79.72.79.60.1<dL
SL-689.7<dL<dl<dL59.8<dL9.54.116.3<dl<dL
SL-777.6<dL6.2<dL54.2<dL4.62.99.7<dl<dL
SL-888.7<dL2.8<dL55.01.88.93.816.5<dl<dL
SL-985.612.36.4<dL45.35.8<dL7.5<dL0.38.0
SL-1072.015.015.1<dL33.72.02.53.7<dL<dl<dL
SL-1183.614.83.7<dL47.63.04.010.5<dL<dl<dL
SL-1293.817.6<dl<dL64.8<dL4.46.5<dL0.4<dL
SL-1397.512.59.4<dL52.3<dL12.27.4<dL0.33.4
SL-1489.77.87.5<dL62.4<dL2.79.3<dL<dL<dL
SL-1578.711.52.1<dL48.17.33.95.9<dL<dL<dL
SL-1683.011.81.3<dL59.36.20.53.9<dL<dL<dL
<dL, below detection limit.
Table 3. Major-element oxides (wt%) and trace element concentrations (μg/g) of the samples from borehole SL-1 (on whole-coal basis).
SL-1SL-2SL-3SL-4SL-5SL-6SL-7SL-8SL-9SL-10SL-11SL-12SL-13SL-14SL-15SL-16
SiO266706972676962665548577363705566
TiO20.170.230.360.200.220.180.130.250.540.340.300.510.410.260.310.21
Al2O37.212138.312109.11212111317159.77.34.4
Fe2O31.82.52.31.92.42.21.82.75.12.33.55.16.25.62.62.1
MgO1.81.82.02.62.62.32.02.10.670.630.750.762.01.90.870.32
CaO6.03.53.04.63.22.72.82.73.31.42.51.12.93.02.52.2
K2O0.290.620.740.380.510.470.450.511.11.21.01.40.910.620.950.85
Na2O1.41.61.51.21.51.51.21.90.730.600.841.31.10.710.310.26
Li1622232855353245403555272523148.0
Be<dl1.71.41.61.80.982.10.851.41.21.63.63.10.84<dl1.0
B1082411157781986546829616698134667945
P9897219821001139722216869813721397762635
Sc4.15.49.75.37.66.65.97.86.9118.514127.78.23.7
V717054565712021612675137100424248359504424
Cr28141587327310075335128298121444357165
Mn951021381291361601321684051222084983938575
Co5.64.53.42.83.73.02.63.59.03.74.511128.06.25.3
Ni18116.831142222231921134449778492
Cu20102717103216232321152723262323
Zn62415945507162669583748064626672
Ga9.014181117151518192220362715114.0
Ge1.21.31.41.11.51.71.61.81.51.81.83.42.51.71.1<dl
As7.610119.115129.413219.2152648401714
Se3.02.74.42.34.44.34.05.53.44.05.41510.07.85.85.2
Rb16354422302724264249427146303920
Sr495664650525567554514567677501771798825539508337
Y19232819233049351133333833534329
Zr67103186891081241321485412412218416713714663
Nb6.57.0144.87.31219145.3128.61915109.91.9
Mo20251322313669433839358.745101149126
Cs4.39.7126.28.99.77.78.51517162719139.46.7
Ba8422125013217817014023974918110781517445
La221828212629303817323499105442111
Ce3632493545505166325962313208864123
Pr4.64.16.24.35.86.46.48.24.37.47.824219.85.53.7
Nd18152316222423301727308870362215
Sm4.14.16.03.96.45.65.47.33.86.56.516148.75.34.3
Eu<dl<dl1.0<dl0.900.83<dl1.0<dl<dl1.12.51.61.20.85<dl
Gd2.83.04.22.84.34.44.24.72.04.53.8128.06.54.03.2
Tb<dl<dl0.82<dl0.830.880.990.95<dl0.920.722.01.41.50.92<dl
Dy3.74.55.73.65.06.18.36.82.36.35.3118.7116.45.2
Ho0.831.01.3<dl1.11.32.11.6<dl1.41.32.21.82.61.61.3
Er1.92.43.01.82.12.95.53.81.13.12.74.54.06.03.72.8
Tm<dl0.800.49<dl0.360.512.00.62<dl1.00.420.750.681.00.580.95
Yb2.43.24.22.12.64.08.35.21.34.03.26.35.58.14.53.8
Lu<dl<dl0.69<dl0.440.661.40.87<dl<dl0.541.00.921.30.76<dl
Hf1.83.04.72.63.63.43.13.91.83.83.65.44.83.53.41.4
Ta<dl<dl<dl<dl<dl<dl<dl<dl<dl<dl<dl<dl<dl<dl<dl<dl
Pb19322917262626292534326638353132
Th7.317159.6161515207.815112119137.85.2
U2023191114318543194233442560126125
<dl, below detection limit.
Publisher’s Note: MDPI stays neutral with regard to jurisdictional claims in published maps and institutional affiliations.