Abstract
Ship emissions are one of the main sources of air pollution in port cities. The prosperous maritime trade has brought great harm to the air quality of port cities while promoting the development of the world economy. During the berthing process, ship auxiliary machines emit a large amount of air pollutants, which have a great impact on air quality and public health. Alternative marine fuels are being studied and used frequently to reduce ship emissions. This research was carried out to investigate the gaseous and particles emission characteristics of a marine diesel engine during the application of experimental biodiesel fuels. To study the influence of mixed fuels on engine performance, measurements were made at different engine loads and speeds. Different diesel fuels were tested using various ratios between biodiesel and BD0 (ultra-low sulfur diesel) of 0%, 10%, 30%, 50%, 70%, 90%, and 100%. The results indicated the use of biodiesel has little influence on the combustion performance but has a certain impact on exhaust emissions. The octane number and laminar flame speed of biodiesel are higher than those of BD0, so the combustion time of the test diesel engine is shortened under the mixed mode of biodiesel. In addition, a high ratio of biodiesel leads to a decrease of the instantaneous peak heat release rate, causing the crank angle to advance. As the biodiesel blending ratio increased, most of the gaseous pollutants decreased, especially for CO, but it led to an increase of particle numbers. The particle size distribution exhibits a unimodal distribution under various conditions, with the peak value appearing at 30–75 nm. The use of biodiesel has no effect on this phenomenon. The peak positions strongly depend on fuel types and engine conditions. The particulate matter (PM) emitted from the test engine included large amounts of organic carbon (OC), which accounted for between 30% and 40% of PM. Whereas the elemental carbon (EC) accounted for between 10% and 20%, the water-soluble ions components accounted for 6–15%. Elemental components, which accounted for 3–8% of PM emissions, mainly consisted of Si, Fe, Sn, Ba, Al, Zn, V, and Ni. Generally, biodiesel could be a reliable alternative fuel to reduce ship auxiliary engine emissions at berth and improve port air quality.
1. Introduction
Maritime transport is a vital trade method, with more than 90% of the world’s trade carried out by sea. The prosperity of marine transport has extensively promoted the development of the world economy. Meanwhile, the growth of ship activities has led to increasingly severe emissions of atmospheric pollutants from ships, which has brought tremendous pressure and challenges to the air quality in coastal areas. Ship emissions have become an important source of air quality in the world []. Fuel consumption caused by ship engines continuously emits nitrogen oxides (NOx), sulfur dioxide (SO2), hydrocarbons (HC), carbon monoxide (CO), volatile organic pollutants (VOCs), fine particulate matter (PM), and carbon dioxide (CO2) into the atmosphere []. According to the Global Inventory of air pollutant emissions, shipping emitted 20.9T g NOx (in terms of NO2) and 11.3T g SOx (in terms of SO2) from 2007 to 2012, accounting for about 15% and 13% of anthropogenic source emissions of NOx and SOx, respectively. Among them, 89% of NOX and 94% of SOX were generated by international ocean-going ships [,,]. The third IMO Global Greenhouse Gas Study pointed out that in 2012, the CO2 generated by global shipping was 949 million tons, accounting for 2.7% of total global CO2 emissions. The annual NOx emission is 20.9 million tons, accounting for 15%. The annual SO2 emission is 11.3 million tons, accounting for 13%. Shipping has become one of the fastest-growing sources of greenhouse gas emissions []. However, maritime transport is a relatively environmentally friendly mode of transport []. However, ship emissions also have an impact on air quality and the health of residents in coastal areas. Previous studies have shown that 70% of ship exhaust took place within 400 km of the coastline. These pollutants move to coastal and inland river areas by diffusing [,]. It poses a potential threat to human health, air quality, and climate change [,]. PM in ship exhaust is composed of organic and elemental carbon (OC and EC, respectively) and water-soluble inorganic ions and metals, which have a significant influence on coastal atmospheric environments and public health []. Corbett et al. indicated that in 2001, more than 60,000 people died of cardiopulmonary diseases caused by PM2.5 emitted by ocean-going ships around the world, of which East Asia accounted for 1/4 of the total deaths []. Research by the US Environmental Protection Agency shows that if the United States does not implement ship pollution control in the waters near the coastline, the lives of more than 30,000 residents will be seriously threatened in 2030 []. Furthermore, due to stricter regulations on land-based pollution sources, PM emitted by ships may become the primary source of particle emissions in the future [,]. Therefore, it is necessary to carry out studies on the PM emitted by ships.
Due to ship emissions coming mainly from fossil fuel combustion, it has been a priority to reduce emissions through cleaner fuels considering global climate change and sustainable development goals. However, the energy used by the vast majority of ships is Heavy fuel oil (HFO) with high sulfur content. HFO is the lowest grade of oil for most ocean-going ships and is used for both main and auxiliary diesel engines []. The fuel’s physical and chemical characteristics also have a decisive influence on PM emissions, and the sulfur content also has a great influence on PM emissions from diesel engines. Previous studies have shown that for a certain ship engine under the same engine load, an increase in sulfur content in the fuels will lead to increases in SO2 and PM emissions []. Emiroğlu et al. indicated that biodiesel mixed with diesel and ethanol makes the fuel start to evaporate earlier and accelerates the mixing of air and fuel. Meanwhile, the high oxygen content in ethanol could improve combustion performance and reduce emissions []. In addition, ethanol has a high laminar flame propagation velocity, which could significantly improve diesel engine combustion conditions and reduce engine particulate emissions []. Some previous studies have also shown that the use of alternative fuels will have a great impact on the combustion performance and exhaust emissions of diesel engines [,]. Many regions have adjusted energy policies in the search for clean fuels [,]. In Europe, I Klaková et al. performed a Computational Fluid Dynamics (CFD) simulation of the gasification process of wood in a packed chamber and its subsequent combustion process. Their simulations partly demonstrate the viability of alternative fuels []. In West Asia, Abd Ali et al. explored the possibility of thermal and electrical energy as an alternative energy source []. In India, Marseglia G et al. assessed the environmental benefits of using alternative fuels in combined power plants []. An important alternative energy is biodiesel, which is renewable, economical, and environmentally conscious [].
It can also be widely used in marine diesel engines, which have the highest global demand for petroleum fuels [,]. Biodiesel is a high-quality alternative fuel that has received great attention. Its physical and chemical properties are similar to diesel, which could be used directly as an alternative fuel without changing the current engine structure. An alternative fuel, biodiesel has a low content of aromatic hydrocarbon and sulfur, high cetane number, lubricity, and flash point []. It also effectively reduced tailpipe emissions. A bench test on diesel engine burning marine biodiesel shows that the use of biodiesel significantly reduced HC and PM emissions under various working conditions. Biodiesel fuel has significant potential to reduce ship emissions [,]. Other studies have found that using biodiesel significantly reduced emission of CO, SO2 [], unburned hydrocarbons, and PM [,]. The results demonstrated that there was no statistically significant difference for engine brake thermal efficiency among tested blended fuels []. The ratio of biodiesel to conventional diesel in the total fuel mixture will affect both combustion efficiency and exhaust emission characteristics [,]. However, most of the previous studies for biodiesel application were limited to vehicle diesel engines and the proportion of biodiesel content in the blended fuels is low [,]. Since the marine auxiliary diesel engine has been widely used to produce electricity in large ocean-going ships, the ratio of biodiesel could be higher than before. Therefore, detailed investigation of the size distribution and volatility of diesel-emitted particulates as a function of the biodiesel content of the applied fuel is a timely contribution to an important issue in the fields of climate and air quality research [,].
Generally, the vessel exhaust emission measurement mainly includes three parts: bench test, on-board measurement with portable exhaust measurement system (PEMS), and airborne plume measurement. The bench test is usually carried out in the laboratory, in which the researchers could control various experimental conditions to obtain emission data under different operating conditions. This method has good repeatability and reliable test results. Currently, there is little research focusing on the effects of different operating conditions and fuel types of vessel particulate emissions. It is necessary to effectively evaluate and design future regulations in order to achieve energy-efficient methods that are environmentally acceptable. In this study, we concentrate on the characterization of the PM and gaseous emissions of a six-cylinder naturally-aspirated direct-injection diesel engine fueled with neat diesel fuel, B10 (diesel containing 10 vol.% of bio-diesel), B30, B50, B70, B90,and neat biodiesel (B100). Experiments were conducted in different working conditions. The testing process including the engine parameters, experimental equipment, procedures, and the specific fuel information, as described in detail in Section 2. Then, the effects of different biodiesels on combustion performance and emission characteristics containing gaseous pollutant characteristics, particle size, and chemical compositions of marine auxiliary engine are discussed in Section 3. In general, our work aims to evaluate and characterize the effect of fuel composition on engine emissions at different loads and operating conditions to contribute to emission reduction in the transportation industry.
2. Materials and Methods
2.1. Test Engine and Fuels
This experiment was carried out on a six-cylinder marine auxiliary diesel engine in Shanghai, China. Different mix ratios of waste cooking oil biodiesel and diesel fuel were used for research. The test fuels include light diesel fuel and biodiesels, which were produced by Pusheng Petrochemical Company Ltd. (Shanghai, China). According to our experimental requirements, in this study, pure diesel fuel, B10 (diesel containing 10 vol.% of biodiesel), B30, B50, B70, and B90 were used. The main properties of the ultra-low sulfur diesel (BD0) and waste cooking oil biodiesel used in the present study are shown in Table A1. The specifications of the engine parameters are shown in Table 1. The marine auxiliary diesel engine was connected with a hydraulic dynamometer and a control engine test system was used to adjust the diesel engine speed and load. In this test system, adjusting the engine load at a fixed engine speed or adjusting the engine speed at a fixed engine load is allowed.

Table 1.
Test engine features.
2.2. Measuring Instruments
In this measurement, a suite of portable, high-precision exhaust measurement equipment is used to obtain the engine emissions data, which is constituted of five main parts: AVL M.O.V.E GAS PEMS (AVL, Graz, Austria), Testo 350 XL Flue gas analyzer (Testo, Schwarzwald, Germany), Diluter with a dilution ratio 1:100–1:1000 (Dekati, Kangasala, Finland), PM sampling system (Hengyuan company, Qingdao, China), and an Electrical Low-Pressure Impactor (Dekati, Kangasala, Finland). The AVL GAS PEMS was employed to measure instantaneous gaseous emissions. The CO and CO2 are analyzed by a non-dispersive infrared (NDIR) module, the NOx is analyzed by a non-dispersive ultraviolet (NDUV) module, and the THC is obtained by a hydrogen flame ionization detector (FID) module. The Testo 350 XL was used to examine SO2 with an electrochemical sensor module in the exhausts of the marine main engine. In addition, due to higher pollutant concentrations in the tail pipe, a diluter was used to dilute the sample gas with a certain dilution ratio to simulate the process of the sample gas entering the atmosphere. It also could adjust the exhaust concentration to meet the requirements of the detectors. As for the PM sampling system, four particulate samplers (including two 90-mm quartz fiber filters and two 90-mm polypropylene filters) are used to collect the particles from engine exhaust for subsequent chemical analysis. An Electric Low-Pressure Impactor (ELPI) was set to record the number concentration of particles and analyze particle size distributions in real time, which is widely used to measure particulate emissions from diesel engines. The cylinder pressure was measured by a pressure sensor (Kistler 6613CG1, 0.5% resolution), which was installed in the first cylinder of the test diesel engine. The specific experimental instrument configuration is described in Figure 1.
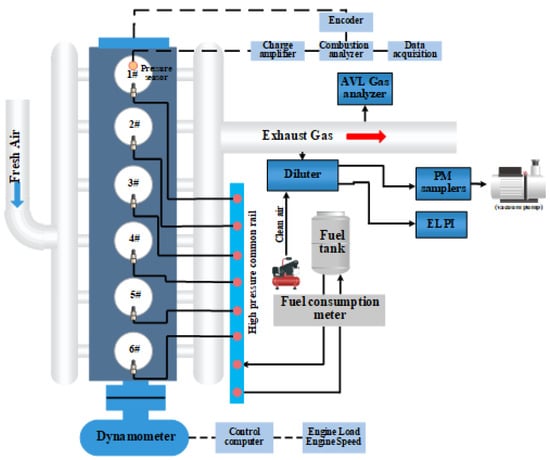
Figure 1.
Experimental instrument configuration diagram.
2.3. Test Mode and Data Analysis
In this study, the effects of different biodiesel on the combustion characteristics and emissions of gas pollutants and PM of Marine diesel engines were investigated by bench test. The test diesel engine operated at two speeds of 1050 r/min and 1500 r/min (rated engine speed), and at steady engine loads of 125 N.m (25% of maximum torque at 1050 r/min), 250 N.m (50%) and 375 N.m (75%), 273 N.m (25% of the maximum torque at 1500 r/min), 546 N.m (50%), and 819 N.m (75%), corresponding to the brake mean effective pressures of 0.12 MPa, 0.24 MPa, 0.37 MPa, 0.27 MPa, 0.54 MPa, and 0.80 MPa, respectively. For all engine operating modes, the experiments were carried out for BD0, B10, B30, B50, B70, B90, and neat waste cooking oil biodiesel (100%). To improve the measurement accuracy, the test diesel engine was allowed to run for some minutes until the cooling water temperature, lubricating oil temperature, and exhaust gas temperature had reached steady-state status. During the whole experiment, the cooling water temperature was kept between 80 °C and 85 °C, and the lubricating oil temperature was kept between 90 °C and 100 °C to ensure that the engine was close to the real operation condition. Fuel consumption, exhaust temperature, gaseous emissions, PM, and particle size distribution were continuously measured with a second-by-second resolution. After sampling, the PM filters were taken to the laboratory for subsequent chemical analysis. To ensure the experimental uncertainty was less than 5%, each steady-state experiment was repeated at least twice.
For PM samples, the determinations of inorganic metal elements were carried out by inductively coupled plasma mass spectrometry (ICP-MS) and inductively coupled plasma-optical emission spectrometry (ICP-OES) (Agilent 7500a, Santa Clara, CA, USA). In the process of elemental component analysis, several elements (Cd, Co, Cr, Cu, K, Mn, Mo, Na, Ni, Pb, Sb, Sn, V, and Zn) were analyzed by ICP-MS and the remaining elements (Al, Ba, Ca, Fe, Mg, Si, Ti, and Zr) by ICP-OES. The water-soluble ions in the samples, including four cations (Na+, NH4+, Mg2+ and Ca2+) and three anions (Cl−, NO3− and SO42−), were determined by DX-120 ion chromatography. A 1/8 quartz filter was cut into a glass tube and extracted ultrasonically with deionized water (8 mL) to obtain the supernatant solution for ion chromatography analysis []. Prior to the start of the experiment, the reagents were tested by blank analysis and the relative standard deviation (RSD) of the standard samples was checked. Carbon components (EC/OC) in particulate matter were analyzed by thermo-optical analysis with a DRI Model 2001A analyzer developed by the American Desert Institute and according to the protocol of IMPROVE Thermo-Optical Reflective Carbon (TOR); the carbon concentration of each sample consisted of 4 OC (OC1, OC2, OC3, OC4), 3 EC (EC1, EC2, EC3), and pyrolysis carbon OPC []. Before and after sample analysis, the instrument was calibrated with CH4 and CO2 standard gases and a parallel analysis was performed for every 10 samples to ensure deviations below 2%. All instruments were calibrated and maintained before and after each test cycle. The sample pretreatment, chemical analysis, and QA/QC were described in detail in our previous work and other related studies [,].
2.4. QA/QC
The Quartz filters (90 mm, 2500 QAT-UP, Pall Life Sciences) and polypropylene filters (90 mm, 90 mm in diameter, Beijing Synthetic Fiber Research Institute, Beijing, China) were applied to collect PM to investigate inorganic components. Quartz filters were placed in the muffle furnace at 600 °C for 2 h before sampling, equilibrated in a constant temperature (25 ± 1 °C), constant humidity (35 ± 1% RH) balance room for 48 h; polypropylene filters were dried in the oven at 60 °C for 2 h before sampling, and then weighed in a balance room for 48 h. After sampling, the quartz and polypropylene filters were returned to the balance room for 24 h for gravimetry and subsequent component analysis. All filters were weighed three times before and after sampling to ensure that the difference between the three weighing data points was <5 μg.
Because the response time of different instruments is different, different test data are required for alignment. For the alignment of AVL GAS PEMs, ELPI and CO2 concentration value and particle number concentration value were used. For the alignment of AVL GAS PEMs and the flow meter, a CO2 concentration value and exhaust flow rate were used. For the alignment between two parameters, the correlation coefficient between them was calculated as follows: one parameter was taken as the benchmark, the other parameter was shifted, and the correlation coefficient after each shift was calculated. When the correlation coefficient reached a maximum, the two parameters were considered to be aligned.
After the test was completed, the response of the instrument to zero gas and distance gas was recorded again. If the difference between the pre-test response and the post-test response was no more than 2%, no correction was deemed to be required. Otherwise, the test results were modified according to the following formula:
in which:
Ccor = CZ + (CS− CZ) (2 * Cgas − (Cpre,z + Cpos,z)(Cpre,s + Cpos,s) − (Cpre,z + Cpos,z))
Ccor is the corrected concentration value;
Cgas is the measured value;
CZ and CS are the reference values of zero gas and interval gas, respectively;
Cpre,z and Cpre,s are the response values of zero gas and interval gas before test;
Cpos,z and Cpos,s are the response values of zero gas and interval gas after test.
3. Results and Discussion
3.1. Engine Performance
The Fuel Consumption and Brake Specific Fuel Consumption (BSFC) of the test engine at different speeds and engine loads are shown in detail in Table A2. The test data for seven different oils were collected separately. Figure 2 shows the fuel consumption performance and engine exhaust temperature under different fuel types. We found that under the same rotational speed or engine load, the fuel consumption increased with the elevation in the doping ratio of biodiesel. This phenomenon occurs in all driving conditions. The difference in fuel consumption is more obvious especially under high speed and high load conditions. Due to the lower calorific value of biodiesel in comparison with general diesel fuel, more fuel is required to maintain the same output power. The engine working conditions will also affect fuel consumption, and increasing engine speed will lead to increased fuel consumption. The use of biodiesel has a slight effect on exhaust temperature. When the biodiesel mixture ratio is inferior to 50%, the exhaust temperature decreases firstly and then increases with the enhancement of the biodiesel mixture ratio. Under the condition of 1050 rpm, 75% engine load, the difference of exhaust temperature caused by the use of biodiesel is obvious. With the continuous increase of engine load, the combustion efficiency in the diesel engine cylinder continues to increase, and the exhaust temperature of the engine shows a rising trend. The difference in exhaust gas temperature between different biodiesel is also gradually reduced.
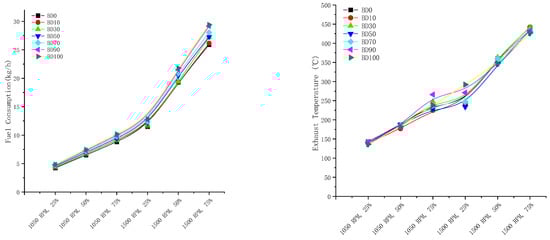
Figure 2.
The fuel consumption performance and engine exhaust temperature under different fuel types. (a) Fuel Consumption performance, (b) Engine Exhaust Temperature.
3.2. Effect of High Biodiesel to Diesel Ratio on the Combustion Performance
To further study the combustion characteristics of the engine cylinder under different fuel types, Figure 3 shows the average cylinder pressure and heat release rate curves for different ratios of biodiesel contents under various work conditions. In the process of experiment, the cylinder pressure data was averaged over 100 cycles to diminish the influence of cycle-by-cycle variation, and then used to calculate the heat release rate. Research shows that in-cylinder pressure increases with increasing engine load. The use of biodiesel will have a great influence on cylinder pressure. Under the low load (below 50%), the peak pressure in the cylinder is significantly lower than that of ordinary diesel when biodiesels were adopted. Generally, the cylinder pressure and heat release rate curves of BD0 combustion mode are similar to those of biodiesel additive combustion mode. Compared with BD0, the combustion of biodiesel causes in-cylinder pressure to start to rise earlier. Studies have shown that the blending of biodiesel shortens the combustion time of diesel engines []. With the decrease of the ignition delay, the test fuel injection quantity reduces in this period. As a result, the mixture in the cylinder decreases, leading to a decrease in the peak heat release rate. At the same time, lower cylinder temperature may be the main factor leading to a reduction of the diffusion combustion rate.
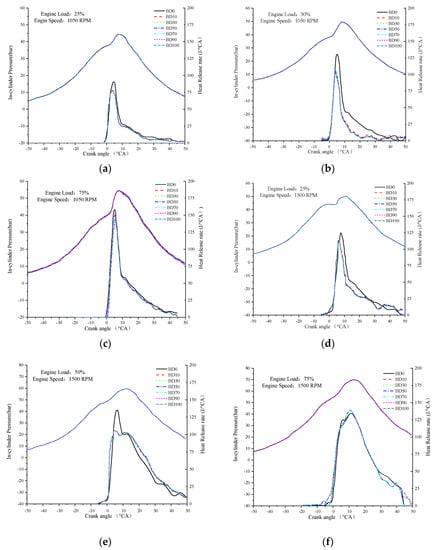
Figure 3.
Engine combustion evolution for different biodiesel under various work conditions. (a) engine load: 25% engine speed: 1050 RPM, (b) engine load: 50% engine speed: 1050 RPM, (c) engine load: 75% engine speed: 1050 RPM, (d) engine load: 50% engine speed: 1500 RPM, (e) engine load: 50% engine speed: 1500 RPM, (f) engine load: 75% engine speed: 1500 RPM.
3.3. Pollutant Emission
Figure 4 describes the emission characteristics of gaseous pollutants under different conditions in the experimental process, including different fuel types, speeds, and engine loads. The results show that the use of biodiesel contributes to a certain extent to the increase in CO2 emissions. The increase of fuel usage could be responsible for this phenomenon. The production of CO2 is mainly affected by the amount of air intake. Higher fuel consumption leads to an increase in air intake to maintain the combustion air fuel ratio []. With the increase of biodiesel doping ratio, CO2 emissions showed a downward trend under the same load. Under the conditions of 1050 rpm and 1500 rpm, the emissions of all pollutants showed a rising trend with the increase of engine compliance. Yang et al. conducted a long-term real ship test on a large bulk carrier, and their monitoring results of gaseous pollutants have proved this conclusion []. The use of biodiesel has a great influence on the pollutants emitted by ships. The fuel compositions and its physical and chemical characteristics have a decisive influence on diesel engine emissions. The emission factors of gaseous pollutants vary greatly due to different oil products. As the biodiesel blending ratio increased, the gaseous pollutants showed a downward trend, especially for CO. NO2/NOX emissions decreased significantly as the engine load increased at both testing speeds. However, the particle number increased with the use of biodiesel. With the increase of engine speed, the ratio of NO2/NOX content also decreased significantly. The ratio of NO2/NOX was about 60% when the engine was operating under low load. Then, it only accounts for about 3% at high speed and load. The operating conditions have a greater impact on NO2/NOX. Under the high engine load, higher combustion efficiency leads to more NO formation. In addition, the biodiesel blend ratio also affects NO2/NOX, which increases slowly with the increase of the biodiesel blended ratio. The NO2/NOX in different biodiesel blended ratios first decreased as the blending ratio increased from 0 to 50%, and then increased as the biodiesel blending volume rose above 70%.
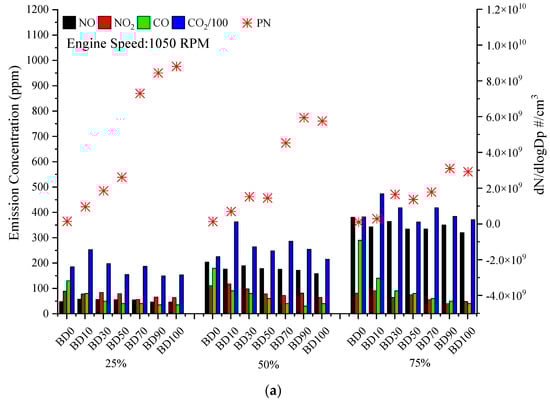
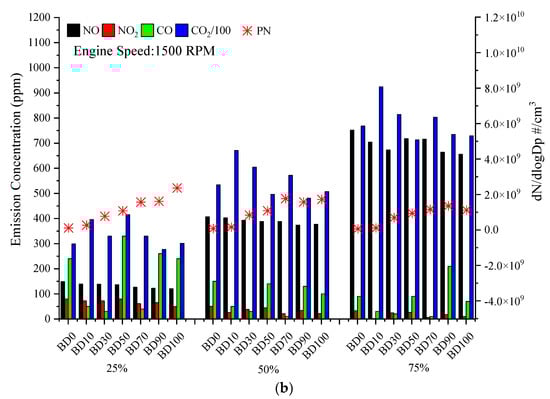
Figure 4.
Gaseous emissions of different blending ratios at different engine speeds. (a) 1050 RPM, (b) 1500 RPM.
3.4. Particle Size Distribution
An ELPI was used to measure the particle number in the range of 7 nm to 1000 nm with a sampling frequency of 1 Hz. The particle number, concentration, and size distribution of the diesel exhaust were measured under six different engine operating points. According to the engine speed–load range, it could be divided into 1050 r/min (25%, 50%, 75%) and 1500 r/min (25%, 50%, 75%). The particle size distribution of marine engine is shown in Figure 5a–g separately for B0, B10, B30, B50, B70, and B100 fuels. The engine particles usually followed a specific distribution. For marine diesel engine, the particle size has a certain wave peak and generally concentrates in the range of less than 100 nm, which is mainly related to the properties of fuel []. In this study, the peak positions were strongly influenced by fuel types and engine conditions. The particle size distribution exhibits a unimodal distribution under various test conditions and fuels. The use of biodiesel has no effect on this phenomenon. L. Ntziachristos et al. studied the particle emission characteristics of a medium-speed four-stroke marine diesel engine by using an engine bench according to ISO-8178 regulatory conditions. The results of various sampling systems show that the particle size distribution of marine diesel engines is in a unimodal form under various experimental conditions []. The particle size distribution peak position occurred in the range of 30–75 nm, which is closer to the results of other studies. Zhou et al. carried out experiments with a 4-stroke diesel engine, and the results showed that the peak particle size distribution was in the size range of 30–60 nm []. The particulate emissions are most pronounced at the lowest engine loads, regardless of the engine fuel used. This is caused by poor combustion efficiency at low loads []. The use of biodiesel increases the particle number emission. When the blending ratio switched to 70%, the size distribution was similar to that of neat biodiesel.
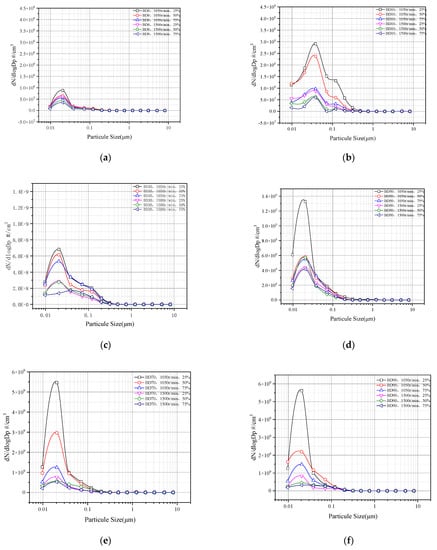
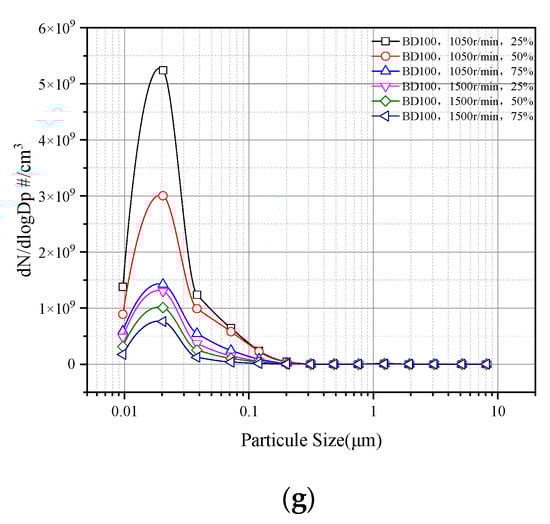
Figure 5.
The particle size distribution of marine engine for (a) BD0, (b) BD10, (c) BD30, (d) BD50, (e) BD70, (f) BD90, and (g) BD100.
3.5. Speciated Particle Matter Composition Emission
The various PM chemical composition characteristics in ship particulates including carbonaceous components, water-soluble ions, and inorganic elements are shown in detail in Figure 6. The PM emitted from the test auxiliary engine featured large amounts of OC, with OC accounting for 30–40% of the total mass of PM. EC is also a major component of diesel particles. It accounted for 10–20% of PM. Furthermore, the OC was dominated by the highly volatile OC1 and OC2 fractions. The OC emission was influenced by the fuel type and engine mode, which is shown in Table A4. At an engine speed of 1050 r/min, the OC emission was higher than other measured conditions when the neat biodiesel was used. The use of biodiesel slightly reduces OC emissions at loads below 50%, whereas it led to an increase in EC emissions. In previous studies, switching from diesel to biodiesel did not reduce EC emissions [,,]. The water-soluble ions components accounted for 6–15% of the PM emissions, in which sulfate was the most abundant component. The sulfate fraction increased from 1.7% to 7.2%. When switching from diesel to diesel blended with biodiesel, the ionic components clearly decreased. The ionic content consisted largely of Na+, NH4+, and NO3−, which accounted for 1.1%, 5.2%, and 3.3% of the mass, respectively. The elemental composition of the PM also depended strongly on the fuel type. Elemental components accounted for 3–8% of the PM emissions, consisting primarily of Si, Fe, Sn, Ba, Al, Zn, V, and Ni. With the increase of biodiesel mixing ratio and engine load, the element composition showed a trend of first decreasing and then increasing, similar to sulfate. In general, the use of biodiesel did not produce large changes in particulate matter composition.
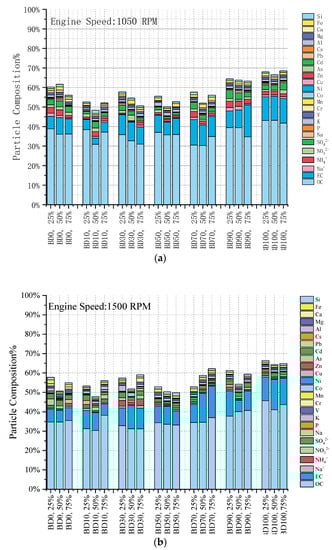
Figure 6.
Particle composition of different engine speeds. (a) 1050 RPM, (b) 1500 RPM.
4. Conclusions
In this study, a suit of PEMS measurement equipment was used on a marine diesel engine bench to study ship exhaust characteristics. The effects of different fuel types (B0, B10, B30, B50, B70, B90, B100) on the combustion performance of marine engines and gaseous and particulate pollutants are discussed in detail.
The engine operating conditions have an impact on fuel consumption. An increase of engine speed will lead to the increase of fuel consumption. The exhaust temperature decreased when the biodiesel blending ratio was increased from 0 to 50%, then increased as the biodiesel blending ratio continuously increased thereafter. The cylinder pressure decreased slightly with the increase of biodiesel content in the test fuel. The cylinder pressure and heat release rate curves of the BD0 combustion mode were similar to those of the biodiesel additive combustion mode. The combustion time of the diesel test engine was shortened under the mode of biodiesel blending with diesel. For gaseous pollutants, the use of biodiesel has a great influence on the pollutants emitted by ships. The employee of biodiesel contributes to a certain extent to the increase in CO2 emissions. The increase of fuel usage explained this phenomenon. As the biodiesel blending ratio increased, the pollutants decreased, especially for CO. However, the particle number increased with the use of biodiesel. NO2/NOX decreased significantly as the engine load increased at both testing speeds. Biodiesel performance and engine operating conditions had a comprehensive effect on gas emissions through the combustion process and temperature. Under low load, the gaseous emissions of biodiesel were lower than those of diesel at low and medium engine speeds. The particle size distribution exhibits a single-slot form under various operating conditions and fuels, with a peak at 30–75 nm. The use of biodiesel has no effect on this phenomenon. Particulate emissions are most pronounced at the lowest engine loads, regardless of the engine fuel used. The PM emitted from the test engine featured large amounts of OC, with OC occupying more than 30% of PM mass. The EC mass fraction was between 10% and 20%. Ionic components accounted for 6–15% of the PM emissions, and the SO42− and NO3− are the dominant components. The elemental components accounted for 3–8% of the PM emissions. It mainly consisted of Si, Fe, Sn, Ba, Al, Zn, V, and Ni.
This study established the correlation between various biodiesel and marine engine combustion performance and emission characteristics. In particular, the influence of biodiesels on particle size distribution and chemical composition are introduced in detail. It will be greatly helpful to the management of diesel PM and the development of post processing equipment in the future. Overall, the biodiesel could be a suitable alternative fuel, which will help reduce the emission of auxiliary pollutants during ship berthing periods. In our future work, a 3D CFD method will be combined with the experimental results to build a high-precision simulation model, which is of great significance to realize green navigation of ships.
Author Contributions
Conceptualization, N.Y.; Formal analysis, N.Y.; Funding acquisition, L.W.; Investigation, N.Y.; Methodology, N.Y. and M.T.; Resources, X.D. and B.L.; Software, L.L.; Supervision, Y.L. and P.L.; Validation, P.L.; Visualization, N.Y.; Writing—original draft, N.Y. and M.T.; Writing—review and editing, N.Y. and L.W. All authors have read and agreed to the published version of the manuscript.
Funding
This research received no external funding.
Institutional Review Board Statement
Not applicable.
Informed Consent Statement
Not applicable.
Data Availability Statement
The data are not publicly available due to privacy considerations.
Acknowledgments
The authors are grateful for the data and the technical support provided by Tianjin Key Laboratory of Urban Transport Emission Control; Tianjin Research Institute for Water Transport Engineering, Ministry of Transport of People’s Republic of China, Tianjin; and Hebei Research Center for Geo-analysis.
Conflicts of Interest
No conflict of interest exists in the submission of this manuscript, and the manuscript is approved by all authors for publication. On behalf of my co-authors, I want to declare that the work described was original research that has not been published previously, and not under consideration for publication elsewhere, in whole or in part. All the authors listed have approved the manuscript that is enclosed.
Appendix A
Table A1.
Properties of marine gas oil and waste cooking oil biodiesel.
Table A1.
Properties of marine gas oil and waste cooking oil biodiesel.
| Parameter | Marine Gas Oil | Biodiesel | Test Standard |
|---|---|---|---|
| Density (20 °C) (kg/m3) | 855.1 | 876.5 | GB/T 1884-2000 |
| Viscosity (40 °C) (mm2/s) | 3.005 | 4.202 | GB/T 265-1988 |
| Cetane number | 51 | 55 | GB/T 386-2010 |
| Lower heating value (MJ/kg) | 45.87 | 40.17 | GB/T 384-1981 |
| Flash point (°C) | 77.2 | 174.2 | GB/T 261-2008 |
| Sulphur content (ppm) | 477 | 21 | SH/T 0689-2000 |
| Nitrogen content (ppm) | 90 | 5 | SH/T 0657-2007 |
| Carbon content (wt.%) | 86.68 | 76.02 | SH/T 0656-1998 |
| Hydrogen content (wt.%) | 13.27 | 13.63 | SH/T 0656-1998 |
| Oxygen content (wt.%) | - | 10.23 | Element analyzer |
Table A2.
Engine performance.
Table A2.
Engine performance.
| Speed Load | FC (kg/h) | |||||||
|---|---|---|---|---|---|---|---|---|
| (r/min) → (%) | MGO | B10 | B30 | B50 | B70 | B90 | B100 | |
| 1050 | 25 | 4.24 | 4.36 | 4.40 | 4.59 | 4.70 | 4.82 | 4.83 |
| 50 | 6.49 | 6.69 | 6.76 | 6.95 | 7.13 | 7.32 | 7.44 | |
| 75 | 8.80 | 9.12 | 9.14 | 9.42 | 9.73 | 9.96 | 10.17 | |
| 1500 | 25 | 11.48 | 11.58 | 11.78 | 12.14 | 12.36 | 12.71 | 12.82 |
| 50 | 19.29 | 19.26 | 19.43 | 20.47 | 20.84 | 21.47 | 21.79 | |
| 75 | 25.91 | 26.16 | 27.18 | 27.28 | 28.05 | 29.17 | 29.39 | |
| Speed Load | BSFC (g/kw·h) | |||||||
| (r/min) → (%) | MGO | B10 | B30 | B50 | B70 | B90 | B100 | |
| 1050 | 25 | 309.15 | 315.83 | 321.42 | 334.91 | 345.46 | 351.60 | 352.90 |
| 50 | 237.04 | 244.19 | 245.71 | 253.82 | 265.19 | 266.99 | 271.62 | |
| 75 | 214.17 | 222.98 | 221.91 | 229.28 | 236.16 | 240.68 | 246.94 | |
| 1500 | 25 | 268.16 | 270.56 | 274.54 | 283.59 | 288.79 | 298.96 | 299.65 |
| 50 | 225.04 | 224.47 | 226.44 | 238.58 | 243.20 | 249.89 | 254.25 | |
| 75 | 213.62 | 215.47 | 224.26 | 225.09 | 231.04 | 240.67 | 242.51 | |
Table A3.
Main pollutant measurement parameters.
Table A3.
Main pollutant measurement parameters.
| Instrument | Measured Parameters | Range | Accuracy | Resolution |
|---|---|---|---|---|
| Exhaust gas analyzer | CO2 | 0–20% | ±3% | 0.01% |
| Exhaust gas analyzer | CO | 0–8% | ±50 ppm; ±3% | 10 ppm |
| Exhaust gas analyzer | 0–100 ppm | ±5 ppm; ±2% | 0.1 ppm | |
| Exhaust gas analyzer | NO | 0–2500 ppm | ±15 ppm; ±3% | 1 ppm |
| Exhaust gas analyzer | NO2 | 0–500 ppm | ±10 ppm; ±3% | 1 ppm |
| Exhaust gas analyzer | THC | 0–1000 ppm | ±5 ppm; ±2% | 1 ppm |
| Fuel mass flow meter | Fuel Consumption | 0–32 kg | ±0.5 g | 0.1 g |
| Hydraulic dynamometer | Engine Speed | 0–5000 r/min | 1 r/min | - |
| Hydraulic dynamometer | Torque | 0–1200 Nm | 0.4% | - |
| Pressure transducer | Cylinder pressure | 0–250 bar | 0.5% | 1.2 |
Table A4.
Particulate matter composition.
Table A4.
Particulate matter composition.
| Engine Load and Fuel Type | OC | EC | Ironic | Element |
|---|---|---|---|---|
| % | % | % | % | |
| B0, 1050 r/min, 25% | 38.86% | 6.32% | 8.71% | 6.35% |
| B0, 1050 r/min, 50% | 36.08% | 8.45% | 8.61% | 8.47% |
| B0, 1050 r/min, 75% | 36.18% | 7.80% | 6.37% | 5.69% |
| B0, 1500 r/min, 25% | 34.68% | 6.61% | 7.96% | 8.48% |
| B0, 1500 r/min, 50% | 34.71% | 6.00% | 6.18% | 4.81% |
| B0, 1500 r/min, 75% | 35.47% | 6.62% | 6.47% | 6.35% |
| B10, 1050 r/min, 25% | 38.42% | 5.23% | 4.06% | 4.86% |
| B10, 1050 r/min, 50% | 30.92% | 3.14% | 8.48% | 5.82% |
| B10, 1050 r/min, 75% | 37.17% | 4.88% | 5.05% | 5.02% |
| B10, 1500 r/min, 25% | 31.28% | 9.37% | 7.93% | 4.69% |
| B10, 1500 r/min, 50% | 30.35% | 9.21% | 4.83% | 4.46% |
| B10, 1500 r/min, 75% | 38.17% | 5.87% | 6.05% | 5.91% |
| B30, 1050 r/min, 25% | 35.87% | 10.22% | 5.94% | 6.70% |
| B30, 1050 r/min, 50% | 32.71% | 9.55% | 6.44% | 6.87% |
| B30, 1050 r/min, 75% | 31.03% | 8.77% | 4.59% | 6.19% |
| B30, 1500 r/min, 25% | 32.85% | 9.11% | 6.95% | 7.44% |
| B30, 1500 r/min, 50% | 31.22% | 12.06% | 4.19% | 4.21% |
| B30, 1500 r/min, 75% | 31.21% | 10.59% | 7.95% | 8.32% |
| B50, 1050 r/min, 25% | 37.03% | 8.77% | 4.19% | 5.55% |
| B50, 1050 r/min, 50% | 35.77% | 6.48% | 2.96% | 4.94% |
| B50, 1050 r/min, 75% | 35.91% | 8.33% | 3.90% | 5.58% |
| B50, 1500 r/min, 25% | 34.35% | 8.44% | 3.89% | 6.13% |
| B50, 1500 r/min, 50% | 33.53% | 9.25% | 3.41% | 5.12% |
| B50, 1500 r/min, 75% | 33.17% | 7.08% | 4.23% | 5.31% |
| B70, 1050 r/min, 25% | 30.53% | 13.01% | 8.87% | 5.25% |
| B70, 1050 r/min, 50% | 30.32% | 10.40% | 5.23% | 6.01% |
| B70, 1050 r/min, 75% | 34.89% | 10.28% | 4.46% | 6.45% |
| B70, 1500 r/min, 25% | 34.43% | 9.32% | 3.64% | 5.40% |
| B70, 1500 r/min, 50% | 34.59% | 14.84% | 4.07% | 5.25% |
| B70, 1500 r/min, 75% | 37.00% | 16.21% | 3.00% | 6.02% |
| B90, 1050 r/min, 25% | 39.45% | 8.52% | 10.74% | 5.70% |
| B90, 1050 r/min, 50% | 39.41% | 9.07% | 8.82% | 6.45% |
| B90, 1050 r/min, 75% | 34.74% | 16.36% | 6.56% | 5.59% |
| B90, 1500 r/min, 25% | 37.72% | 12.90% | 5.40% | 5.24% |
| B90, 1500 r/min, 50% | 40.10% | 5.82% | 4.86% | 4.42% |
| B90, 1500 r/min, 75% | 40.66% | 10.01% | 5.17% | 4.53% |
| B100, 1050 r/min, 25% | 43.11% | 12.14% | 6.12% | 6.61% |
| B100, 1050 r/min, 50% | 43.18% | 12.27% | 5.57% | 5.60% |
| B100, 1050 r/min, 75% | 41.76% | 12.57% | 8.17% | 6.00% |
| B100, 1500 r/min, 25% | 45.70% | 12.07% | 4.22% | 4.42% |
| B100, 1500 r/min, 50% | 41.05% | 15.61% | 3.37% | 4.37% |
| B100, 1500 r/min, 75% | 43.68% | 13.60% | 3.31% | 4.26% |
References
- Dalsøren, S.B.; Eide, M.S.; Endresen, Ø.; Mjelde, A.; Gravir, G.; Isaksen, I.S.A. Update on emissions and environmental impacts from the international fleet of ships: The contribution from major ship types and ports. Atmos. Chem. Phys. 2009, 9, 2171–2194. [Google Scholar] [CrossRef] [Green Version]
- Cooper, D.A. Exhaust emissions from ships at berth. Atmos. Environ. 2003, 37, 3817–3830. [Google Scholar] [CrossRef]
- Varella, R.A.; Giechaskiel, B.; Sousa, L.; Duarte, G. Comparison of Portable Emissions Measurement Systems (PEMS) with Laboratory Grade Equipment. Appl. Sci. 2018, 8, 1633. [Google Scholar] [CrossRef] [Green Version]
- Geng, P.; Mao, H.; Zhang, Y.; Wei, L.; You, K.; Ju, J.; Chen, T. Combustion characteristics and NOx emissions of a waste cooking oil biodiesel blend in a marine auxiliary diesel engine. Appl. Therm. Eng. 2017, 115, 947–954. [Google Scholar] [CrossRef]
- Geng, P.; Tan, Q.; Zhang, C.; Wei, L.; He, X.; Cao, E.; Jiang, K. Experimental investigation on NOx and green house gas emissions from a marine auxiliary diesel engine using ultralow sulfur light fuel. Sci. Total Environ. 2016, 572, 467–475. [Google Scholar] [CrossRef]
- Brandt, J.; Silver, J.D.; Christensen, J.H.; Andersen, M.S.; Bønløkke, J.H.; Sigsgaard, T.; Geels, C.; Gross, A.; Hansen, A.B.; Hansen, K.M.; et al. Assessment of past, present and future health-cost externalities of air pollution in Europe and the contribution from international ship traffic using the EVA model system. Atmos. Chem. Phys. 2013, 13, 7747–7764. [Google Scholar] [CrossRef] [Green Version]
- Eyring, V.; Köhler, H.W.; Van Aardenne, J.; Lauer, A. Emissions from international shipping: 1. The last 50 years. J. Geophys. Res. Atmos. 2005, 110. [Google Scholar] [CrossRef]
- Corbett, J.J.; Fischbeck, P.S.; Pandis, S.N. Global nitrogen and sulfur inventories for oceangoing ships. J. Geophys. Res. Atmos. 1999, 104, 3457–3470. [Google Scholar] [CrossRef]
- Ragettli, M.S.; Corradi, E.; Braun-Fahrländer, C.; Schindler, C.; de Nazelle, A.; Jerrett, M.; Ducret-Stich, R.E.; Künzli, N.; Phuleria, H.C. Commuter exposure to ultrafine particles in different urban locations, transportation modes and routes. Atmos. Environ. 2013, 77, 376–384. [Google Scholar] [CrossRef]
- Matthias, V.; Bewersdorff, I.; Aulinger, A.; Quante, M. The contribution of ship emissions to air pollution in the North Sea regions. Environ. Pollut. 2010, 158, 2241–2250. [Google Scholar] [CrossRef] [Green Version]
- Winnes, H.; Fridell, E. Emissions of NOX and particles from manoeuvring ships. Transp. Res. Part D Transp. Environ. 2010, 15, 204–211. [Google Scholar] [CrossRef]
- Zhang, Y.; Yang, X.; Brown, R.; Yang, L.; Morawska, L.; Ristovski, Z.; Fu, Q.; Huang, C. Shipping emissions and their impacts on air quality in China. Sci. Total Environ. 2017, 581–582, 186–198. [Google Scholar] [CrossRef] [PubMed]
- Corbett, J.J.; Winebrake, J.J.; Green, E.H.; Kasibhatla, P.; Eyring, V.; Lauer, A. Mortality from Ship Emissions: A Global Assessment. Environ. Sci. Technol. 2007, 41, 8512–8518. [Google Scholar] [CrossRef] [PubMed]
- Environmental Protection Agency. Control of Emissions from New Marine Compression-Ignition Engines at or above 30 Liters Per Cylinder; Federal Register, Proposed Rule; Environmental Protection Agency: Washington, DC, USA, 2009; Volume 74, pp. 44442–44595. [Google Scholar]
- Jaques, P.A.; Kim, C.S. Measurement of total lung deposition of inhaled ultrafine particles in healthy men and women. Inhal. Toxicol. 2000, 12, 715–731. [Google Scholar]
- Sausen, R. Transport impacts on atmosphere and climate. Atmos. Environ. 2010, 44, 4646–4647. [Google Scholar] [CrossRef]
- Herndon, S.C.; Jayne, J.T.; Lobo, P.; Onasch, T.B.; Fleming, G.; Hagen, D.E.; Whitefield, P.D.; Miake-Lye, R.C. Commercial Aircraft Engine Emissions Characterization of in-Use Aircraft at Hartsfield-Jackson Atlanta International Airport. Environ. Sci. Technol. 2008, 42, 1877–1883. [Google Scholar] [CrossRef]
- Lack, D.A.; Cappa, C.D.; Langridge, J.; Bahreini, R.; Buffaloe, G.; Brock, C.; Cerully, K.; Coffman, D.; Hayden, K.; Holloway, J.; et al. Impact of Fuel Quality Regulation and Speed Reductions on Shipping Emissions: Implications for Climate and Air Quality. Environ. Sci. Technol. 2011, 45, 9052–9060. [Google Scholar] [CrossRef]
- Emiroğlu, A.O.; Şen, M. Combustion, performance and emission characteristics of various alcohol blends in a single cylinder diesel engine. Fuel 2018, 212, 34–40. [Google Scholar] [CrossRef]
- Nour, M.; Attia, A.M.A.; Nada, S.A. Combustion, performance and emission analysis of diesel engine fuelled by higher alcohols (butanol, octanol and heptanol)/diesel blends. Energy Convers. Manag. 2019, 185, 313–329. [Google Scholar] [CrossRef]
- Nouri, M.; Isfahani, A.H.M.; Shirneshan, A. Effects of Fe2O3 and Al2O3 nanoparticle-diesel fuel blends on the combustion, performance and emission characteristics of a diesel engine. Clean Technol. Environ. Policy 2021, 23, 2265–2284. [Google Scholar] [CrossRef]
- Shirneshan, A.; Almassi, M.; Ghobadian, B.; Borghei, A.M.; Najafi, G. Response Surface Methodology (RSM) Based Optimization of Biodiesel-Diesel Blends and Investigation of Their Effects on Diesel Engine Operating Conditions and Emission Characteristics. Environ. Eng. Manag. J. 2016, 15, 2771–2780. [Google Scholar] [CrossRef]
- Man, X.J.; Cheung, C.S.; Ning, Z.; Wei, L.; Huang, Z.H. Influence of engine load and speed on regulated and unregulated emissions of a diesel engine fueled with diesel fuel blended with waste cooking oil biodiesel. Fuel 2016, 180, 41–49. [Google Scholar] [CrossRef]
- Catapano, F.; Costa, M.; Marseglia, G.; Sementa, P.; Sorge, U.; Vaglieco, B.M. An Experimental and Numerical Investigation of GDI Spray Impact over Walls at Different Temperatures. In Proceedings of the SAE 2016 World Congress and Exhibition, Detroit, MI, USA, 12–14 April 2016. [Google Scholar] [CrossRef]
- Klačková, I.; Zajačko, I.; Lenhard, R.; Gritsuk, I.; Wiecek, D. Simulation of wood biomass combustion in hot water boiler. IOP Conf. Ser. Mater. Sci. Eng. 2020, 776, 012033. [Google Scholar] [CrossRef]
- Abd Ali, L.M.; Ali, Q.A.; Klačková, I.; Issa, H.A.; Yakimovich, B.A.; Kuvshimov, V.V. Developing a thermal design for steam power plants by using concentrating solar power technologies for a clean environment. Acta Montan. Slovaca 2021, 26, 773–783. [Google Scholar] [CrossRef]
- Marseglia, G.; Vasquez-Pena, B.F.; Medaglia, C.M.; Chacartegui, R. Alternative Fuels for Combined Cycle Power Plants: An Analysis of Options for a Location in India. Sustainability 2020, 12, 3330. [Google Scholar] [CrossRef] [Green Version]
- Aakko-Saksa, P.T.; Rantanen-Kolehmainen, L.; Skyttä, E. Ethanol, Isobutanol, and Biohydrocarbons as Gasoline Components in Relation to Gaseous Emissions and Particulate Matter. Environ. Sci. Technol. 2014, 48, 10489–10496. [Google Scholar] [CrossRef] [PubMed]
- Britto, R.F.; Martins, C.A. Emission analysis of a Diesel Engine Operating in Diesel–Ethanol Dual-Fuel mode. Fuel 2015, 148, 191–201. [Google Scholar] [CrossRef]
- Carr, E.W.; Corbett, J.J. Ship Compliance in Emission Control Areas: Technology Costs and Policy Instruments. Environ. Sci. Technol. 2015, 49, 9584–9591. [Google Scholar] [CrossRef]
- Han, C.; Liu, Y.; He, H. The photoenhanced aging process of soot by the heterogeneous ozonization reaction. Phys. Chem. Chem. Phys. 2016, 18, 24401–24407. [Google Scholar] [CrossRef]
- Li, X.; Han, H.; Wang, W.; Chen, H.; Zhang, J. Economy and emission characteristics of different proportions of biodiesel from diesel engine. Nongye Gongcheng Xuebao/Trans. Chin. Soc. Agric. Eng. 2009, 25, 177–182. [Google Scholar]
- Chen, H.-Y.; Preston, M.R. Dissolution of azaarenes from urban aerosols. Atmos. Environ. 2004, 38, 1023–1028. [Google Scholar] [CrossRef]
- Agrawal, H.; Malloy, Q.G.; Welch, W.A.; Miller, J.W.; Cocker, D.R. In-use gaseous and particulate matter emissions from a modern ocean going container vessel. Atmos. Environ. 2008, 42, 5504–5510. [Google Scholar] [CrossRef] [Green Version]
- Zhu, L.; Cheung, C.; Zhang, W.; Huang, Z. Effect of charge dilution on gaseous and particulate emissions from a diesel engine fueled with biodiesel and biodiesel blended with methanol and ethanol. Appl. Therm. Eng. 2011, 31, 2271–2278. [Google Scholar] [CrossRef]
- Cheng, Z.; Luo, L.; Wang, S.; Wang, Y.; Sharma, S.; Shimadera, H.; Wang, X.; Bressi, M.; de Miranda, R.M.; Jiang, J.; et al. Status and characteristics of ambient PM2.5 pollution in global megacities. Environ. Int. 2016, 89–90, 212–221. [Google Scholar] [CrossRef] [PubMed]
- Gysel, N.R.; Russell, R.L.; Welch, W.A.; Cocker, I.D.R.; Ghosh, S. Impact of Sugarcane Renewable Fuel on In-Use Gaseous and Particulate Matter Emissions from a Marine Vessel. Energy Fuels 2014, 28, 4177–4182. [Google Scholar] [CrossRef]
- Chen, D.; Tian, X.; Lang, J.; Zhou, Y.; Li, Y.; Guo, X.; Wang, W.; Liu, B. The impact of ship emissions on PM2.5 and the deposition of nitrogen and sulfur in Yangtze River Delta, China. Sci. Total Environ. 2019, 649, 1609–1619. [Google Scholar] [CrossRef]
- Bond, T.C.; Doherty, S.J.; Fahey, D.W.; Forster, P.M.; Berntsen, T.; DeAngelo, B.J.; Flanner, M.G.; Ghan, S.; Kärcher, B.; Koch, D.; et al. Bounding the role of black carbon in the climate system: A scientific assessment. J. Geophys. Res. Atmos. 2013, 118, 5380–5552. [Google Scholar] [CrossRef]
- Lapirattanakun, A.; Charoensuk, J. Developement of porous media burner operating on waste vegetable oil. Appl. Therm. Eng. 2017, 110, 190–201. [Google Scholar] [CrossRef]
- Pham, C.T.; Kameda, T.; Toriba, A.; Hayakawa, K. Polycyclic aromatic hydrocarbons and nitropolycyclic aromatic hydrocarbons in particulates emitted by motorcycles. Environ. Pollut. 2013, 183, 175–183. [Google Scholar] [CrossRef]
- Onasch, T.B.; Jayne, J.T.; Herndon, S.; Worsnop, U.R.; Miake-Lye, R.C.; Mortimer, I.P.; Anderson, B.E. Chemical Properties of Aircraft Engine Particulate Exhaust Emissions. J. Propuls. Power 2009, 25, 1121–1137. [Google Scholar] [CrossRef]
- Shancita, I.; Masjuki, H.H.; Kalam, M.A.; Fattah, I.M.R.; Rashed, M.M.; Rashedul, H.K. A review on idling reduction strategies to improve fuel economy and reduce exhaust emissions of transport vehicles. Energy Convers. Manag. 2014, 88, 794–807. [Google Scholar] [CrossRef]
- Huang, C.; Hu, Q.; Wang, H.; Qiao, L.; Jing, S.; Wang, H.; Zhou, M.; Zhu, S.; Ma, Y.; Lou, S.; et al. Emission factors of particulate and gaseous compounds from a large cargo vessel operated under real-world conditions. Environ. Pollut. 2018, 242, 667–674. [Google Scholar] [CrossRef] [PubMed]
- Cho, A.K.; Sioutas, C.; Miguel, A.H.; Kumagai, Y.; Schmitz, D.A.; Singh, M.; Eiguren-Fernandez, A.; Froines, J.R. Redox activity of airborne particulate matter at different sites in the Los Angeles Basin. Environ. Res. 2005, 99, 40–47. [Google Scholar] [CrossRef] [PubMed]
- Fan, W.; Sun, Y.; Zhu, T.; Wen, Y. Emissions of HC, CO, NOx, CO2, and SO2 from civil aviation in China in 2010. Atmos. Environ. 2012, 56, 52–57. [Google Scholar] [CrossRef]
- Zhao, J.; Zhang, Y.; Wang, T.; Sun, L.; Yang, Z.; Lin, Y.; Chen, Y.; Mao, H. Characterization of PM2.5-bound polycyclic aromatic hydrocarbons and their derivatives (nitro-and oxy-PAHs) emissions from two ship engines under different operating conditions. Chemosphere 2019, 225, 43–52. [Google Scholar] [CrossRef]
- Geng, P.; Zhang, H.; Yang, S. Experimental investigation on the combustion and particulate matter (PM) emissions from a port-fuel injection (PFI) gasoline engine fueled with methanol–ultralow sulfur gasoline blends. Fuel 2015, 145, 221–227. [Google Scholar] [CrossRef]
- Zhao, J.; Zhang, Y.; Yang, Z.; Liu, Y.; Peng, S.; Hong, N.; Hu, J.; Wang, T.; Mao, H. A comprehensive study of particulate and gaseous emissions characterization from an ocean-going cargo vessel under different operating conditions. Atmos. Environ. 2020, 223, 117286. [Google Scholar] [CrossRef]
- Yang, L.; Zhang, Q.; Zhang, Y.; Lv, Z.; Wu, L.; Mao, H. Real-world emission characteristics of an ocean-going vessel through long sailing measurement. Sci. Total Environ. 2022, 810, 152276. [Google Scholar] [CrossRef]
- Zetterdahl, M.; Moldanová, J.; Pei, X.; Pathak, R.K.; Demirdjian, B. Impact of the 0.1% fuel sulfur content limit in SECA on particle and gaseous emissions from marine vessels. Atmos. Environ. 2016, 145, 338–345. [Google Scholar] [CrossRef]
- Murphy, S.M.; Agrawal, H.; Sorooshian, A.; Padró, L.T.; Gates, H.; Hersey, S.; Welch, W.A.; Jung, H.; Miller, J.W.; Cocker, I.D.R., III; et al. Comprehensive Simultaneous Shipboard and Airborne Characterization of Exhaust from a Modern Container Ship at Sea. Environ. Sci. Technol. 2009, 43, 4626–4640. [Google Scholar] [CrossRef] [Green Version]
- Zhou, S.; Zhou, J.; Zhu, Y. Chemical composition and size distribution of particulate matters from marine diesel engines with different fuel oils. Fuel 2019, 235, 972–983. [Google Scholar] [CrossRef]
- Ajtai, T.; Pintér, M.; Utry, N.; Kiss-Albert, G.; Gulyás, G.; Pusztai, P.; Puskás, R.; Bereczky, Á.; Szabados, G.; Szabó, G.; et al. Characterisation of diesel particulate emission from engines using commercial diesel and biofuels. Atmos. Environ. 2016, 134, 109–120. [Google Scholar] [CrossRef]
- Chuang, H.-C.; Hsiao, T.-C.; Lee, C.-H.; Lin, J.C.-T.; Chuang, K.-J.; Feng, P.-H.; Cheng, T.-J. Effects of physical characteristics of carbon black on metabolic regulation in mice. Environ. Pollut. 2018, 232, 494–504. [Google Scholar] [CrossRef] [PubMed]
- Mueller, L.; Schnelle-Kreis, J.; Jakobi, G.; Orasche, J.; Jing, L.; Canonaco, F.; Prevot, A.S.; Zimmermann, R. Combustion process apportionment of carbonaceous particulate emission from a diesel fuel burner. J. Aerosol Sci. 2016, 100, 61–72. [Google Scholar] [CrossRef]
- Cohen, A.J.; Brauer, M.; Burnett, R.; Anderson, H.R.; Frostad, J.; Estep, K.; Balakrishnan, K.; Brunekreef, B.; Dandona, L.; Dandona, R.; et al. Estimates and 25-year trends of the global burden of disease attributable to ambient air pollution: An analysis of data from the Global Burden of Diseases Study 2015. Lancet 2018, 391, 1576. [Google Scholar] [CrossRef] [Green Version]
Publisher’s Note: MDPI stays neutral with regard to jurisdictional claims in published maps and institutional affiliations. |
© 2022 by the authors. Licensee MDPI, Basel, Switzerland. This article is an open access article distributed under the terms and conditions of the Creative Commons Attribution (CC BY) license (https://creativecommons.org/licenses/by/4.0/).