Smart Hydropower Water Distribution Networks, Use of Artificial Intelligence Methods and Metaheuristic Algorithms to Generate Energy from Existing Water Supply Networks
Abstract
:1. Introduction
2. Benchmark Water Distribution Network
3. Critical Nodes
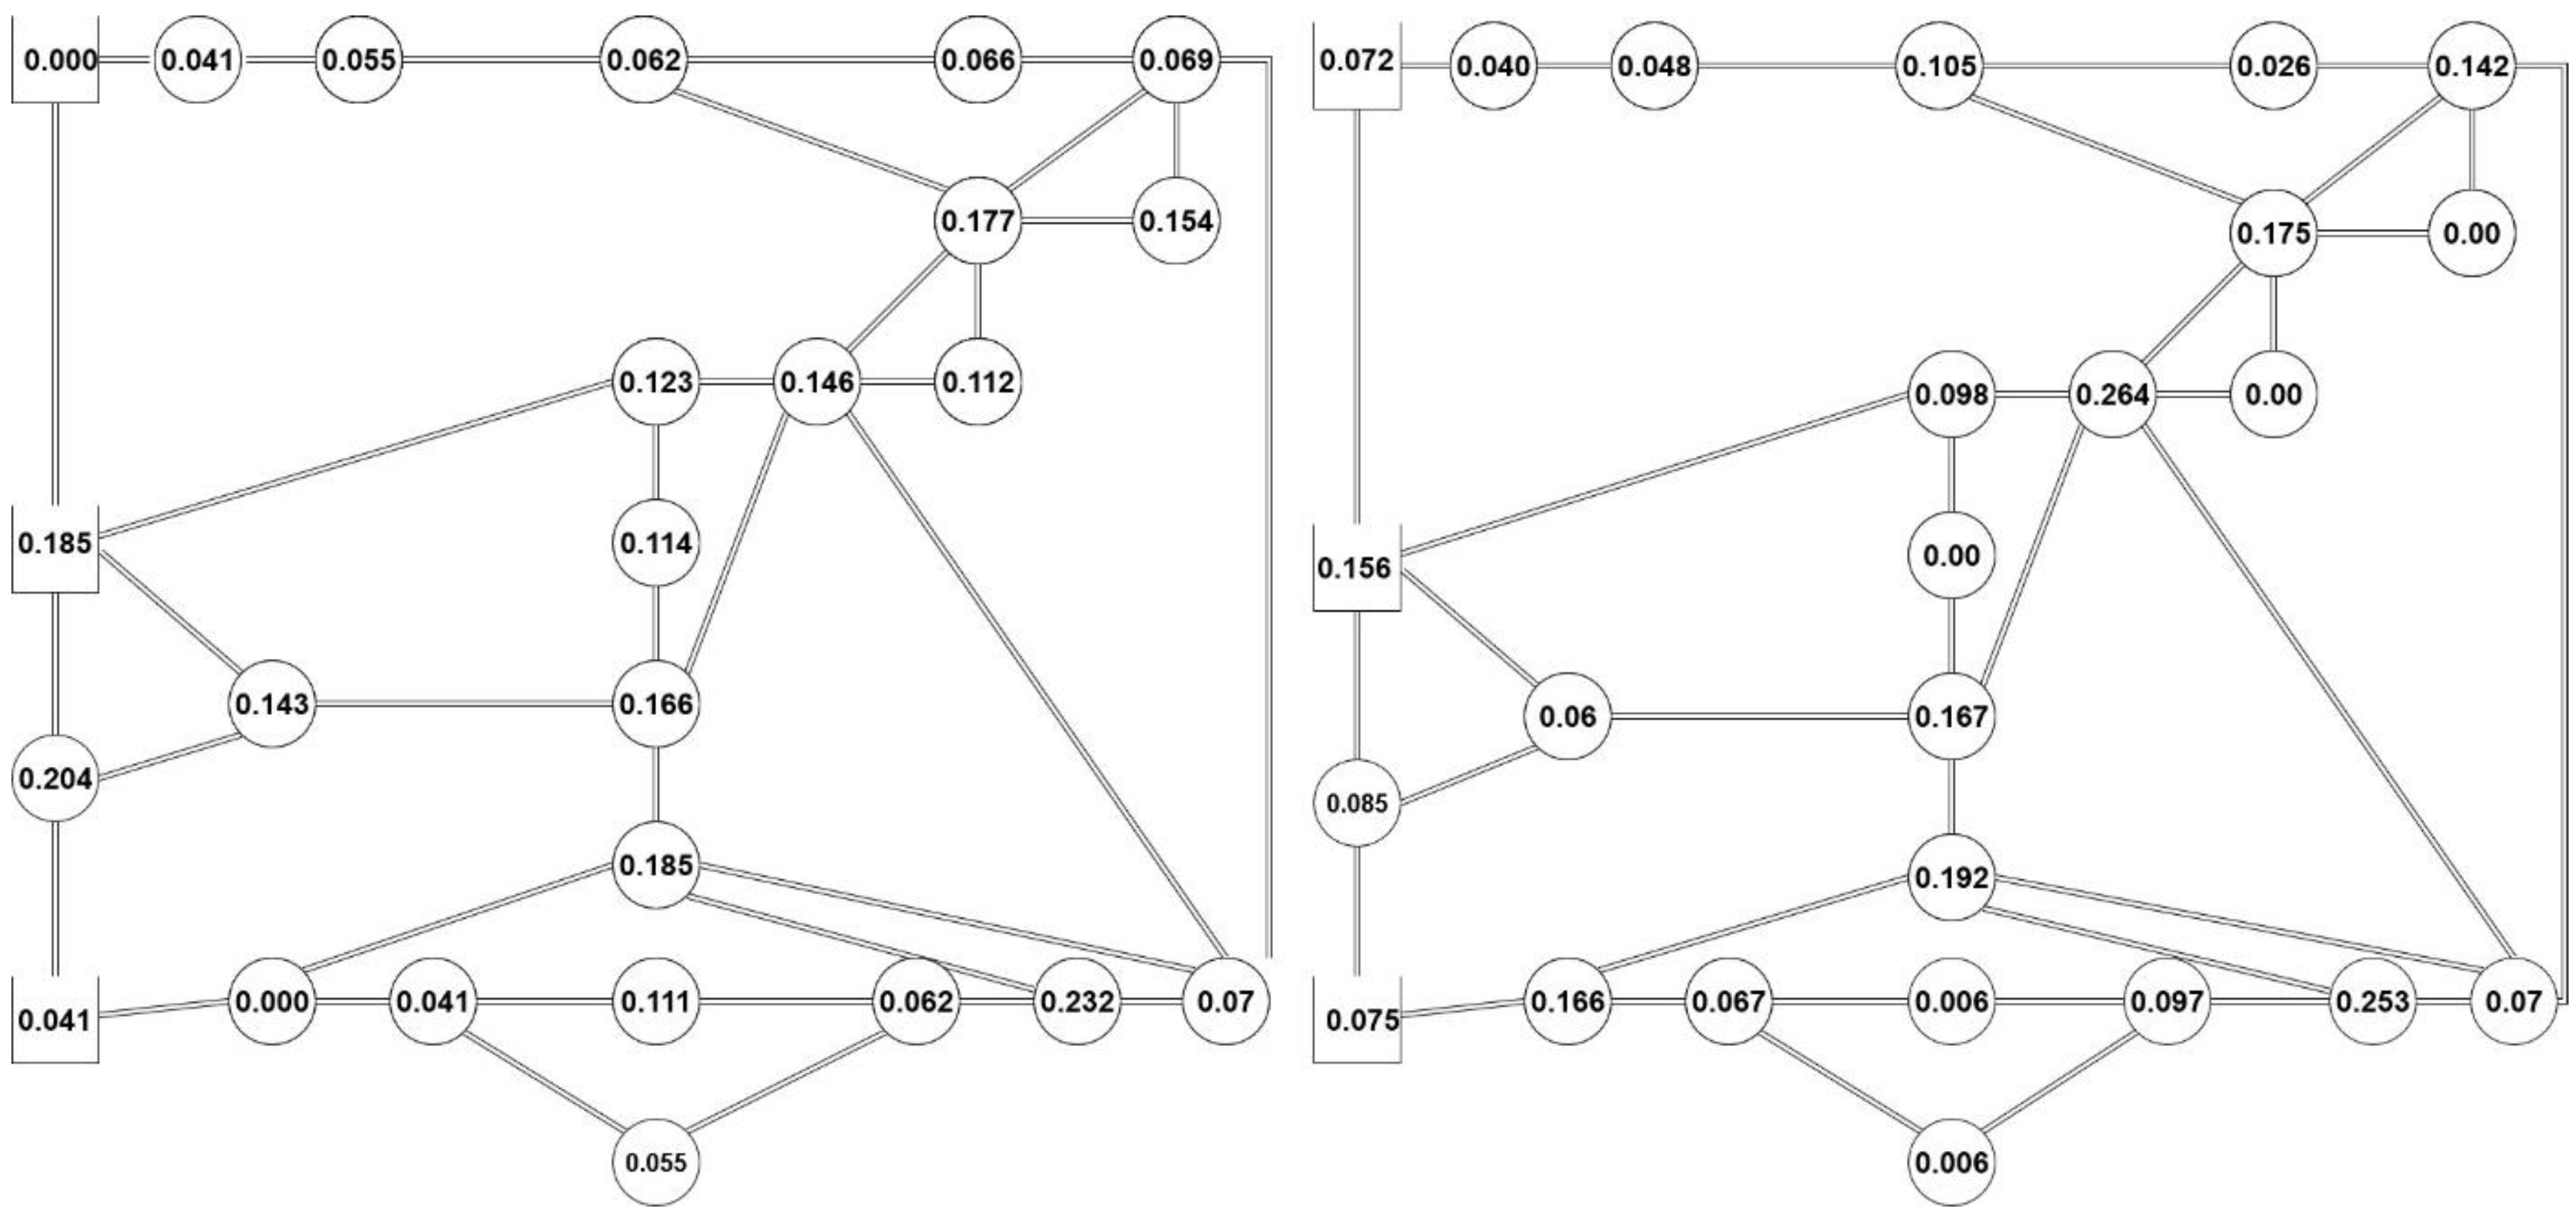
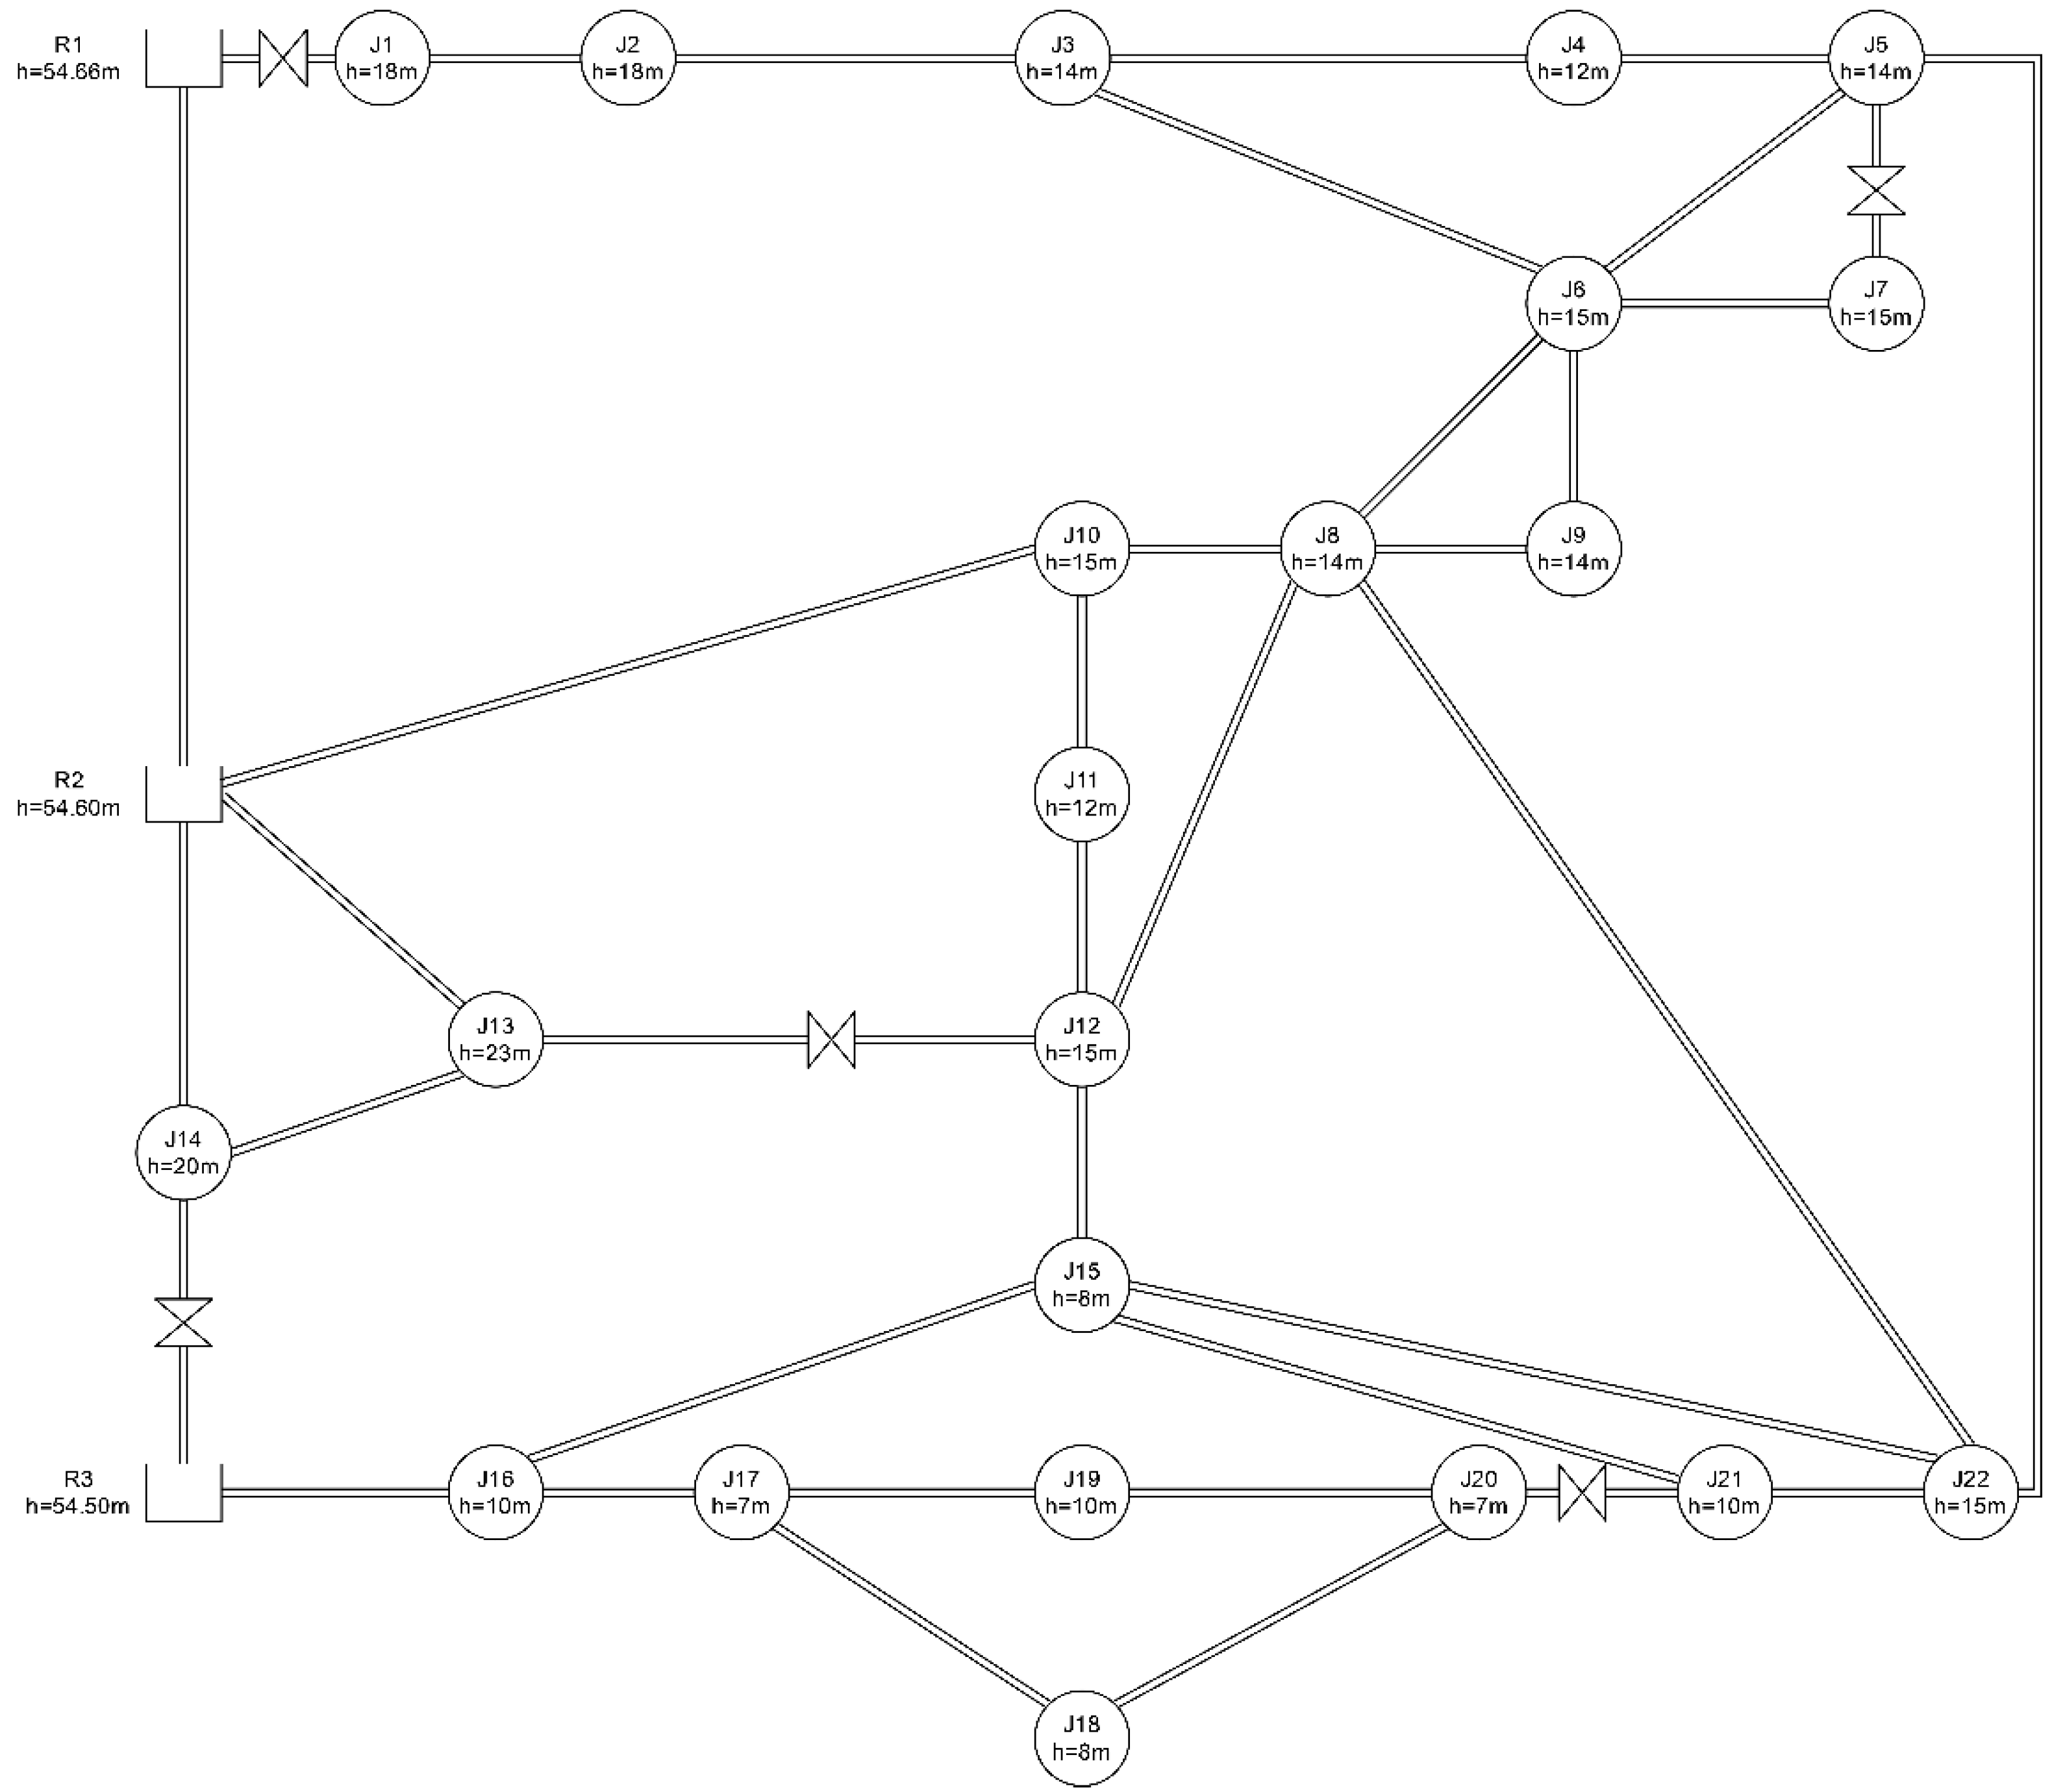
- Two nodes are selected with the minimum absolute difference between the closeness centrality and the betweenness centrality of the nodes. These nodes are 1 and 12. This rule represents a similar response on both graph theory functions.
- Two next nodes are selected with the maximum absolute difference between the closeness centrality and the betweenness centrality of the nodes and small values for the betweenness centrality. These nodes are 7 and 14. This rule represents the domination of closeness centrality
- The last node is a random selection. This rule introduces randomness in the way that nodes are selected, which is necessary if the methodology is applied to existing WDNs. In this case, it is possible that PATs are already installed on a node that does not comply with the two previous rules.
4. Training Data
5. Artificial Neural Networks
6. Energy Production
7. Optimization Model
8. Harmony Search Algorithm
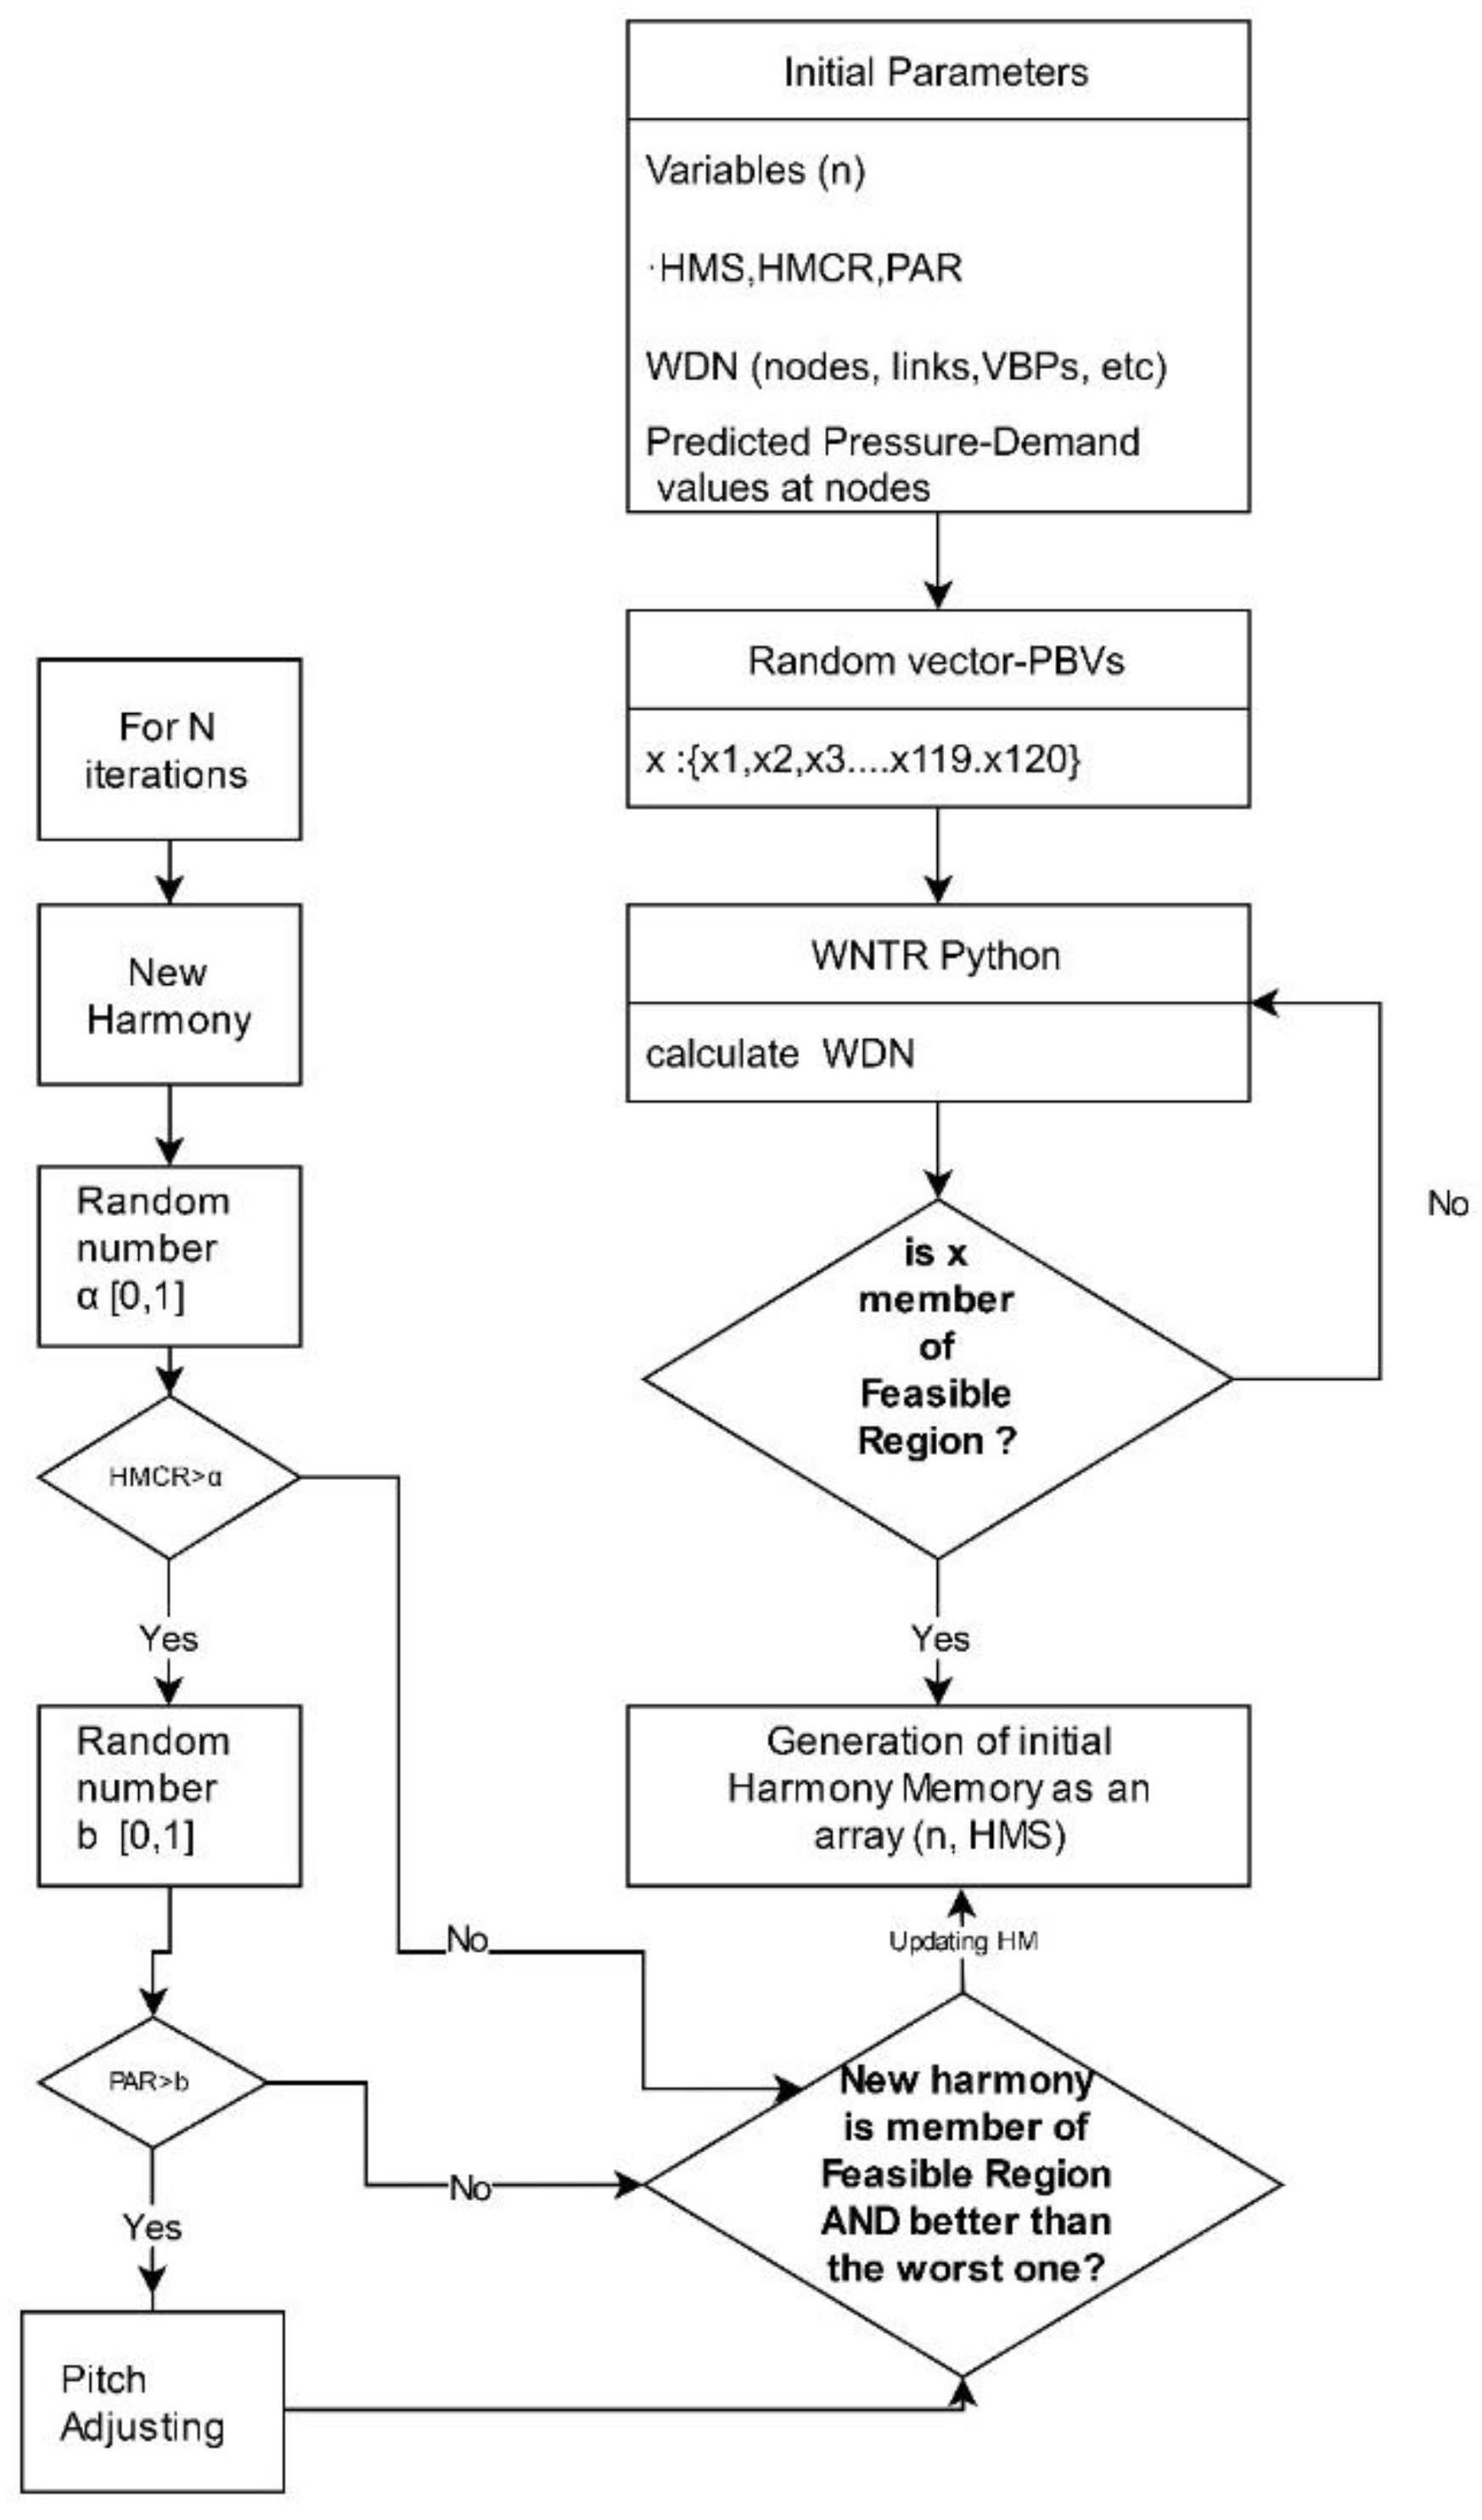
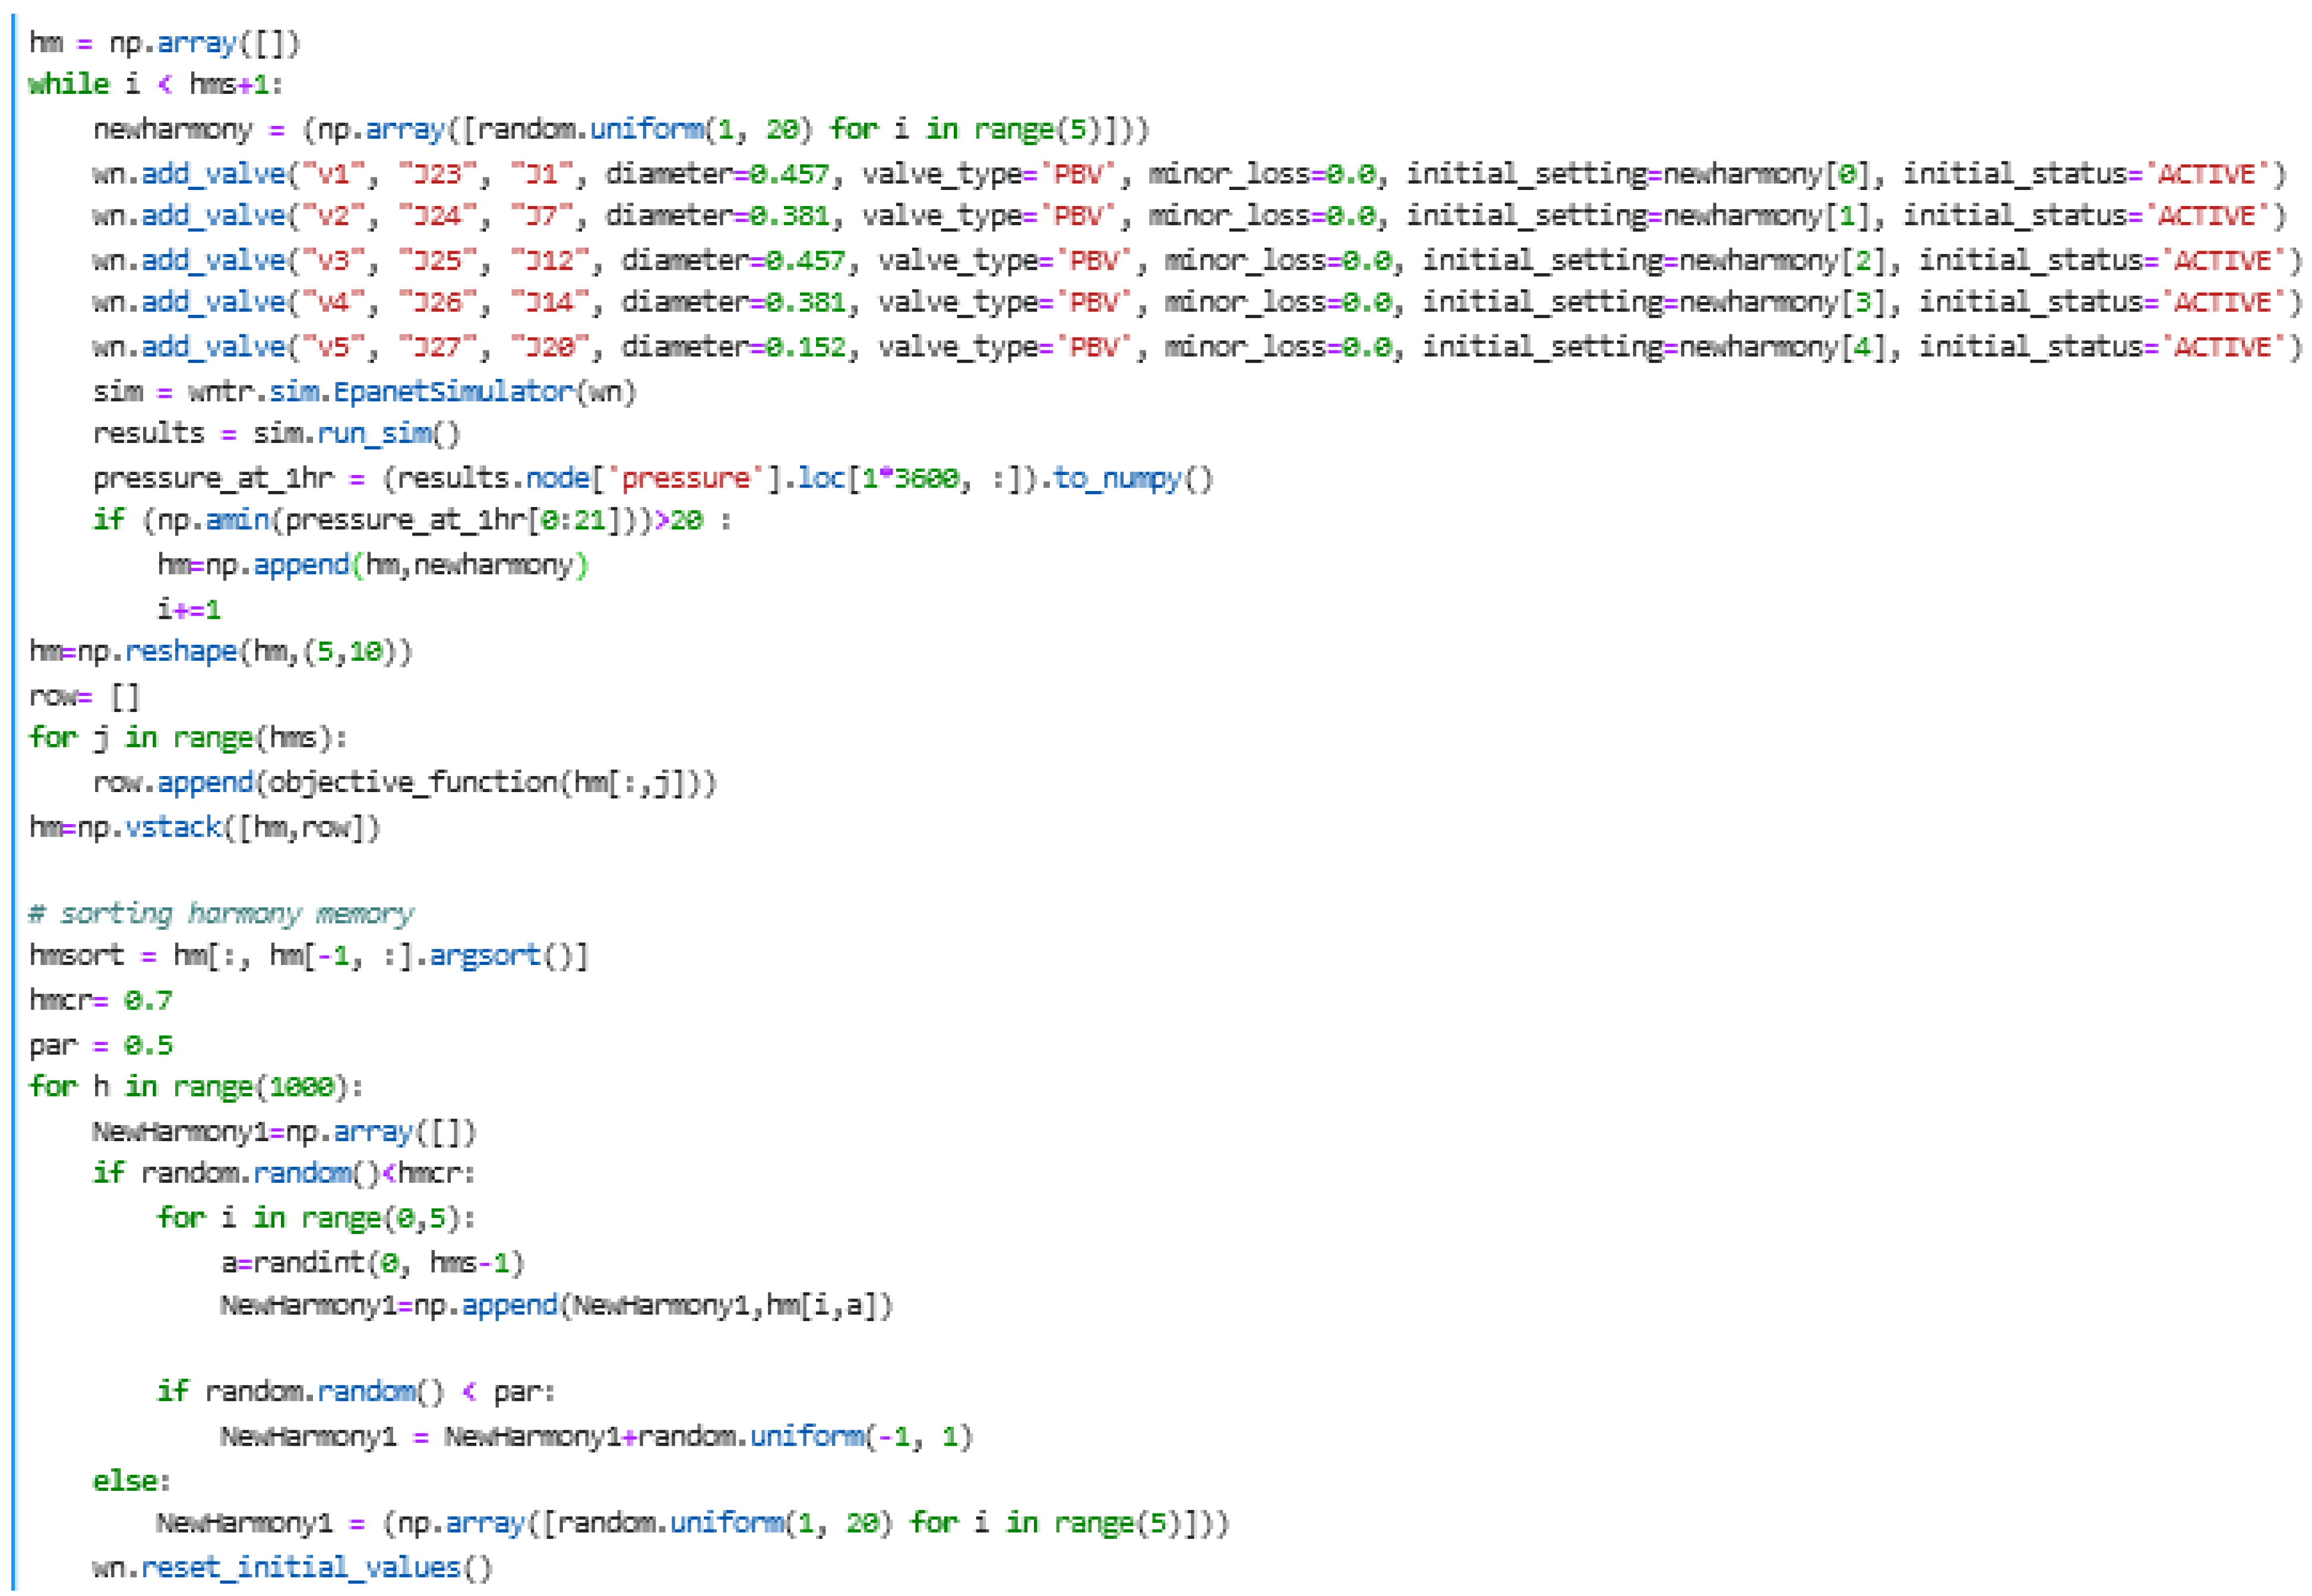
- Harmony Memory Consideration uses variables’ values already stored in the Harmony Memory. This mechanism ensures that good solutions located during the optimization process will contribute to the formation of even better solutions.
- Some of the solutions selected by the Harmony Memory Consideration mechanism will be slightly altered. This is the second mechanism of the algorithm, named Pitch Adjustment, and it is performed by selecting neighboring values of the decision variables
- The third mechanism is Improvisation, which introduces new, random elements to the solutions. The probability of introducing such random values is (100-HMCR)%. In this way, the variability of solutions is enriched.
9. Results
10. Conclusions—Discussion
Author Contributions
Funding
Institutional Review Board Statement
Informed Consent Statement
Data Availability Statement
Conflicts of Interest
Abbreviations
| WDN | Water Distribution Network |
| PRV | Pressure Reducing Valve |
| PATs | Pumps As Turbines |
| WSN | Wireless Sensor Network |
| WNTR | Water Network Tool for Resilience |
| ANN | Artificial Neural Network |
| ML | Machine Learning |
| ReLU | Rectified Linear Unit |
| BPT | Break Pressure Tank |
| PBV | Pressure Breaker Valve |
| HM | Harmony Memory |
| HSA | Harmony Search Algorithm |
| HMCR | Harmony Memory Consideration Ratio |
| HMS | Harmony Memory Size |
| PAR | Pitch Adjustment Rate |
| BET | Best Efficiency Point |
| MHP | Micro Hydro Power |
| CFD | Computational Fluid Dynamics |
References
- Gonçalves, F.V.; Costa, L.H.; Ramos, H.M. ANN for Hybrid Energy System Evaluation: Methodology and WSS Case Study. Water Resour. Manag. 2011, 25, 2295–2317. [Google Scholar] [CrossRef]
- Vicente, D.J.; Garrote, L.; Sanchez, R.; Santillan, D. Pressure management in water distribution systems: Current status, proposals, and future trends. J. Water Resour. Plan. Manag. 2015, 142, 04015061. [Google Scholar] [CrossRef]
- Nazif, S.; Karamouz, M.; Tabesh, M.; Moridi, A. Pressure Management Model for Urban Water Distribution Net-works. Water Resour. Manag. 2010, 24, 437–458. [Google Scholar] [CrossRef]
- Araujo, L.; Ramos, H.; Coelho, S. Pressure control for leakage minimization in water distribution systems man-agement. Water Resour. Manag. 2006, 20, 133–149. [Google Scholar] [CrossRef]
- Vairavamoorthy, K.; Lumbers, J. Leakage Reduction in Water Distribution Systems: Optimal Valve Control. J. Hydraul. Eng. 1998, 124, 1146–1154. [Google Scholar] [CrossRef]
- Prescott, S.L.; Ulanicki, B. Improved Control of Pressure Reducing Valves in Water Distribution Networks. J. Hydraul. Eng. 2008, 134, 56–65. [Google Scholar] [CrossRef]
- Almandoz, J.; Cabrera, E.; Arregui, F.; Cobacho, R. Leakage Assessment through Water Distribution Network Simulation. J. Water Resour. Plan. Manag. 2005, 131, 458–466. [Google Scholar] [CrossRef]
- Walsky, T.; Bezts, W.; Posluzny, E.; Weir, M.; Withman, B. Modeling leakage reduction through pressure control. J. Am. Water Works Ass. 2006, 98, 148–155. [Google Scholar] [CrossRef]
- De Paola, F.; Giugni, M.; Portolano, D. Pressure Management Through Optimal Location and Set-ting of Valves in Water Distribution Networks Using a Music-Inspired Approac. Water Resour. Manag. 2017, 31, 1517–1533. [Google Scholar] [CrossRef] [Green Version]
- De Paola, F.; Fontana, N.; Galdiero, E.; Giugni, M.; Savic, D.A.; Sorgenti degli Uberti, G. Automatic multiobjective sectori-zation of a water distribution network. Procedia Eng. 2014, 89, 1200–1207. [Google Scholar] [CrossRef] [Green Version]
- De Paola, F.; Galdiero, E.; Giugni, M. A jazz-based approach for optimal setting of pressure reducing valves in water distribution networks. Eng. Optim. 2015, 48, 727–739. [Google Scholar] [CrossRef] [Green Version]
- Liberatore, S.; Sechi, G.M. Location and calibration of valves in water distribution networks using a scatter-search meta-heuristic approach. Water Resour. Manag. 2009, 23, 1479–1495. [Google Scholar] [CrossRef]
- Page, P.R.; Abu-Mahfouz, A.M.; Mothetha, M.L. Pressure Management of Water Distribution Systems via the Remote Real-Time Control of Variable Speed Pumps. J. Water Resour. Plan. Manag. 2017, 143, 1–11. [Google Scholar] [CrossRef] [Green Version]
- Page, P.R.; Abu-Mahfouz, A.M.; Yoyo, S. Real-time adjustment of pressure to demand in water distribution systems: Parameter-less P-controller algorithm. In Proceedings of the 12th International Conference on Hydroinformatics, HIC, Incheon, Korea, 21–26 August 2016. [Google Scholar]
- Carravetta, A.; Fecarotta, O.; Del Gidice, G.; Ramos, H. Energy recovery in water systems by PATs: A comparisons among the different installation schemes. Procedia Eng. 2014, 70, 275–284. [Google Scholar] [CrossRef] [Green Version]
- Carravetta, A.; Fecarotta, O.; Martino, R.; Antipodi, L. PAT efficiency variation with design parameters. Procedia Eng. 2014, 70, 285. [Google Scholar] [CrossRef] [Green Version]
- Filion, Y.; MacLean, H.; Karney, B. Life Cycle Energy Analysis of a Water Distribution System. J. Infrastruct. Syst. 2014, 10, 120–130. [Google Scholar] [CrossRef] [Green Version]
- Sammartano, V.; Aricò, C.; Carravetta, A.; Fecarotta, O.; Tucciarelli, T. Banki-michell optimal design by computational fluid dynamics testing and hydrodynamic analysis. Energies 2013, 6, 2362–2385. [Google Scholar] [CrossRef]
- Paish, O. Small hydro power: Technology and current status. Renew. Sustain. Energy Rev. 2002, 6, 537–556. [Google Scholar] [CrossRef]
- Ramos, H.M.; Mello, M.; De, P.K. Clean power in water supply systems as a sustainable solution: From planning to practical implementation. Water Sci. Technol. Water Supply 2010, 10, 39–49. [Google Scholar] [CrossRef]
- Lugauer, F.J.; Kainz, J.; Gaderer, M. Techno-Economic Efficiency Analysis of Various Operating Strategies for Micro-Hydro Storage Using a Pump as a Turbine. Energies 2021, 14, 425. [Google Scholar] [CrossRef]
- Lugauer, F.J.; Kainz, J.; Gehlich, E.; Gaderer, M. Roadmap to Profitability for a Speed-Controlled Micro-Hydro Storage System Using Pumps as Turbines. Sustainability 2022, 14, 653. [Google Scholar] [CrossRef]
- Stefanizzi, M.; Capurso, T.; Balacco, G.; Binetti, M.; Camporeale, S.M.; Torresi, M. Selection, control and techno-economic feasibility of Pumps as Turbines in Water Distribution Networks. Renew. Energy 2020, 162, 1292–1306. [Google Scholar] [CrossRef]
- Stefanizzi, M.; Capurso, T.; Balacco, G.; Binetti, M.; Torresi, M.; Camporeale, S.M. Pump as turbine for throttling energy recovery in water distribution networks. AIP Conf. Proc. 2019, 2191, 020142. [Google Scholar] [CrossRef]
- Kramer, M.; Terheiden, K.; Wieprecht, S. Pumps as turbines for efficient energy recovery in water supply networks. Renew. Energy 2018, 122, 17–25. [Google Scholar] [CrossRef] [Green Version]
- Novara, D.; Carravetta, A.; McNabola, A.; Ramos, H.M. Cost Model for Pumps as Turbines in Run-of-River and In-Pipe Microhydropower Applications. J. Water Resour. Plan. Manag. 2019, 145, 04019012. [Google Scholar] [CrossRef]
- Chacón, M.C.; Díaz, J.A.R.; Morillo, J.G.; McNabola, A. Hydropower energy recovery in irrigation networks: Validation of a methodology for flow prediction and pump as turbine selection. Renew. Energy 2019, 147, 1728–1738. [Google Scholar] [CrossRef]
- García, I.F.; Novara, D.; Mc Nabola, A. A Model for Selecting the Most Cost-Effective Pressure Control Device for More Sustainable Water Supply Networks. Water 2019, 11, 1297. [Google Scholar] [CrossRef] [Green Version]
- Knapp, R.T. Complete characteristics of centrifugal pumps and their use in the prediction of transient behaviour. Trans. ASME 1937, 59, 683–689. [Google Scholar]
- Balacco, G. Performance Prediction of a Pump as Turbine: Sensitivity Analysis Based on Artificial Neural Networks and Evolutionary Polynomial Regression. Energies 2018, 11, 3497. [Google Scholar] [CrossRef] [Green Version]
- Rossi, M.; Renzi, M. A general methodology for performance prediction of pumps-as-turbines using Artificial Neural Networks. Renew. Energy 2018, 128, 265–274. [Google Scholar] [CrossRef]
- Liu, M.; Tan, L.; Cao, S. Theoretical model of energy performance prediction and BEP determination for centrifugal pump as turbine. Energy 2019, 172, 712–732. [Google Scholar] [CrossRef]
- Venturini, M.; Alvisi, S.; Simani, S.; Manservigi, L. Comparison of Different Approaches to Predict the Performance of Pumps as Turbines (PATs). Energies 2018, 11, 1016. [Google Scholar] [CrossRef] [Green Version]
- Venturini, M.; Manservigi, L.; Alvisi, S.; Simani, S. Development of a physics-based model to predict the performance of pumps as turbines. Appl. Energy 2018, 231, 343–354. [Google Scholar] [CrossRef]
- Morabito, A.; Hendrick, P. Pump as turbine applied to micro energy storage and smart water grids: A case study. Appl. Energy 2019, 241, 567–579. [Google Scholar] [CrossRef]
- Barbarelli, S.; Amelio, M.; Florio, G. Experimental activity at test rig validating correlations to select pumps running as turbines in microhydro plants. Energy Convers. Manag. 2017, 149, 781–797. [Google Scholar] [CrossRef]
- Hamlehdar, M.; Yousefi, H.; Noorollahi, Y.; Mohammadi, M. Energy recovery from water distribution networks using micro hydropower: A case study in Iran. Energy 2022, 252, 124024. [Google Scholar] [CrossRef]
- Da Silva, B.L.A.; Lafay, J.-M.S.; Tofoli, F.L.; Scartazzini, L.S. Case Study: Hydroelectric Generation Employing the Water Distribution Network in Pato Branco, Brazil. Proc. IASTED Int. Conf. Power Energy Syst. Eur. 2011, 2011, 50–54. [Google Scholar] [CrossRef]
- Giugni, M.; Fontana, N.; Portolano, D. Energy saving policy in water distribution networks. Renew. Energy Power Qual. J. 2009, 1, 733–738. [Google Scholar] [CrossRef]
- Corcoran, L.; McNabola, A.; Coughlan, P. Energy recovery potential of the Dublin region water supply network. In Water Congress on Water; Climate and Energy: Dublin, Ireland, 2012. [Google Scholar]
- Möderl, M.; Sitzenfrei, R.; Mair, M.; Jarosch, H.; Rauch, W. Identifying Hydropower Potential in Water Distribution Systems of Alpine Regions. In World Environmental and Water Resources Congress 2012: Crossing Boundaries; ASCE: Reston, VA, USA, 2012. [Google Scholar]
- Balacco, G.; Binetti, M.; Capurso, T.; Stefanizzi, M.; Torresi, M.; Piccinni, A.F. Pump as Turbine for the Energy Recovery in a Water Distribution Network: Two Italian (Apulian) Case Studies. Environ. Sci. Proc. 2020, 2, 1. [Google Scholar] [CrossRef]
- Zaman, D.; Tiwari, M.K.; Gupta, A.K.; Sen, D. Performance indicators-based energy sustainability in urban water distribution networks: A state-of-art review and conceptual framework. Sustain. Cities Soc. 2021, 72, 103036. [Google Scholar] [CrossRef]
- Ávila, C.A.M.; Sánchez-Romero, F.-J.; López-Jiménez, P.A.; Pérez-Sánchez, M. Optimization tool to improve the management of the leakages and recovered energy in irrigation water systems. Agric. Water Manag. 2021, 258, 107223. [Google Scholar] [CrossRef]
- Giudicianni, C.; Herrera, M.; di Nardo, A.; Carravetta, A.; Ramos, H.M.; Adeyeye, K. Zero-net energy management for the monitoring and control of dynamically-partitioned smart water systems. J. Clean. Prod. 2019, 252, 119745. [Google Scholar] [CrossRef]
- Fontana, N.; Giugni, M.; Glielmo, L.; Marini, G.; Zollo, R. Hydraulic and Electric Regulation of a Prototype for Real-Time Control of Pressure and Hydropower Generation in a Water Distribution Network. J. Water Resour. Plan. Manag. 2018, 144, 4018072. [Google Scholar] [CrossRef]
- Creaco, E.; Galuppini, G.; Campisano, A.; Ciaponi, C.; Pezzinga, G. A Bi-Objective Approach for Optimizing the Installation of PATs in Systems of Transmission Mains. Water 2020, 12, 330. [Google Scholar] [CrossRef] [Green Version]
- García, A.M.; Gallagher, J.; Chacón, M.C.; Mc Nabola, A. The environmental and economic benefits of a hybrid hydropower energy recovery and solar energy system (PAT-PV), under varying energy demands in the agricultural sector. J. Clean. Prod. 2021, 303, 127078. [Google Scholar] [CrossRef]
- Mousavi, N.; Kothapalli, G.; Habibi, D.; Lachowicz, S.W.; Moghaddam, V. A real-time energy management strategy for pumped hydro storage systems in farmhouses. J. Energy Storage 2020, 32, 101928. [Google Scholar] [CrossRef]
- Jowitt, P.W.; Xu, C. Optimal valve control in water-distribution networks. J. Water Res. Pl-ASCE 1990, 116, 455–472. [Google Scholar] [CrossRef]
- Dai, P.D.; Li, P. Optimal Pressure Regulation in Water Distribution Systems Based on an Extended Model for Pressure Reducing Valves. Water Resour. Manag. 2016, 30, 1239–1254. [Google Scholar] [CrossRef]
- Cao, H.; Hopfgarten, S.; Ostfeld, A.; Salomons, E.; Li, P. Simultaneous Sensor Placement and Pressure Reducing Valve Localization for Pressure Control of Water Distribution Systems. Water 2019, 11, 1352. [Google Scholar] [CrossRef] [Green Version]
- Sterling, M.; Bargiela, A. Leakage reduction by optimised control of valves in water networks. Trans. Inst. Meas. Control 1984, 6, 293–298. [Google Scholar] [CrossRef]
- Nguyen, K.D.; Dai, P.D.; Vu, D.Q.; Cuong, B.M.; Tuyen, V.P.; Li, P. A MINLP Model for Optimal Localization of Pumps as Turbines in Water Distribution Systems Considering Power Generation Constraints. Water 2020, 12, 1979. [Google Scholar] [CrossRef]
- WSAA. Water Supply Code of Australia, Melbourne Retail Water Agencies; WSAA: Melbourne, Australia, 2002. [Google Scholar]
- Trifunovic, N. Introduction to Urban Water Distribution: Unesco-IHE Lecture Note Series, 1st ed.; CRC Press: Boca Raton, FL, USA, 2006. [Google Scholar] [CrossRef]
- Smith, M.A.; Shneiderman, B.; Milic-Frayling, N.; Mendes Rodrigues, E.; Barash, V.; Dunne, C.; Capone, T.; Perer, A.; Gleave, E. Analyzing Social Media Networks with NodeXL, 2nd ed.; Morgan Kaufmann: Burlington, MA, USA, 2020. [Google Scholar]
- Hagberg, A.; Swart, P.; Chult, D.S. Exploring network structure, dynamics, and function using NetworkX. In Proceedings of the 7th Python in Science Conference (SciPy2008), Pasadena, CA, USA, 21 August 2008; pp. 11–15. [Google Scholar]
- Klise, K.A.; Hart, D.; Moriarty, D.M.; Bynum, M.L.; Murray, R.; Burkhardt, J.; Haxton, T. Water Network Tool for Resilience (WNTR) User Manual; U.S. Environmental Protection Agency Technical Report, EPA/600/R-17/264; Sandia National Lab.: Albuquerque, NM, USA, 2017; 47p. [Google Scholar] [CrossRef]
- Kucukali, S. Municipal water supply dams as a source of small hydropower in Turkey. Renew. Energy 2010, 35, 2001–2007. [Google Scholar] [CrossRef]
- Kougias, I.; Patsialis, T.; Zafirakou, A.; Theodossiou, N. Exploring the potential of energy recovery using micro hydropower systems in water supply systems. Water Util. J. 2014, 7, 25–33. [Google Scholar]
- Rossi, M.; Nigro, A.; Renzi, M. Experimental and numerical assessment of a methodology for performance prediction of Pumps-as-Turbines (PaTs) operating in off-design conditions. Appl. Energy 2019, 248, 555–566. [Google Scholar] [CrossRef]
- Yang, S.-S.; Derakhshan, S.; Kong, F.-Y. Theoretical, numerical and experimental prediction of pump as turbine performance. Renew. Energy 2012, 48, 507–513. [Google Scholar] [CrossRef]
- Williams, A. The turbine performance of centrifugal pumps: A Comparison of prediction methods. J. Power Energy 1994, 208, 59–66. [Google Scholar] [CrossRef]
- Krivchenko, G. Hydraulic Machines: Turbines and Pumps; Lewis: Boca Raton, FL, USA, 1994. [Google Scholar]
- Wang, T.; Kong, F.; Yang, S.; Fu, Y. Numerical Study on Hydraulic Performances of Pump as Turbine with Forward-Curved Blades. In Proceedings of the Fluids Engineering Division Summer Meeting. American Society of Mechanical Engineers, Chicago, IL, USA, 3–7 August 2014. [Google Scholar]
- Plua, F.; Hidalgo, V.; López-Jiménez, P.; Pérez-Sánchez, M. Analysis of Applicability of CFD Numerical Studies Applied to Problem When Pump Working as Turbine. Water 2021, 13, 2134. [Google Scholar] [CrossRef]
- Yang, W.; Xiao, R. Multiobjective Optimization Design of a Pump–Turbine Impeller Based on an Inverse Design Using a Combination Optimization Strategy. J. Fluids Eng. 2013, 136, 014501. [Google Scholar] [CrossRef]
- Zhu, B.; Wang, X.; Tan, L.; Zhou, D.; Zhao, Y.; Cao, S. Optimization design of a reversible pump–turbine runner with high efficiency and stability. Renew. Energy 2015, 81, 366–376. [Google Scholar] [CrossRef]
- Capurso, T.; Stefanizzi, M.; Pascazio, G.; Camporeale, S.M.; Torresi, M. Dependency of the slip phenomenon on the inertial forces inside radial runners. AIP Conf. Proc. 2019, 2191, 020034. [Google Scholar] [CrossRef]
- Jain, S.V.; Patel, R. Investigations on pump running in turbine mode: A review of the state-of-the-art. Renew. Sustain. Energy Rev. 2014, 30, 841–868. [Google Scholar] [CrossRef]
- Woo, Z.; Hoon, J.; Loganathan, G.V. A New Heuristic Optimization Algorithm: Harmony Search. Simulation 2001, 76, 60–68. [Google Scholar]
- Bermúdez, J.; López-Estrada, F.; Besançon, G.; Torres, L.; Santos-Ruiz, I. Leak-Diagnosis Approach for Water Distribution Networks based on a k-NN Classification Algorithm. IFAC-PapersOnLine 2020, 53, 16651–16656. [Google Scholar] [CrossRef]



| Subject | Case Study Location | Reference |
|---|---|---|
| A technical overview of the design and the outcomes of a first-of-its-kind Pumped Hydro Energy Storage (PHES) micro facility | Froyennes, Belgium | Morabito (2019) [35] |
| Experimental activity to select pumps running as turbines in micro-hydro plants | Cosenza, Italy | Barbarelli (2017) [36] |
| Energy recovery from replacing PRVs with MHPs in the WDN | Tehran, Iran | Hamlehdar (2022) [37] |
| Determines the potential of the water supply and effluent treatment system for generating electricity | Pato Branco, Brazil | Da Silva BLA (2011) [38] |
| Control pressure within a district of Naples water distribution network, showing large potential revenues of PATs | Napoli, Italy | Giugni M. (2009) [39] |
| Telemetry data from control valves and pressure-reducing valves within the Dublin city water supply network are analyzed to identify suitable locations for energy recovery | Dublin, Ireland | Corcoran L. (2012) [40] |
| Identifying Hydropower Potential of Alpine Regions | Carinthia, Austria | M. Möderl (2012) [41] |
| Economic feasibility analysis of substituting existing pressure reduction valves (PRVs) with pumps used as turbines (PaTs) in two real Italian water distribution networks (WDN) | Murgia—Central Apulia, Italy | Balacco (2020) [42] |
| Proposes an energy sustainability score for benchmarking WDNs | Kolkata, India | Zaman (2021) [43] |
| influence of the leakages in energy recovery systems at irrigation networks | Vallada. Spain | Carlos Andrés Macías Ávila (2021) [44] |
| Proposes a framework for WDN by reconfiguring the original network layout into (dynamic) district metered areas | Parete, Italy | Giudicianni (2020) [45] |
| Real-Time Control of Pressure and Hydropower Generation | Benevento, Italy | Fontana (2018) [46] |
| Genetic algorithm to optimize the regulation of PAT settings. | Catania, Italy | Creaco (2020) [47] |
| A hybrid PAT with solar pilot system and a traditional diesel generator in an off-grid farm. | Cordoba, Spain | García (2021) [48] |
| Link ID | Diameter (mm) | Length (m) | Link ID | Diameter (mm) | Length (m) | Link ID | Diameter (mm) | Length (m) |
|---|---|---|---|---|---|---|---|---|
| Pipe P1 | 457 | 606 | Pipe P13 | 305 | 249 | Pipe P25 | 381 | 1097 |
| Pipe P2 | 457 | 1930 | Pipe P14 | 305 | 3383 | Pipe P26 | 229 | 914 |
| Pipe P3 | 305 | 5150 | Pipe P15 | 152 | 1406 | Pipe P27 | 152 | 832 |
| Pipe P4 | 152 | 326 | Pipe P16 | 229 | 931 | Pipe P28 | 305 | 822 |
| Pipe P5 | 229 | 844 | Pipe P17 | 152 | 2334 | Pipe P29 | 229 | 1072 |
| Pipe P6 | 381 | 500 | Pipe P18 | 457 | 1600 | Pipe P30 | 152 | 864 |
| Pipe P7 | 152 | 1274 | Pipe P19 | 457 | 762 | Pipe P31 | 152 | 411 |
| Pipe P8 | 229 | 1115 | Pipe P20 | 475 | 1767 | Pipe P32 | 152 | 711 |
| Pipe P9 | 381 | 615 | Pipe P21 | 381 | 1014 | Pipe P33 | 152 | 2689 |
| Pipe P10 | 229 | 300 | Pipe P22 | 457 | 454 | Pipe P34 | 229 | 542 |
| Pipe P11 | 381 | 743 | Pipe P23 | 229 | 2782 | Pipe P35 | 229 | 1996 |
| Pipe P12 | 229 | 443 | Pipe P24 | 381 | 304 | Pipe P36 | 229 | 777 |
| Pipe P37 | 229 | 701 |
| Variables | Constrains | Objective Function |
|---|---|---|
| Node/Available Pressure (m) | 1 | 2 | 3 | 4 | 5 | 6 | 7 | 8 | 9 | 10 | 11 | 12 |
|---|---|---|---|---|---|---|---|---|---|---|---|---|
| 1 | 12.94 | 18.14 | 16.98 | 9.22 | 17.20 | 14.24 | 15.20 | 12.37 | 18.75 | 11.48 | 5.94 | 15.67 |
| 7 | 17.16 | 5.26 | 16.92 | 10.23 | 16.94 | 10.12 | 10.20 | 11.98 | 11.79 | 7.19 | 6.90 | 11.98 |
| 12 | 8.18 | 13.67 | 12.36 | 14.73 | 14.42 | 13.79 | 16.13 | 14.65 | 14.48 | 5.60 | 10.63 | 12.01 |
| 14 | 16.88 | 9.44 | 6.68 | 16.25 | 6.97 | 11.76 | 9.08 | 12.71 | 19.29 | 17.67 | 18.48 | 4.76 |
| 20 | 6.96 | 17.04 | 16.35 | 14.41 | 14.97 | 8.67 | 6.64 | 15.89 | 12.41 | 10.73 | 16.20 | 8.84 |
| Sum | 62.11 | 63.55 | 69.29 | 64.84 | 70.50 | 58.57 | 57.25 | 67.61 | 76.72 | 52.66 | 58.14 | 53.26 |
| Node/Available Pressure (m) | 13 | 14 | 15 | 16 | 17 | 18 | 19 | 20 | 21 | 22 | 23 | 24 |
|---|---|---|---|---|---|---|---|---|---|---|---|---|
| 1 | 17.23 | 15.46 | 16.23 | 1.13 | 18.23 | 6.53 | 17.80 | 10.25 | 13.16 | 13.95 | 9.61 | 16.56 |
| 7 | 15.75 | 19.05 | 12.35 | 17.90 | 7.57 | 19.18 | 17.01 | 13.52 | 14.59 | 13.87 | 17.33 | 12.61 |
| 12 | 13.26 | 18.48 | 9.89 | 18.33 | 8.23 | 16.39 | 2.11 | 5.14 | 14.97 | 18.19 | 11.39 | 14.87 |
| 14 | 5.47 | 4.72 | 12.14 | 9.25 | 18.19 | 17.95 | 17.05 | 16.62 | 17.06 | 10.97 | 18.12 | 15.57 |
| 20 | 14.00 | 18.85 | 10.75 | 15.87 | 17.77 | 2.03 | 2.62 | 12.72 | 8.10 | 12.85 | 8.39 | 7.98 |
| Sum | 65.71 | 76.57 | 61.36 | 62.47 | 69.98 | 62.08 | 56.59 | 58.24 | 67.88 | 69.83 | 64.83 | 67.59 |
Publisher’s Note: MDPI stays neutral with regard to jurisdictional claims in published maps and institutional affiliations. |
© 2022 by the authors. Licensee MDPI, Basel, Switzerland. This article is an open access article distributed under the terms and conditions of the Creative Commons Attribution (CC BY) license (https://creativecommons.org/licenses/by/4.0/).
Share and Cite
Karakatsanis, D.; Theodossiou, N. Smart Hydropower Water Distribution Networks, Use of Artificial Intelligence Methods and Metaheuristic Algorithms to Generate Energy from Existing Water Supply Networks. Energies 2022, 15, 5166. https://doi.org/10.3390/en15145166
Karakatsanis D, Theodossiou N. Smart Hydropower Water Distribution Networks, Use of Artificial Intelligence Methods and Metaheuristic Algorithms to Generate Energy from Existing Water Supply Networks. Energies. 2022; 15(14):5166. https://doi.org/10.3390/en15145166
Chicago/Turabian StyleKarakatsanis, Diamantis, and Nicolaos Theodossiou. 2022. "Smart Hydropower Water Distribution Networks, Use of Artificial Intelligence Methods and Metaheuristic Algorithms to Generate Energy from Existing Water Supply Networks" Energies 15, no. 14: 5166. https://doi.org/10.3390/en15145166
APA StyleKarakatsanis, D., & Theodossiou, N. (2022). Smart Hydropower Water Distribution Networks, Use of Artificial Intelligence Methods and Metaheuristic Algorithms to Generate Energy from Existing Water Supply Networks. Energies, 15(14), 5166. https://doi.org/10.3390/en15145166


