Abstract
As a critical node of the global transportation network, ports have great potential in promoting transportation emission reduction. Promoting the low-carbon transition of ports by using clean energy is effective. Using hydrogen energy in automated container terminals (ACTs) has become popular in port emission-reduction research. The research object is the main port equipment—the automated rail-mounted container gantry crane (ARMG). This research designs a staged investment decision-making scheme for ARMGs’ hydrogen energy transition. The Internet of Things (IoT) architecture in ACTs collects ARMG equipment operation and carbon emission data. It provides a basis for data acquisition in ARMGs’ hydrogen energy transition. Furthermore, ports can adopt big data technology to analyze the correlation between equipment operation and carbon emissions. Finally, the digital twin platform will visualize the ARMG equipment operation and carbon emission behavior to remote operators. These advanced technologies can achieve status monitoring and simulation prediction, which will support ARMGs’ hydrogen energy transition. However, the ARMGs’ hydrogen energy transition has a long cycle, large investment, and strong variability. Ports should make staged investment decisions based on the digital twin platform’s status monitoring and simulation prediction analysis results. Therefore, this research establishes an optimization model for ARMGs’ low-carbon transition investment decision based on the real options method, and analyzes the staged investment scale and timing of ARMGs’ hydrogen energy transition. The results provide a popularized decision-making scheme for the low-carbon transition of ports’ equipment, which could facilitate the low-carbon transition of ports’ equipment.
1. Introduction
Ports are an important node in the globally integrated transport network. The production and operation activities of ports consume large amounts of energy, which results in serious carbon dioxide emission problems [1]. With the increasingly serious problem of climate change, ports have put forward higher requirements for their emission reduction performance [2,3]. Port equipment emissions are the main source of carbon dioxide emissions in port areas. Therefore, reducing the emissions of port equipment has become popular in the port emission reduction research field [4].
Currently, the research on port equipment emission reduction has mainly included operation scheduling optimization and the low-carbon transition of port equipment [5]. In terms of the research on port operation scheduling optimization, researchers have adopted a series of optimization methods to improve the equipment operation efficiency, which can reduce equipment energy consumption during the waiting time and achieve port emission reduction [6]. Optimizing equipment operation can only alleviate ports’ rapidly growing energy demand in the short term. Developing a low-carbon transition for port equipment and replacing traditional energy with clean energy is a relatively more effective emission-reduction measure than optimizing equipment operation scheduling [7]. Therefore, it is necessary to focus on research on changing the type of port equipment consuming energy [8]. In practice, some ports (such as Qingdao Port, Tianjin Port, Port of Long Beach, and so on) have begun to transition the energy consumption of automated rail-mounted container gantry cranes (ARMGs), trucks, and other equipment from traditional energy to clean energy [9]. As the important equipment inside the port, the emission-reduction performance brought by the transition of ARMGs’ energy from electric energy to hydrogen energy is remarkable. Therefore, this research focuses on the low-carbon transition of ARMGs.
The hydrogen-powered ARMG is an emerging form of equipment; ARMGs’ hydrogen energy transition has a long cycle, large investment, and strong variability. The investment process will occupy a large amount of port funds. It will have a significant impact on the future cash flow of the port. The late recovery of investment is uncertain when investment occurs. Therefore, it is necessary to analyze the investment strategy for hydrogen-energy ARMGs in detail. In other words, the port should make phased investment decisions in a complex environment, which could help scientifically promote the process of equipment transition.
However, in the current academic research, little attention has been paid to the investment in hydrogen-powered ARMGs. This research aims to provide a popularized investment decision-making scheme for the low-carbon transition of ports’ equipment. The research takes ARMGs as the research object and puts forward an optimization model of phased investment decisions for the low-carbon transition of traditional ARMGs to hydrogen-powered ARMGs. We also discuss the scale and timing of phased investment for hydrogen-powered ARMGs. Taking Qingdao Port as a case study, this paper describes the specific scenario of the transition of traditional ARMGs to hydrogen-powered ARMGs in Qingdao Port. Then, we identify the optimal strategic path for the low-carbon transition of ARMGs in Qingdao Port through the proposed investment decision model. The case study results could assist employees in making optimization decisions and help the low-carbon transition of ports’ internal infrastructure.
The outline of this paper is as follows: Section 2 describes the current research status. Section 3 presents the method used in ARMGs’ low-carbon transition investment decision. Section 4 describes the results of the case study and presents a sensitivity analysis. Section 5 presents the conclusions and prospects of this paper.
2. Literature Review
In the traditional port operation mode, a series of traditional fossil fuels, represented by diesel oil, are the main energy source of operation equipment. These fossil fuels cause serious carbon dioxide emissions during the combustion process [10]. Subsequently, some ports have considered the application of electrical energy, but this method did not change the port emission problem because, in the traditional form of power supply, a large amount of power consumption in the port will cause a huge burden to the public utility transmission and distribution network. In addition, it will cause the transfer of port emissions to power plants [11]. Many industries have begun to apply and develop renewable energy because of its emission-reduction advantages. The emission reduction of port operation equipment has gradually focused on the application of renewable energy. Some ports consider it as an alternative fuel for operation equipment [9]. As renewable energy can improve energy efficiency and achieve emission reduction, some scholars have analyzed a series of application scenarios for renewable energy, such as wind energy [12], solar energy [13], wave energy [14], and hydrogen energy [15]. However, some types of renewable energy (such as wind and solar energy) have uncertainties in the energy supply. These uncertainties are caused by the different geography of the port. Hydrogen energy can avoid the above problems, and hydrogen energy can be stored in safe, efficient, economical, and environmentally friendly processes. Therefore, hydrogen energy has a good application prospect in ports’ low-carbon transition [16,17].
For the low-carbon transition of port operation equipment, the early research mainly focused on the technical transition of energy consumption by port cranes and other equipment. Oil-to-electricity technology [18] and LNG alternative fuel [19] are the most important transition methods. With the gradual development of hydrogen energy technology, many ports have launched hydrogen energy application practices. These ports carry out hydrogen-powered transitions for major mechanical equipment, such as automated rail-mounted gantry cranes (ARMGs). In this way, the low-carbon transition of port machinery and equipment can be achieved. As important mechanical equipment in ports, ARMGs are the main source of emissions in the operation area. It is of great significance for the port to carry out the low-carbon transition to hydrogen-powered ARMGs because it can improve the energy conservation and emission reduction performance of the port [20]. The advanced technology of ports provides the technical foundation for ARMGs’ hydrogen-energy low-carbon transition. Digital technology has a positive impact on energy conservation, emission reduction, and sustainable development [21]. Ports can use IoT technology to capture the carbon emission data of hydrogen-powered ARMGs. Subsequently, ports can use big data technology to analyze the equipment’s carbon emissions and other relevant data in real-time. This method accurately depicts the equipment activities and carbon emission behavior of hydrogen-powered ARMGs. Finally, ports can use the digital twin platform to accurately simulate the activities and carbon emissions of the hydrogen-powered ARMGs. The digital twin platform visually presents these situations to remote operators and provides decision support for operators. The port equipment transformation experience and advanced technology provide a certain research basis for port ARMGs’ transformation. However, the hydrogen energy transition of ARMGs is a process with a long cycle, large investment, and strong variability. Therefore, ports need to invest in hydrogen-energy ARMGs in stages based on their current situation and development planning.
Regarding investment decision-making, the early investment analysis and research usually used the net present value (NPV) method. The NPV method calculates the difference between the present value of the future net capital flow and the present value of the original investment. For example, some scholars used NPV to analyze energy production and consumption in reverse logistics [22] or make preventive maintenance decisions for port facilities [23], as well as investment in ship emission-reduction equipment [24]. However, the limitations of the NPV method in investment decision-making become very obvious with the deepening of investment problems. The NPV method cannot solve the problems of random factors, uncertainty, and management flexibility involved in investment [25]. The limitations of the NPV method hinder the phased introduction of new technologies [26]. The investment related to renewable energy has the characteristics of a long investment cycle, high uncertainty, and complex investment factors [27]. This type of investment is relatively risky [28]. At this point, the NPV method is no longer applicable.
Therefore, the later research mainly adopted the real options method. The real options method can quantify management flexibility under uncertainty and adapt to the characteristics of phased investment [29]. The application of real options in projects with a long economic life and high investment value can effectively reduce the investment risk to investors [30]. At present, some scholars have begun to use the real options method to evaluate investment decisions in energy projects [31,32]. Specifically, real options models can be divided into continuous-time models and discrete-time models [33]. Continuous-time models mainly include analytical equations (Black Scholes model), stochastic differential equations, and Monte Carlo simulation [34]. Discrete-time models mainly include a binomial tree, trinomial tree, and multinomial tree [35,36]. As the basis of the trinomial tree and multinomial tree models, the binomial tree assumes that the price of the underlying asset changes only in two ways: up or down [37]. The binomial tree model has a good application effect in the evaluation and investment analysis of emission-reduction projects in the shipping industry [38]. The trinomial tree model can be improved based on the binomial tree. The trinomial tree model improves the calculation accuracy and convergence speed [39]. On this basis, the multinomial tree has been further developed and achieved better performance for investment decision analysis [40]. For the long-term and multi-stage port hydrogen energy ARMG transition investment, the multi-tree model is more suitable.
In conclusion, the application of traditional fossil fuels in port operation equipment has caused serious carbon dioxide emission problems. Carrying out the low-carbon transformation of port operation equipment is an inevitable choice based on the background of global emission reduction. As clean and renewable energy, hydrogen energy has shown good emission reduction potential and application prospects in port operations. The automated rail crane is the main loading and unloading equipment in port operations, and it is also an important source of port equipment emissions. The hydrogen energy transition of ARMGs is important to achieve the emission reduction of port operations. The real options method has a good application effect in quantifying uncertainty and adapting to phased investment. The discrete-time multinomial tree model in real options has a good matching effect on the investment decision of the hydrogen energy automatic rail crane studied. Based on the above considerations, this research adopts a discrete-time multinomial tree model to analyze the phased investment in the transition of port hydrogen-powered ARMGs.
3. Hydrogen-Powered ARMGs Investment Decision Model
As emerging clean-energy-powered equipment, the investment decision problem of hydrogen-powered ARMGs has many uncertain factors, such as the change in the technology maturity of equipment, the fluctuation in the hydrogen energy use cost, and the incentive policy of regional energy saving and emission reduction. This section obtains the phased expected transition process of equipment and visualizes the potential decision of port equipment investment by establishing a decision tree model. Subsequently, the uncertain factors affecting port investment decisions are described in detail, and the impact of uncertainty factors on port equipment investment decisions is discussed in depth. Finally, this section aims to find the optimal hydrogen-powered ARMGs investment decision-making scheme, which will provide a reference for the low-carbon transition investment of port equipment.
The hydrogen-powered ARMGs investment decision model has five steps. The first step defines the scene of the low-carbon transition process of port ARMGs. The realization probability of the phased transition process of equipment was obtained by interviewing relevant experts in the port field. Then, the phased expected transition process of equipment over time could be calculated. The second step adopts the multi-tree method to establish the decision tree of the hydrogen-powered ARMG investment strategy. The purpose of this step is to visualize the potential decision sequence of port equipment transition investment. In the decision tree, the node represents the timing of making a decision, and the connection line between nodes represents the potential decision. The third step defines a cost–benefit function, which assigns costs and benefits to each future potential decision. The fourth step finds the final decision path of cost–benefit in all potential decision sequences by backward introduction. The fifth step evaluates the impact of uncertain factors currently considered through sensitivity analysis, which could describe the impact of these uncertain factors on the decision-making results in depth.
The detailed workflow is shown in Figure 1.
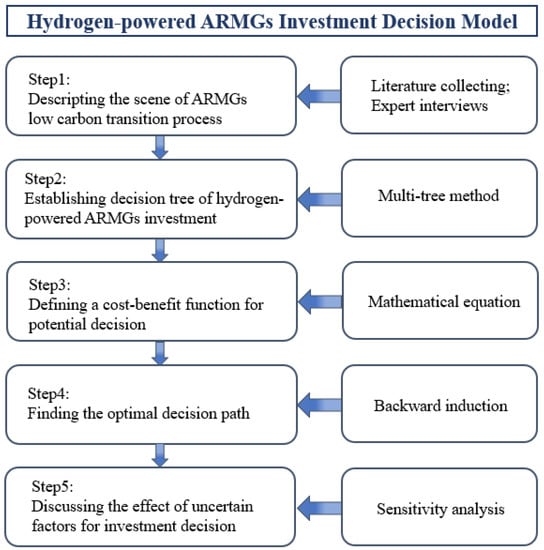
Figure 1.
The specific process of the five steps for the hydrogen-powered ARMGs investment decision model.
3.1. Scene of the ARMGs Low-Carbon Transition Process
New energy equipment is usually divided into several stages of transition investment. The first stage is a small-scale test (pre-commercialization) stage, followed by an early commercial stage, and finally, new energy equipment gradually replaces traditional equipment until complete commercialization [41].
As shown in Table 1, this research divides the whole process of hydrogen ARMG investment into four stages, including the initial number, of the total, of the total, and the total number. The probability results of the equipment transition process are given under the general situation through expert interviews. Then, the expected stage of the transition process in different time periods will be calculated, which could be used as a reference to determine the equipment transition process. The calculation method of the expected stage transition process is shown in Formula (1).

Table 1.
The prediction probability of phased equipment investment.
Where is the beginning time of equipment transition investment; is the phased investment time period; is the initial number of hydrogen-powered ARMGs in the port at ; is the total number of ARMGs in the port; and is the expected transition process.
3.2. Establishing a Decision Tree of Hydrogen-Powered ARMGs Investment
Figure 2 shows the complete decision tree of the hydrogen-powered ARMG phased investment strategy. The decision tree consists of four stages. Each stage represents different numbers of hydrogen-powered ARMGs under different investment strategies. The decision time period of the decision tree is . The port could choose to keep the status number or increase the number of hydrogen-powered ARMGs. The decision tree shows all available options in a time period. Each circle node represents the node making a decision. The connecting line with arrows represents leaving the decision node to make different decisions.
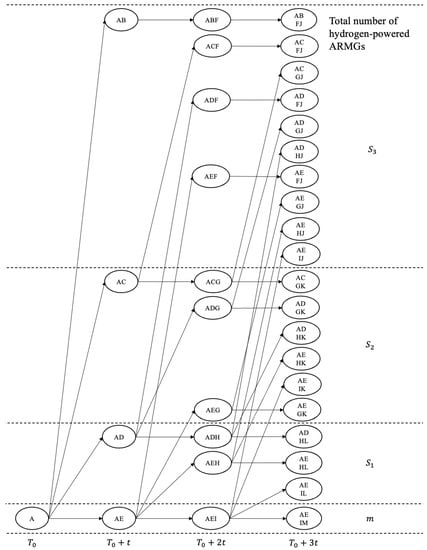
Figure 2.
Comprised decision tree for hydrogen-powered ARMGs in port.
At the beginning time , the decision-maker has four available options: keeping the number of hydrogen-powered ARMGs (from node A to node E); increasing the number of hydrogen-powered ARMGs from to (from node A to node D); increasing the number of hydrogen-powered ARMGs from to (from node A to node C); and increasing the number of hydrogen-powered ARMGs from to (from node A to node B).
For each node in the time period , this research considers all options again. For example, whether, at node AD, there are three available options for the decision-makers. Because hydrogen-powered ARMGs are part of the large-scale port infrastructure, they are generally put into use after completion, and the number and scale of equipment will not be reduced. These options are nodes ADH, ADG, and ADF. The other nodes are the same as node AD.
The investment decision-making period of ARMG equipment is considered until in this research. Each node at is regarded as the end node of the investment decision. After , assume that the current number of equipment in continuous operation will be maintained for a time period.
3.3. Cost–Benefit Function for Potential Decision
After building the decision tree, each decision in the decision tree (from one node to another node) will bring changes in costs and benefits for ports. The costs and benefits of the decision path mainly include three parts. The first part is the direct investment in hydrogen-powered ARMGs (). The second part is the operation and maintenance costs of hydrogen-powered ARMGs (). The third part is the benefits of hydrogen-powered ARMGs after transition (). The duration of each path is years, and all costs and incomes in years are converted to the starting node of the path. The cost–benefit of years will be converted to the present value through the annuity factor (). The future value of the next node will be converted to the present value through the present worth factor (). To obtain the intermediate present value of the decision path between nodes, the present value (from node to node ) is shown in Formula (4). Different from the starting node and the intermediate node, the end node is assumed to maintain the current number of equipment continuing to operate. It will no longer continue to invest in the future for a period of time, which reflects the present value of future costs and benefits. The present value of the end node is obtained by the discount rate at the infinite annual value flow. The calculation formula is shown in (5).
Specifically, in terms of cost, represents the direct investment cost of equipment needed to move from node to node . The development of hydrogen-powered ARMGs is at the primary stage of the life cycle. It has the characteristics of a small-scale economy and a low degree of standardization. In other words, it has the potential of scale economy and accumulated production experience [42].
As the maturity of equipment-modification technology increases, the direct investment cost of the equipment will decrease. The learning curve is an effective method to describe the change in hydrogen-powered ARMGs’ direct investment cost [43]. Therefore, this research uses the learning curve to describe the direct investment cost of each piece of equipment, as shown in Formula (6).
where is the direct investment cost of the first hydrogen-powered ARMGs; is the learning rate parameter; and is the total number of hydrogen-powered ARMGs at node .
The operation and maintenance cost () of hydrogen-powered ARMGs consists of the annual total energy consumption cost () and the annual total maintenance cost (). represents the total annual energy cost of all hydrogen-powered ARMGs from node to node . represents the total annual maintenance cost of all hydrogen-powered ARMGs from node to node . After moving from node to node , the operation and maintenance costs () of the hydrogen-powered ARMGs are shown in Formula (7).
where is the number of standard containers (TEU) every year for each ARMG’s task; is the total number of hydrogen-powered ARMGs at node ; is the hydrogen consumption of handling each container; is the price of hydrogen; and is the annual maintenance cost of each hydrogen-powered ARMG.
The benefits of hydrogen-powered ARMG investment are composed of saving costs and social benefits. Saving cost () includes the annual electricity cost of traditional ARMGs () and the annual total maintenance cost of traditional ARMGs () under the same number of hydrogen-powered ARMGs. In terms of social benefits, hydrogen-powered ARMGs have brought remarkable social benefits of carbon emission reduction, which is the key factor affecting the low-carbon transition investment of ARMGs. Therefore, this research approximately quantifies the social benefits of ARMGs’ low-carbon transition as economic benefits through introducing carbon pricing.
indicates the annual total electricity cost of traditional power-driven ARMGs from node to node . represents the total annual maintenance cost of traditional power-driven ARMGs from node to node . represents the annual carbon emission reduction income of all hydrogen-powered ARMGs held by the port after moving from node to node . After moving from node to node , the benefits of hydrogen-powered ARMG investment () can be calculated with Formula (8).
where is the number of standard containers (TEU) every year for each ARMG’s task; is the total number of hydrogen-powered ARMGs at node ; is the electric cost of handling each container; is the annual maintenance cost of each traditional ARMG; is the carbon emissions of handling each container; and is the price of carbon.
After obtaining the cost–benefit function of the decision tree path, the road combination with the largest present value is found and the optimal decision path of equipment investment in the decision tree is obtained through backward induction. The end node is selected from (J, K, L, or M) until A point is reached. The calculation process is as follows:
The first step obtains the intermediate present value (, , , or ) of the end node by Formula (5). The second step calculates the intermediate present value of the third time period based on the end node present value. Taking node ADH as an example, the calculation process of the present value is shown in Formula (9). The other node in this stage has the same calculation process. The third step calculates the intermediate present value of each node in the second stage according to the intermediate present value preference results of each node in the third stage. Taking node AD as an example, the calculation process of the present value is shown in Formula (10). The other node in this stage has the same calculation process. The fourth step uses the best second-stage node intermediate present value results to calculate the first-stage results. The present value is shown in Formula (11).
4. Case Study
Qingdao Port is the sixth-largest port in the world. In terms of the low-carbon transition of port equipment, Qingdao Port actively demonstrates the application of port multi-scenario hydrogen energy technology to create an international leading level. It is also the first port to develop hydrogen-powered ARMGs. This research takes Qingdao Port as a case to verify the applicability of the model and propose the optimal cost–benefit investment decision scheme for hydrogen-powered ARMGs in Qingdao Port. Section 4.1 describes the case scenario of hydrogen-powered ARMG investment in Qingdao Port. Section 4.2 obtains the investment scheme of hydrogen-powered ARMGs investment in Qingdao Port under the case scenario. Subsequently, in Section 4.3, the impact of uncertainties, such as technical maturity, hydrogen energy cost, and accounting for carbon emission reduction benefits, on the low-carbon transition of ARMGs is discussed.
4.1. Scenario of ARMGs’ Low-Carbon Transition Process at Qingdao Port
According to the public data survey of Qingdao Port, on 28 November 2019, with the fully automatic (phase II) operation of Qingdao Port in Shandong Province, Qingdao Port began the pilot operation of hydrogen-powered ARMGs. At present, there are 76 ARMGs () at the Qingdao Port Automation Terminal, and six hydrogen-powered ARMGs () have been built as of 2021.
In the government document “Development Plan of Qingdao’s Hydrogen Energy Industry”, Qingdao follows “The 14th Five-Year Plan of the People’s Republic of China”. Qingdao plans to initially establish a hydrogen energy supply system based on the near-use of industrial by-product hydrogen and renewable hydrogen production from 2021 to 2025. By 2030, a relatively complete hydrogen energy industry technology innovation system, clean energy hydrogen production, and supply system will be formed. By 2035, a diversified application system for hydrogen energy will be formed, and the proportion of renewable energy hydrogen production in terminal energy consumption will be significantly increased. Qingdao Port, as the main economic hinterland of Qingdao, follows the development plan of Qingdao. Therefore, this research refers to the development plan of the hydrogen energy industry in Qingdao and the current situation of the low-carbon transition of port equipment. It is reasonable to select the start time of the phased investment plan as 2021 and the phased investment time interval () as 5 years. Subsequently, the probability results of the transition processes for different equipment in each stage are determined through interviews with relevant experts in the Qingdao Port and energy field. The reasonable expected phased transition number of hydrogen-powered ARMGs in different time periods is shown in Table 2.
Table 2.
The prediction probability of phased equipment investment of Qingdao Port.
4.2. Results of the Case Study
There are some uncertain factors affecting the phased investment choice of the hydrogen-powered ARMGs in Qingdao port. These uncertain factors include the cost changes brought about by the improvement of the technical maturity of hydrogen-powered ARMGs (), the price of hydrogen energy (), and the uncertainty of whether to account for the benefits of carbon emission reduction.
In terms of technology maturity, the development of hydrogen-powered ARMGs is in the primary stage of its life cycle. At this time, the cost change caused by the improvement of technology maturity is not obvious, and the value range of learning curve parameter is small [42]. In this case, the value of learning curve parameter is 0.1 (Section 4.3 analyzes the influence of different values of learning curve parameter on the phased investment selection of port hydrogen-powered ARMGs in detail). The price of hydrogen energy is based on the hydrogen energy development plan of Qingdao Port. From 2021 to 2025, Qingdao Port will mainly utilize nearby industrial by-product hydrogen. The hydrogen energy use cost of port ARMG equipment is cheap. The hydrogen energy cost price is about 11 RMB/kg [44]. From 2026 to 2030, Qingdao Port will have a relatively complete hydrogen energy supply system. The hydrogen energy use cost of port ARMG equipment will be close to the market price. The hydrogen energy cost price will be about 60 RMB/kg. After 2030, the hydrogen production technology and hydrogen energy supply system will further mature. During this time period, the hydrogen energy use cost of port ARMG equipment could reach the best market price, which would be about 30 RMB/kg [44].
As for the benefit accounting of carbon emission reduction, the carbon trading market of Qingdao Port is not yet mature. However, the social benefit of carbon emission reduction from the low-carbon transition of equipment is an important factor to accelerate investment and to promote the construction of hydrogen-powered ARMGs. Therefore, the carbon price () has been adopted in this research. The value of is based on the carbon price of China’s national market predicted in the current research report [45].
Based on the survey data of Qingdao Port, relevant parameters of equipment investment of hydrogen-powered ARMGs in Qingdao Port are summarized, as shown in Table 3.
Table 3.
Equipment transition parameters.
The calculation results are shown in Table 4. The detailed data for the case calculations are summarized in Appendix A (see Table A1). The optimal decision scheme path is A–B–F–J. From 2021 to 2025, the port will intensively increase investment and build 36 hydrogen-powered ARMGs. After 2026, the total number of 40 pieces of low-carbon equipment will remain unchanged. After 2031, the port will start to make profits, and the present value of annual income after 2035 will reach 88.87 million RMB. In contrast, the decision-making scheme path according to the expected equipment transition process is A–D–G–J, investing in 18 hydrogen-powered ARMGs from 2021 to 2025, 33 hydrogen-powered ARMGs from 2026 to 2030, and 40 hydrogen-powered ARMGs from 2031 to 2035. After 2035, the total number of 40 pieces of low-carbon equipment will remain unchanged, and the present value of annual income after 2035 will be 88.87 million RMB.
Table 4.
Results of low-carbon transition of equipment in Qingdao Port.
4.3. Sensitivity Analysis
Through the model calculation, the case’s real options valuation results under different investment schemes are obtained, which provide a reference for the low-carbon transition investment of Qingdao Port equipment. However, the valuation changes in uncertain factors (technology maturity, hydrogen cost, carbon emission income accounting) in the case scenario will still lead to a change in the real option valuation results of port equipment investment. Therefore, it is necessary to further analyze the influence of different uncertainties on the low-carbon transition of ARMGs to provide more references for port investment decision-making.
- Impact of technology maturity on port hydrogen-powered ARMGs investment decision
Since the development of hydrogen-powered ARMGs is in the primary stage of the life cycle, the range of the learning curve parameter is small, and 0.1 to 0.4 is a reasonable interval [42]. In this case, the learning curve parameter was set as 0.1. When exploring the influence of technology maturity on the investment decision of port hydrogen-powered ARMGs, three scenarios of learning curve parameters were set at 0.2, 0.3, and 0.4. The model calculation results are shown in Table 5.
Table 5.
Investment decision result of Qingdao Port ARMGs’ low-carbon transition under the change of technology maturity.
After changing the learning curve parameter , the optimal decision path is not changed. However, with the increase in parameter values, the direct investment cost of hydrogen-powered ARMGs will decrease. After the value of the parameter is adjusted from 0.1 to 0.4, the present value increases from 38.7154 million RMB to 5.8010 million RMB from 2021 to 2025. In other words, the stronger the learning effect of hydrogen-powered ARMG equipment, the smaller the capital pressure at the initial stage of port equipment investment (2021–2025) under the optimal decision. The port will be more inclined to complete more equipment transitions in the previous years of investment planning when the investment become smaller.
- 2.
- Impact of hydrogen prices on port hydrogen-powered ARMGs investment decision
The public data show that Shandong Province is the largest industrial hydrogen waste-producing province in China. In the early stage of developing hydrogen energy equipment, the port will use industrial waste hydrogen as the main source of hydrogen energy. With the development of the hydrogen energy industry system in Qingdao Port, it is more likely to gradually replace industrial waste hydrogen with blue hydrogen and green hydrogen after 2025. In the case scenario, it is assumed that the price of hydrogen used in ports from 2026 to 2030 will be close to the market average. From 2031 to 2035 and beyond, hydrogen can develop rapidly and achieve the best market price. In the analysis of this section, it is assumed that the two hydrogen energy development scenarios are different from the case scenario. In a positive scenario, from 2026 to 2030, the price of port hydrogen energy will be able to achieve the best market price. In the negative scenario, from 2031 to 2035, the price of port hydrogen energy will remain at the market average. The calculation results are shown in Table 6.
Table 6.
Investment decision result of Qingdao Port ARMGs’ low-carbon transition under the change in hydrogen prices.
Under the positive scenario, the optimal investment decision path of port hydrogen-powered ARMGs equipment is still A–B–F–J. However, different from the case scenario, since the price of hydrogen energy reaches the optimal market level earlier, when the port invests according to the optimal investment decision-making path, it will start to profit in 2026. Under the negative scenario, the price of hydrogen energy remains high, and the optimal investment decision path of the port changes. Under this scenario, the optimal investment path changes to A–E–I–M. The number of hydrogen-powered ARMGs in the port remains unchanged at six units, and no additional investment is added. Under this scenario, in addition to the low cost of industrial waste hydrogen in the initial stage of equipment investment, the present value is 3.1661 million RMB, and the present value conversion results of port equipment investment in the initial stage are all negative. Continued additional investment will not bring profit to the port. Therefore, the construction and development of a hydrogen energy application system in Qingdao Port has a great influence on the low-carbon transition process of port equipment.
- 3.
- Impact of accounting for carbon emission reduction income on port hydrogen-powered ARMGs investment decision
The remarkable effect of carbon emission reduction plays an important role in promoting the low-carbon transition process of port equipment. When the port can convert carbon emission reduction into economic benefits, the optimal decision path of cost–benefit for port equipment transition investment is A–B–F–J, and the transition of 40 units is the optimal choice. After 2035, the converted present value reaches 88.8700 million RMB, as shown in Table 7. However, when the port cannot convert the social benefits of carbon emission reduction into economic benefits, the optimal decision-making path of cost–benefit for port equipment transition investment changes, the process of low-carbon transition of port equipment is slow, and the converted present value is negative after 2035.
Table 7.
Investment decision result of Qingdao Port ARMGs’ low-carbon transition under the change of accounting for carbon emission reduction income.
In summary, among the uncertainties affecting the investment in the low-carbon transition of port ARMGs, the decrease in the cost of direct investment in equipment brought by the improvement of technology maturity can effectively reduce the initial investment pressure of the low-carbon transition of equipment and has little effect on the optimal investment decision path for the low-carbon transition of equipment. The change in hydrogen prices significantly affects the investment decision regarding the low-carbon transition of port ARMGs. Through the rapid development of port hydrogen energy systems, reducing the cost of hydrogen energy use can accelerate the process of the low-carbon transition of port equipment. The ability to effectively transform the social benefits of carbon emission reduction into economic benefits as soon as possible plays a certain role in promoting the low-carbon transition of port equipment, and the port can actively promote the construction of the carbon trading market.
5. Conclusions and Prospects
This research takes port ARMG equipment as the research object, considering the complexity and uncertainty of the low-carbon transition process from traditionally powered ARMGs to hydrogen-powered ARMGs as much as possible, and establishes a low-carbon transition investment decision model of phased equipment based on real options theory. Considering uncertainties, such as technology maturity, hydrogen energy cost, and carbon emission reduction benefit accounting, the optimal decision path for the transition of ports’ traditional ARMGs into hydrogen-powered ARMGs is analyzed based on the decision tree cost–benefit decision model. This model can fully show the potential benefits and losses of all possible investment schemes, estimate the present value of low-carbon transition investment schemes for different equipment, and provide references for port decision-making.
The main conclusions of this research are as follows. Firstly, the ARMGs’ hydrogen energy transition investment is a process with a long cycle, large investment, and strong variability. Ports need to make phased investments in equipment transformation based on the current development status and future plans. The discrete real option model can effectively help hydrogen-powered ARMGs intensively from 2021 to 2025. The expected investment strategy is investing in 18 hydrogen-powered ARMGs from 2021 to 2025, 33 hydrogen-powered ARMGs from 2026 to 2030, and 40 hydrogen-powered ARMGs from 2031 to 2035. Under the optimal investment strategy, the port will obtain more profits than other strategies, but bear more capital pressure. Therefore, ports should flexibly adjust the investment strategy based on their development status and future planning. Thirdly, from the results of sensitivity analysis, many measures can effectively reduce the financial pressure of port equipment investment and accelerate the process of the low-carbon transition of port equipment. These measures include strengthening ports’ scientific and technological innovation to improve technological maturity, accelerating the construction of the port hydrogen energy consumption system, actively improving the construction of the port carbon trading market, etc.
In addition, this research has some limitations. Firstly, there are limitations in the process of characterizing the uncertain factors of ARMGs’ low-carbon transition. This research only provides a detailed description of the major uncertainties that account for a large proportion of cost and benefit. For example, the price of electricity in the traditional ARMGs’ energy consumption cost calculation is volatile, and it could be added as one of the uncertainty factors to future research. Secondly, hydrogen-powered ARMGs are emerging and in the initial stage of development. They have been used in ports for less than 5 years. The relevant production parameters available at the port are limited. Therefore, there are certain limitations in describing the low-carbon transition scenario of ARMGs. When hydrogen-powered ARMGs are applied on a large scale in ports, we can more accurately describe the low-carbon transition scenarios of port equipment. Finally, the hydrogen energy development and the port carbon trading market are still in the construction stage, lacking an ideal market environment. Therefore, the practicality of the model still needs more tests in the future.
Author Contributions
Conceptualization, A.Y. and J.G.; methodology, H.H.; investigation, A.Y.; data curation, X.M.; writing—original draft preparation, X.M.; writing—review and editing, L.W.; funding acquisition, L.W. All authors have read and agreed to the published version of the manuscript.
Funding
This research was supported by the Social Science Planning Foundation of Liaoning Province (No. L20BGL056).
Institutional Review Board Statement
Not applicable.
Informed Consent Statement
Not applicable.
Data Availability Statement
Not applicable.
Conflicts of Interest
The authors declare no conflict of interest.
Appendix A
The detailed data for the case calculations in Section 4.2 are summarized in Table A1. The calculation process for sensitivity analysis in Section 4.3 is similar to that in Section 4.2.
Table A1.
Detailed calculations for case study.
Table A1.
Detailed calculations for case study.
| Time Period | From Node | To Node | Cost and Revenue (Million RMB) | ||||||
|---|---|---|---|---|---|---|---|---|---|
| Direct Investment | Annual Energy Consumption Cost | Annual Maintenance Cost | Annual Total Saving Cost | Annual Carbon Revenue | |||||
| Annual Electricity Cost | Annual Maintenance Cost | ||||||||
| 2021–2025 | A | AB | 64.1712 | 14.4461 | 40 | 32.8320 | 2.6 | 3.4 | −38.7154 |
| A | AC | 52.0526 | 11.9180 | 33 | 27.0864 | 2.1 | 2.8 | −31.0516 | |
| A | AD | 24.8541 | 6.5007 | 18 | 14.7744 | 1.2 | 1.5 | −13.3990 | |
| A | AE | 0 | 2.1669 | 6 | 4.9248 | 0.4 | 0.5 | 3.2182 | |
| 2026–2030 | AB | ABF | 0 | 78.7968 | 40 | 32.8320 | 2.6 | 6.4 | −43.3190 |
| AC | ACF | 12.1186 | 78.7968 | 40 | 32.8320 | 2.6 | 6.4 | −56.2398 | |
| ACG | 0 | 65.0074 | 33 | 27.0864 | 2.1 | 5.3 | −35.7381 | ||
| AD | ADH | 0 | 35.4586 | 18 | 14.7744 | 1.2 | 2.9 | −19.4935 | |
| ADG | 27.1985 | 65.0074 | 33 | 27.0864 | 2.1 | 5.3 | −62.9367 | ||
| ADF | 39.3171 | 78.7968 | 40 | 32.8320 | 2.6 | 6.4 | −82.6361 | ||
| AE | AEF | 64.1712 | 78.7968 | 40 | 32.8320 | 2.6 | 6.4 | −107.4902 | |
| AEG | 52.0526 | 65.0074 | 33 | 27.0864 | 2.1 | 5.3 | −87.7908 | ||
| AEH | 24.8541 | 35.4586 | 18 | 14.7744 | 1.2 | 2.9 | −44.3476 | ||
| AEI | 0 | 11.8195 | 6 | 4.9248 | 0.4 | 1.0 | −6.4978 | ||
| 2031–2035 | ABF | ABFJ | 0 | 39.3984 | 40 | 32.8320 | 2.6 | 11.5 | 14.2995 |
| ACF | ACFJ | 12.1186 | 39.3984 | 40 | 32.8320 | 2.6 | 11.5 | 2.1810 | |
| ACG | ACGJ | 12.1186 | 39.3984 | 40 | 32.8320 | 2.6 | 11.5 | 2.1810 | |
| ACGK | 0 | 32.5037 | 33 | 27.0864 | 2.1 | 9.5 | 11.7971 | ||
| ADF | ADFJ | 0 | 39.3984 | 40 | 32.8320 | 2.6 | 11.5 | 14.2995 | |
| 2031–2035 | ADG | ADGJ | 12.1186 | 39.3984 | 40 | 32.8320 | 2.6 | 11.5 | 2.1810 |
| ADGK | 0 | 32.5037 | 33 | 27.0864 | 2.1 | 9.5 | 11.7971 | ||
| ADH | ADHJ | 39.3171 | 39.3984 | 40 | 32.8320 | 2.6 | 11.5 | −25.0176 | |
| ADHK | 27.1985 | 32.5037 | 33 | 27.0864 | 2.1 | 9.5 | −15.4014 | ||
| ADHL | 0 | 17.7293 | 18 | 14.7744 | 1.2 | 5.2 | 6.4348 | ||
| AEF | AEFJ | 0 | 39.3984 | 40 | 32.8320 | 2.6 | 11.5 | 14.2995 | |
| AEG | AEGJ | 12.1186 | 39.3984 | 40 | 32.8320 | 2.6 | 11.5 | 2.1810 | |
| AEGK | 0 | 32.5037 | 33 | 27.0864 | 2.1 | 9.5 | 11.7971 | ||
| AEH | AEHJ | 39.3171 | 39.3984 | 40 | 32.8320 | 2.6 | 11.5 | −25.0176 | |
| AEHK | 27.1985 | 32.5037 | 33 | 27.0864 | 2.1 | 9.5 | −15.4014 | ||
| AEHL | 0 | 17.7293 | 18 | 14.7744 | 1.2 | 5.2 | 6.4348 | ||
| AEI | AEIJ | 64.1712 | 39.3984 | 40 | 32.8320 | 2.6 | 11.5 | −49.8717 | |
| AEIK | 52.0526 | 32.5037 | 33 | 27.0864 | 2.1 | 9.5 | −40.2555 | ||
| AEIL | 24.8541 | 17.7293 | 18 | 14.7744 | 1.2 | 5.2 | −18.4193 | ||
| AEIM | 0 | 5.9098 | 6 | 4.9248 | 0.4 | 1.7 | 2.1449 | ||
| >2035 | J | - | 0 | 39.3984 | 40 | 32.8320 | 2.6 | 11.5 | 88.8700 |
| K | - | 0 | 32.5037 | 33 | 27.0864 | 2.1 | 9.5 | 73.3178 | |
| L | - | 0 | 17.7293 | 18 | 14.7744 | 1.2 | 5.2 | 39.9915 | |
| M | - | 0 | 5.9098 | 6 | 4.9248 | 0.4 | 1.7 | 13.3305 | |
References
- Azarkamand, S.; Ferré, G.; Darbra, R.M. Calculating the Carbon Footprint in ports by using a standardized tool. Sci. Total Environ. 2020, 734, 139407. [Google Scholar] [CrossRef] [PubMed]
- Fan, S.; Lu, Z. Research on the Peak Carbon Dioxide Emission Strategy of Chinese Port Based on Carbon Emission Estimation. Front. Environ. Sci. 2022, 9, 789970. [Google Scholar] [CrossRef]
- Azarkamand, S.; Balbaa, A.; Wooldridge, C.; Darbra, R.M. Climate Change—Challenges and Response Options for the Port Sector. Sustainability 2020, 12, 6941. [Google Scholar] [CrossRef]
- Wang, T.S.; Wang, X.C.; Meng, Q. Joint berth allocation and quay crane assignment under different carbon taxation policies. Transp. Res. Part B Methodol. 2018, 117, 18–36. [Google Scholar] [CrossRef]
- Yun, P.; Xiangda, L.I.; Wenyuan, W.; Ke, L.I.U.; Chuan, L.I. A simulation-based research on carbon emission mitigation strategies for green container terminals. Ocean Eng. 2018, 163, 288–298. [Google Scholar] [CrossRef]
- Hu, H.T.; Mo, J.; Zhen, L. Improved Benders decomposition for stochastic yard template planning in container terminals. Transp. Res. Part C Emerg. Technol. 2021, 132, 103365. [Google Scholar] [CrossRef]
- Kanellos, F.D. Multiagent-System-Based Operation Scheduling of Large Ports’ Power Systems with Emissions Limitation. IEEE Syst. J. 2018, 13, 1831–1840. [Google Scholar] [CrossRef]
- Wang, W.; Huang, L.; Gu, J.; Jiang, L.P. Green port project scheduling with comprehensive efficiency consideration. Marit. Policy Manag. 2019, 46, 967–981. [Google Scholar] [CrossRef]
- Hua, C.Y.; Chen, J.H.; Wan, Z.; Xu, L.; Bai, Y.; Zheng, T.X.; Fei, Y.J. Evaluation and governance of green development practice of port: A sea port case of China. J. Clean. Prod. 2019, 249, 119434. [Google Scholar] [CrossRef]
- Li, C.G.; Dixit, P.; Welch, B.; Nigam, A.; Soriano, B.; Lee, J.; Russell, R.L.; Jiang, Y.; Zhu, H.W.; Karavalakis, G.; et al. Yard tractors: Their path to zero emissions. Transp. Res. Part D Transp. Environ. 2021, 98, 102972. [Google Scholar] [CrossRef]
- Wang, L.; Liang, C.; Shi, J.; Molavi, A.; Lim, G.; Zhang, Y. A bilevel hybrid economic approach for optimal deployment of onshore power supply in maritime ports. Appl. Energy 2021, 292, 116892. [Google Scholar] [CrossRef]
- Wang, W.Y.; Peng, Y.; Li, X.D.; Qi, Q.; Feng, P.; Zhang, Y. A two-stage framework for the optimal design of a hybrid renewable energy system for port application. Ocean Eng. 2019, 191, 106555. [Google Scholar] [CrossRef]
- Elnajjar, H.M.; Shehata, A.S.; Elbatran, A.H.A.; Shehadeh, M.F. Experimental and techno-economic feasibility analysis of renewable energy technologies for Jabel Ali Port in UAE. Energy Rep. 2021, 7, 116–136. [Google Scholar] [CrossRef]
- Li, L.; Zhu, J.D.; Ye, G.Q.; Feng, X.H. Development of Green Ports with the Consideration of Coastal Wave Energy. Sustainability 2018, 10, 4270. [Google Scholar] [CrossRef] [Green Version]
- Macía, Y.M.; Machuca, P.R.; Soto, A.A.R.; Campos, R.C. Green Hydrogen Value Chain in the Sustainability for Port Operations: Case Study in the Region of Valparaiso, Chile. Sustainability 2021, 13, 13681. [Google Scholar] [CrossRef]
- Vichos, E.; Sifakis, N.; Tsoutsos, T. Challenges of integrating hydrogen energy storage systems into nearly zero-energy ports. Energy 2022, 241, 122878. [Google Scholar] [CrossRef]
- Wang, X.B.; Huang, W.T.; Wei, W.; Tai, N.L.; Li, R.; Huang, Y.W. Day-Ahead Optimal Economic Dispatching of Integrated Port Energy Systems Considering Hydrogen. IEEE Trans. Ind. Appl. 2021, 58, 2619–2629. [Google Scholar] [CrossRef]
- Tan, Z.Y.; Zhang, Q.; Yuan, Y.Y.; Jin, Y. A decision method on yard cranes transformation and deployment in green ports. Int. Trans. Oper. Res. 2021, 29, 323–346. [Google Scholar] [CrossRef]
- Martínez-Moya, J.; Vazquez-Paja, B.; Maldonado, J.A.G. Energy efficiency and CO2 emissions of port container terminal equipment: Evidence from the Port of Valencia. Energy Policy 2019, 131, 312–319. [Google Scholar] [CrossRef]
- Peng, Y.; Wang, W.Y.; Liu, K.; Li, X.D.; Tian, Q. The Impact of the Allocation of Facilities on Reducing Carbon Emissions from a Green Container Terminal Perspective. Sustainability 2018, 10, 1813. [Google Scholar] [CrossRef] [Green Version]
- Schmid, U.; Prakash, N.; van der Vleugel, M.; Claunch, J. Bringing the Power of Enterprise Technology to Decarbonization; Bain & Company: Boston, MA, USA, 2021. [Google Scholar]
- Kovacic, D.; Bogataj, M. Net Present Value Evaluation of Energy Production and Consumption in Repeated Reverse Logistics. Technol. Econ. Dev. Econ. 2017, 23, 877–894. [Google Scholar] [CrossRef]
- Kawabata, Y.; Kato, E.; Yokota, H.; Iwanami, M. Net present value as an effective indicator leading to preventive maintenance of port mooring facilities. Struct. Infrastruct. Eng. 2020, 16, 714–725. [Google Scholar] [CrossRef]
- Zhu, M.; Li, K.X.; Shi, W.M.; Lam, J.S.L. Incentive policy for reduction of emission from ships: A case study of China. Mar. Policy 2017, 86, 253–258. [Google Scholar] [CrossRef]
- Zhang, M.M.; Tang, Y.M.; Liu, L.Y.; Zhou, D.Q. Optimal investment portfolio strategies for power enterprises under multi-policy scenarios of renewable energy. Renew. Sustain. Energy Rev. 2022, 154, 111879. [Google Scholar] [CrossRef]
- Van den Boomen, M.; Van der Meulen, S.; Van Ekris, J.; Spanjers, R.; Voorde, O.T.; Mulder, J.; Blommaart, P. Optimized Expansion Strategy for a Hydrogen Pipe Network in the Port of Rotterdam with Compound Real Options Analysis. Sustainability 2021, 13, 9153. [Google Scholar] [CrossRef]
- Duan, F.; Ji, Q.; Liu, B.-Y.; Fan, Y. Energy investment risk assessment for nations along China’s Belt & Road Initiative. J. Clean. Prod. 2018, 170, 535–547. [Google Scholar] [CrossRef]
- Jia, Z.J.; Lin, B.Q. How to achieve the first step of the carbon-neutrality 2060 target in China: The coal substitution perspective. Energy 2021, 233, 121179. [Google Scholar] [CrossRef]
- Deeney, P.; Cummins, M.; Heintz, K.; Pryce, M.T. A real options based decision support tool for R&D investment: Application to CO2 recycling technology. Eur. J. Oper. Res. 2020, 289, 696–711. [Google Scholar] [CrossRef]
- Bangjun, W.; Feng, Z.L.; Feng, J.; Yu, P.; Cui, L.Y. Decision making on investments in photovoltaic power generation projects based on renewable portfolio standard: Perspective of real option. Renew. Energy 2022, 189, 1033–1045. [Google Scholar] [CrossRef]
- Zhang, M.M.; Wang, Q.W.; Zhou, D.Q.; Ding, H. Evaluating uncertain investment decisions in low-carbon transition toward renewable energy. Appl. Energy 2019, 240, 1049–1060. [Google Scholar] [CrossRef]
- Ponomarenko, T.; Marin, E.; Galevskiy, S. Economic Evaluation of Oil and Gas Projects: Justification of Engineering Solutions in the Implementation of Field Development Projects. Energies 2022, 15, 3103. [Google Scholar] [CrossRef]
- Balliauw, M. From theoretical real options models to pragmatic decision making: Required steps, opportunities and threats. Res. Transp. Econ. 2021, 90, 101063. [Google Scholar] [CrossRef]
- Pimentel, P.; Couto, G.; Tavares, A.; Oliveira, A. The impacts of real options analysis on EU co-financing policy: The case of Ponta Delgada Port in the Azores. Res. Transp. Econ. 2021, 90, 100977. [Google Scholar] [CrossRef]
- Li, L.; Liu, J.Q.; Zhu, L.; Zhang, X.-B. How to design a dynamic feed-in tariffs mechanism for renewables—A real options approach. Int. J. Prod. Res. 2020, 58, 4352–4366. [Google Scholar] [CrossRef]
- Zhang, M.M.; Liu, L.Y.; Wang, Q.W.; Zhou, D.Q. Valuing investment decisions of renewable energy projects considering changing volatility. Energy Econ. 2020, 92, 104954. [Google Scholar] [CrossRef]
- Fan, J.-L.; Xu, M.; Yang, L.; Zhang, X. Benefit evaluation of investment in CCS retrofitting of coal-fired power plants and PV power plants in China based on real options. Renew. Sustain. Energy Rev. 2019, 115, 109350. [Google Scholar] [CrossRef]
- Yue, Y.; Ying, Y.R. Real option analysis for emission reduction investment under the sulfur emission control. Sustain. Energy Technol. Assess. 2021, 45, 101055. [Google Scholar] [CrossRef]
- Fan, J.-L.; Wei, S.J.; Zhang, X.; Yang, L. A comparison of the regional investment benefits of CCS retrofitting of coal-fired power plants and renewable power generation projects in China. Int. J. Greenh. Gas Control 2020, 92, 102858. [Google Scholar] [CrossRef]
- Oliveira, A.; Couto, G.; Pimentel, P. Uncertainty and flexibility in infrastructure investments: Application of real options analysis to the Ponta Delgada airport expansion. Res. Transp. Econ. 2020, 90, 100845. [Google Scholar] [CrossRef]
- Li, Y.; Kool, C.; Engelen, P.-J. Analyzing the Business Case for Hydrogen-Fuel Infrastructure Investments with Endogenous Demand in The Netherlands: A Real Options Approach. Sustainability 2021, 12, 5422. [Google Scholar] [CrossRef]
- Rogner, H.-H. Hydrogen technologies and the technology learning curve. Int. J. Hydrogen Energy 1998, 23, 833–840. [Google Scholar] [CrossRef]
- Ferioli, F.; Schoots, K.; van der Zwaan, B.C. Use and limitations of learning curves for energy technology policy: A com-ponent-learning hypothesis. Energy Policy 2009, 37, 2525–2535. [Google Scholar] [CrossRef]
- Luo, Z.; Hu, Y.; Xu, H.; Gao, D.; Li, W. Cost-Economic Analysis of Hydrogen for China’s Fuel Cell Transportation Field. Energies 2020, 13, 6522. [Google Scholar] [CrossRef]
- Slater, H.; De Boer, D.; Qian, G.; Wang, Z. 2020 China Carbon Price Survey; China Carbon Forum: Beijing, China, 2020. (In Chinese) [Google Scholar]
Publisher’s Note: MDPI stays neutral with regard to jurisdictional claims in published maps and institutional affiliations. |
© 2022 by the authors. Licensee MDPI, Basel, Switzerland. This article is an open access article distributed under the terms and conditions of the Creative Commons Attribution (CC BY) license (https://creativecommons.org/licenses/by/4.0/).