Article

Investigation of Pyrolysis Behavior of Sewage Sludge by Thermogravimetric Analysis Coupled with Fourier Transform Infrared Spectrometry Using Different Heating Rates

Faculty of Engineering, Research Centre of Biochemical, Environmental and Chemical Engineering, MOL Department of Hydrocarbon and Coal Processing, University of Pannonia, Egyetem u. 10, H-8200 Veszprém, Hungary
*
Author to whom correspondence should be addressed.
Energies 2022, 15(14), 5116; https://doi.org/10.3390/en15145116
Submission received: 30 May 2022 / Revised: 27 June 2022 / Accepted: 11 July 2022 / Published: 13 July 2022

Abstract

:
In this study, pyrolysis of municipal sewage sludge samples from different sources including cattle and chicken manure as well as brook mud, was investigated using a thermogravimetric analysis coupled with a Fourier transform infrared spectrometer (TG-FTIR) at different heating rates (25, 50 and 100 °C/min). In order to determine the kinetic parameters, Arrhenius, model-free Kissinger–Akira–Sunose (KAS), as well as Friedman and Flynn–Wall–Ozawa (FWO) methods were compared. The thermogravimetric results revealed that pyrolysis involved different stages, and that the main decomposition reactions took place in the range of 200–600 °C. In this range, decomposition of biodegradable components (e.g., lipids and polysaccharides), proteins and carbohydrates occurred; meanwhile, there were samples (e.g., cattle manure, brook mud) in which the decomposition step could be observed even at temperatures above 700 °C. According to the Arrhenius method, the activation energies of the first decomposition stage were between 25.6 and 85.4 kJ/mol, while the activation energies of the second and third stages were in the ranges of 11.4–36.3 kJ/mol and 20.2–135 kJ/mol, respectively. The activation energies were also calculated by the KAS, Friedman and FWO methods, which were in the range of 100–300 kJ/mol for municipal sewage sludge or distillery sludge, and ranged between 9.6 and 240 kJ/mol for cattle manure, chicken manure and brook mud samples.

1. Introduction

As a result of the continuously increasing global population and its living standards, the amount of generated sewage sludge is also significantly increasing. The amount of annually generated human-sourced sewage sludge is around 45 million tons, on a dry basis [1]. However, there are significant differences in the amount of sewage sludge with regards to different regions and types of settlements [2]. One of the main problems with sewage sludge that it consists of harmful elements, such as pathogenic substances, drug residues, hormones, bacteria, viruses or other pathogens. In addition, depending on the source of the waste, heavy metal content in sewage can also be significant [3,4,5].
With regards to sewage sludge utilization, there are different methods used (e.g., landfill, agriculture, compost, incineration, thermochemical processes), which may vary, depending on the legal, social and technological specificities of different regions [6,7].
Among the various thermochemical methods, pyrolysis can be a promising way to convert sewage sludge into more valuable products. During this process, sewage sludge is transformed into smaller molecules at temperatures above 300 °C in fixed, fluidized or circulating fluidized bed reactors in an inert atmosphere [8,9]. Sewage sludge typically consists of proteins, carbohydrates, water and other organic and inorganic substances [10]. These substances are transformed into gaseous, liquid and solid products. Gas products consist of hydrogen, CO, CO2, hydrocarbons and contaminants (e.g., NH3, H2S). Liquid products have hydrocarbons, aldehydes, ketones, alcohols, carboxylic acids, phenols and other organic compounds containing S, N and O [11]. The solid residue is most comparable to porous carbon, while their composition and properties are greatly influenced by the raw material and the process parameters (e.g., pyrolysis temperature, heating rate, pressure).
As a result of our improving understanding of pyrolysis processes and the influences of scaling them up, investigating their associated reaction kinetics is necessary. However, it is known that due to the large number of complex and consecutive reactions involved, the thermal decomposition process is very complex [12,13,14,15]. Thus, it is not possible to describe all reactions individually. In order to better understand the processes taking place, different kinetic models should be used by different simplification parameters.
Based on previous work, the thermogravimetric method is widely used to investigate the decomposition of waste polymers, biomass and municipal solid waste, or even sewage sludge. It is important to note that most of the reaction kinetic models derive the main reaction kinetic parameters from the sample weight loss that is observed during the thermal decomposition. Table 1 summarizes the main reaction kinetic approaches to the pyrolysis of polymeric wastes [16,17,18,19,20,21,22,23,24,25,26,27,28,29,30,31,32,33,34,35,36].
Most of the methods used are on the basis of thermogravimetric results, when the sample (typically less than 1 g) is heated in an inert atmosphere (usually in nitrogen, argon or helium) at a given carrier gas rate and heating rate. The reaction kinetic parameters are calculated from the sample weight loss. The carrier gas velocity is generally <200 mL/h and the heating rate is typically below 50 °C/min [16,17,18,19,20,21,22,23]. However, recently A. Petrovic et al. investigated the pyrolysis kinetics of sewage sludge and biomass using 15, 30 and 100 °C/min heating rates. They compared the results using the Kissinger–Akira–Sunose and Flynn–Wall–Ozawa models, and concluded that the two models had good correlation in the case of sewage sludge raw material; however, due to the composition of other raw materials, a weaker correlation was found [29].
Some kinetic models (the so-called isoconversional methods) do not require the full description and understanding of the processes involved. The Flynn–Wall–Ozawa (FWO), Friedman, Horowitz, Kissinger, Kissinger–Akira–Sunose (KAS) and Ozawa methods are the most commonly used for the kinetics-free approach [16,17,18,19,20,21,22]. There are other methods that describe processes based on a gross reaction equation. In these models, the thermal decomposition processes take place through the same thermal reactivity. The reliability of the final result is limited, and largely depends on the description of the gross process [24,25,26]. Most kinetic approaches do not take into account the fact that the activation energy of the thermal decomposition is not constant and changes during the process. For this reason, a distributed activation energy model has been developed. It defines the processes as a complex system of reactions, with constantly changing activation energies but a constant pre-exponential factor [30,31,32].
Although pyrolysis of sewage sludge is a widely researched topic, there are still a number of issues to be clarified, such as effects of heating rates and residence times. Moreover, to understand the pyrolysis process and to prepare the possible scale-up, reaction kinetic calculations are also needed. Based on the aforementioned, this study investigates the pyrolysis of different sewage sludge samples with a TG-FTIR instrument that uses different heating rates. The main reaction kinetic parameters were calculated through the usage of different kinetic approaches. According to the references, a heating rate below 50 °C/min is mostly used for thermogravimetric analysis of sewage sludge. However, in this study heating rates between 25 and 100 °C/min were used in order to obtain more information about the extended availability of the applied reaction kinetic approaches.

2. Materials and Methods

2.1. Raw Materials

In this study, different sewage sludge samples (e.g., municipally sourced sewage sludge (samples “A–D”), distillery sludge (sample “E”), cattle manure (sample “F”), chicken manure (sample “G”) and brook mud (sample “H”)) were used as raw materials. Samples “A” and “B” originated from a Hungarian municipal wastewater plant and were characterized by a similar composition (Table 2). Sample “C” was recovered from biological treatment, and municipal sewage sludge sample designated as sample “D” was obtained after centrifugation. In contrast, samples “F” and “G” were of animal origin, and sample “H” was taken from the sediment of a local Hungarian brook.
In order to determine the most relevant properties of the dried sewage sludge samples, TG-FTIR, elemental and X-ray fluorescence analyses were conducted. During the thermogravimetric analysis TG 209 F1 Libra equipment was used, and the pyrolysis temperature was changed between 30 and 900 °C, with heating rates of 25, 50 and 100 °C/min. In order to maintain an inert atmosphere, constant nitrogen flow (20 mL/min) was established in each experiment.
The gas products of the pyrolysis experiments were analyzed using an FTIR spectrometer (Bruker Invenio S). In order to avoid secondary reactions, the released volatiles of the TG analysis were swept immediately to the gas cell and to the liquid-nitrogen-cooled PERMAVAC MCT detector of the FTIR spectrometer. During the measurements, the transfer line was heated up to 230 °C in order to avoid the condensation of volatile decomposition products. The scanning range of the IR spectrometer was 4000–400 cm−1, and the resolution and the sensitivity were 3 and 1 cm−1, respectively.
In order to determine the C, H, N, S and O contents, ultimate analysis was carried out in an elemental analyzer (Carlo Erba); in order to identify the inorganic compounds (e.g., Na, Mg, Al, Ca, Fe, K, P, Si), energy dispersive X-ray analysis was also performed (Shimadzu, EDX-8100).
The morphology of the raw materials was also investigated via an Apreo S LoVac instrument (FEI/ThermoFischer) coupled with an energy-dispersive X-ray spectrometer (AMETEK, Octane Elect Plus), operated at 2.0 for secondary electron imaging. In order to calculate the main reaction kinetic parameters of sewage sludge pyrolysis, different kinetic models were used. These models can be categorized into model-fitting and model-free fitting isoconversional methods. Among the aforementioned methods, model-fitting isoconversional methods do not allow the determination of the activation energy without first assuming the reaction mechanism [33]; meanwhile, isoconversional model-free fitting methods require only a set of experimental data obtained at more than two different heating rates. Among the isoconversional methods, integral (e.g., Kissinger–Akahira–Sunose (KAS), Flynn–Wall–Owaza (FWO)) and differential methods (e.g., Friedman) can be distinguished. The KAS and FWO methods rely on the temperature integral approximation, while the Friedman model uses a determination of the reaction rate at an equivalent stage for various heating rates instead of from any mathematical approximation [34].

2.2. Apparent Kinetic Parameters on the Basis of Arrhenius Equation Using First-Order Kinetic Approach

The activation energy and pre-exponential factor were calculated, as follows, by the weight loss of samples, since the weight loss is the function of activation energy [16,35]:
d x d t = A · e ( E R T ) ( 1 x )
where “A” is the pre-exponential factor, “E” is the activation energy, “T” is the temperature, “t” is the time for reaction and “R” is the universal gas constant. It is also known that the “x” can be calculated, as follows, from the knowledge of “mi”, “mt” and “mf”:
x = m i m t m i m f · 100
where “mi”, “mt” and “mf” are the initial weights of sample, sample weight at “t” time and final weight of sample, respectively. This model is widely used to investigate solid state reactions; however, it should be used to describe homogenous and heterogeneous reactions [35].

2.3. Kinetic Parameters on the Basis of Model-Free Methods

2.3.1. Flynn–Wall–Ozawa Model

The FWO model is a widely used method to describe the decomposition of different polymers when more than one simultaneous reaction can take place [16,19]. The kinetic free model uses the following equations to calculate the activation energy:
d x d t = k ( T ) β · f ( a ) = A β · e x p ( E R T ) · f ( a )
ln β = ln ( A E R g ( a ) ) 5.523 1.0518 ( E R T )
where “T” is the absolute temperature at the specified fraction (k), “E” is the apparent activation energy, “A” is the pre-exponential factor, “α” is the conversion of the reaction, “R” is the universal gas constant and “β” is the heating rate. The FWO model calculates the activation energy from the slopes (−E/R) of the ln(β) vs. 1/T curves.

2.3.2. Kissinger–Akira–Sunose Model

The KAS model is also a model-free method that should be used to calculate the activation energy of the process as a function of heating rate and conversion by the following equation [16,22]:
ln ( β T a 2 ) = ln ( A · R E a g ( a ) ) E R T a
where “β” is the heating rate, “T” is the temperature, “α” is the conversion, “A” is the pre-exponential factor, “R” is the universal gas constant and “E” is the apparent activation energy. In the KAS method, a plot of ln(β/T2) versus 1/T at different conversions gives a straight line from which the value of apparent activation energy (E) can be calculated.

2.3.3. Friedman Model

The Friedman model is also an isoconversional method that can be used to calculate the activation energy of the process by the following equation [16,18]:
ln ( d α d t ) = ln ( ( f α ) · A ) E R T
where “α” is the conversion, “A” is the pre-exponential factor, “R” is the universal gas constant, “E” is the apparent activation energy and “T” is the temperature. The activation energy can be calculated from the slope of ln(dα/dt) versus 1/T, whereas ln(A·(f(α))) is obtained from the intercept.

3. Results and Discussion

The main properties of the raw materials are summarized in Table 2. The moisture content of the raw materials was very different before they were dried to a constant weight (22.83–86.71%). As a result of the different origins of the samples, there were significant differences in their ash content, fixed carbon and elemental composition. The highest ash content was found in sample “H” (74.04%), while the lowest was measured in sample “D” (18.36%). Fixed carbon was in the range from 4.47% (sample “D”) to 23.23% (sample ”E”), and volatiles ranged from 13.29% (brook mud) to 64.72% (chicken manure). Significant differences could also be found among the elemental compositions of the samples. The contents of carbon and hydrogen were the highest in sample “D” (municipal sewage sludge), while sample “C” (municipal sewage sludge) had the highest nitrogen and sulfur content. For other elements, alkali metals, alkaline earth metals, transition metals, silica, phosphorus, etc., could be measured in the samples.
The highest concentration of other elements was found in the case of brook mud (22.24%), while the lowest was found in sample “E”, municipal sewage sludge (8.53%). In brook mud, Si and Ca had also high concentrations. Regarding Ca, K, Fe, Al and P, cattle manure, chicken manure, sample “A”, sample “B” and sample “A” had the highest levels (5.13%, 4.77%, 3.35%, 2.23% and 3.45%), respectively.
The SEM images are summarized in Figure 1. Morphology of the raw materials showed significant differences among the samples. Smaller particle sizes were found in the cases of samples “B” and “F”. For samples “D”, “G” and “E”, the smaller samples were assembled into agglomerates with larger particle sizes. Samples “A” and “C” had relatively large grains with rounded boundaries. The brook mud consisted of grains with sharp boundaries, and its morphology was significantly different from that of the other samples.

3.1. Weight Loss of Samples

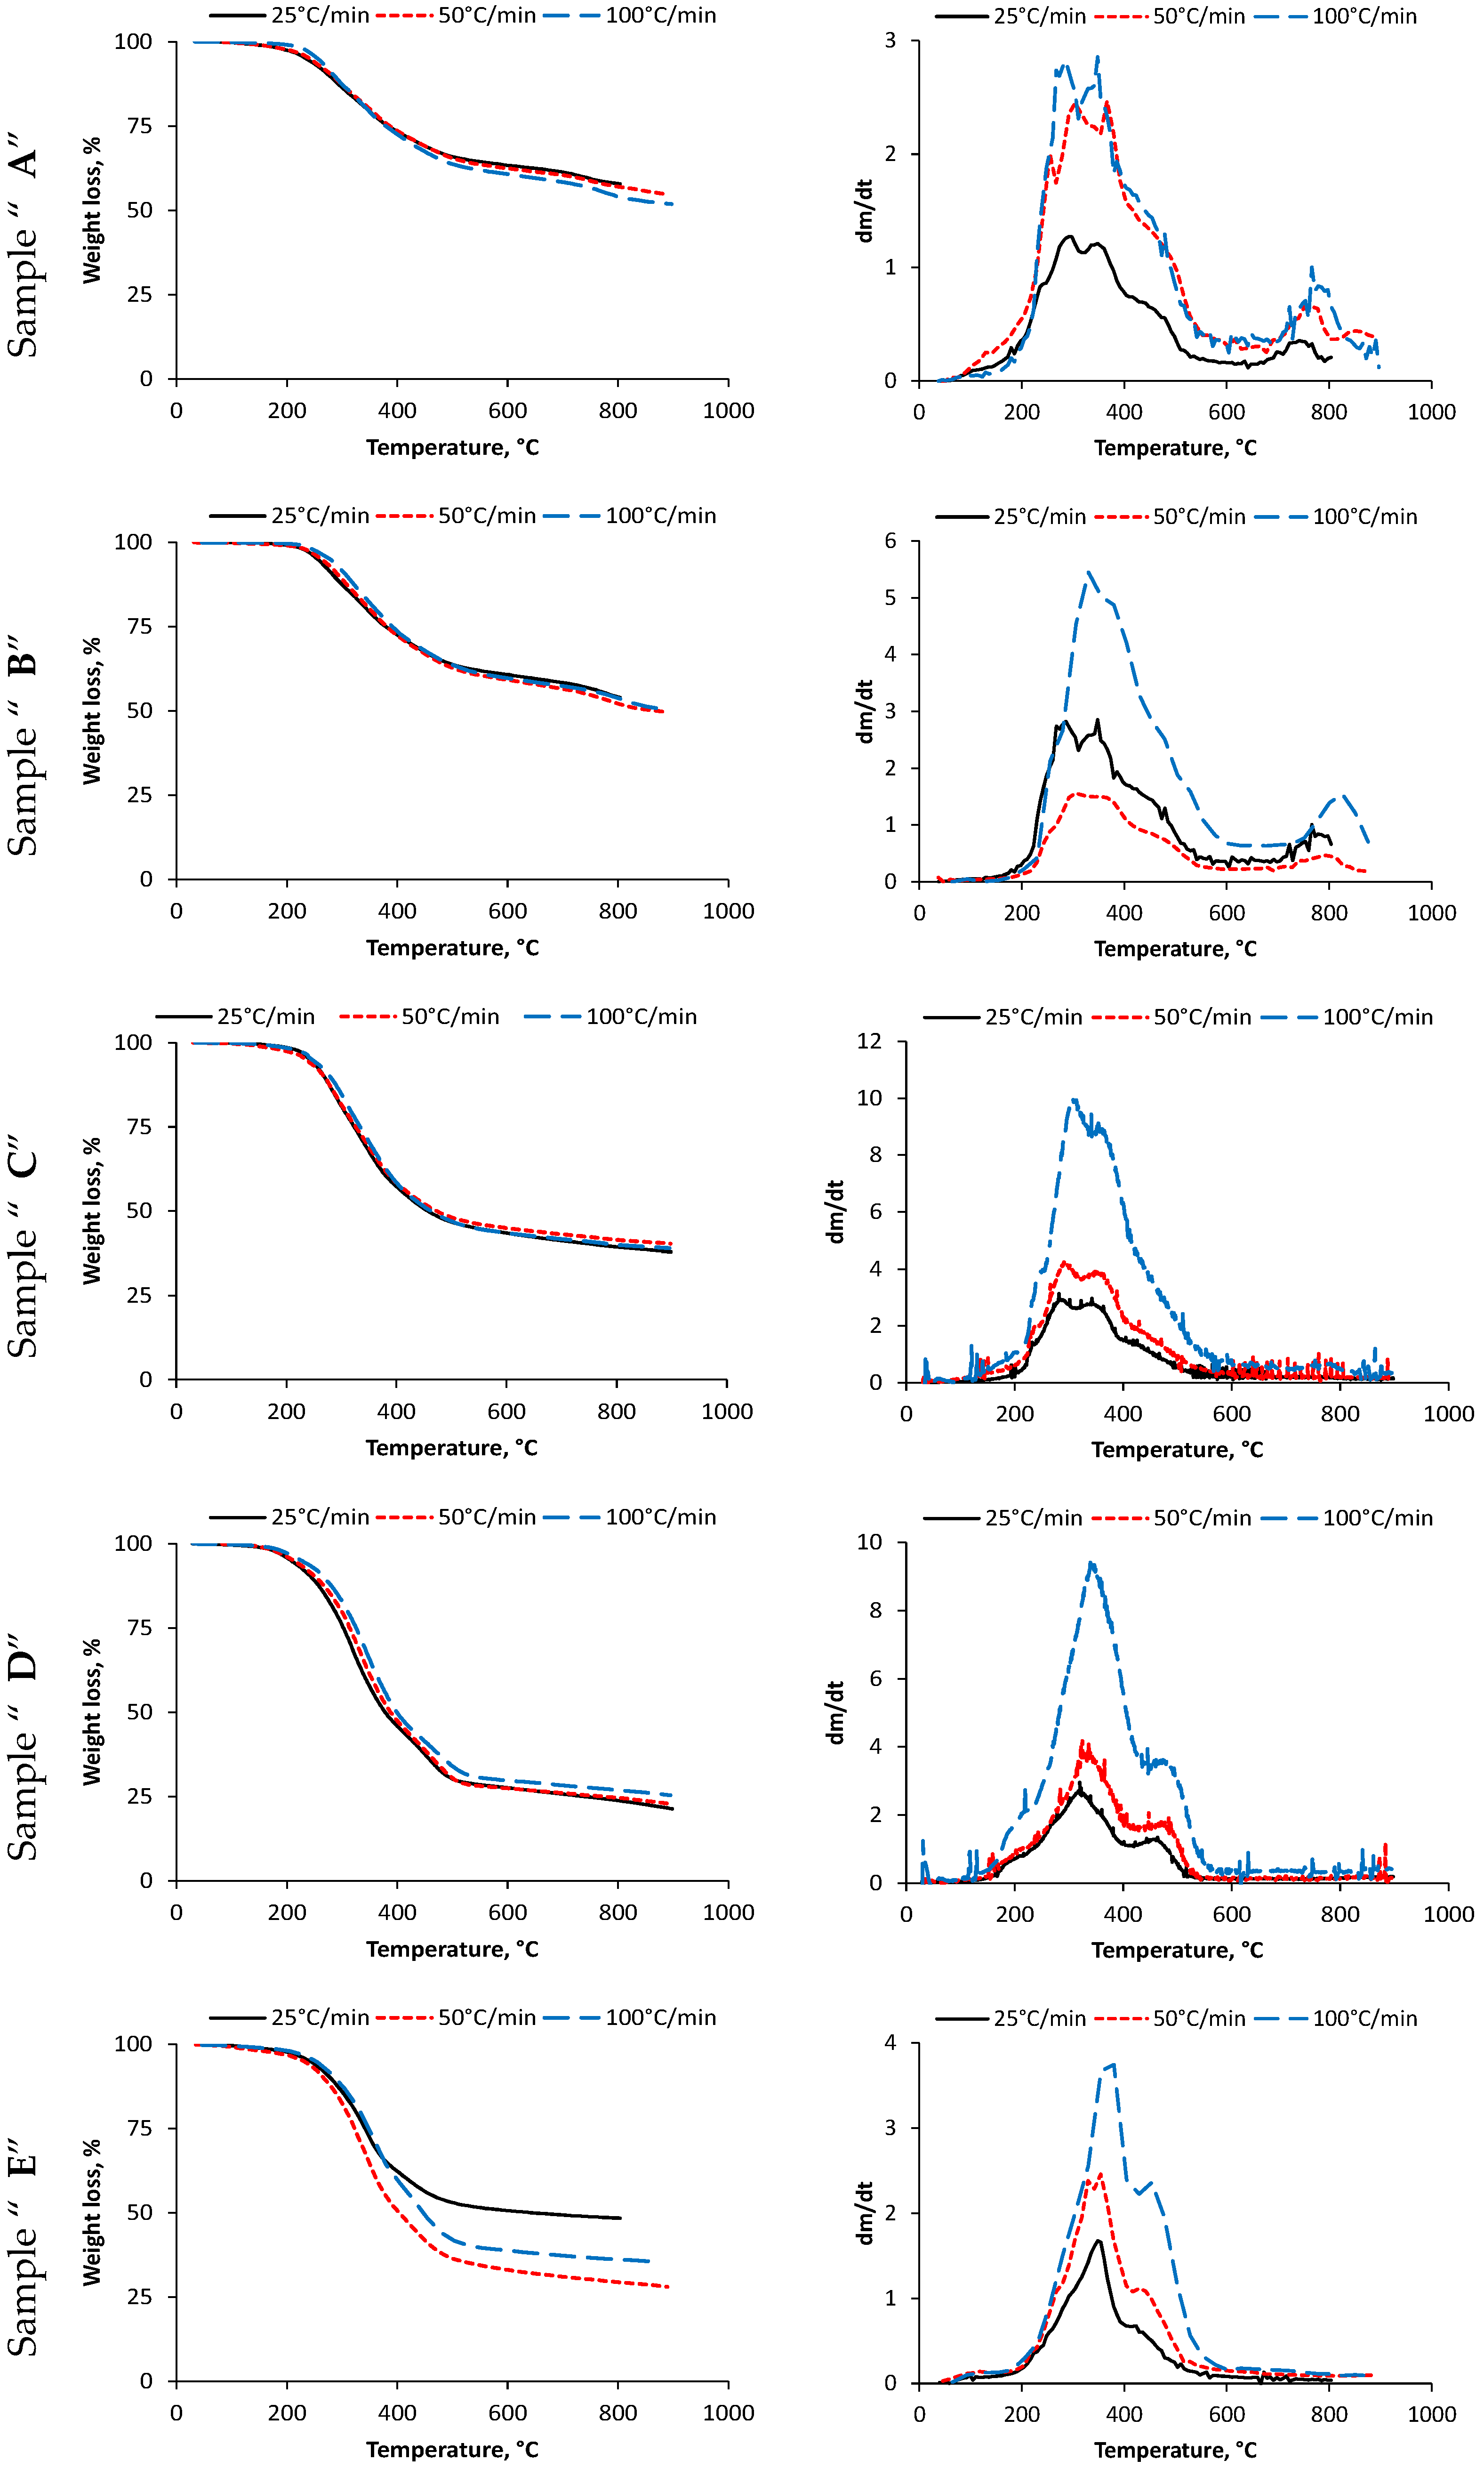
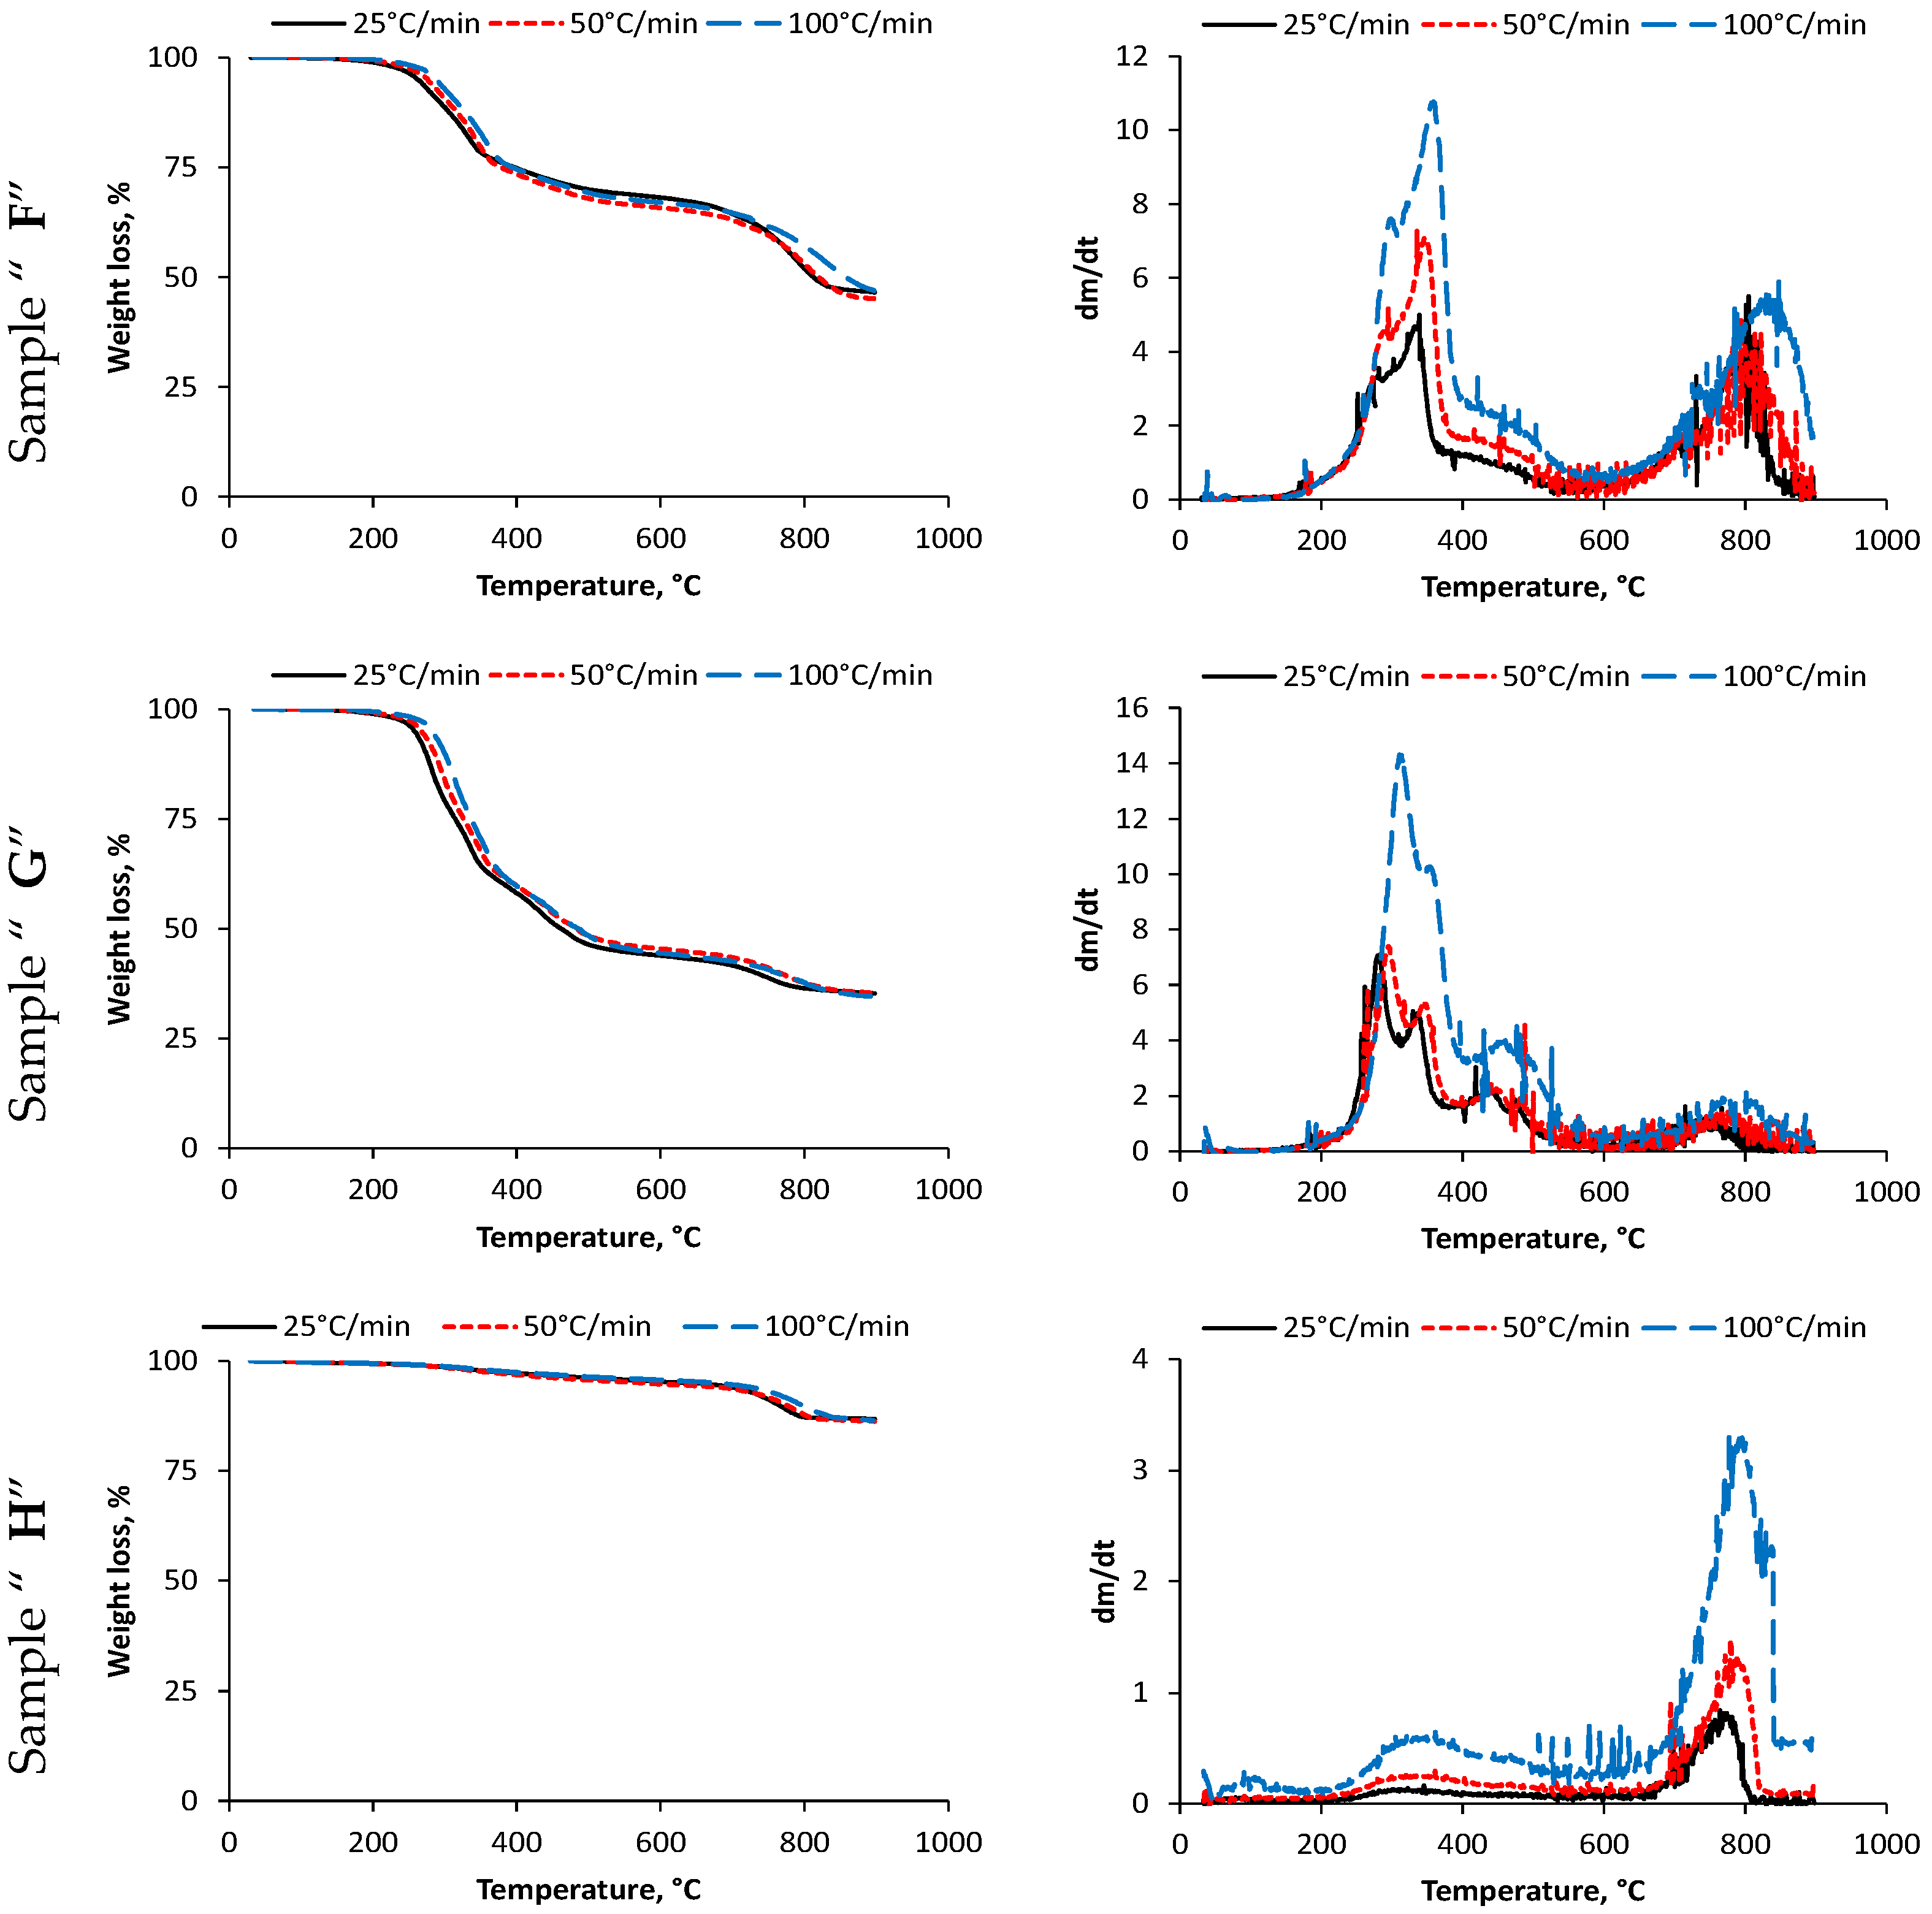
The weight loss and summarized FTIR results obtained at different heating rates are shown in Figure 2 and Figure 3. Based on the results, it can be said that the thermal decomposition of the sewage sludge samples differed significantly from each other. The main decomposition step took place in the temperature range of 200–600 °C; however, there were samples in which the decomposition step could be observed even at temperatures above 700 °C. There was no significant decomposition step above 700 °C for the municipally sourced sewage sludge samples. As the samples were dried to a constant weight prior to testing, no significant change in weight occurred in the drying range (<180 °C). The torrefaction ranges from 180 to 280 °C, and pyrolysis from 300 to 600 °C. Above 600 °C, the range of pyrolysis is generally distinguished in the literature [16].
Based on these results, it was found that the typical weight loss processes took place into the range of pyrolysis. Regarding the effect of the heating rate, only small differences could be found on the basis of the weight loss curves; however, the dm/dt curves already showed more significant differences. In each case, the curve obtained using the heating rate of 100 °C/min resulted in the highest dm/dt values, and this curve was well separated from the other two. The results obtained at heating rates of 25 °C/min and 50 °C/min were closer. It is also worth mentioning that there were no observable differences among the amounts of residues obtained at 900 °C.
Table 3 summarizes the main temperatures of the decomposition and the char amounts. Based on the results, it is clear that the typical temperatures shifted by 10–30 °C towards higher values with increasing heating rates. The first step of mass change was between 298 and 351 °C; that of the second step was between 443 and 476 °C; and that of the third step was between 728 and 824 °C. It should be noted, however, that in the case of the second step, it was not possible to establish maximum values on the dm/dt curves for most of the samples. After the first, second and third steps, the residues were in the range of 44.91–96.80%, 28.33–69.01% and 21.34–86.71%, respectively. Sample “H” (brook mud) had the most residues (81.34–86.71%), while sample “C” had the least (21.44–25.67%).

3.2. FTIR Results of Sample Decompositions
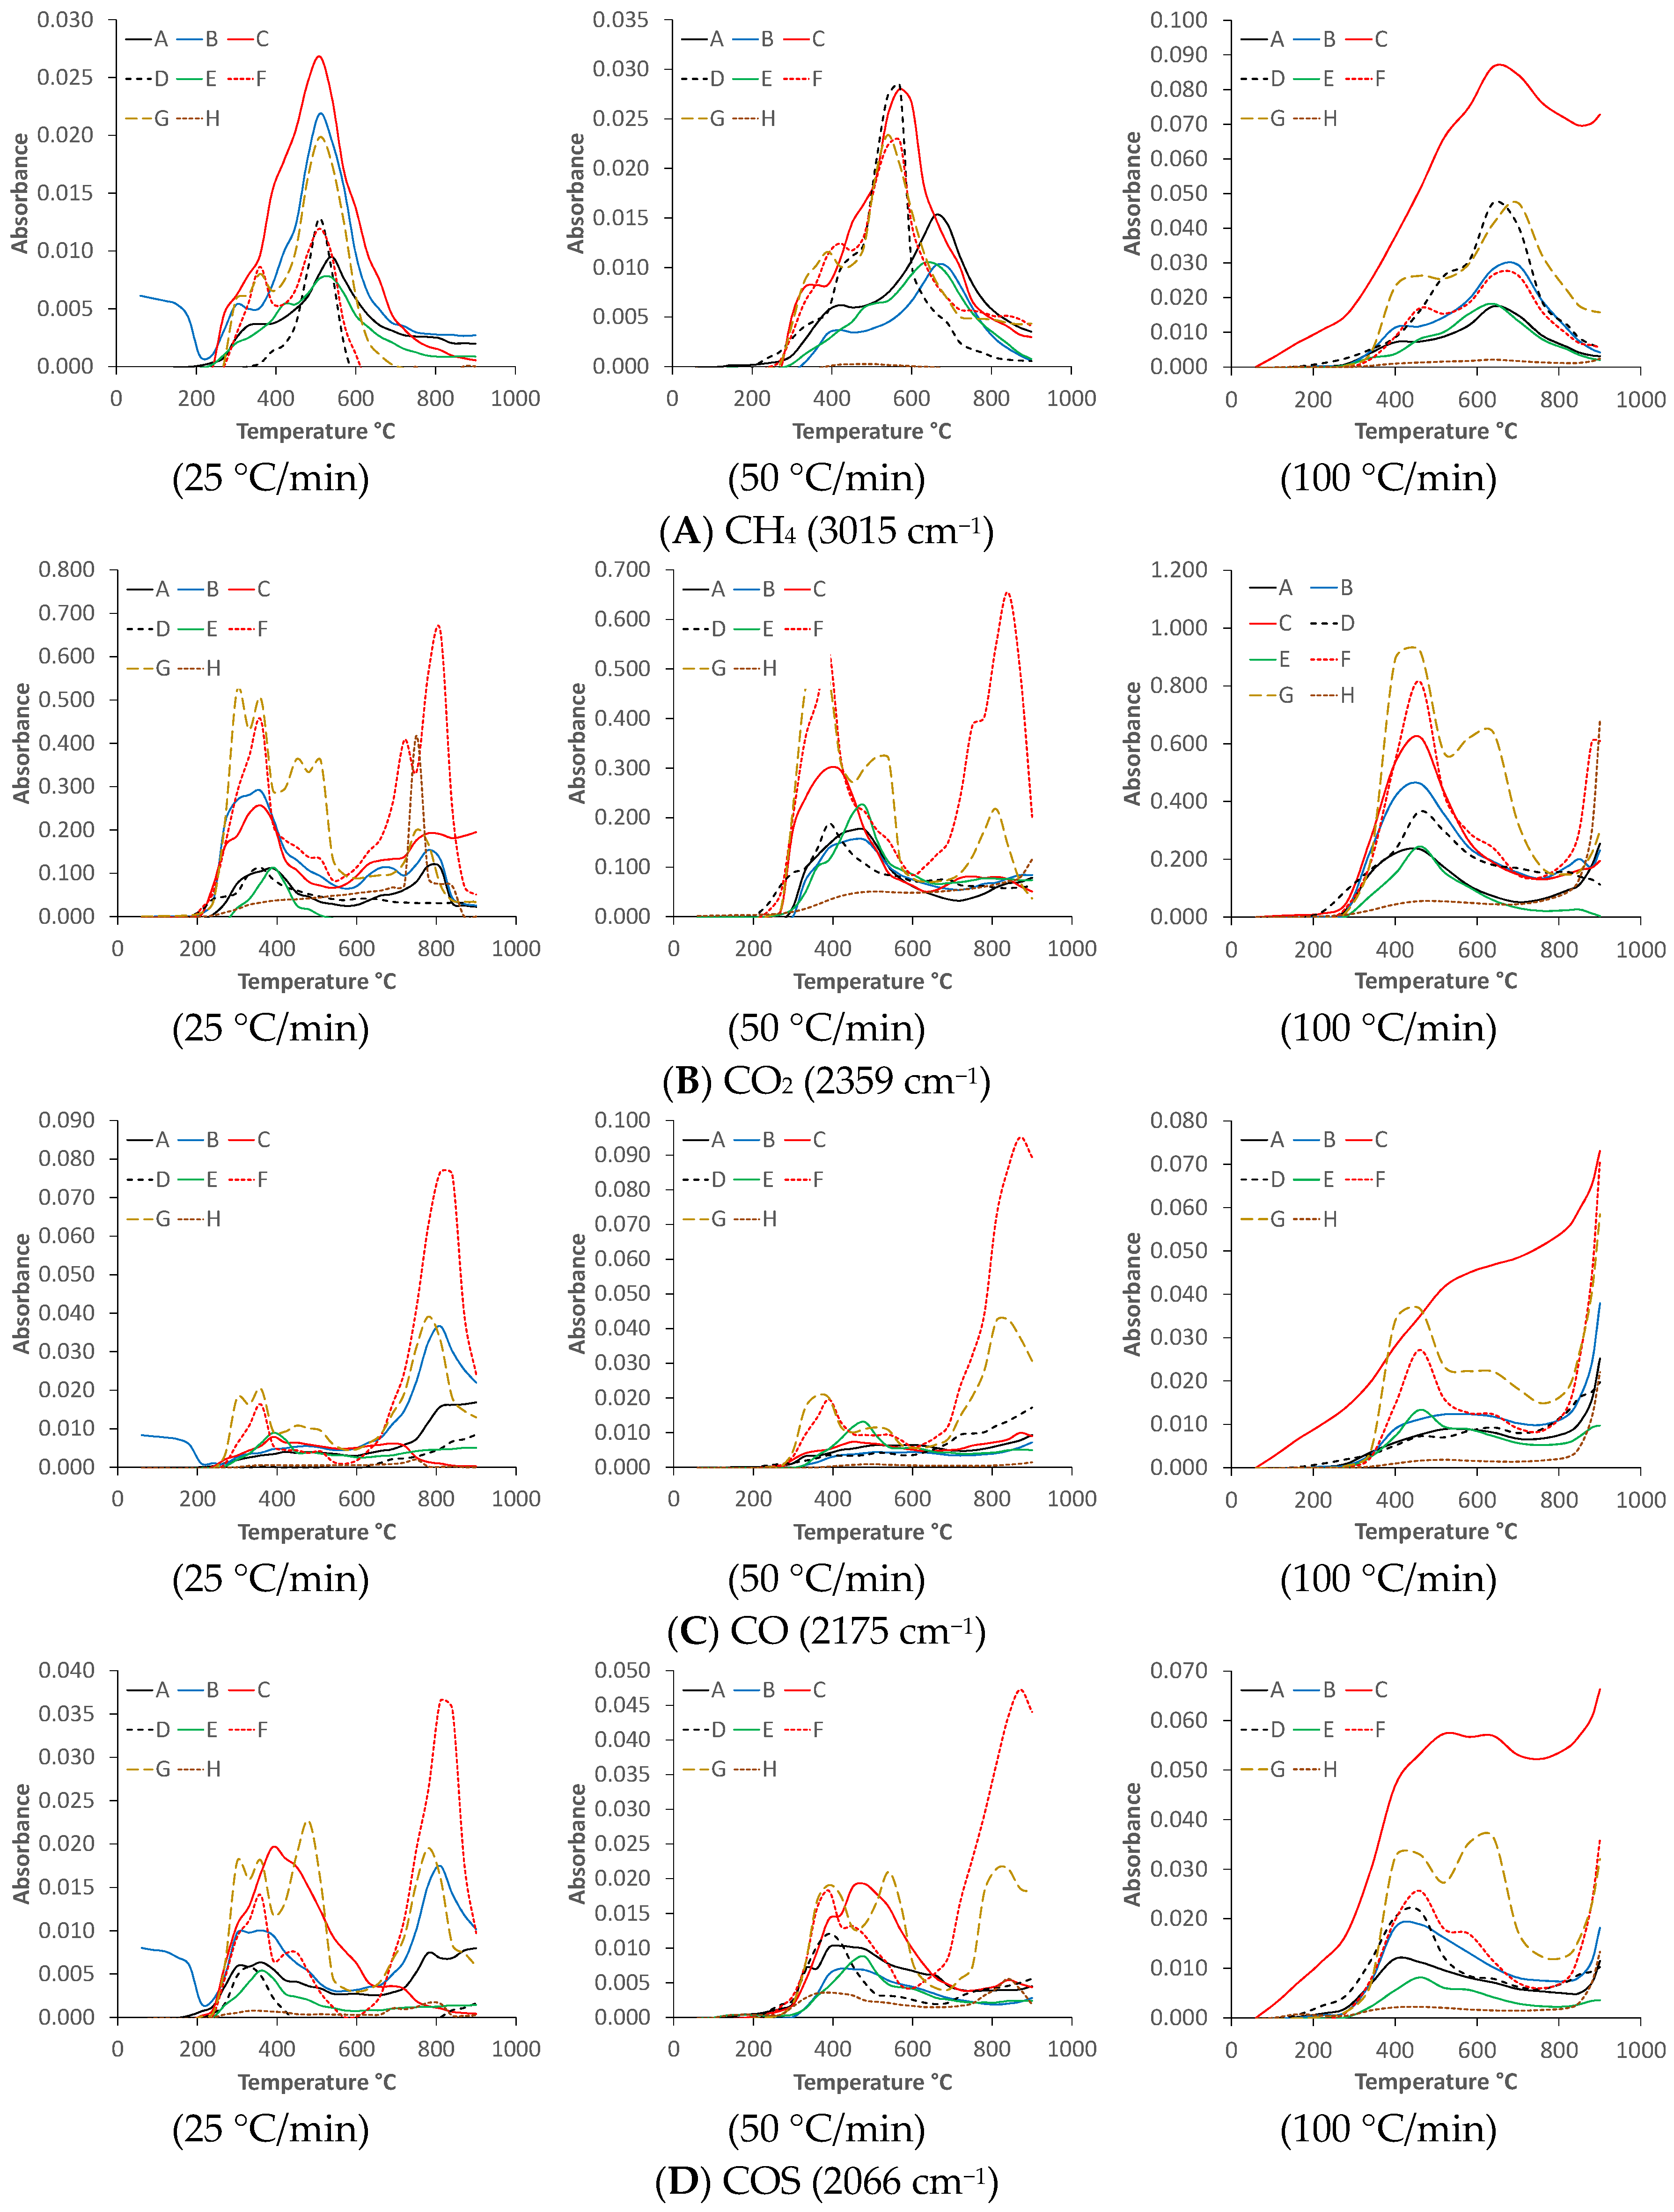
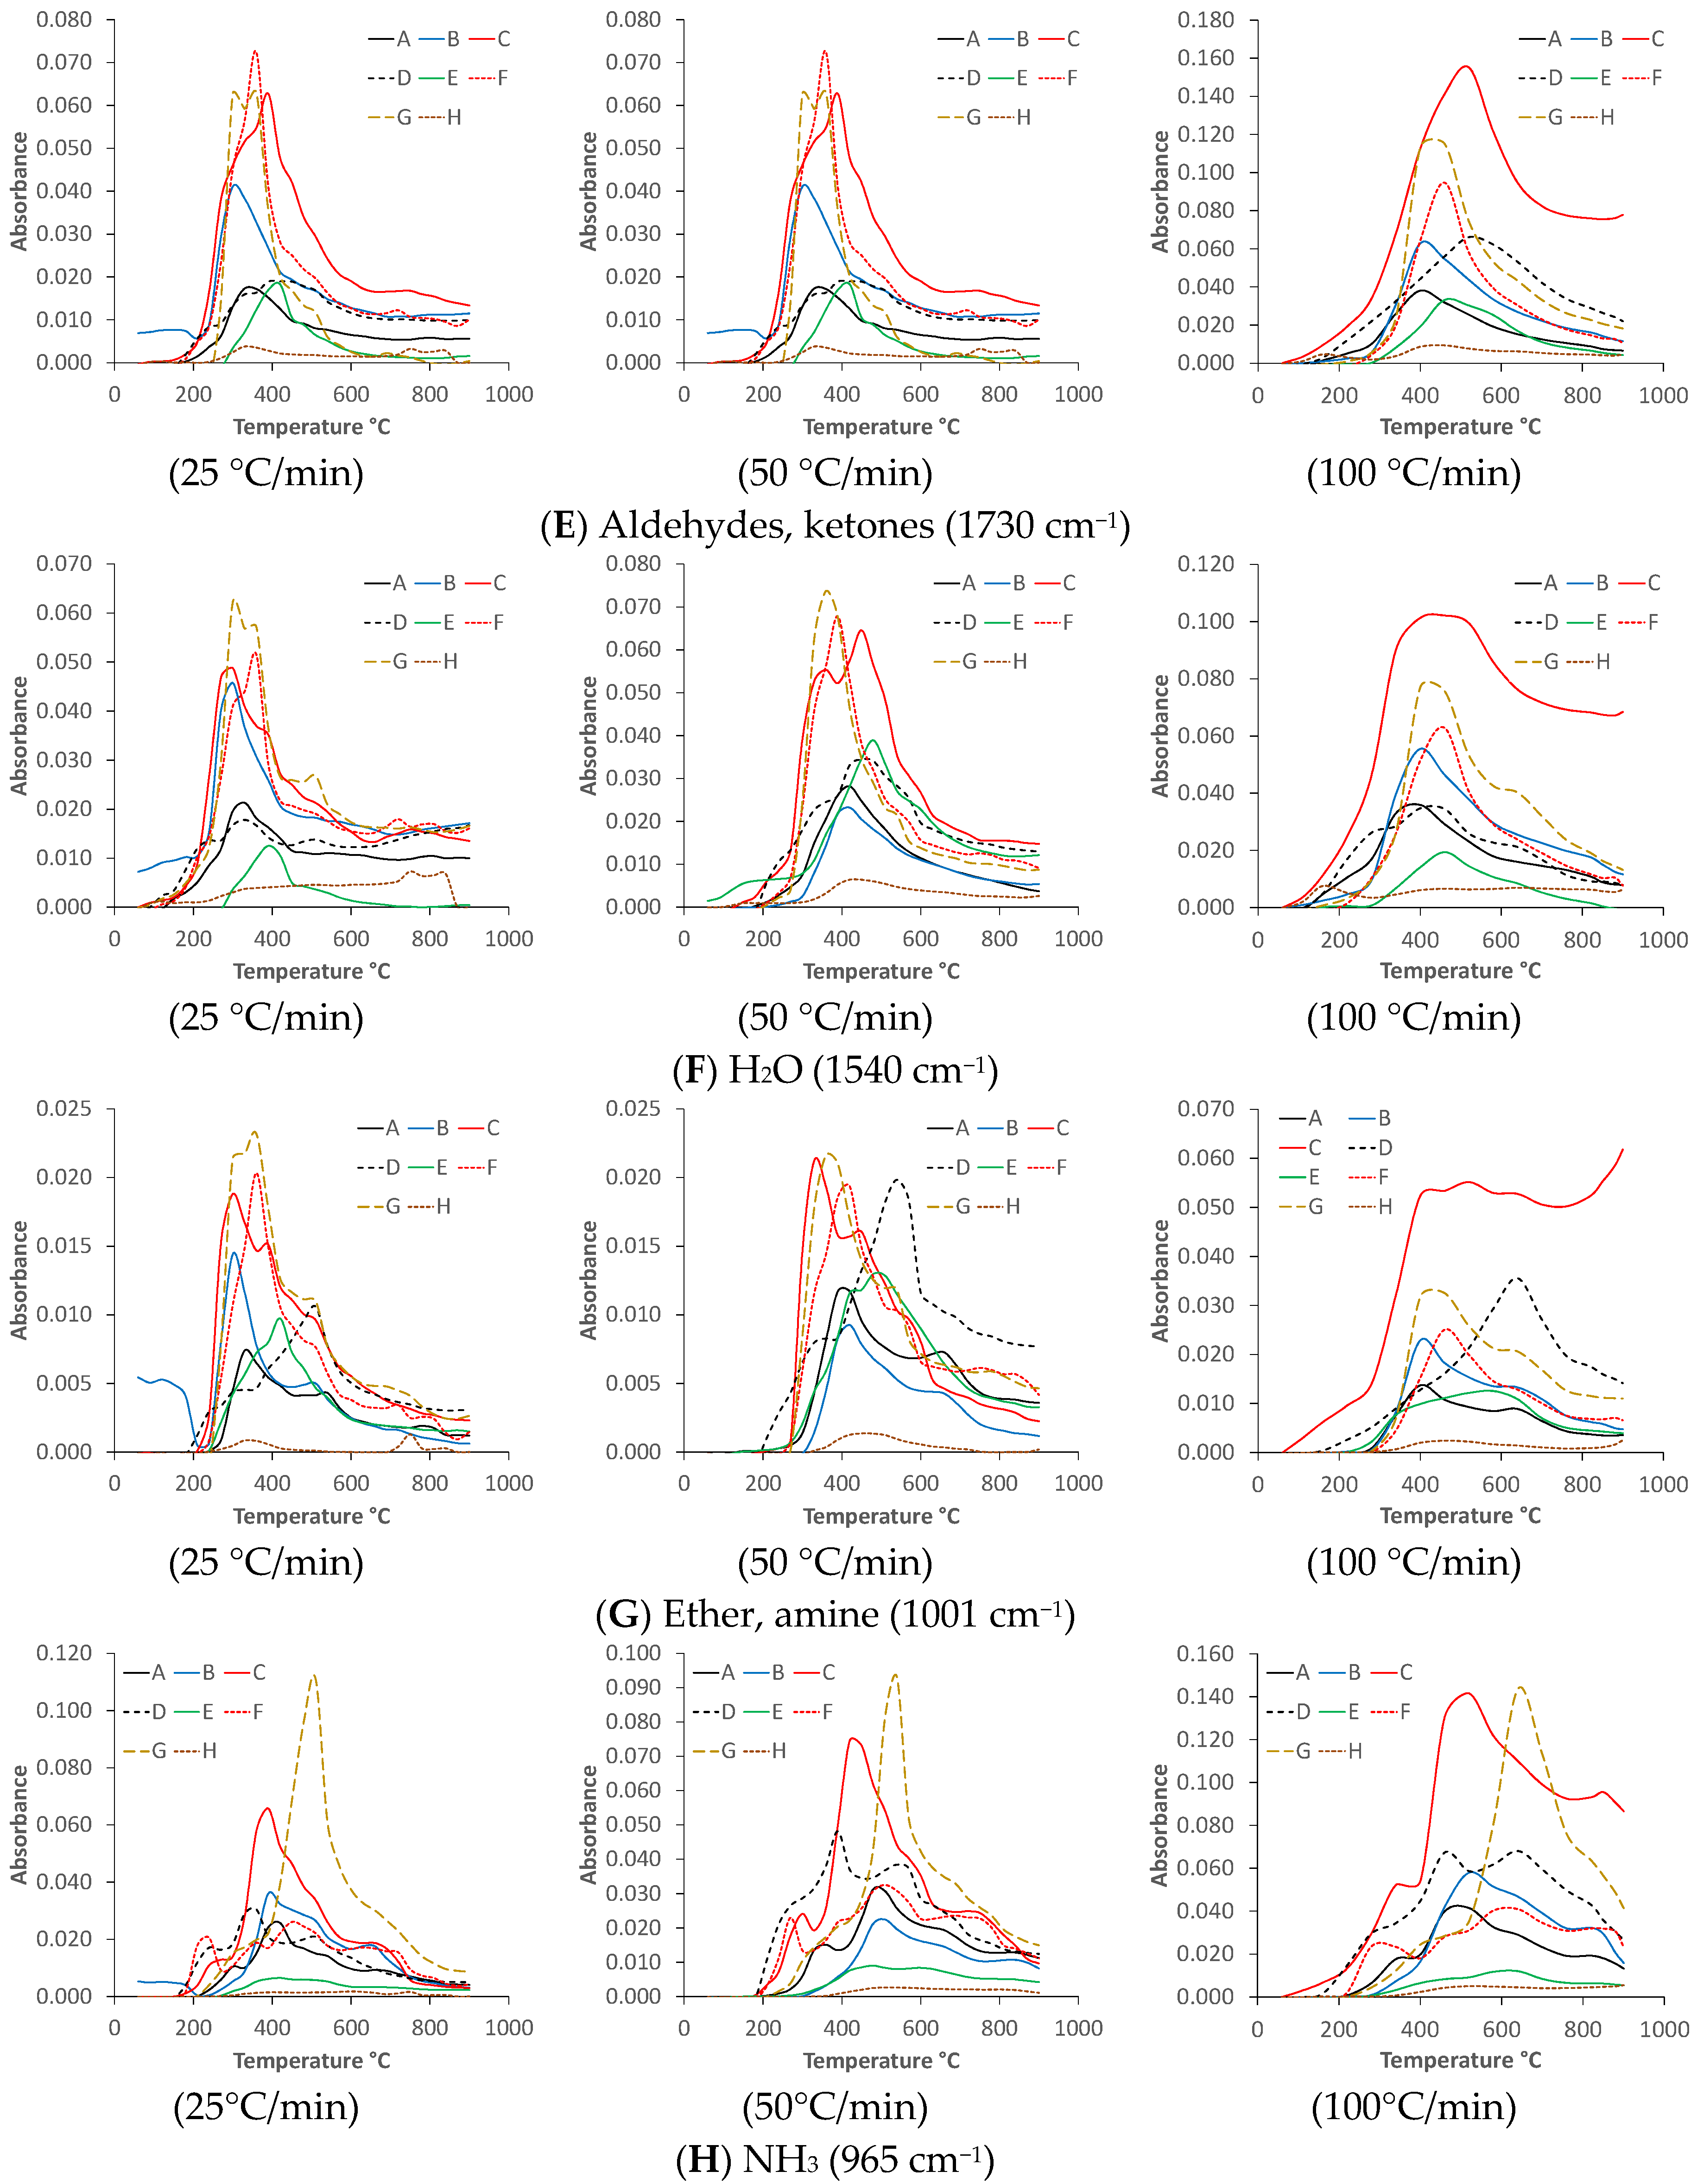
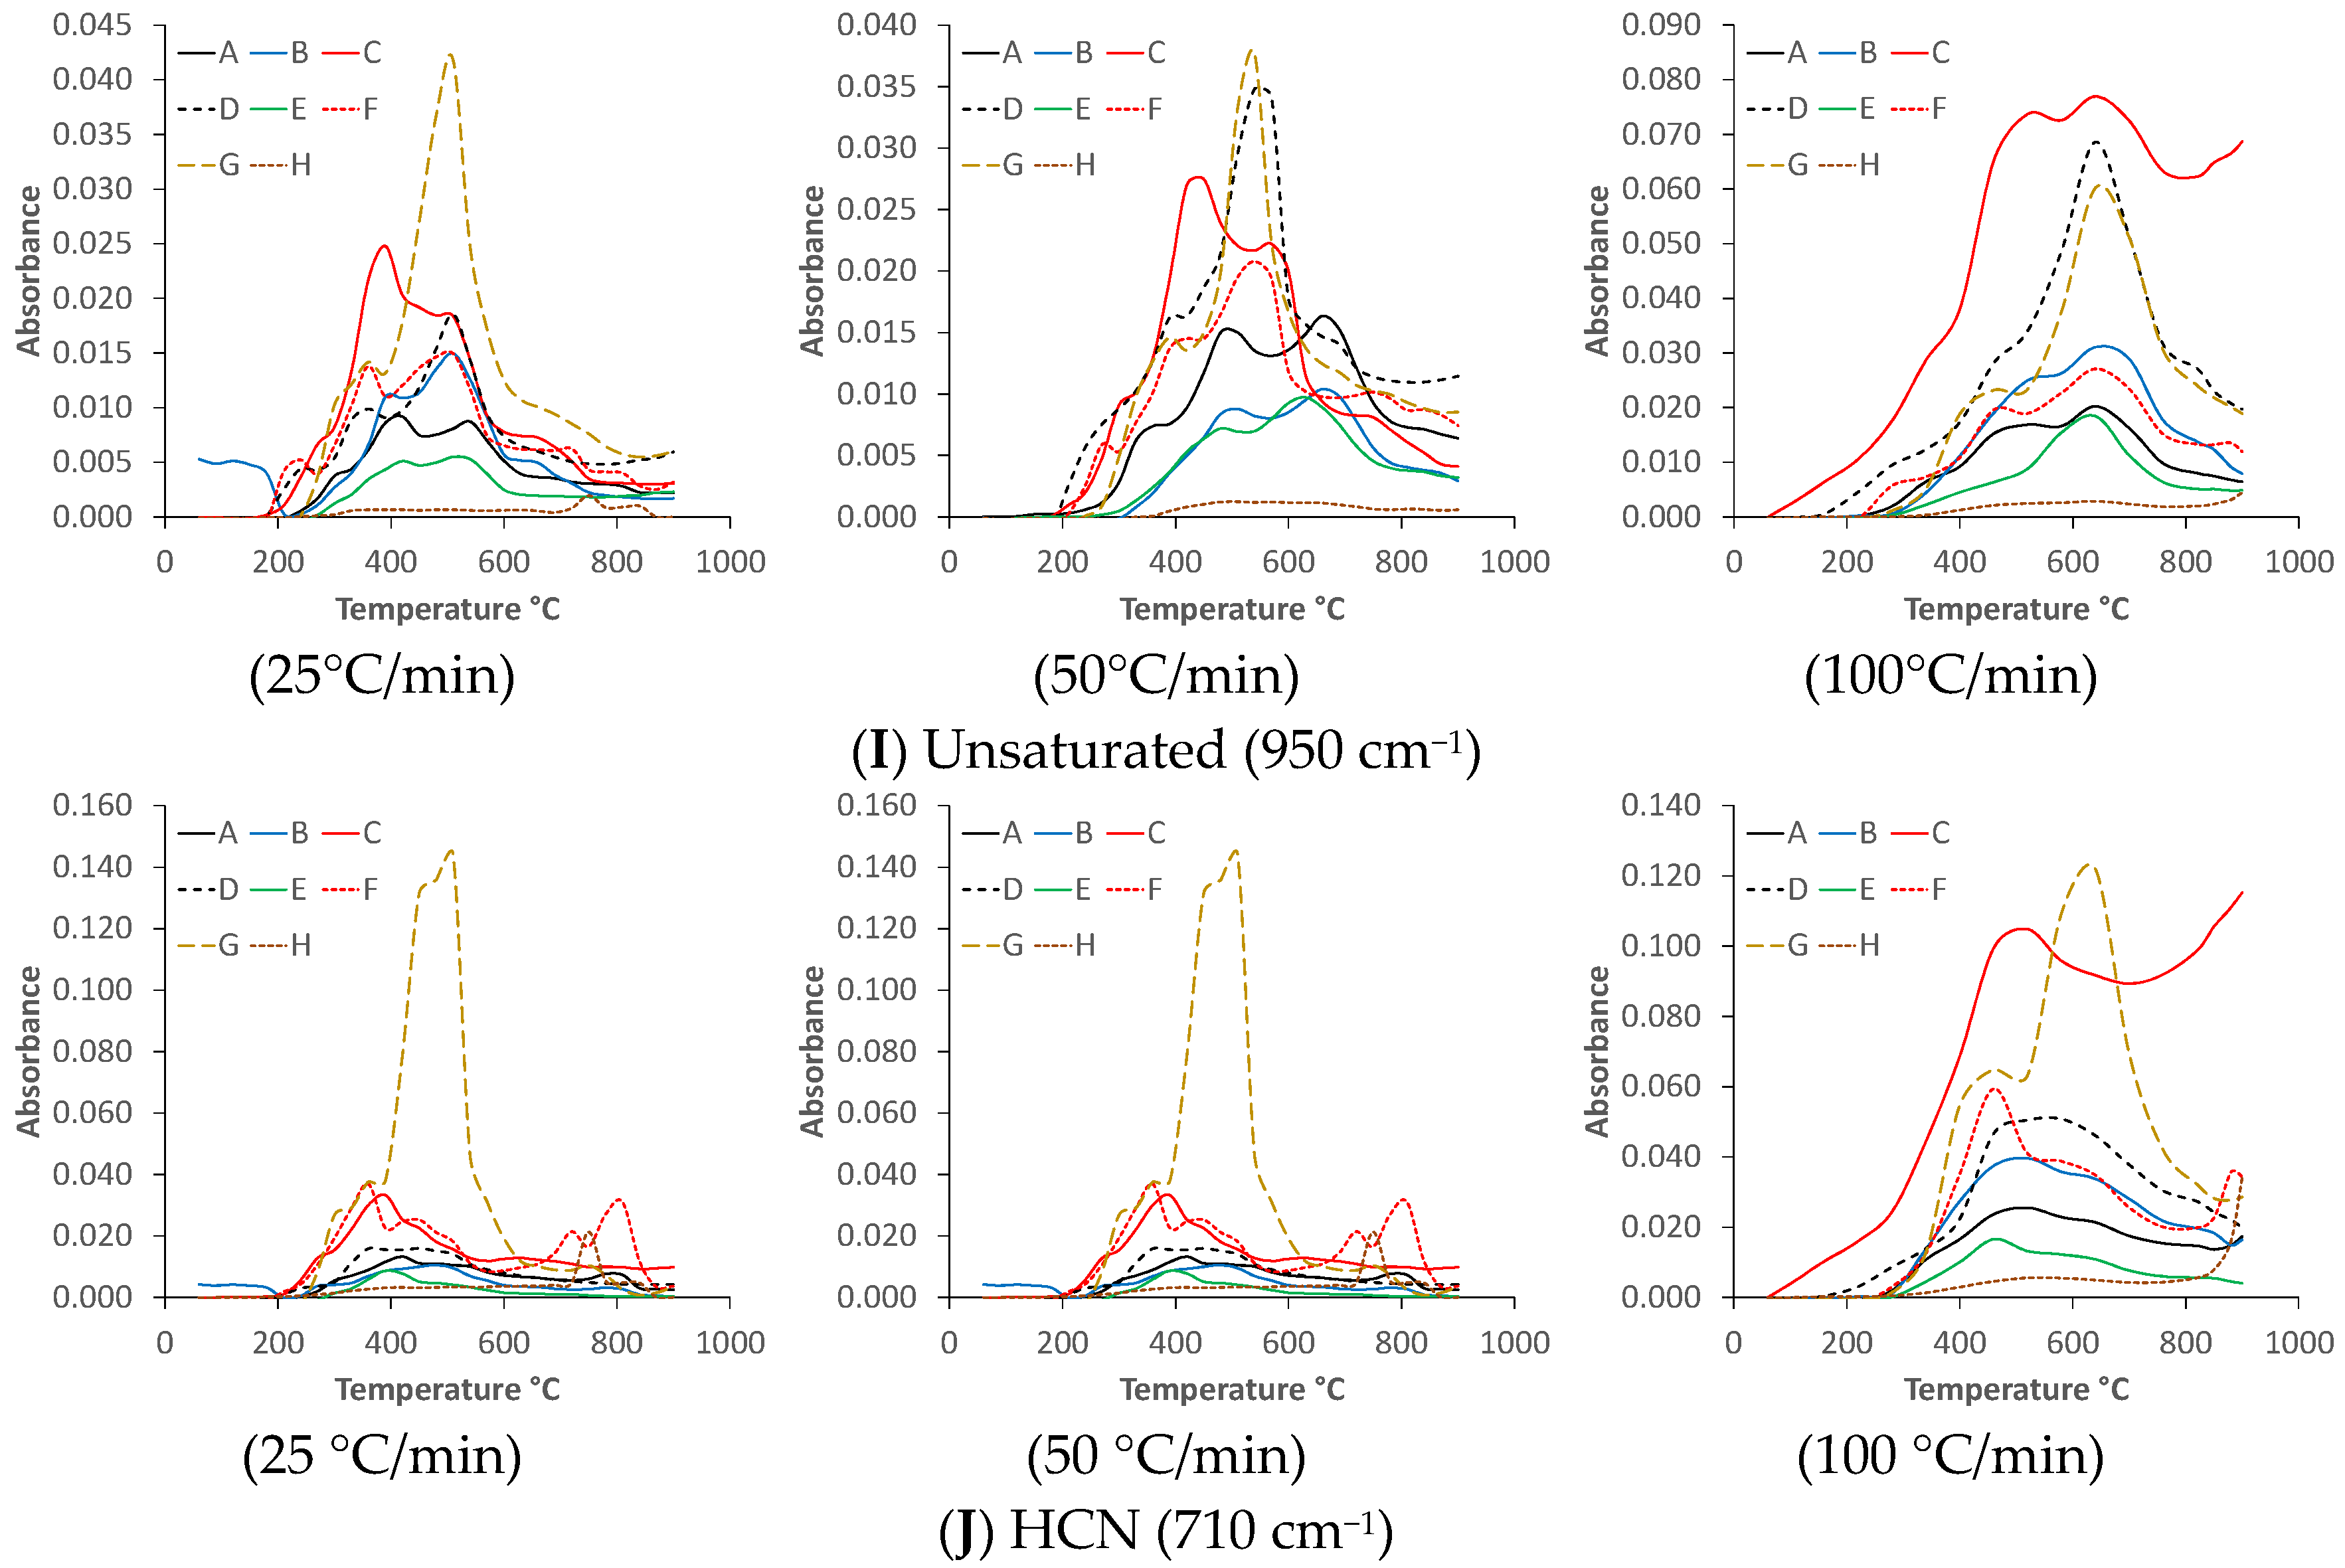
On the basis of characteristic vibrations of different chemical bonds, the following molecules were identified and investigated: methane (3015 cm−1, Figure 3A), carbon dioxide (2359 cm−1, Figure 3B), carbon monoxide (2175 cm−1, Figure 3C), carbonyl sulfide (2066 cm−1, Figure 3D), aldehydes, ketones (1730 cm−1, Figure 3E), water (1540 cm−1, Figure 3F), ether, amine (1001 cm−1, Figure 3G), ammonia (965 cm−1, Figure 3H), unsaturated hydrocarbons (950 cm−1, Figure 3I) and hydrogen cyanide (710 cm−1, Figure 3J). It is clear that with increasing temperature, the initial water content of the samples was removed. This is indicated by the change in the intensity of the infrared band at a wavenumber of 1540 cm−1 (Figure 3F), which showed an increase to about 250–300 °C before beginning to suddenly decrease. The absorbance values did not change significantly after 650–800 °C, which indicates that the water content was removed and that water may have formed during the chemical reactions. The water-specific absorption band occurred at the earliest for sample “D” (municipal sewage sludge), while “G” (chicken manure) occurred latest, in which the order was independent of the heating rate. The highest absorbance values were observed for samples “G”, “D”, “F”, “B” and “I”, with only very small changes in absorbance observed for samples “E” and “H” as a function of temperature. Regarding the heating rate, the location of the peak maximum shifted toward higher temperature values, and some of the distributed peaks began to overlap. However, the order of the absorbance of samples “G”, “D”, “F”, “B” and “I” changed through the application of different heating rates. The infrared absorption maximum (at 750 and 780 °C) for samples “G” (chicken manure) and “H” (brook mud) was due to the decomposition of inorganic bicarbonates (Me(HCO3)x→MeO + H2O + CO2) or hydroxides (Me(OH)x→MeO + H2O).
The lower temperature ranges were also characterized by the formation of CO and CO2 due to the primary thermal decomposition of polysaccharides in the samples. This occurred in the range of 200–400 °C using a heating rate of 25 °C/min, which shifted towards the higher temperatures using faster heating rates. Based on the literature, it can be mentioned that the production of CO2 is favored by the high hemicellulose content and by the production of CO resulting from the high lignin content [14,15].
Additional infrared activity was observed in the temperature ranges of 400–600 °C and 700–900 °C in the form of separated peaks and shoulders for the case of CO, but especially for CO2. The CO2 typically resulted in multiple peaks and shoulders (Figure 3B). In the case of CO (Figure 3C), the infrared activity in the temperature range of 400–600 °C was only very limited; meanwhile, above 600 °C characteristic and high intensity absorbance values of samples “F” (cattle manure) and “G” (chicken manure) could be measured independently from the heating rates. Regarding CO2, the intensities of the infrared bands in the ranges of 200–400 °C and 700–900 °C were in the same absorbance range, while in the case of CO the absorbance values observed in the range of 700–900 °C were at least four times higher than in the range of 200–400 °C. The aforementioned maximum intensity shift was also observed for infrared activity above 400 °C. It is also worth mentioning that at lower heating rates, the peak values were well separated in most cases, while during faster heating rates, the separated bands fused and overlapped with each other. Based on the results, it can be concluded that in the case of rapid pyrolysis of sewage sludge samples, a higher reactor temperature must be used to obtain product with the same composition as using slower heating rates. It is also worth mentioning that the changes in samples “C”, “D” or “I” were very limited. For samples “F”, “G” and “H”, the maximum absorbance of 2359 cm−1 around 750–850 °C was due to the decomposition of the inorganic bicarbonate (750 °C) and carbonate (840 °C) components in the samples. Regarding the Boudouard reaction (C + CO2→CO), no significant effect of the heating rate can be concluded.
Methane formation could be observed from 250 °C (Figure 3A). At a heating rate of 25 °C/min, the first peak was observed at 360 °C and the second at 510 °C. The intensity of the first peak was about half of the peak at 510 °C. Using a heating rate of 50 °C/min, both peak maxima were shifted nearly by 30–40 °C towards higher temperatures. Another effect of the heating rate is that the width of the absorbance distribution become wider as a function of increasing heating rates.
According to literature data, the thermal decomposition of lignin-rich materials results in high methane contents [14,15]. This is especially true for methane at lower temperatures. Regarding the COS compounds (Figure 3D), a broad absorbance distribution with several local maxima was observed between 350 and 600 °C, followed by another but slim peak above 600 °C, with a maximum above 800 °C. The location of the peak above 800 °C could no longer be interpreted because the distribution curve shifted towards higher temperature ranges when using faster heating rates. For COS, samples “F” (cattle manure) and “G” (chicken manure) had the highest maximum values.
At 1730 cm−1, using a heating rate of 25 °C/min resulted in a broad elongated curve in the temperature range of 200–600 °C (Figure 3E). The maxima of the curves were found at temperatures between 300 and 400 °C. At a heating rate of 50 °C/min, the maximum values were between 360 and 450 °C. These infrared bands (C=O stretching vibration) indicate the presence of aldehydes, ketones and carboxylic acids. The absorbance values were the highest for samples “D” (municipal sewage sludge), “G” (chicken manure), F” (cattle manure) and “B” (municipal sewage sludge). The best resolution of absorbance distribution was found in the case of a 25 °C/min heating rate.
Figure 3. Summarized FTIR results.
Energies 15 05116 g003aEnergies 15 05116 g003bEnergies 15 05116 g003c
Similar results were observed based on the infrared activity at 1001 cm−1, suggesting the presence of ethers and amines (C-O and N-H stretching vibrations). However, e.g., when using a heating rate of 25 °C/min, a peak maximum between 300–360 °C in addition to a local maximum were observed at 500 °C, as function of the temperature dependence of the absorbance values. Using faster heating, the previous temperature values shifted towards higher ranges, and the width of the absorbance distribution became wider.
Due to the thermal decomposition of proteins in the raw materials, ammonia (965 cm−1) and cyanide (710 cm−1) components were also detected in the TG-FTIR results (Figure 3H,J). For ammonia, a broad elongated curve with multiple local maxima in the wavelength range between 200 and 900 cm−1 was obtained for the temperature dependence of the absorbance value. The first local maximum of the absorbance occurred at ~360 °C and the second at around ~450 °C, using a heating rate of 25 °C/min. It is worth mentioning that the second maximum was followed by another local maximum at 510 °C for chicken manure, and for this raw material the values of the last two maxima were significantly higher than those at the first peak. Using a heating rate of 50 °C/min, the location of the first peak changed to ~390 °C, and no separation was observed at the next peak. It is also clear that when using cattle manure and chicken manure raw materials, a well-separated peak appeared in the temperature range between 700 °C and 900 °C, with maxima of 800 °C, 835 °C and 890 °C as a function of the heating rates. From the above results, it can be concluded that nitrogen-containing components were formed in both the primary (200–500 °C) and secondary (500–700 °C) pyrolysis temperature ranges, and HCN formation was also observed in the gasification temperature range (>700 °C).

3.3. Reaction Kinetic Calculations

3.3.1. On the Basis of Arrhenius Equation Using First-Order Kinetic Approach

The apparent activation energies calculated using the first-order reaction kinetic approach are summarized in Figure 4. Based on the dm/dt curves, most of the samples showed the main decomposition step occurring between 200 and 600 °C. However, as it can be seen from the dm/dt curves, the broad elongated curve generally had two peak values. In particular, they cause a visible break in the slopes on the ln(−ln(1−x)/T2) vs. 1/T curves. In the cases of chicken manure and cattle manure, three stages of decomposition could be observed that were caused by inorganic substances in addition to organic matter. The activation energies of the first stage were between 25.6 and 85.4 kJ/mol, while the activation energies of the second and third stages were in the range of 11.4–36.3 and 20.2–135 kJ/mol, respectively. It is worth mentioning that in the case of the first stage, an increasing trend in the activation energies was found with increasing heating rate. However, a maximum was found at 50 °C/min in the case of the second stage, while the activation energies decreased as a function of heating rate in the case of the third weight loss stage.
Regarding the first step, the highest activation energies were observed in sample “G” (chicken manure), and the lowest in sample “H” (brook mud). For the second stage, sample “C” resulted in the highest activation energy values, and sample “F” (cattle manure) resulted in the lowest. The activation energies of the third stage showed significantly higher values than the previous ones in the case of sample “H” (brook mud), which in turn decreased significantly with increasing heating rate. In contrast, the municipal sewage sludge samples “A” and “B” had only very small differences in their activation energies obtained at different heating rates.

3.3.2. Kinetic Parameters on the Basis of FWO, Friedman and KAS Models

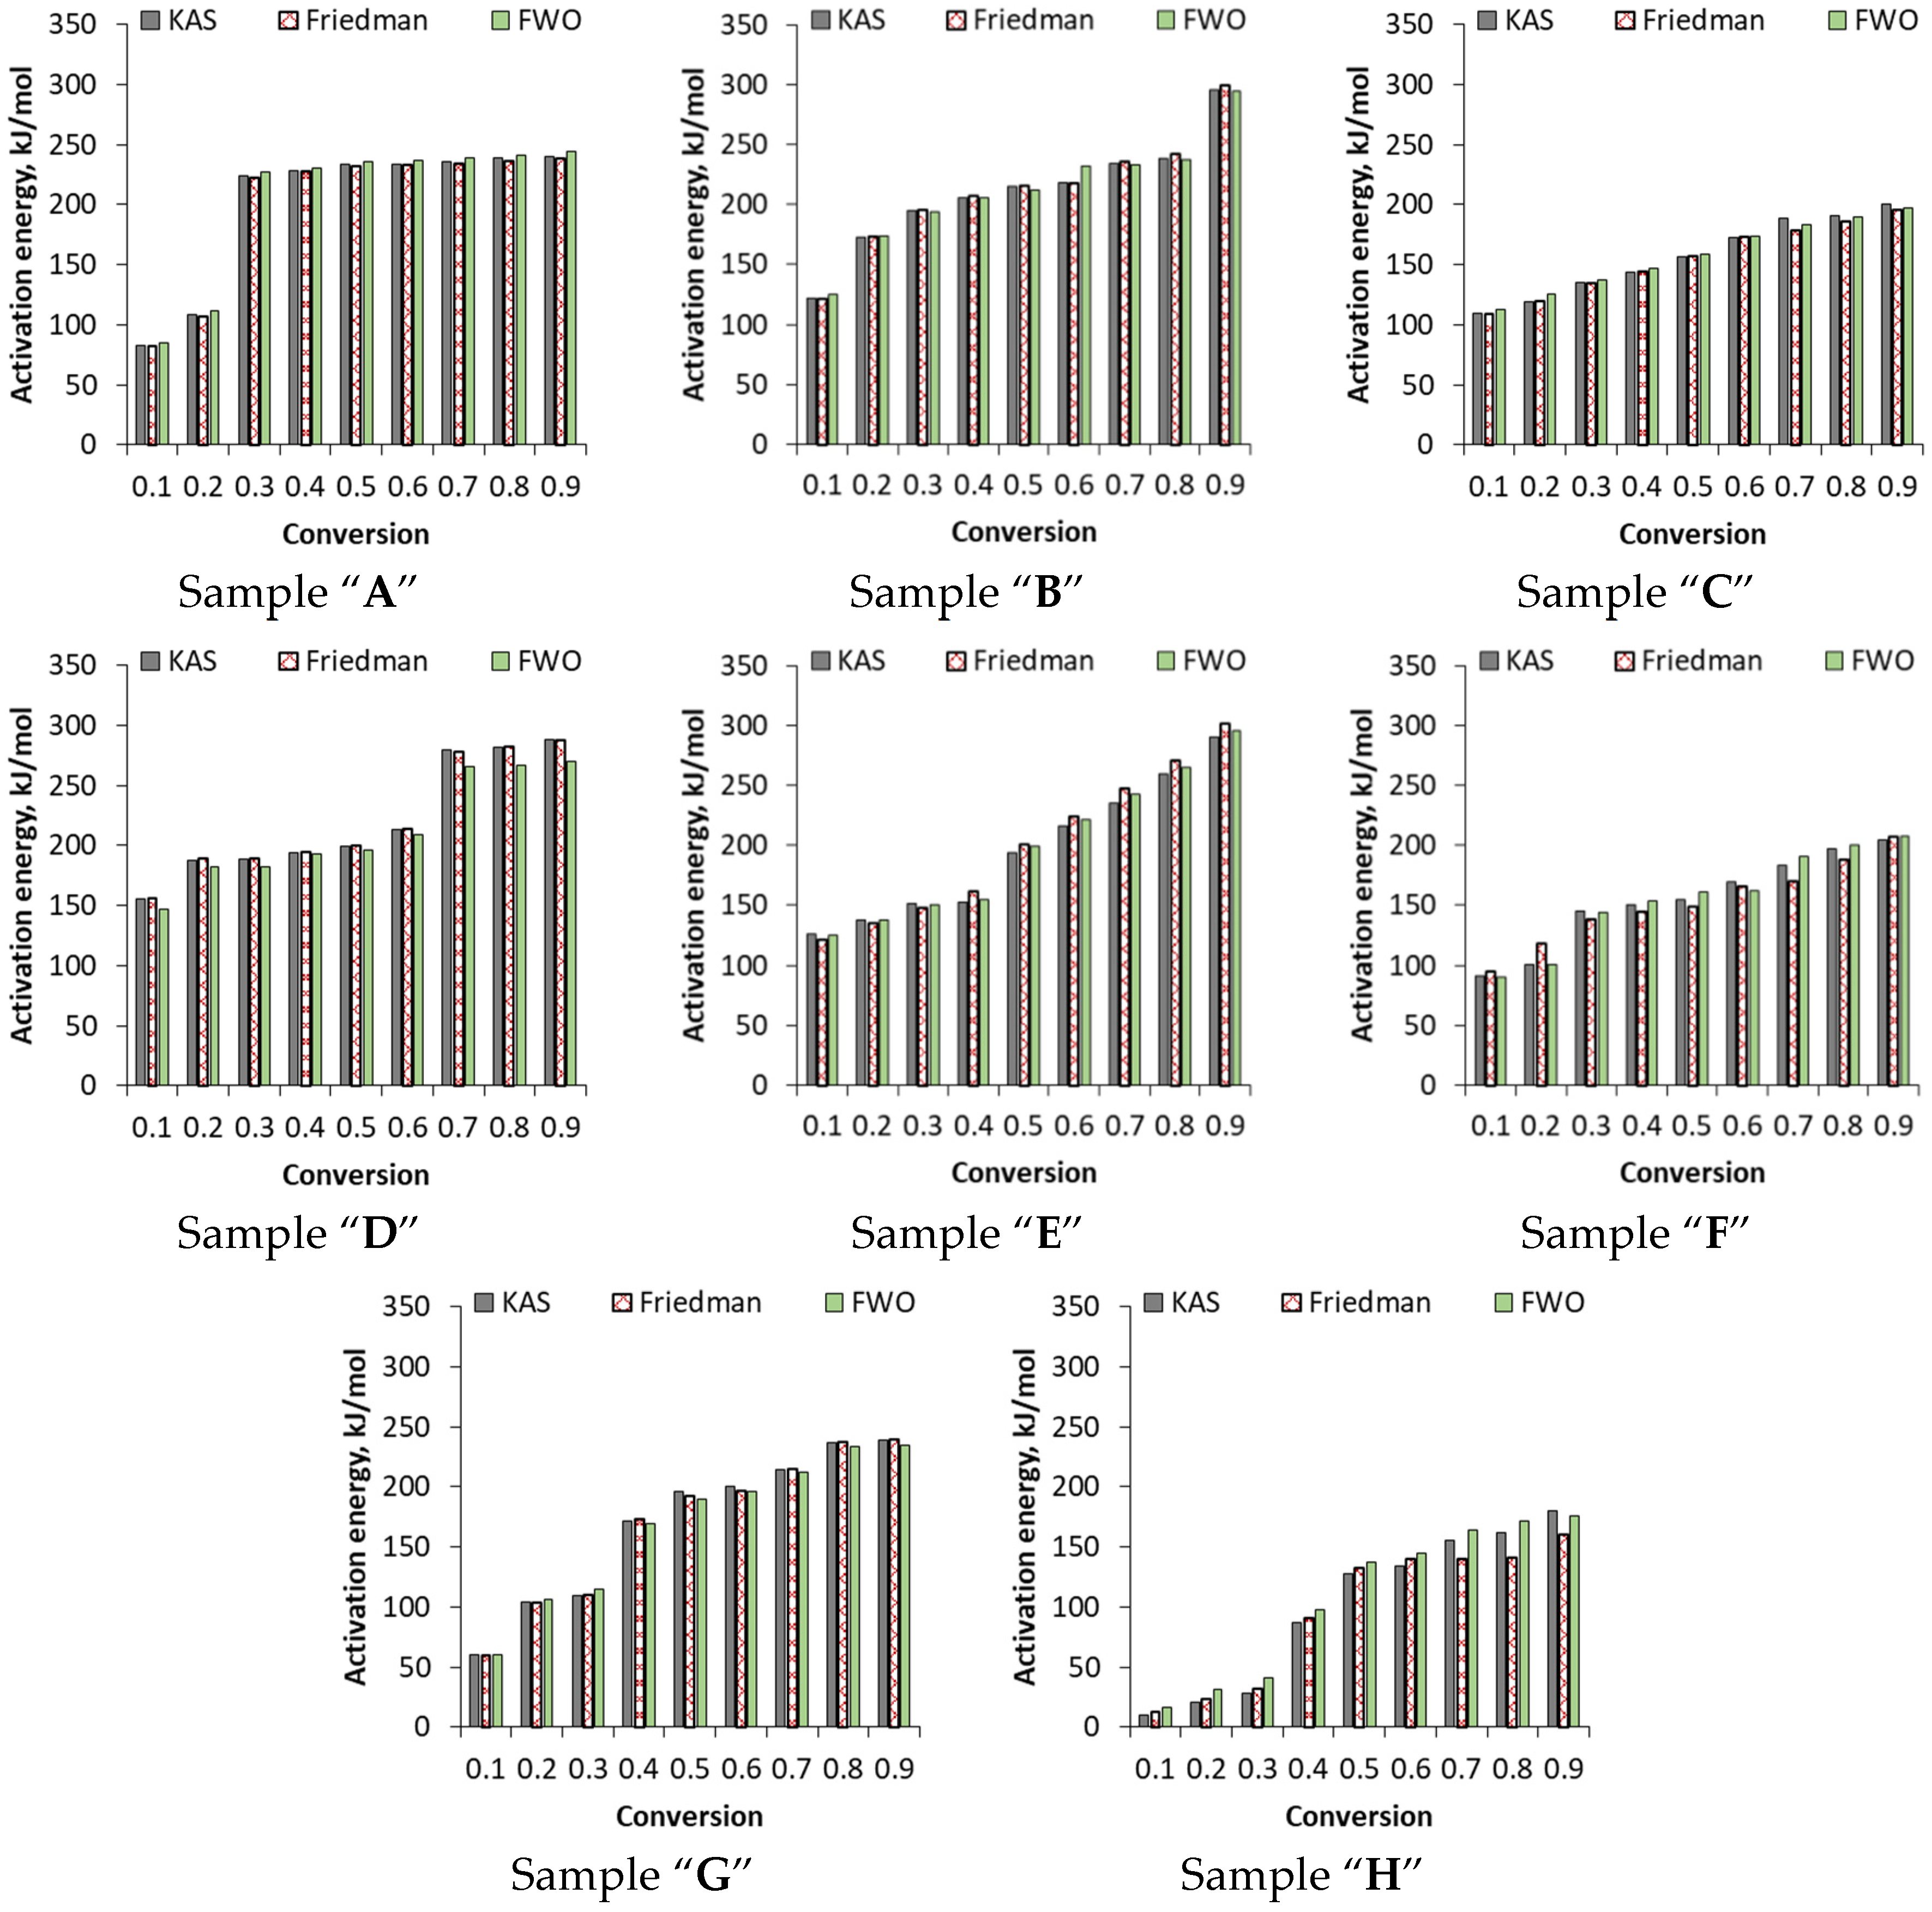
In order to calculate the kinetic parameters, the KAS, Friedman and FWO methods were also used, where ln(β/T2), ln(dα/dt) and ln(β) on the Y-axis were plotted against the inverse of the pyrolysis temperature. The activation energies were calculated from the corresponding slopes of each line drawn for conversion from 0.1 to 0.9. The correlation coefficients were above 0.95 in all cases, resulting in a high accuracy of the kinetic models. Since the procedure of the calculation used was the same in each case, this is shown only for sample “C” (Figure 5). The activation energy results are summarized in Figure 6.
As the data show, the activation energies varied widely. In the cases of municipal sewage sludge or distillery sludge, the activation energies were between 100 and 300 kJ/mol; meanwhile, the pyrolysis of samples “F” (cattle manure), “G” (chicken manure) and “H” (brook mud) resulted in slightly lower values (9.6–240 kJ/mol). The calculated activation energies are in accordance with those calculated by Liu et al. [36].
Activation energy is the minimum amount of energy which is needed to initiate the reaction. Higher values indicate slower reactions and heavier decomposition processes, which usually result from complex, multi-step, parallel, competitive and consecutive reactions. As Figure 6 depicts, activation energies calculated from the KAS, Friedman and FWO methods were similar, although above 70% conversion some discrepancies were already occurring, especially for samples “F” and “H”.
The activation energies increased as function of the conversions. At lower temperatures, the easily degradable components (e.g., lipids and polysaccharides) decomposed; with an increase in temperature, complex reactions took place for the decomposition of proteins, carbohydrates and inorganic bicarbonates. However, it is important to note that inorganic bicarbonates were present in significantly higher concentrations in cattle manure and brook mud than in other sewage sludge samples.
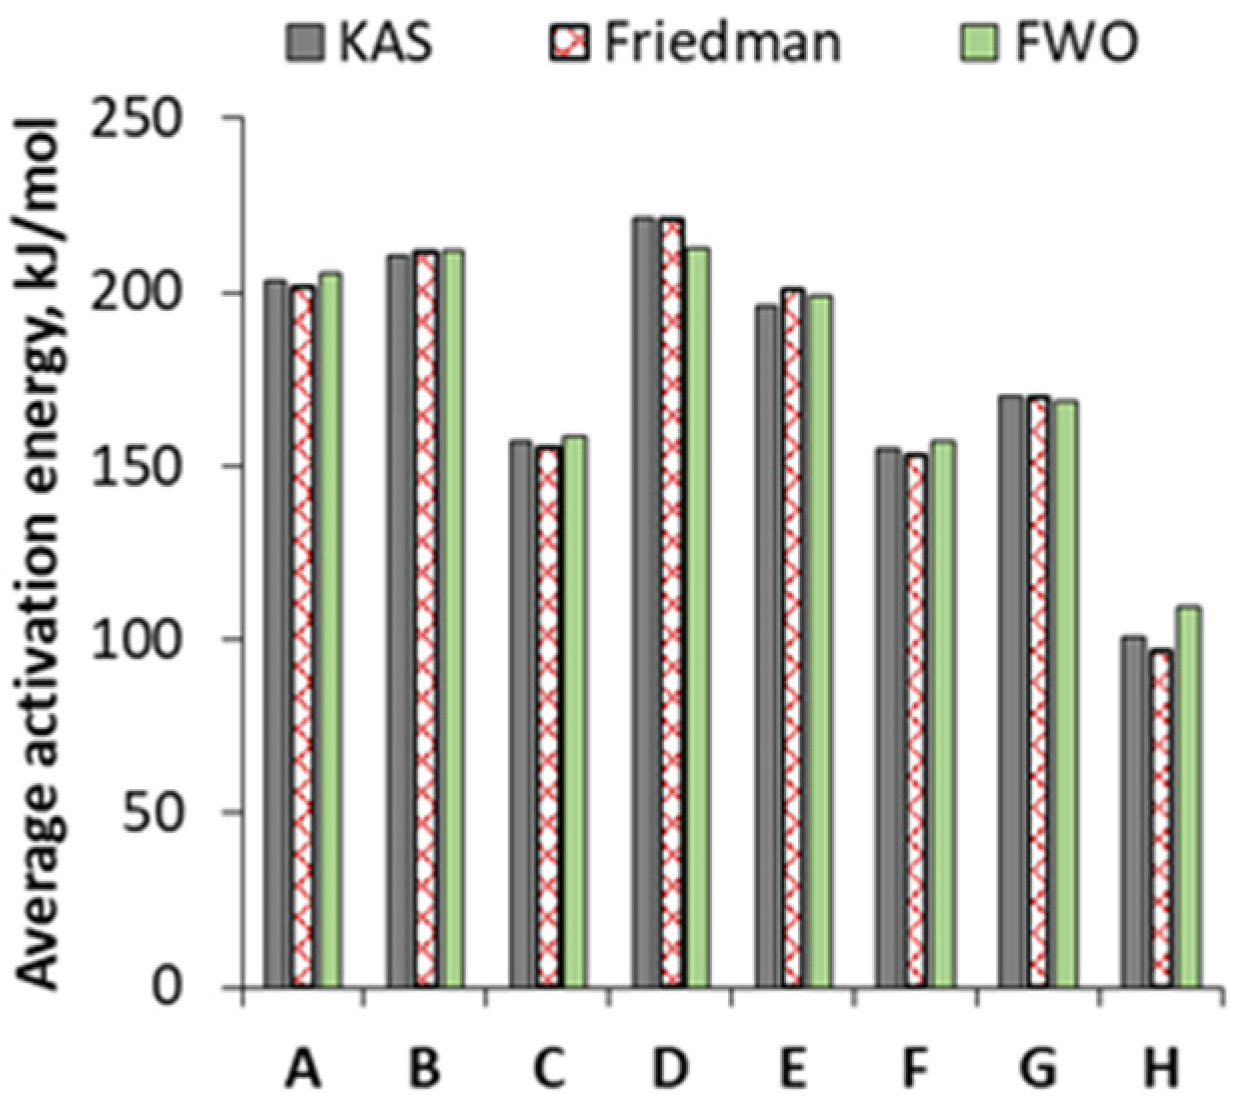
The average activation energies calculated by the KAS, Friedman and FWO methods are summarized in Figure 7. As the data show, the highest average activation energy was observed in the case of sample “D”, followed by samples “B”, “A”, “E”, ”G”, “C”, F” and “H”, in descending order. These results also prove that the decomposition of municipal and distillery sludge samples was more a difficult process than the decomposition of cattle manure or brook mud.

3.3.3. Enthalpy Calculated by KAS, Friedman and FWO Methods

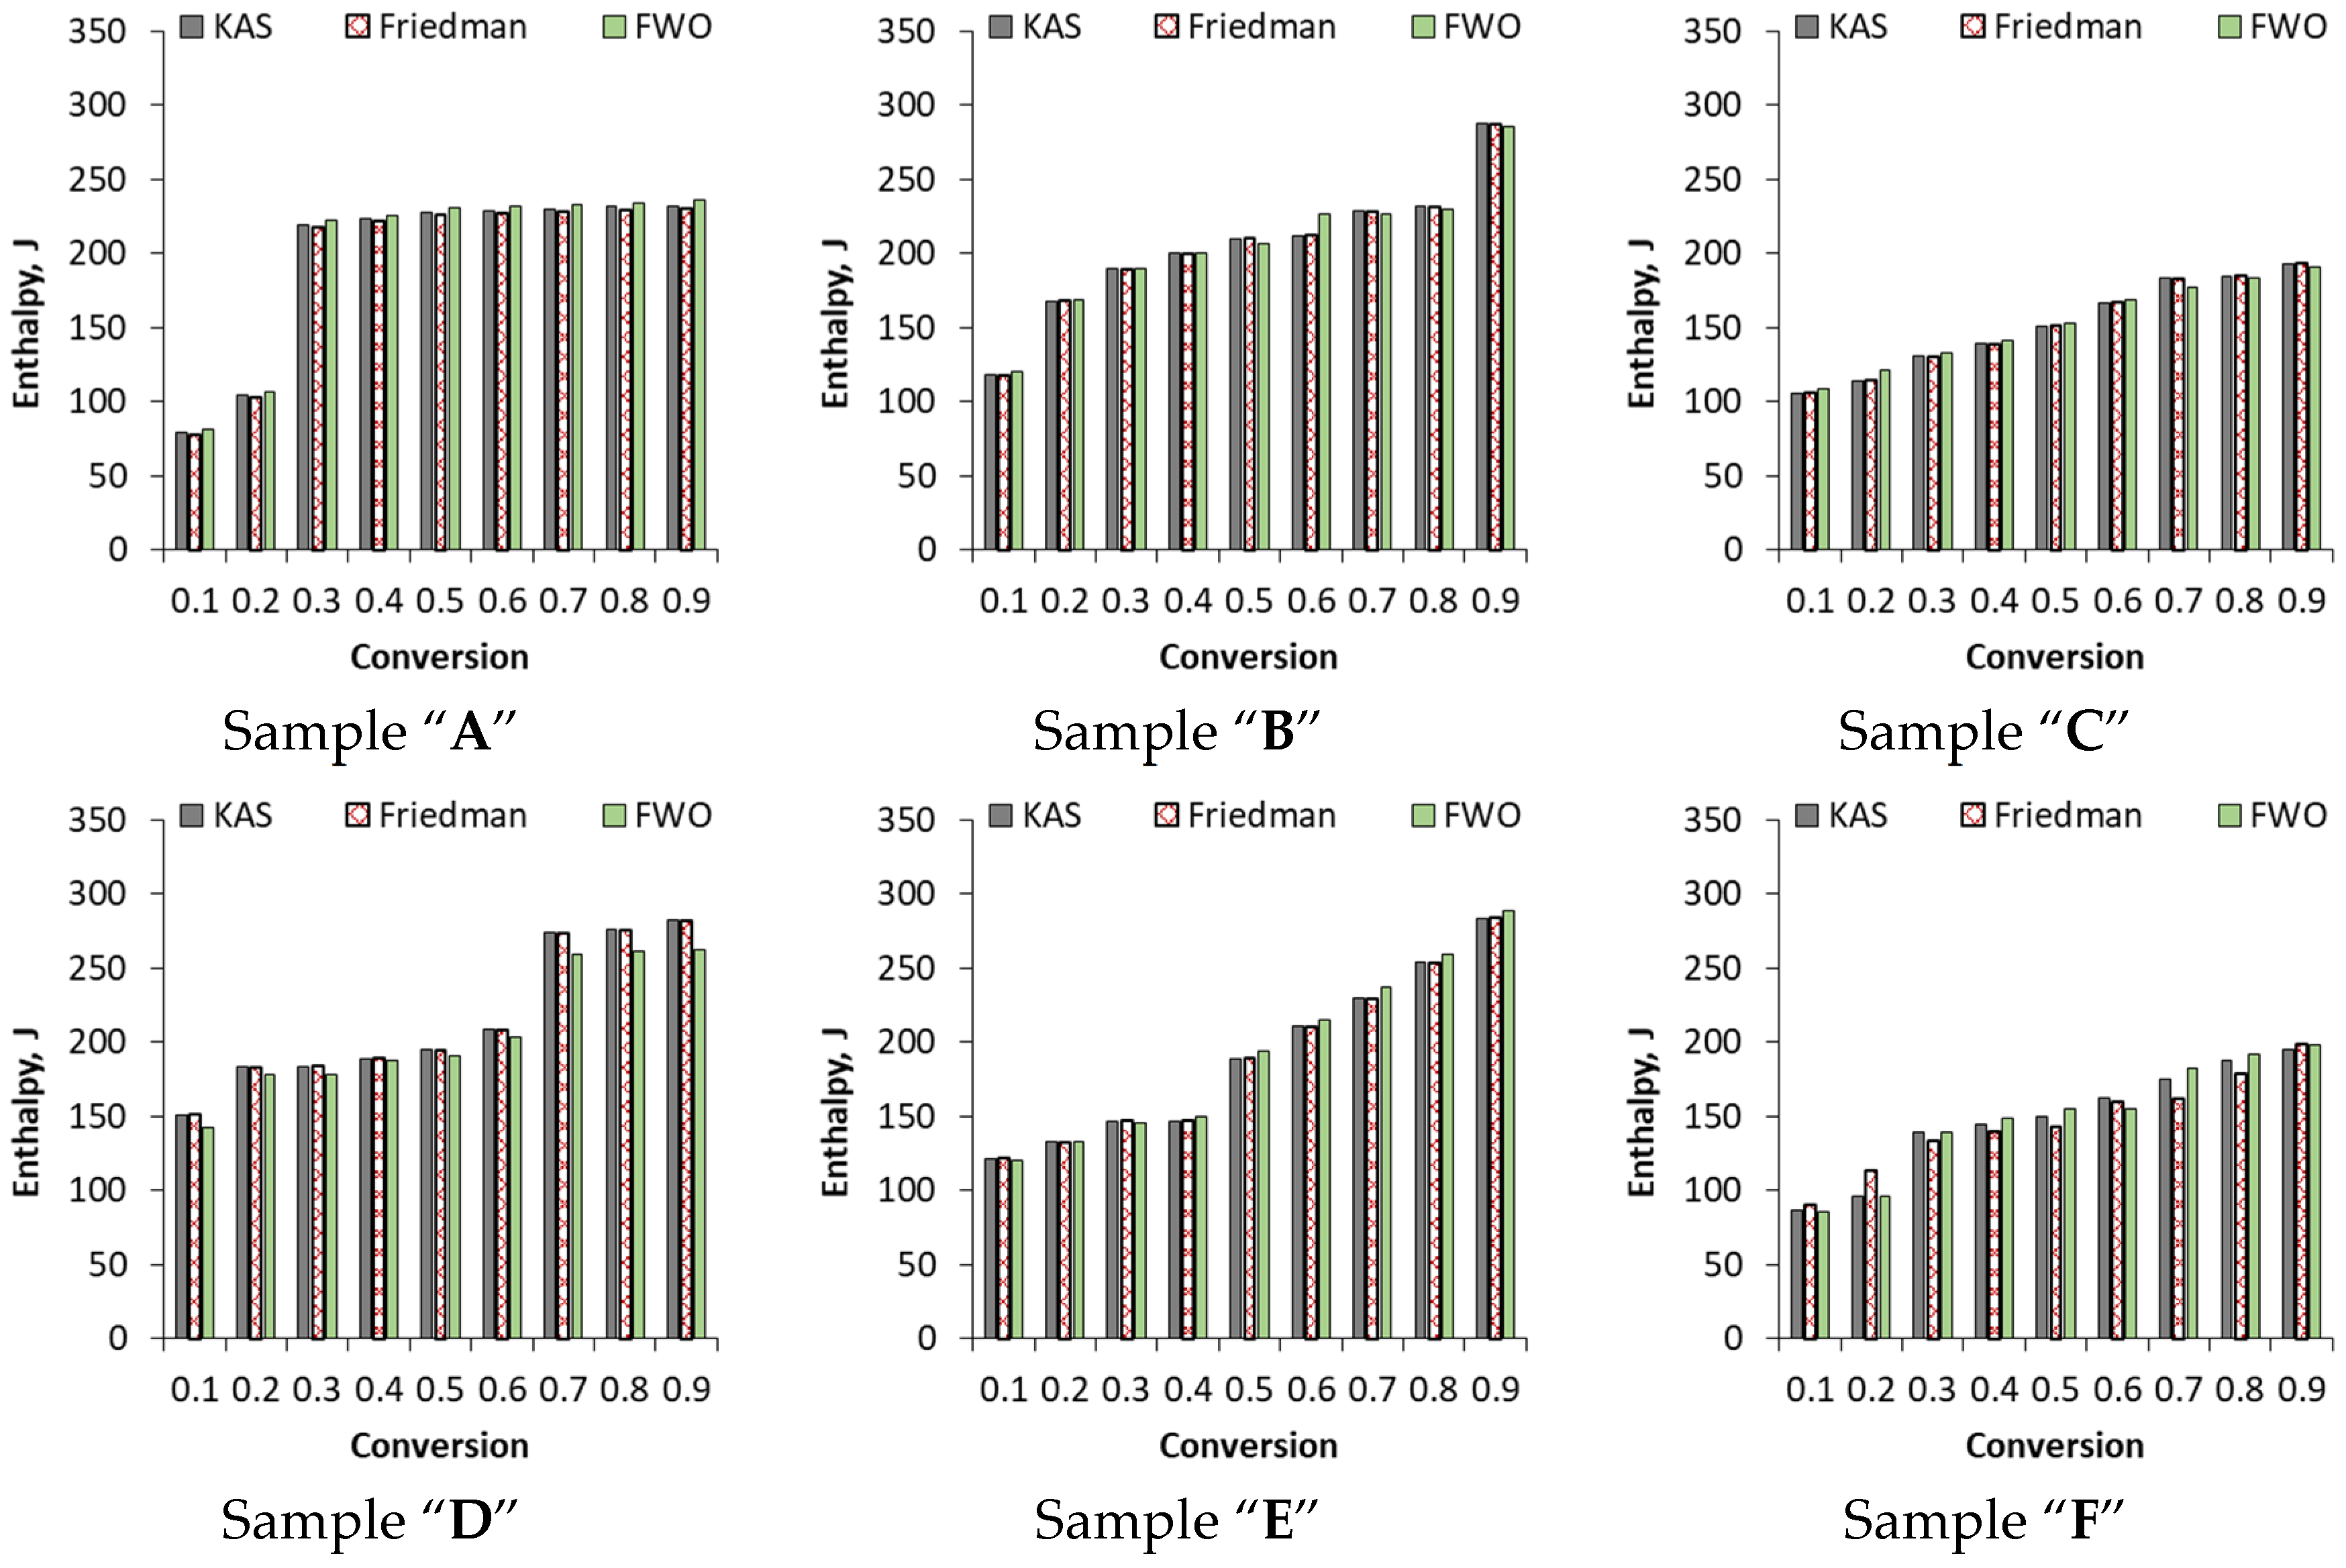
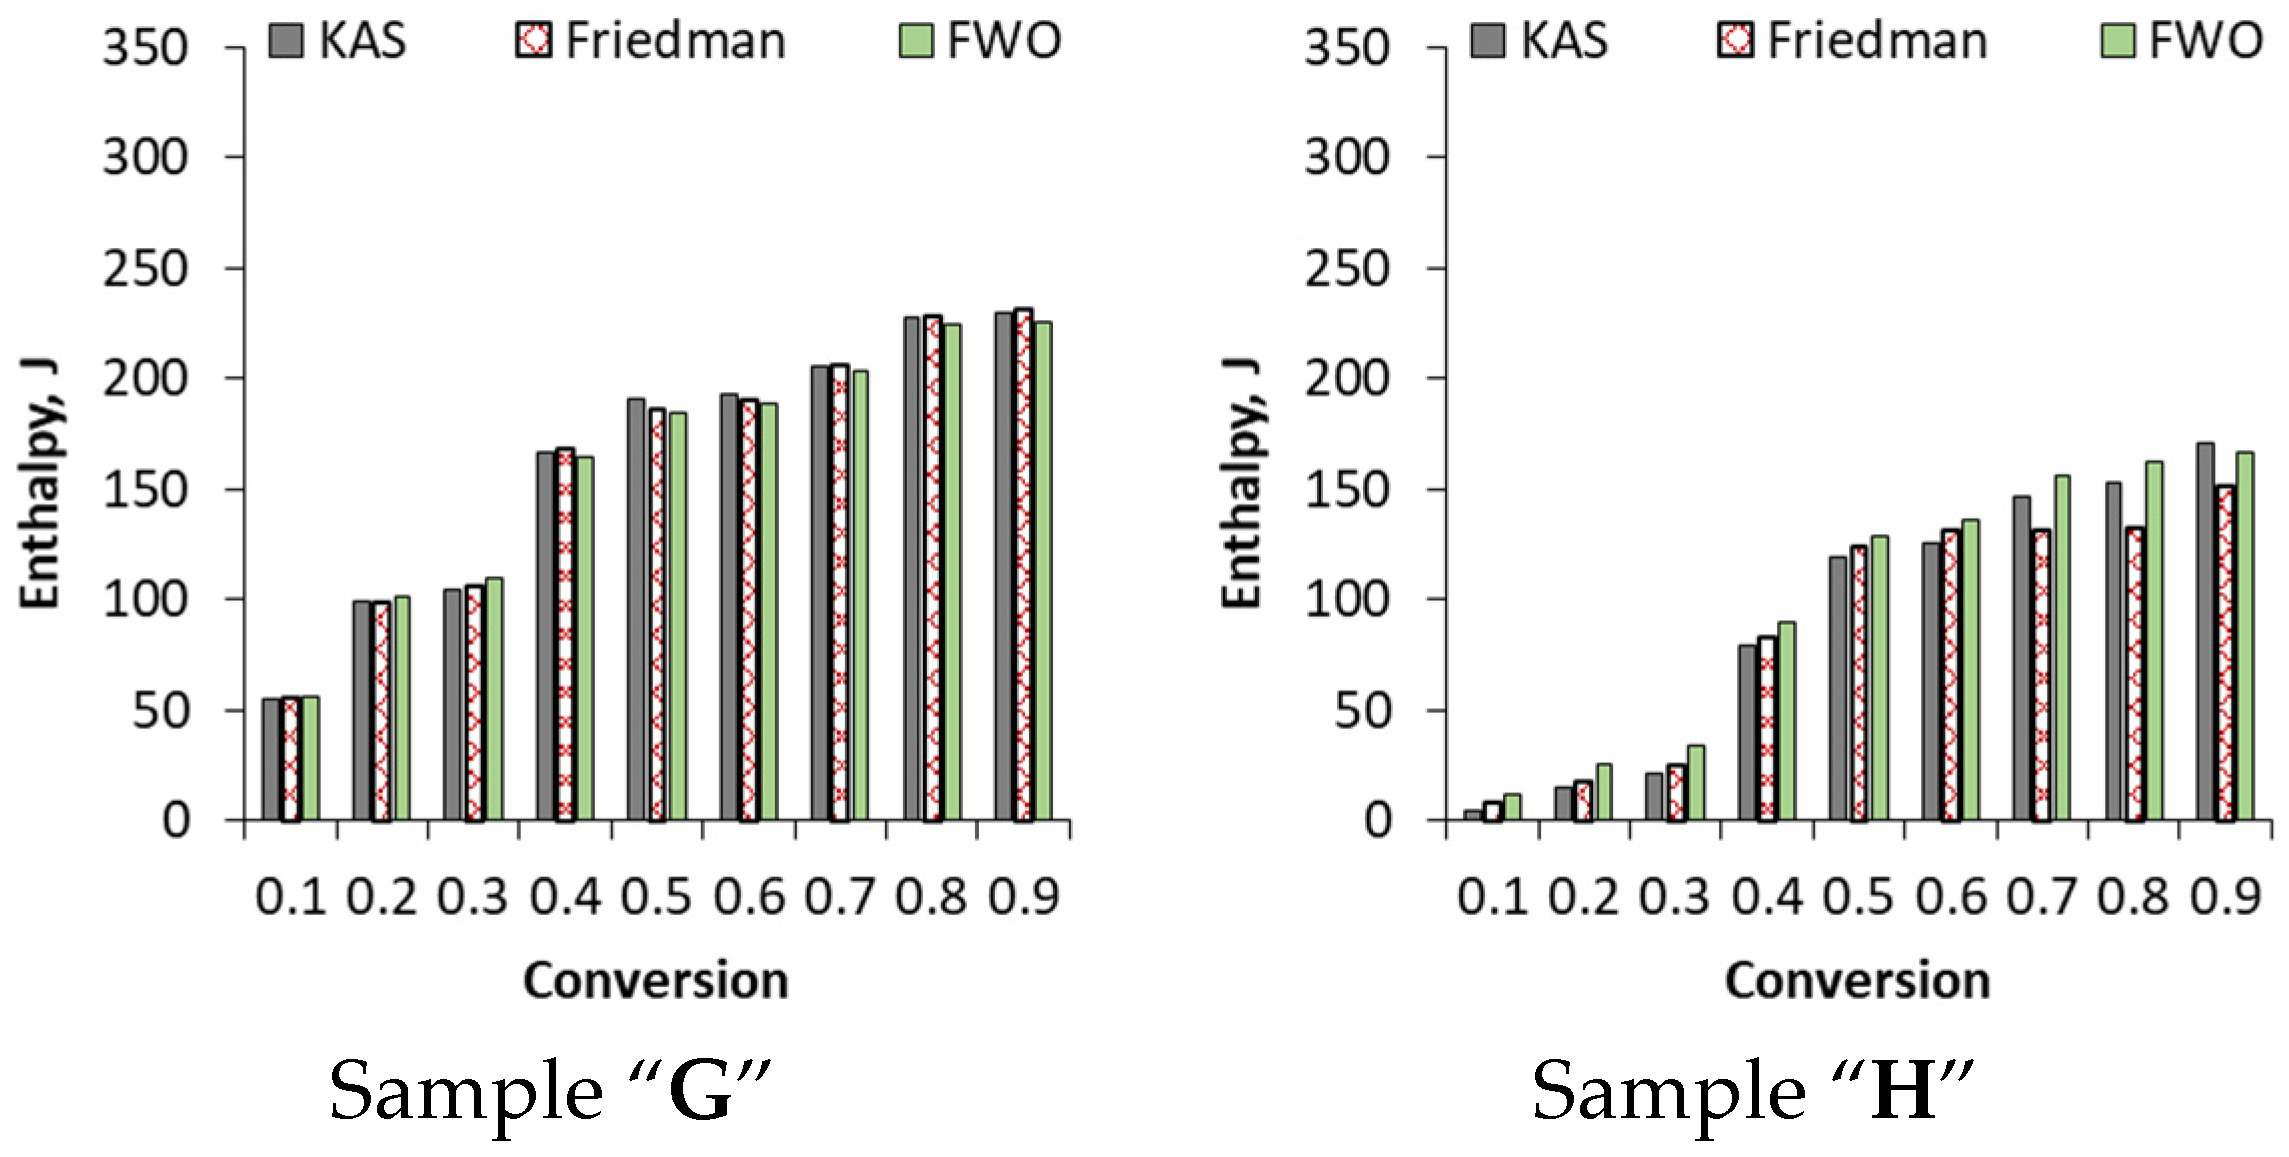
The activation energies calculated by the KAS, Friedman and FWO methods were also used to determine the enthalpies (Figure 8), which give information about the total energy needed to decompose the samples into volatiles and solid residues.
As the data show, the enthalpies increased as a function of the conversion. In the cases of samples “C”, “E” and “F”, a steady increase was observed as a function of conversion. In contrast, pyrolysis of samples “A”, “B” and “D” resulted in significant enthalpy increases, especially above 0.1–0.2 conversion. In the case of samples “G” and “H”, these significant increases only occurred above 0.3 conversion. The phenomenon can also be attributed to the decomposition processes and different raw material compositions already detailed earlier.

4. Conclusions

In this study, the pyrolysis of different sources of sewage sludge samples was studied in a coupled thermogravimetric Fourier transform infrared spectrometer at 30–900 °C with using 25, 50 and 100 °C/min heating rates. The results of TG-FTIR analysis revealed that the main decomposition reactions took place at three temperature ranges (200–400, 400–600 and above 600 °C), and resulted mainly in the formation of carbon dioxide and carbon monoxide. In this range, the decomposition of lipids, polysaccharides, proteins, carbohydrates and bicarbonates—which were present in higher concentrations in cattle manure and brook mud—was observed. The decomposition processes were also significantly affected by the heating rates. An increase in the heating rate shifted the peak maxima toward higher temperature values. Therefore, in the case of the rapid pyrolysis of sewage sludge samples, a higher reactor temperature must be used in order to obtain a product of the same composition as using a slower heating rate. In order to calculate the kinetic parameters, first-order and model-free kinetic methods such as KAS, Friedman and FWO were also used. According to the Arrhenius method, the activation energies of the first, second and third stages were 25.6–85.4, 11.4–36.3 and 20.2–135.0 kJ/mol, respectively. Activation energies calculated by the KAS, Friedman and FWO methods were in the range of 100–300 kJ/mol for municipal sewage sludge or distillery sludge, and varied between 9.6 and 240 kJ/mol for cattle manure, chicken manure and brook mud samples. Based on the results, it can be concluded that all of the kinetic methods were appropriate for determining the activation energies of the endothermic pyrolysis of sewage sludge samples.

Author Contributions

Conceptualization, N.M. and S.T.; methodology, N.M. and S.T.; validation, N.M. and S.T.; formal analysis, N.M. and S.T.; investigation, N.M. and S.T.; resources, N.M. and S.T.; writing—original draft preparation, N.M. and S.T.; visualization, N.M. and S.T.; project administration, N.M. All authors have read and agreed to the published version of the manuscript.

Funding

This project (2019-2.1.13-TÉT_IN-2020-00071) was financed by the Ministry of Innovation and Technology from the National Research Development and Innovation Fund, within the 2019-2.1.13-TÉT_IN program.

Institutional Review Board Statement

Not applicable.

Informed Consent Statement

Not applicable.

Data Availability Statement

Not applicable.

Conflicts of Interest

The authors declare no conflict of interest.

References

  1. Lee, S.; Kim, Y.-M.; Siddiqui, M.Z.; Park, Y.-K. Different pyrolysis kinetics and product distribution of municipal and livestock manure sewage sludge. Environ. Pollut. 2021, 285, 117197. [Google Scholar] [CrossRef] [PubMed]
  2. Mateo-Sagasta, J.; Raschid-Sally, L.; Thebo, A. Global wastewater and sludge production, treatment and use. In Wastewater; Drechsel, P., Qadir, M., Wichelns, D., Eds.; Springer: Dordrecht, The Netherlands, 2015; pp. 15–38. [Google Scholar] [CrossRef]
  3. Đurđević, D.; Blecich, P.; Jurić, Ž. Energy Recovery from Sewage Sludge: The Case Study of Croatia. Energies 2019, 12, 1927. [Google Scholar] [CrossRef] [Green Version]
  4. Dumontet, S.; Scopa, A.; Kerje, S.; Krovacek, K. The Importance of Pathogenic Organisms in Sewage and Sewage Sludge. J. Air Waste Manag. Assoc. 2011, 51, 848–860. [Google Scholar] [CrossRef] [PubMed] [Green Version]
  5. Gebreeyessus, G.D.; Jenicek, P. Thermophilic versus Mesophilic Anaerobic Digestion of Sewage Sludge: A Comparative Review. Bioengineering 2016, 3, 15. [Google Scholar] [CrossRef] [Green Version]
  6. Buta, M.; Hubeny, J.; Zieliński, W.; Harnisz, M.; Korzeniewska, E. Sewage sludge in agriculture—The effects of selected chemical pollutants and emerging genetic resistance determinants on the quality of soil and crops—A review. Ecotoxicol. Environ. Saf. 2021, 214, 112070. [Google Scholar] [CrossRef] [PubMed]
  7. Mininni, G.; Blanch, A.R.; Lucena, F.; Berselli, S. EU policy on sewage sludge utilization and perspectives on new approaches of sludge management. Environ. Sci. Pollut. Res. 2015, 22, 7361–7374. [Google Scholar] [CrossRef]
  8. Djandja, O.S.; Wang, Z.-C.; Wang, F.; Xu, Y.-P.; Duan, P.-G. Pyrolysis of Municipal Sewage Sludge for Biofuel Production: A Review. Ind. Eng. Chem. Res. 2020, 59, 16939–16956. [Google Scholar] [CrossRef]
  9. Moško, J.; Pohořelý, M.; Skoblia, S.; Beňo, Z.; Jeremiáš, M. Detailed Analysis of Sewage Sludge Pyrolysis Gas: Effect of Pyrolysis Temperature. Energies 2020, 13, 4087. [Google Scholar] [CrossRef]
  10. Agar, D.A.; Kwapinska, M.; Leahy, J.J. Pyrolysis of wastewater sludge and composted organic fines from municipal solid waste: Laboratory reactor characterisation and product distribution. Environ. Sci. Pollut. Res. 2018, 25, 35874–35882. [Google Scholar] [CrossRef]
  11. Hanif, M.U.; Zwawi, M.; Capareda, S.C.; Iqbal, H.; Algarni, M.; Felemban, B.F.; Bahadar, A.; Waqas, A. Influence of Pyrolysis Temperature on Product Distribution and Characteristics of Anaerobic Sludge. Energies 2020, 13, 79. [Google Scholar] [CrossRef] [Green Version]
  12. Gbouri, I.; Yu, F.; Wang, X.; Wang, J.; Cui, X.; Hu, Y.; Yan, B.; Chen, G. Co-Pyrolysis of Sewage Sludge and Wetland Biomass Waste for Biochar Production: Behaviors of Phosphorus and Heavy Metals. Int. J. Environ. Res. Public Health 2022, 19, 2818. [Google Scholar] [CrossRef]
  13. Tang, S.; Tian, S.; Zheng, C.; Zhang, Z. Effect of Calcium Hydroxide on the Pyrolysis Behavior of Sewage Sludge: Reaction Characteristics and Kinetics. Energy Fuels 2017, 31, 5079–5087. [Google Scholar] [CrossRef]
  14. Chan, W.P.; Wang, J.-Y. Formation of synthetic sludge as a representative tool for thermochemical conversion modelling and performance analysis of sewage sludge–Based on a TG-FTIR study. J. Anal. Appl. Pyrolysis 2018, 133, 97–106. [Google Scholar] [CrossRef]
  15. Yang, H.; Yan, R.; Chen, H.; Lee, D.H.; Zheng, C. Characteristics of hemicellulose, cellulose and lignin pyrolysis. Fuel 2007, 86, 1781–1788. [Google Scholar] [CrossRef]
  16. Soria-Verdugo, A. Pyrolysis of sludge and biomass residues. In Wastewater Treatment Residues as Resources for Biorefinery Products and Biofuels; Elsevier: Amsterdam, The Netherlands, 2020; Volume 8, pp. 155–181. [Google Scholar] [CrossRef]
  17. Naqvi, S.R.; Tariq, R.; Hameed, Z.; Ali, I.; Naqvi, M.; Chen, W.-H.; Ceylan, S.; Rashid, H.; Ahmad, J.; Taqvi, S.A.; et al. Pyrolysis of high ash sewage sludge: Kinetics and thermodynamic analysis using Coats-Redfern method. Renew. Energy 2019, 131, 854–860. [Google Scholar] [CrossRef]
  18. Sobek, S.; Werle, S. Isoconversional determination of the apparent reaction models governing pyrolysis of wood, straw and sewage sludge, with an approach to rate modelling. Renew. Energy 2020, 161, 972–987. [Google Scholar] [CrossRef]
  19. González-Arias, J.; Gil, M.V.; Fernández, R.; Martínez, E.J.; Fernández, C.; Papaharalabos, G.; Gómez, X. Integrating anaerobic digestion and pyrolysis for treating digestates derived from sewage sludge and fat wastes. Environ. Sci. Pollut. Res. 2020, 27, 32603–32614. [Google Scholar] [CrossRef]
  20. Wen, S.; Yan, Y.; Liu, J.; Buyukada, M.; Evrendilek, F. Pyrolysis performance, kinetic, thermodynamic, product and joint optimization analyses of incense sticks in N2 and CO2 atmospheres. Renew. Energy 2019, 141, 814–827. [Google Scholar] [CrossRef]
  21. Kissinger, H.E. Reaction Kinetics in Differential Thermal Analysis. Anal. Chem. 1957, 29, 1702–1706. [Google Scholar] [CrossRef]
  22. Ma, J.; Luo, H.; Li, Y.; Liu, Z.; Li, D.; Gai, C.; Jiao, W. Pyrolysis kinetics and thermodynamic parameters of the hydrochars derived from co-hydrothermal carbonization of sawdust and sewage sludge using thermogravimetric analysis. Bioresour. Technol. 2019, 282, 133–141. [Google Scholar] [CrossRef]
  23. Xu, Q.; Tang, S.; Wang, J.; Ko, J.H. Pyrolysis kinetics of sewage sludge and its biochar characteristics. Process Saf. Environ. Prot. 2018, 115, 49–56. [Google Scholar] [CrossRef]
  24. Hayhurst, A.N. The kinetics of the pyrolysis or devolatilisation of sewage sludge and other solid fuels. Combust. Flame 2013, 160, 138–144. [Google Scholar] [CrossRef]
  25. Chen, X.; Jeyaseelan, S. Study of Sewage Sludge Pyrolysis Mechanism and Mathematical Modeling. J. Environ. Eng. 2001, 127, 585–593. [Google Scholar] [CrossRef]
  26. Lin, Y.; Tian, Y.; Xia, Y.; Fang, S.; Liao, Y.; Yu, Z.; Ma, X. General distributed activation energy model (G-DAEM) on co-pyrolysis kinetics of bagasse and sewage sludge. Bioresour. Technol. 2019, 273, 545–555. [Google Scholar] [CrossRef]
  27. Lai, Z.; Ma, X.; Tang, Y.; Lin, H. A study on municipal solid waste (MSW) combustion in N2/O2 and CO2/O2 atmosphere from the perspective of TGA. Energy 2011, 36, 819–824. [Google Scholar] [CrossRef]
  28. Naqvi, S.R.; Tariq, R.; Shahbaz, M.; Naqvi, M.; Aslam, M.; Khan, Z.; Mackey, H.; Mckay, G.; Al-Ansari, T. Recent developments on sewage sludge pyrolysis and its kinetics: Resources recovery, thermogravimetric platforms, and innovative prospects. Comput. Chem. Eng. 2021, 150, 107325. [Google Scholar] [CrossRef]
  29. Petrovič, A.; Vohl, S.; Predikaka, T.C.; Bedoić, R.; Simonič, M.; Ban, I.; Čuček, L. Pyrolysis of Solid Digestate from Sewage Sludge and Lignocellulosic Biomass: Kinetic and Thermodynamic Analysis, Characterization of Biochar. Sustainability 2021, 13, 9642. [Google Scholar] [CrossRef]
  30. Gou, X.; Zhao, X.; Singh, S.; Qiao, D. Tri-pyrolysis: A thermo-kinetic characterisation of polyethylene, cornstalk, and anthracite coal using TGA-FTIR analysis. Fuel 2019, 252, 393–402. [Google Scholar] [CrossRef]
  31. Giwa, A.S.; Xu, H.; Wu, J.; Li, Y.; Chang, F.; Zhang, X.; Jin, Z.; Huang, B.; Wang, K. Sustainable recycling of residues from the food waste (FW) composting plant via pyrolysis: Thermal characterization and kinetic studies. J. Clean. Prod. 2018, 180, 43–49. [Google Scholar] [CrossRef]
  32. Menares, T.; Herrera, J.; Romero, R.; Osorio, P.; Arteaga-Pérez, L.E. Waste tires pyrolysis kinetics and reaction mechanisms explained by TGA and Py-GC/MS under kinetically-controlled regime. Waste Manag. 2020, 102, 21–29. [Google Scholar] [CrossRef]
  33. Yan, J.; Yang, Q.; Zhang, L.; Lei, Z.; Li, Z.; Wang, Z.; Ren, S.; Kang, S.; Shui, H. Investigation of kinetic and thermodynamic parameters of coal pyrolysis with model-free fitting methods. Carbon Resour. Convers. 2020, 3, 173–181. [Google Scholar] [CrossRef]
  34. Wang, C.; Liu, Y.; Zhang, X.; Che, D. A Study on Coal Properties and Combustion Characteristics of Blended Coals in Northwestern China. Energy Fuels 2011, 25, 3634–3645. [Google Scholar] [CrossRef]
  35. Leroy, V.; Cancellieri, D.; Leoni, E.; Rossi, J.-L. Kinetic study of forest fuels by TGA: Model-free kinetic approach for the prediction of phenomena. Thermochim. Acta 2010, 497, 1–6. [Google Scholar] [CrossRef] [Green Version]
  36. Liu, H.; Xu, G.; Li, G. Pyrolysis characteristic and kinetic analysis of sewage sludge using model-free and master plots methods. Process Saf. Environ. Prot. 2021, 149, 48–55. [Google Scholar] [CrossRef]
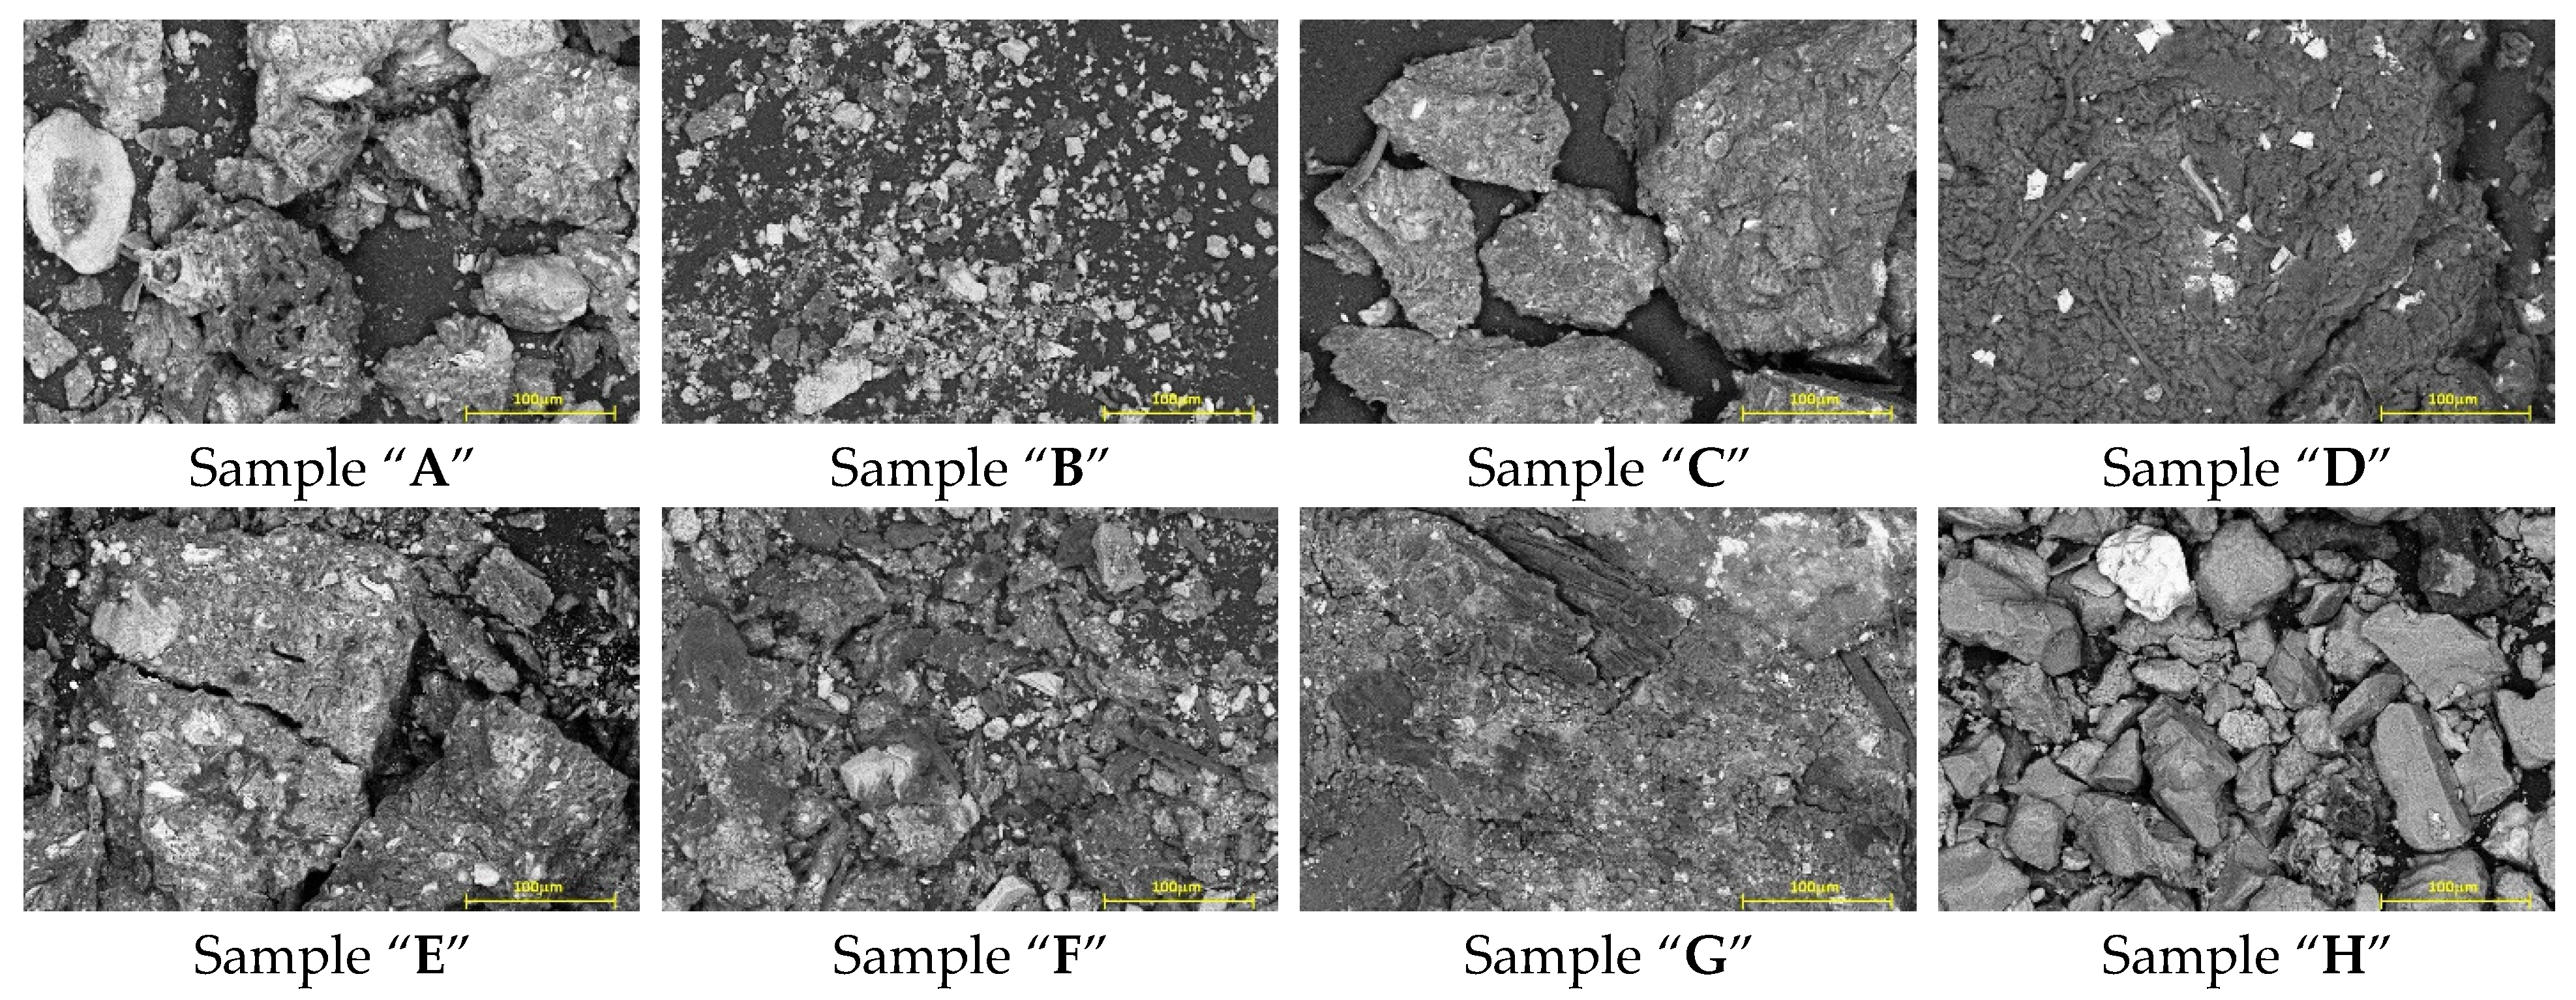
Figure 1. SEM images of the dried raw materials.
Energies 15 05116 g001
Figure 2. Summarized weight losses and dm/dt values.
Energies 15 05116 g002aEnergies 15 05116 g002b
Figure 4. The activation energies of the sample decompositions.
Energies 15 05116 g004
Figure 5. Plots of the KAS, Friedman and FWO methods at different conversions for sample “C”.
Energies 15 05116 g005
Figure 6. Activation energies calculated by the KAS, Friedman and FWO methods.
Energies 15 05116 g006
Figure 7. Activation energies calculated by the KAS, Friedman and FWO methods.
Energies 15 05116 g007
Figure 8. Enthalpies calculated by the KAS, Friedman and FWO methods.
Energies 15 05116 g008aEnergies 15 05116 g008b
Table 1. Principal reaction kinetic approaches used for waste polymer pyrolysis.
ModelDescriptionReference
Coats and Redfern modelIntegrated kinetic model using simplified Arrhenius equation.[17]
Friedman modelDetermination of activation energies for different conversions.[18]
Flynn–Wall–Ozawa modelDetermination of activation energies for different conversions. Typically used for solid samples.[19]
Horowitz–Metzger methodSuitable for different types of waste (biomass, plastic, sewage sludge).[16,20]
Kissinger methodUsed for reaction kinetic characterization of mixtures.[21]
Kissinger–Akira–Sunose modelUses the appropriate temperature for each conversion, instead of the peak maximum.[22]
Single reaction modelThermal decomposition processes take place through the same thermal reactivity. The reliability of the final result is limited and largely depends on the description of the gross process.[23]
Parallel reactions modelMultiple parallel reaction models. Usually three-step. Used for biomass. In the case of sewage sludge, modification is needed.[24]
Consecutive reactions modelSequential reactions. Generally an isothermal kinetic approach. Used for biomass, plastic waste and sewage sludge.[25]
Distributed activation energy modelIt monitors the ongoing processes as a complex system of reactions with constantly changing activation energies, but with a constant pre-exponential factor. Used for biomass, plastic waste and sewage sludge.[26]
Vyazovkin methodNon-isothermal method independent from heating rate.[19,27]
Starink’s modelNon-isothermal method independent from heating rate.[28]
Table 2. Main properties of the dried sewage sludge samples.
ABCDEFGH
SourceMunicipal sewage sludgeMunicipal sewage sludgeMunicipal sewage sludgeMunicipal sewage sludgeDistillery sludgeCattle manureChicken manureBrook mud
Water content, % (1)55.3651.8637.8822.8347.4246.5735.2886.71
Fixed carbon, %7.7512.4412.834.4723.235.8915.0712.67
Ash content, %47.6139.4225.0518.3624.1940.6820.2174.04
Volatiles, %44.6448.1462.1278.6652.2853.4364.7213.29
C23.431.235.450.542.324.834.79.6
H3.44.05.57.85.23.04.51.0
N3.84.45.54.50.82.94.60.7
S2.01.42.60.00.01.31.60.0
O52.944.741.628.631.754.540.166.6
Na0.70.30.60.11.50.40.80.5
Mg1.00.50.50.41.40.40.51.1
Al1.12.21.60.21.90.30.22.2
Si2.63.10.40.67.20.70.311.6
P3.42.62.11.31.61.22.10.1
K0.41.60.30.30.51.84.80.6
Ca1.91.92.22.33.87.95.14.6
Fe3.41.71.32.51.80.40.01.3
Other0.10.20.30.70.30.40.60.2
(1) Water content before the analysis (this water content was evaporated at 110 °C prior to the TG-FTIR analysis).
Table 3. Main temperatures of the decompositions.
SampleHeating Rate, °C/min1st StepResidue
1st Step, %
2nd StepResidue
(2nd Step), %
3rd StepResidue
(3rd Step), %
TiTmTfTiTmTfTiTmTf
A2518529839873.54410-54164.6466175379155.36
5019130240473.21419-55463.5166875779454.71
10019831541171.38427-56261.6568176279951.86
B2519729240372.06411-55461.8165472879151.83
5020529841070.37417-55960.2566273579449.55
10021730641570.15419-56760.4867974680050.60
C2520529240057.16400-55644.57---37.88
5022930340557.56470-56245.73---38.91
10021732041056.53410-57443.99---38.89
D2521131640545.0140545651829.28---21.34
5022033641648.1641647653628.33---22.83
10022233842644.9142646553930.89---25.44
E2521735442958.5444243557151.06---47.72
5022936243545.4245145358633.38---28.05
10023326744149.1945845960238.72---35.45
F2515433337876.10390-54769.0166580486646.57
5018034237974.89390-56066.4267881088045.01
10018135539175.18395-57067.4771082489440.98
G2520828236760.3439044354045.1767974482735.28
5021829637960.3939944754546.6268377088935.40
10023431640059.6941545756545.1469079289134.91
H2522031853095.88----65077281086.71
5022833754295.21----66278082086.24
10025035155896.80----680--81.34
Ti: initial temperature; Tm: peak maximum temperature; Tf: final temperature.
Publisher’s Note: MDPI stays neutral with regard to jurisdictional claims in published maps and institutional affiliations.