Article

Cluster Analysis of the EU-27 Countries in Light of the Guiding Principles of the European Green Deal, with Particular Emphasis on Poland

1
Department of Electrical Engineering and Industrial Automation, Faculty of Mining, Safety Engineering and Industrial Automation, Silesian University of Technology, Akademicka 2 St., 44-100 Gliwice, Poland
2
Department of Physical Chemistry and Technology of Polymers, Faculty of Chemistry, Silesian University of Technology, 44-100 Gliwice, Poland
3
School of Chemistry, The University of Melbourne, Parkville, VIC 3010, Australia
*
Author to whom correspondence should be addressed.
Energies 2022, 15(14), 5082; https://doi.org/10.3390/en15145082
Submission received: 23 May 2022 / Revised: 2 July 2022 / Accepted: 11 July 2022 / Published: 12 July 2022

Abstract

:
The article presents a cluster analysis of the EU-27 countries. The clusters were built to identify groups of countries similar to each other in relation to the set of Eurostat indicators from the Climate Change Drivers and Environment and Energy sections. During the research, tools of spatial information systems were used, such as cluster analysis, diagram maps, rasterization and the TSA method. ARIMA prediction models were also used. The research aims to verify our hypotheses. Particular attention was paid to Poland; therefore, it was verified whether the composition of the country’s energy mix translated into excessive emissions of pollutants in relation to other EU countries. Furthermore, the level of integration of energy markets in the European Union and its changes over time were examined. The authors also proposed a methodology to create detailed energy and climate strategies for designated clusters. The results of the presented research are particularly important in light of recent events in Ukraine.

Graphical Abstract

1. Introduction

The European Union’s goal in combating climate change is to achieve zero greenhouse gas emissions by 2050. The European Union has become an undeniable world leader in this field. It is hoped that the climate policies carried out within the EU will convince the other largest economies in the world to adopt the same attitude. Only then will sacrifices and actions taken to protect the climate have a real impact on the fight against climate change. The EU has, therefore, adopted the right attitude, which will, however, require a series of complex actions and sacrifices aimed at transforming the energy systems of the member states [1,2]. Climate neutrality is about achieving a balance between emitted and absorbed CO2. To achieve it, countries can act in two ways. First, it is necessary to develop the appropriate potential of CO2 absorbers. These mainly include soil, oceans, and forests. These absorbers are estimated to absorb 11 Gg of CO2 annually; the annual emission rate in 2019 was 38 Gg of CO2 [3,4]. However, absorbed CO2 can be released back into the atmosphere, e.g., due to deforestation. Figure 1 shows the percentage of afforestation in EU-27 countries. It is very heterogeneous. Afforestation is highest in Finland (74%) and the lowest in Ireland and the Netherlands (11%) [5].
The second way to reduce CO2 emissions is to increase energy efficiency and eliminate fossil fuels from the energy mixes of EU member states by 2050. Energy mixes also vary greatly from country to country. For example, lignite and hard coal are perceived as the main components of typical mixes but, at the same time, are a problem in the fight against climate change in Poland. It is assumed that combustion is the main cause of environmental degradation, and that this leads to an increase in the greenhouse effect. Therefore, it is necessary to develop a zero-emission energy strategy that will be adapted to the energy structure of a given country. To make this possible, it is necessary to segment the EU-27 countries in terms of their energy mixes and to designate groups of countries with a similar structure to the set of indicators adopted for the analysis.
The research carried out focuses mainly on Poland against the background of the other EU-27 countries. Poland is a special case due to its unique access to coal resources in the European Union. Therefore, it was verified whether the countries whose energy mix is based on coal will create a cluster due to the similar structure of energy sources used, the structure of electricity production, and the level of emissions of pollutants caused by coal combustion.
It is believed that removing coal from countries’ energy mixes and replacing it with natural gas is more beneficial in terms of greenhouse gas emissions. Gas has been designated as a transitional fuel for the energy transformation period of EU member states [7,8,9,10,11]. Therefore, the authors aim to verify the relationship between the composition of the energy mixes of the EU-27 member states and the amount of greenhouse gases emitted. The first hypothesis is put forward:
There is a relationship between the basis of the energy mix and the level of pollution generated in a given country.
Effective actions aimed at implementing the objectives of the Paris Agreement and the European Green Deal should unify the energy systems of the EU-27 countries.
European leaders aim to create integrated energy markets. The European Green Deal and Energy Union strategy (COM/2015/080) defines how EU countries should work together to achieve the goals of the Energy Union. This cooperation should lead to the unification of the energy mixes of the EU countries. As the strategy was adopted in 2015, the authors aim to verify the changes taking place in the member states in terms of the standardization of EU-27 energy systems. Therefore, the composition of EU-27 energy mixes is compared before the introduction of the strategy (2011) and a few years after its introduction (2019). Therefore, a second hypothesis is presented: the energy systems of EU countries will become similar to each other.
These hypotheses are verified during the research presented in this publication. Research is carried out in six steps, as presented in Figure 2.
First, a set of indicators is constructed to characterize the energy systems of the individual member states. For this purpose, the data contained in the Eurostat database in the Climate Change Drivers and Environment and Energy sections are used. In the next step, the structure of the energy mixes of the member states is analyzed to select those whose energy industry is mostly based on coal. Then, a cluster analysis is performed for the EU-27 countries. The conclusions drawn on the basis of the previous steps are compared with the hypotheses, enabling their verification.
In summary, the authors of the article conducted the presented research in order to obtain answers to the following questions.
  • Is there a relationship between the amount of greenhouse gas emissions and the composition of the energy mix of the EU-27 countries?
  • Do countries with a coal-based energy mix emit more greenhouse gases per capita?
  • What is the largest source of greenhouse gas emissions in countries with the highest CO2 emissions per capita?
  • Have the actions taken in individual member states led to the unification of the energy mixes of the EU-27 countries?

2. Literature Review

The European Union is party to the Paris Agreement. The agreement prescribes reductions in greenhouse gas emissions so that the increase in the average temperature of the world, compared to the level in the preindustrial era, does not exceed 2 °C. The agreement required all countries to present long-term scenarios to reduce greenhouse gas emissions by 2020. Another step of the European Union, which is on the way to the complete elimination of the negative impact of man on the natural environment, is the adoption of the European Green Deal. Climate action is the goal for which the European Green Deal was created. It includes the reduction in greenhouse gas emissions, the protection of the natural environment and investments in innovative technological solutions, and research to achieve the goals of the Green Deal. The most important initiatives in the context of the research conducted by the authors are:
  • The 2030 Climate Target Plan [12], whose implementation is intended to lead to a reduction in greenhouse gas emissions by at least 55% by 2030;
  • The European Climate Pact [13], which aims to mobilize and engage citizens of the member states to act for climate protection;
  • The European Climate Law [14] for achieving climate neutrality by 2050.
The European Commission identified legislative proposals in 2021 to help achieve the goals set out above. These included, primarily, updating member state emission reduction targets (Effort Sharing Regulation) in line with the 2030 Climate Target Plan, land use, forestry and agriculture, a revision of the CO2 emission performance standards for new passenger cars and vans, and a social climate fund.
The European Green Deal aims to transform the Union into a competitive and resource-efficient economy. The most important limiting condition imposed on the tasks that lead to the achievement of this goal is zero greenhouse gas emissions. The Green Deal must be achieved by increasing the share of renewable energy sources in the energy mix of the member states, increasing energy efficiency, implementing the principles of circular economy, expanding the share of natural CO2 bioabsorbers, decarbonization and carbon dioxide capture, energy storage, and alternative fuels [1].
The Paris Agreement and the Green Deal assume that global warming should be limited by eliminating carbon dioxide from the atmosphere at a level higher than its emission [15,16]. However, it turns out that such treatments will not be as effective as previously assumed [17,18]. Research has been carried out to verify the relationship between CO2 emissions and removal from the atmosphere. The possibilities of natural absorbers have been found to be limited. The adsorption capacity of the oceans increases until a critical concentration of CO2 is reached. This is similar for forests. These factors have been identified as the main reasons for the lack of symmetry between the level of carbon dioxide emitted and its removal. Thus, it has been noticed that the increase in the concentration of CO2 in the atmosphere after its emission is higher than the decrease in this concentration after the removal of an identical amount of CO2 [19]. Therefore, the most advantageous solution in this case is the capture of carbon dioxide before it is released into the atmosphere. A solution that can be used in the case of burning hard coal and lignite is CO2 sequestration CCS (carbon capture and storage) and CCU (carbon capture and utilization) [20]. The authors believe that CCU is an even more advantageous solution. This is because it enables the generation of additional profit through the management of carbon dioxide and its use, for example, during the oil extraction or biomass production process [21,22]. For this purpose, the authors proposed a membrane technology that allows the separation and thus purification of the gas mixture formed during the combustion of fossil fuels, including coal, natural gas and crude oil. Membrane techniques can also be used to extract REE from fly ash.
One of the main goals of the Green Deal is to decarbonize the energy system and, therefore, in many countries to close coal-fired power plants and heating plants [23]. Renewable energy sources will replace coal. However, attention should be paid to the problems that it may generate. The rapid elimination of coal leads to instability in the energy systems of the European Union. This manifests itself in the threat of blackout, which is so real that many countries have developed instructions or training for their citizens should it occur. This applies, for example, to Austria, Spain, Germany, and Poland [24]. The growing share of renewable energy sources in the structure of energy production leads to a loss of stability of energy systems. Renewable energy sources still require support from fossil fuels, mainly due to the inability to store energy produced only under certain climatic conditions. The fuel that is perceived as a substitute for coal in the transition period is natural gas. It is also a fossil fuel, but its combustion generates about 50% less carbon dioxide than burning coal [25]. It should be noted that crude oil generates only about 20% less CO2 than burning coal. Investments to build an energy capacity based on gas and oil would, therefore, also require the use of exhaust gas cleaning systems. In addition, gas and oil are mostly imported from Russia, which in light of the political instability in this area has always posed a threat to the energy security of the EU. The recent events in Ukraine strongly confirm the authors’ assumption.
Taking into account the above, as well as the diversification of the structure of energy carriers in the EU-27 countries, a strategy should be applied enabling the transition to zero-emission energy while ensuring that citizens have access to energy in sufficient quantity and price.

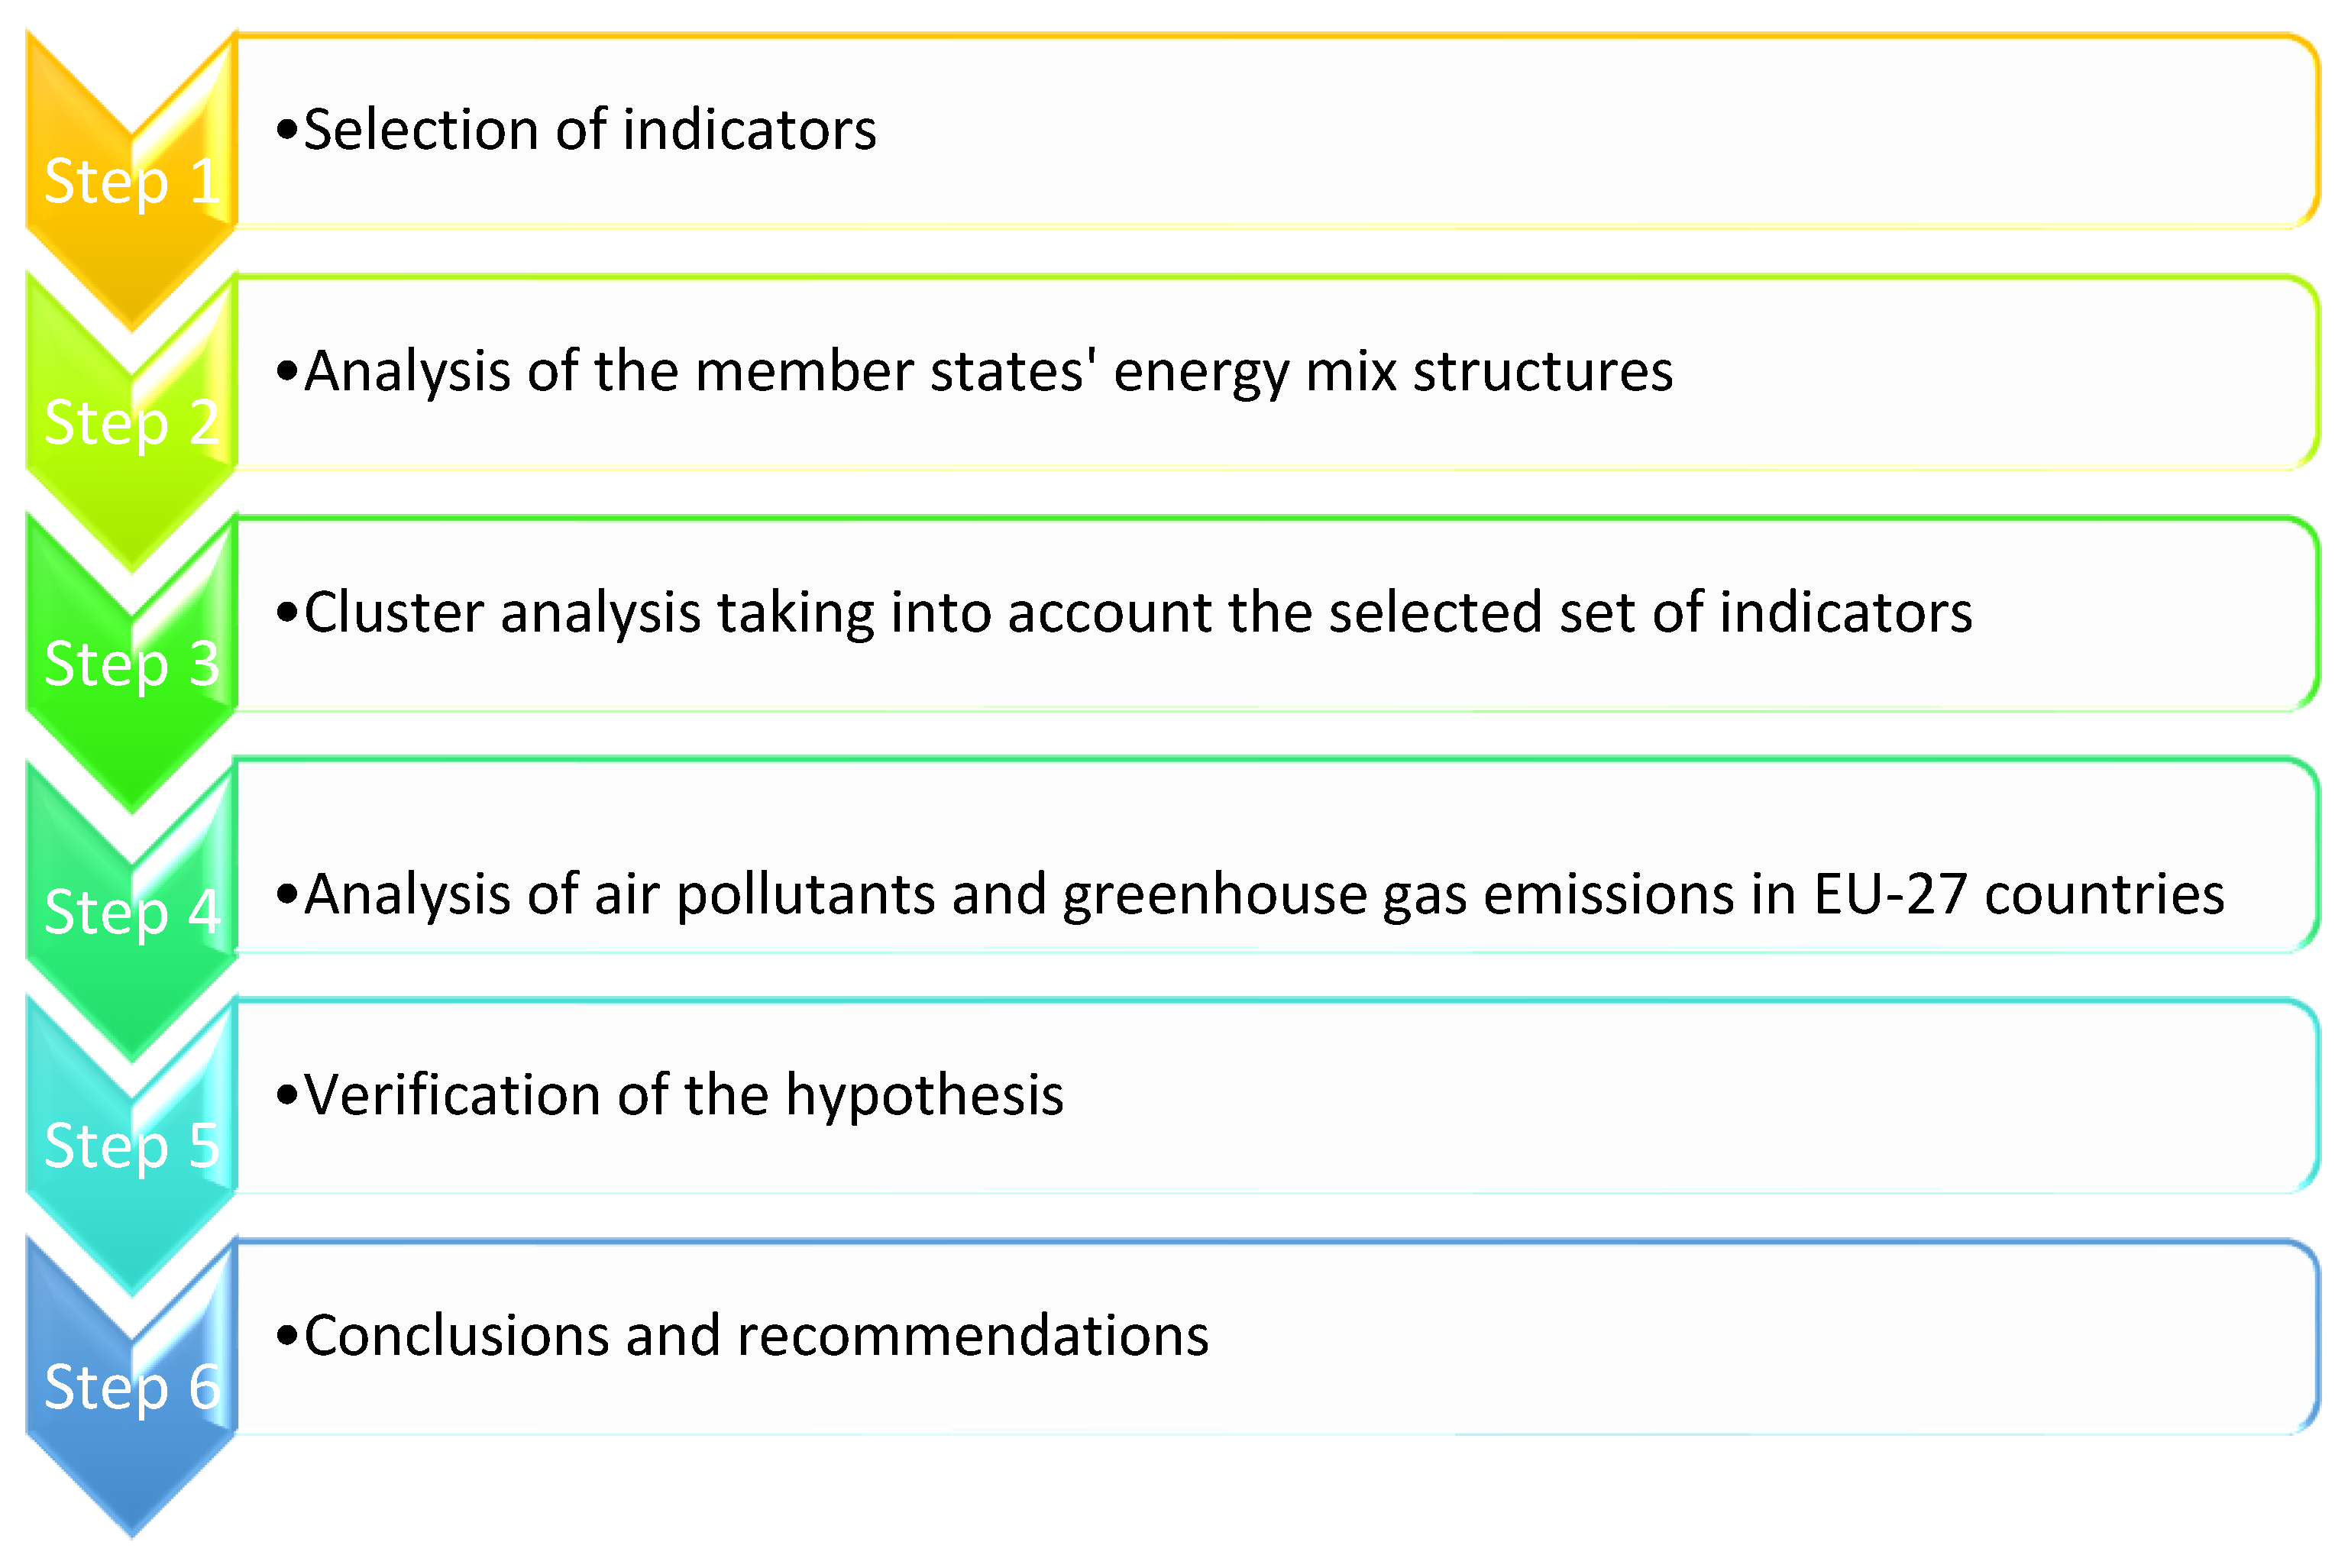
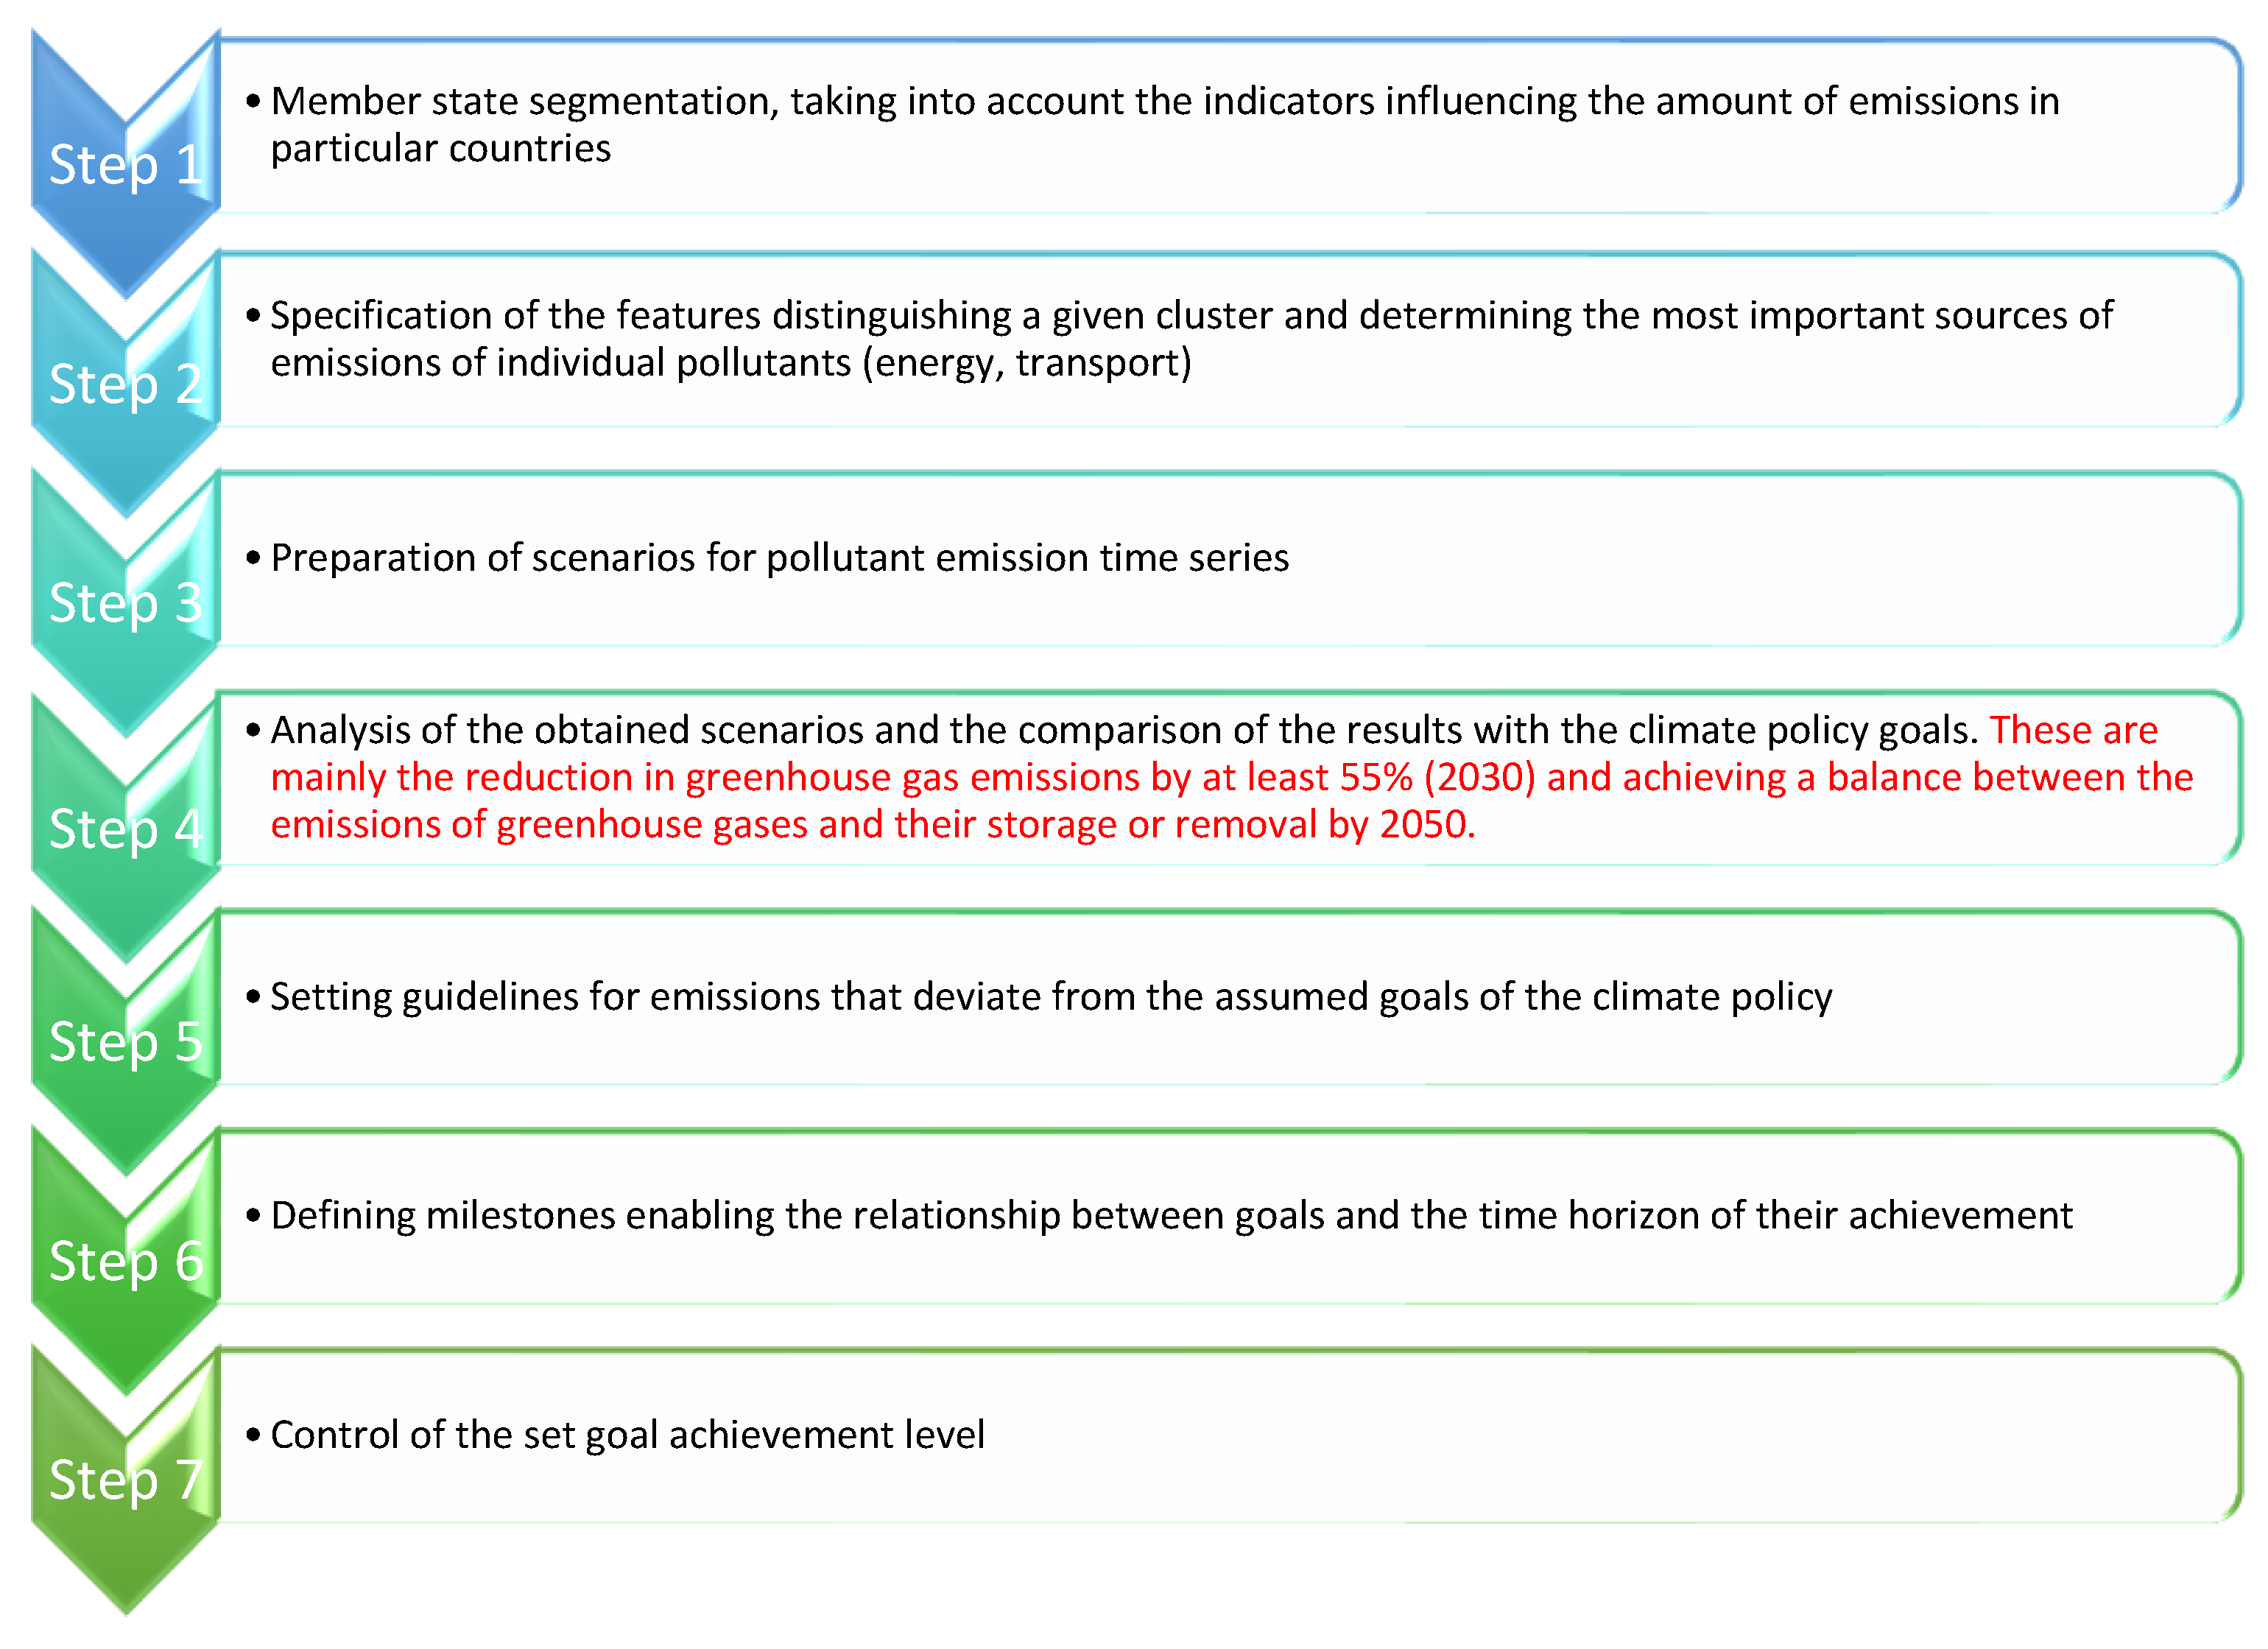
3. Materials and Methods

To conduct the presented research, the tools of spatial information systems were used. The QGIS 3.16.13 Hannover program was applied. These tools mainly comprise card diagrams, rasterization, the TSA method, cluster analysis, and ARIMA models. These methods are described below.

3.1. Cluster Analysis

The method was developed by J. McQueen and presented in 1967 in his work [26]. During the cluster analysis, the k-means method is used. It is a method from the family of cluster analysis algorithms. Cluster analysis consists of grouping a set of objects. This division is carried out on the basis of the method of minimizing the variance within individual groups and maximizing it between groups. It is an iterative method to optimize the feature split quality function.
In k-means analysis, the following steps are performed:
  • The choice of the number of centroids and their initial arrangement in space;
  • The initial random division of the set of objects into k-clusters around centroids: for this purpose, the average distances of individual points are calculated. Then, the objects are assigned to the nearest centroids;
  • Updating the position of centroids, e.g., by determining the arithmetic mean of the coordinates of all points;
  • Repeat steps 2 and 3 to achieve the convergence criterion. This is the state in which the allocation of points to individual groups has not changed.
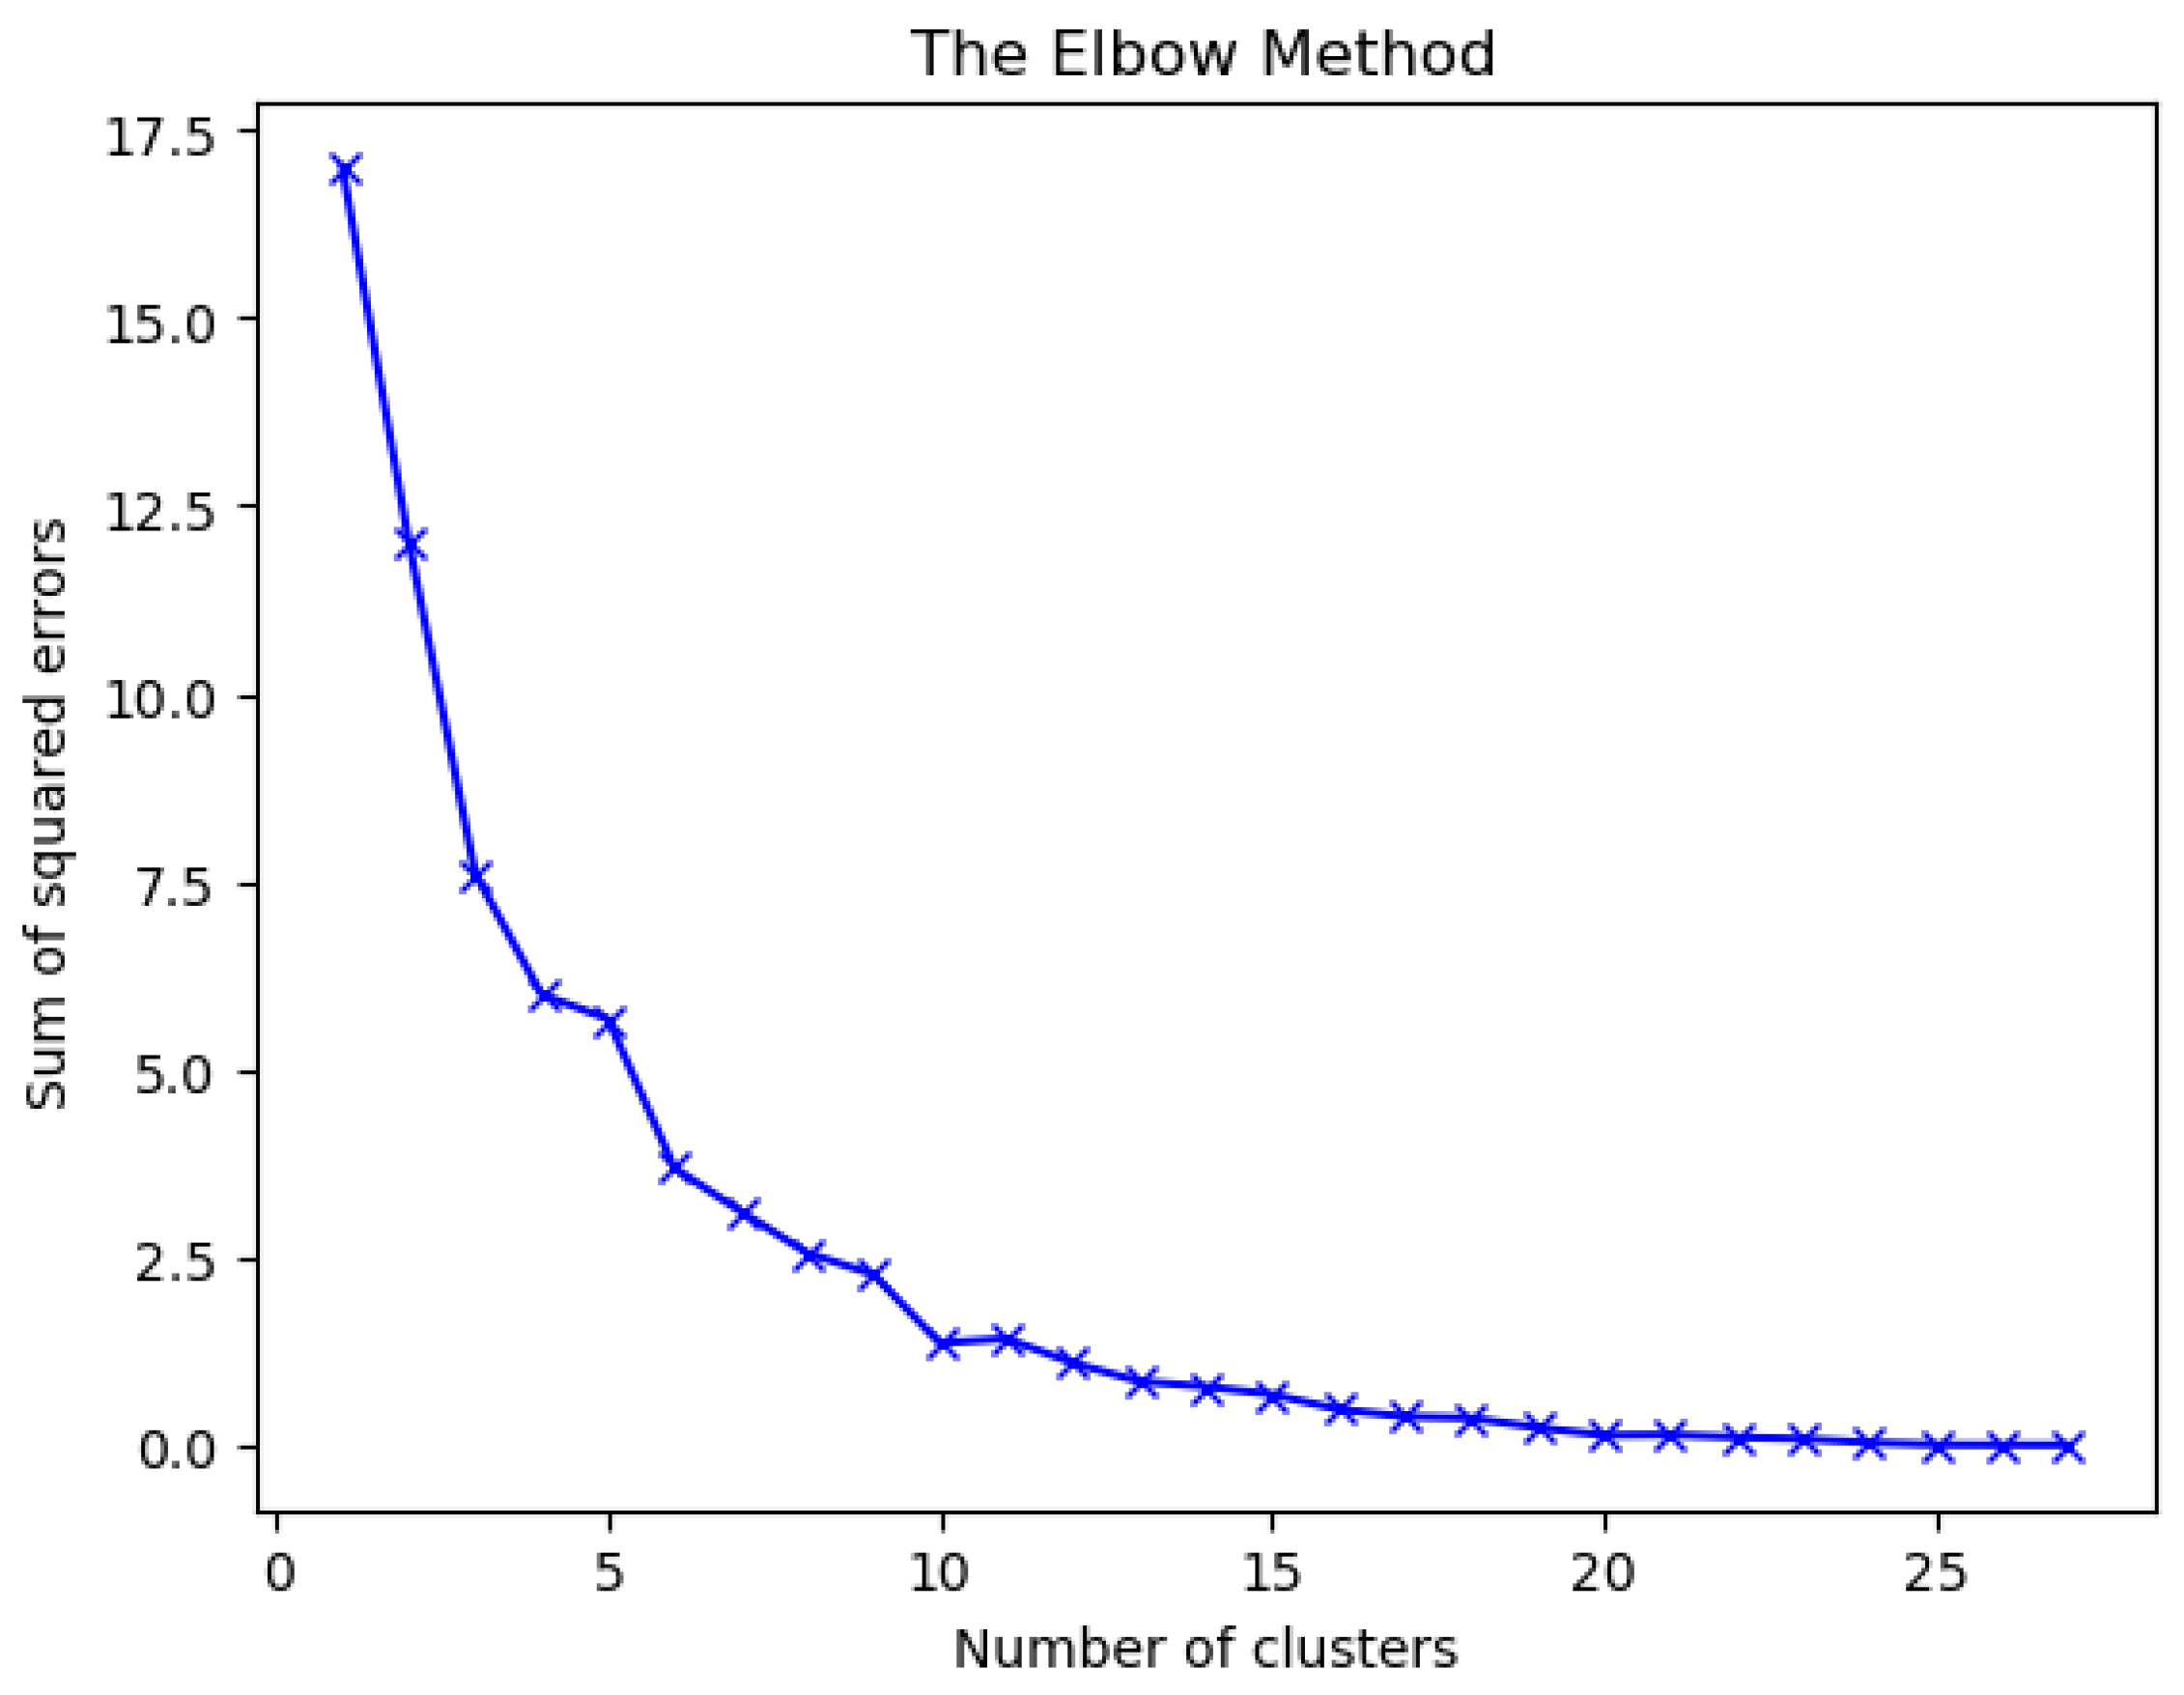
The k-means method enables data analysis and its division into homogeneous categories. This, in turn, makes it easier to analyze a given phenomenon. This makes it easier to draw conclusions and find relationships between individual objects.

3.2. Elbow Method

The number of clusters should be determined on a preliminary analysis. The Elbow method [27,28,29] can be used for this purpose. This is an empirical method to find the optimal number of clusters for a data set. This method is expressed as the sum of the squares of the error:
S E E = k = 1 k x i S k x i C k 2 2
where:
  • k—number of clusters;
  • xi—object assigned to a given cluster Sk;
  • Ck—cluster centroid.
Many methods can be used to determine the distances between objects. The most frequently used method is the Euclidean method [30,31]. It consists of determining the distance between two objects in space on the basis of the following relationship [32]:
| A B | = ( x 2 x 1 ) 2 + ( y 2 y 1 ) 2
where:
  • A = ( x 1 ,   y 1 ) , B = ( x 2 ,   y 2 ) —points and their geographic coordinates.

3.3. ARIMA Model

To forecast the emission level of the selected gases, the ARIMA model [33,34] was used. ARIMA models are moving average and autoregressive models described by the following equations:
y t = ϕ 1 y t 1 + ϕ 2 y t 2 + + ϕ p y t p + e t + θ 0 θ 1 e t 1 θ 2 e t 2 θ q e t q
where:
  • y t —the value of the variable in the t period;
  • ϕ 0 , ϕ 1 , , ϕ t p , θ 0 , θ 1 , , θ q —model parameters;
  • p ,   q —the quantity of delay;
  • e t , e t 1 , , y t q —the rest of the model in periods t, …tq.
The created models were verified using the AIC, BIC, and HQ [35] information criteria, as well as the RMSE and MAPE errors:
Root mean square error (RMSE) [36,37]:
R M S E = i = 1 n e t 2 n
Mean absolute percentage error (MAPE) [38,39]:
M A P E = i = 1 n | e t · 1 y t   | n
where:
  • e t —forecast error;
  • n —number of observations.

3.4. Trend Surface Analysis

In the conducted research, the trend surface analysis (TSA) global surface fit method was used. TSA allows for the creation of a spatial model of the studied area, taking into account a given feature. The model was used to detect differences in the selected indicators of individual EU-27 countries. Geographic coordinates are entered into the model as the independent variable, while the dependent variable is the selected attribute of the analyzed objects [40,41,42]:
z i j = f ( x i , y i ) + ε i j
where:
  • xi, yi—geographic coordinates;
  • zij—dependent variable;
  • εij—random component.

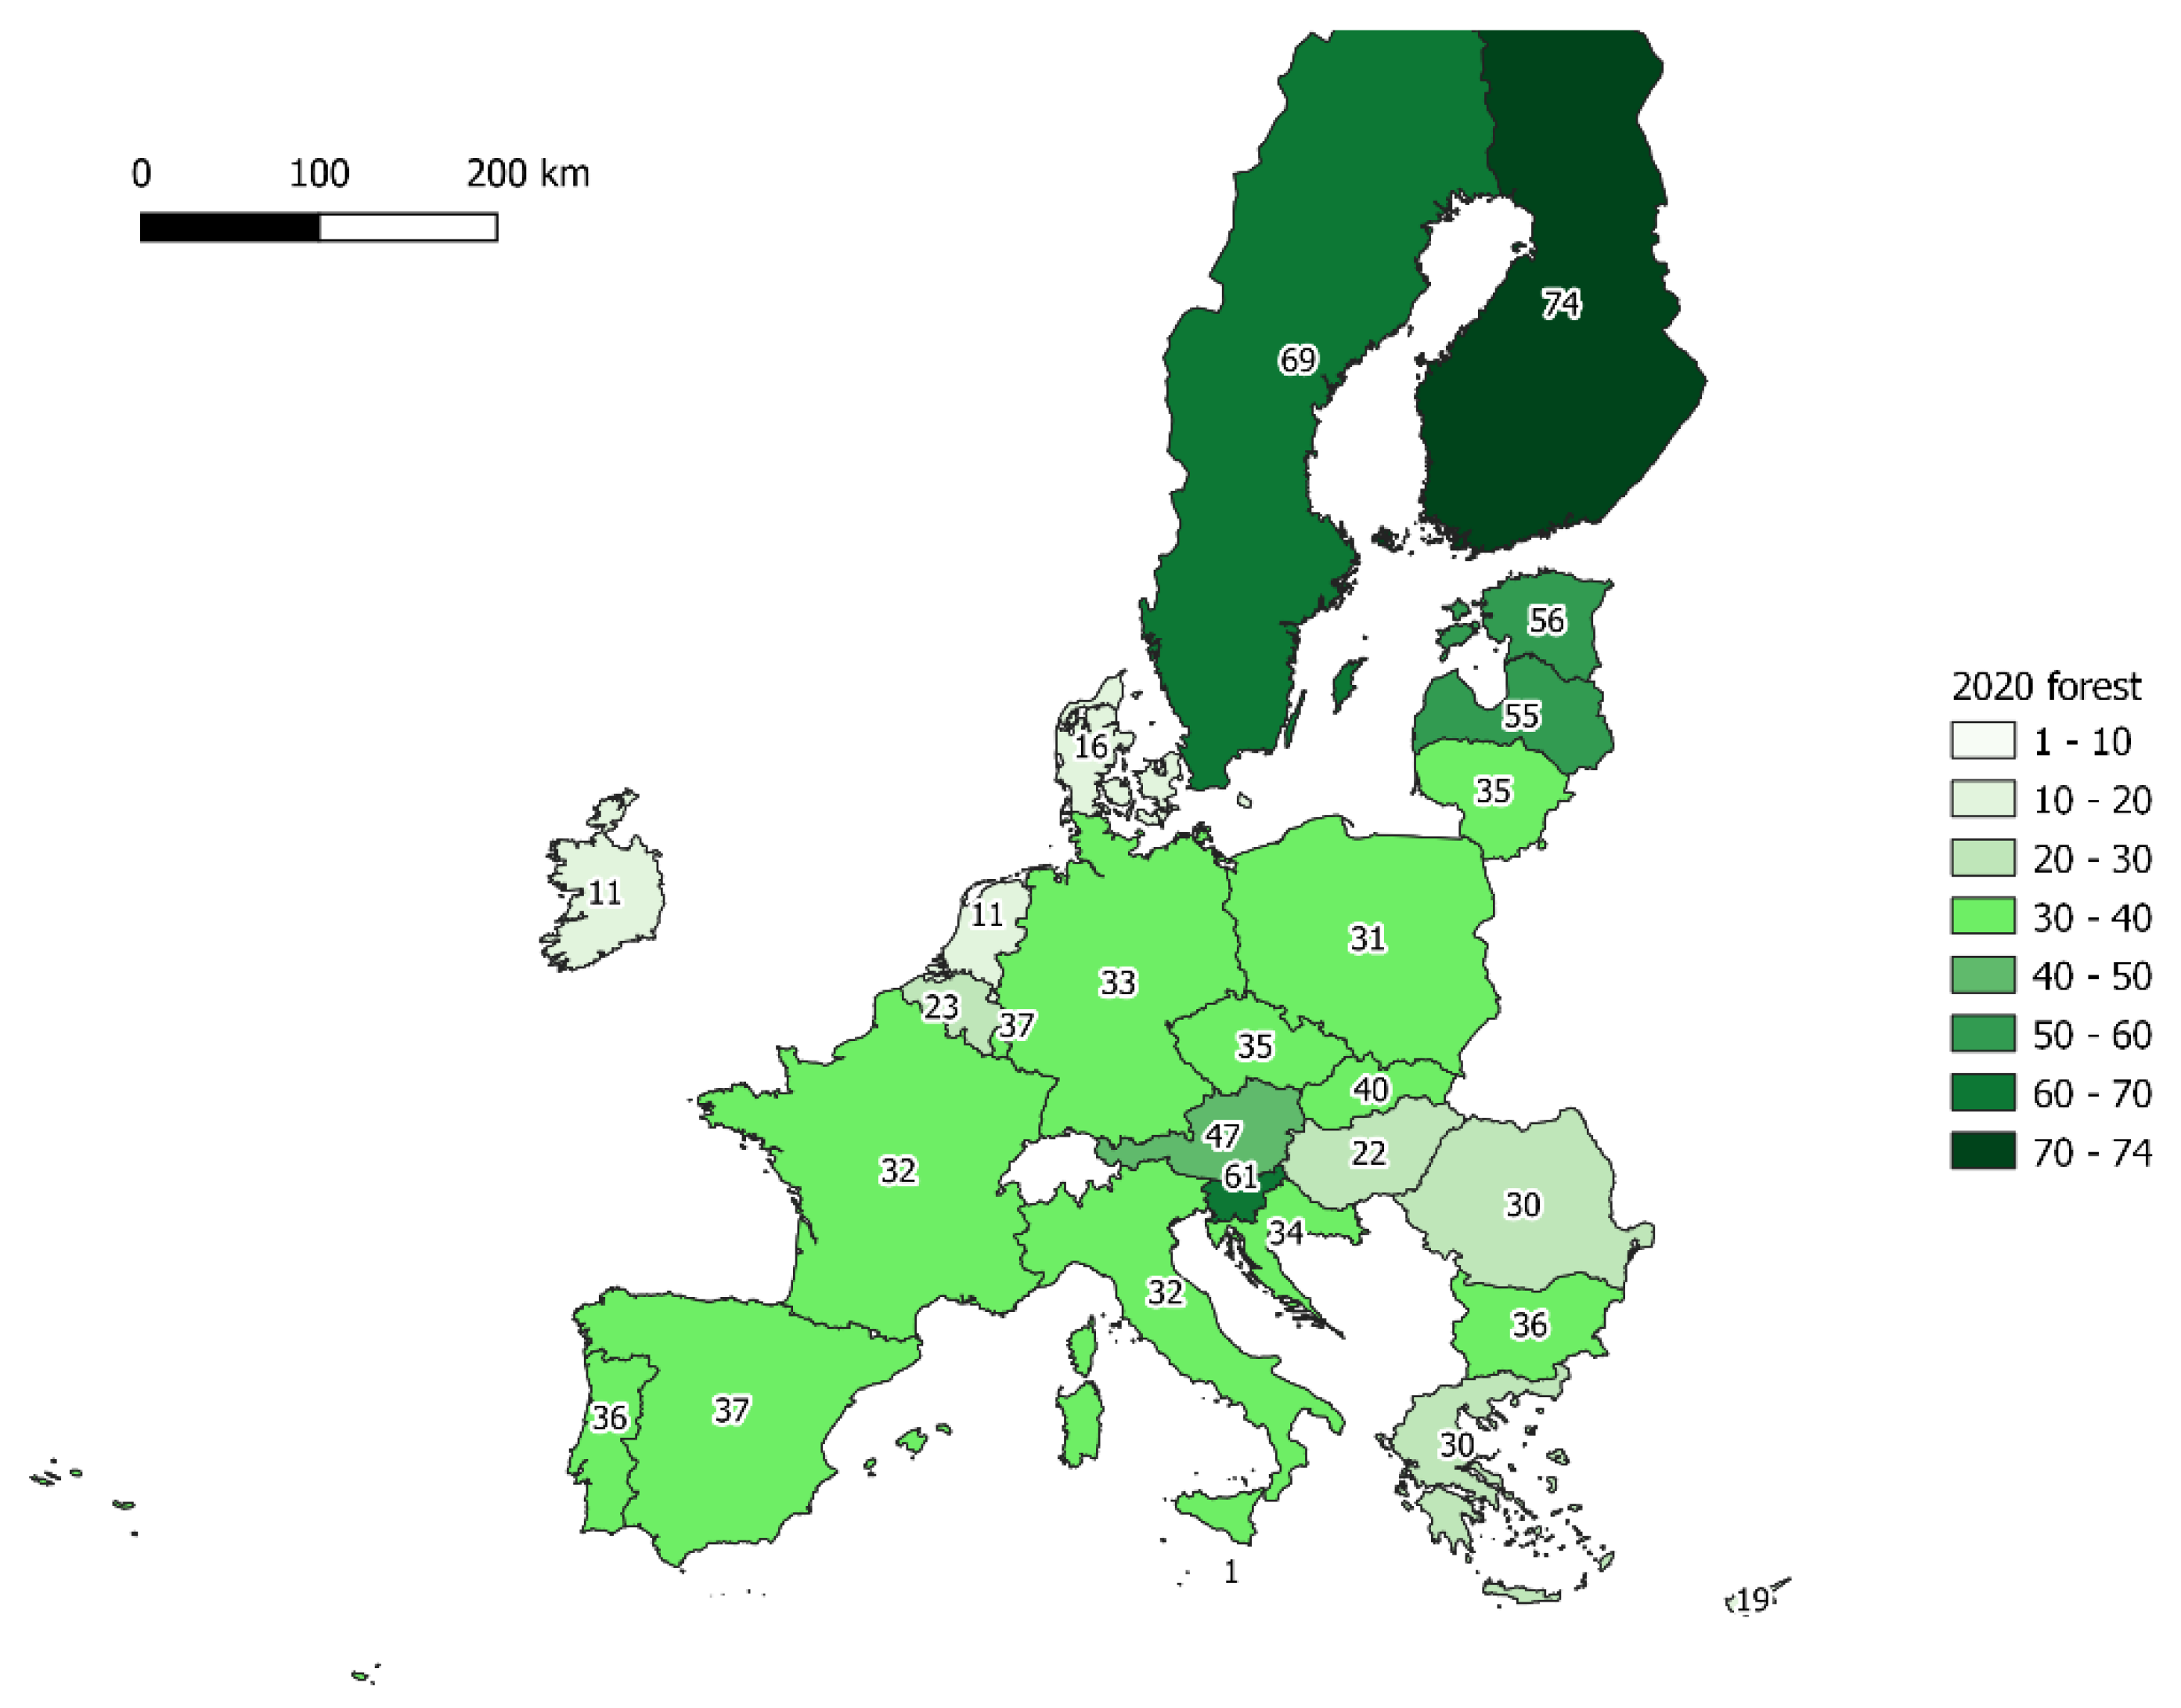
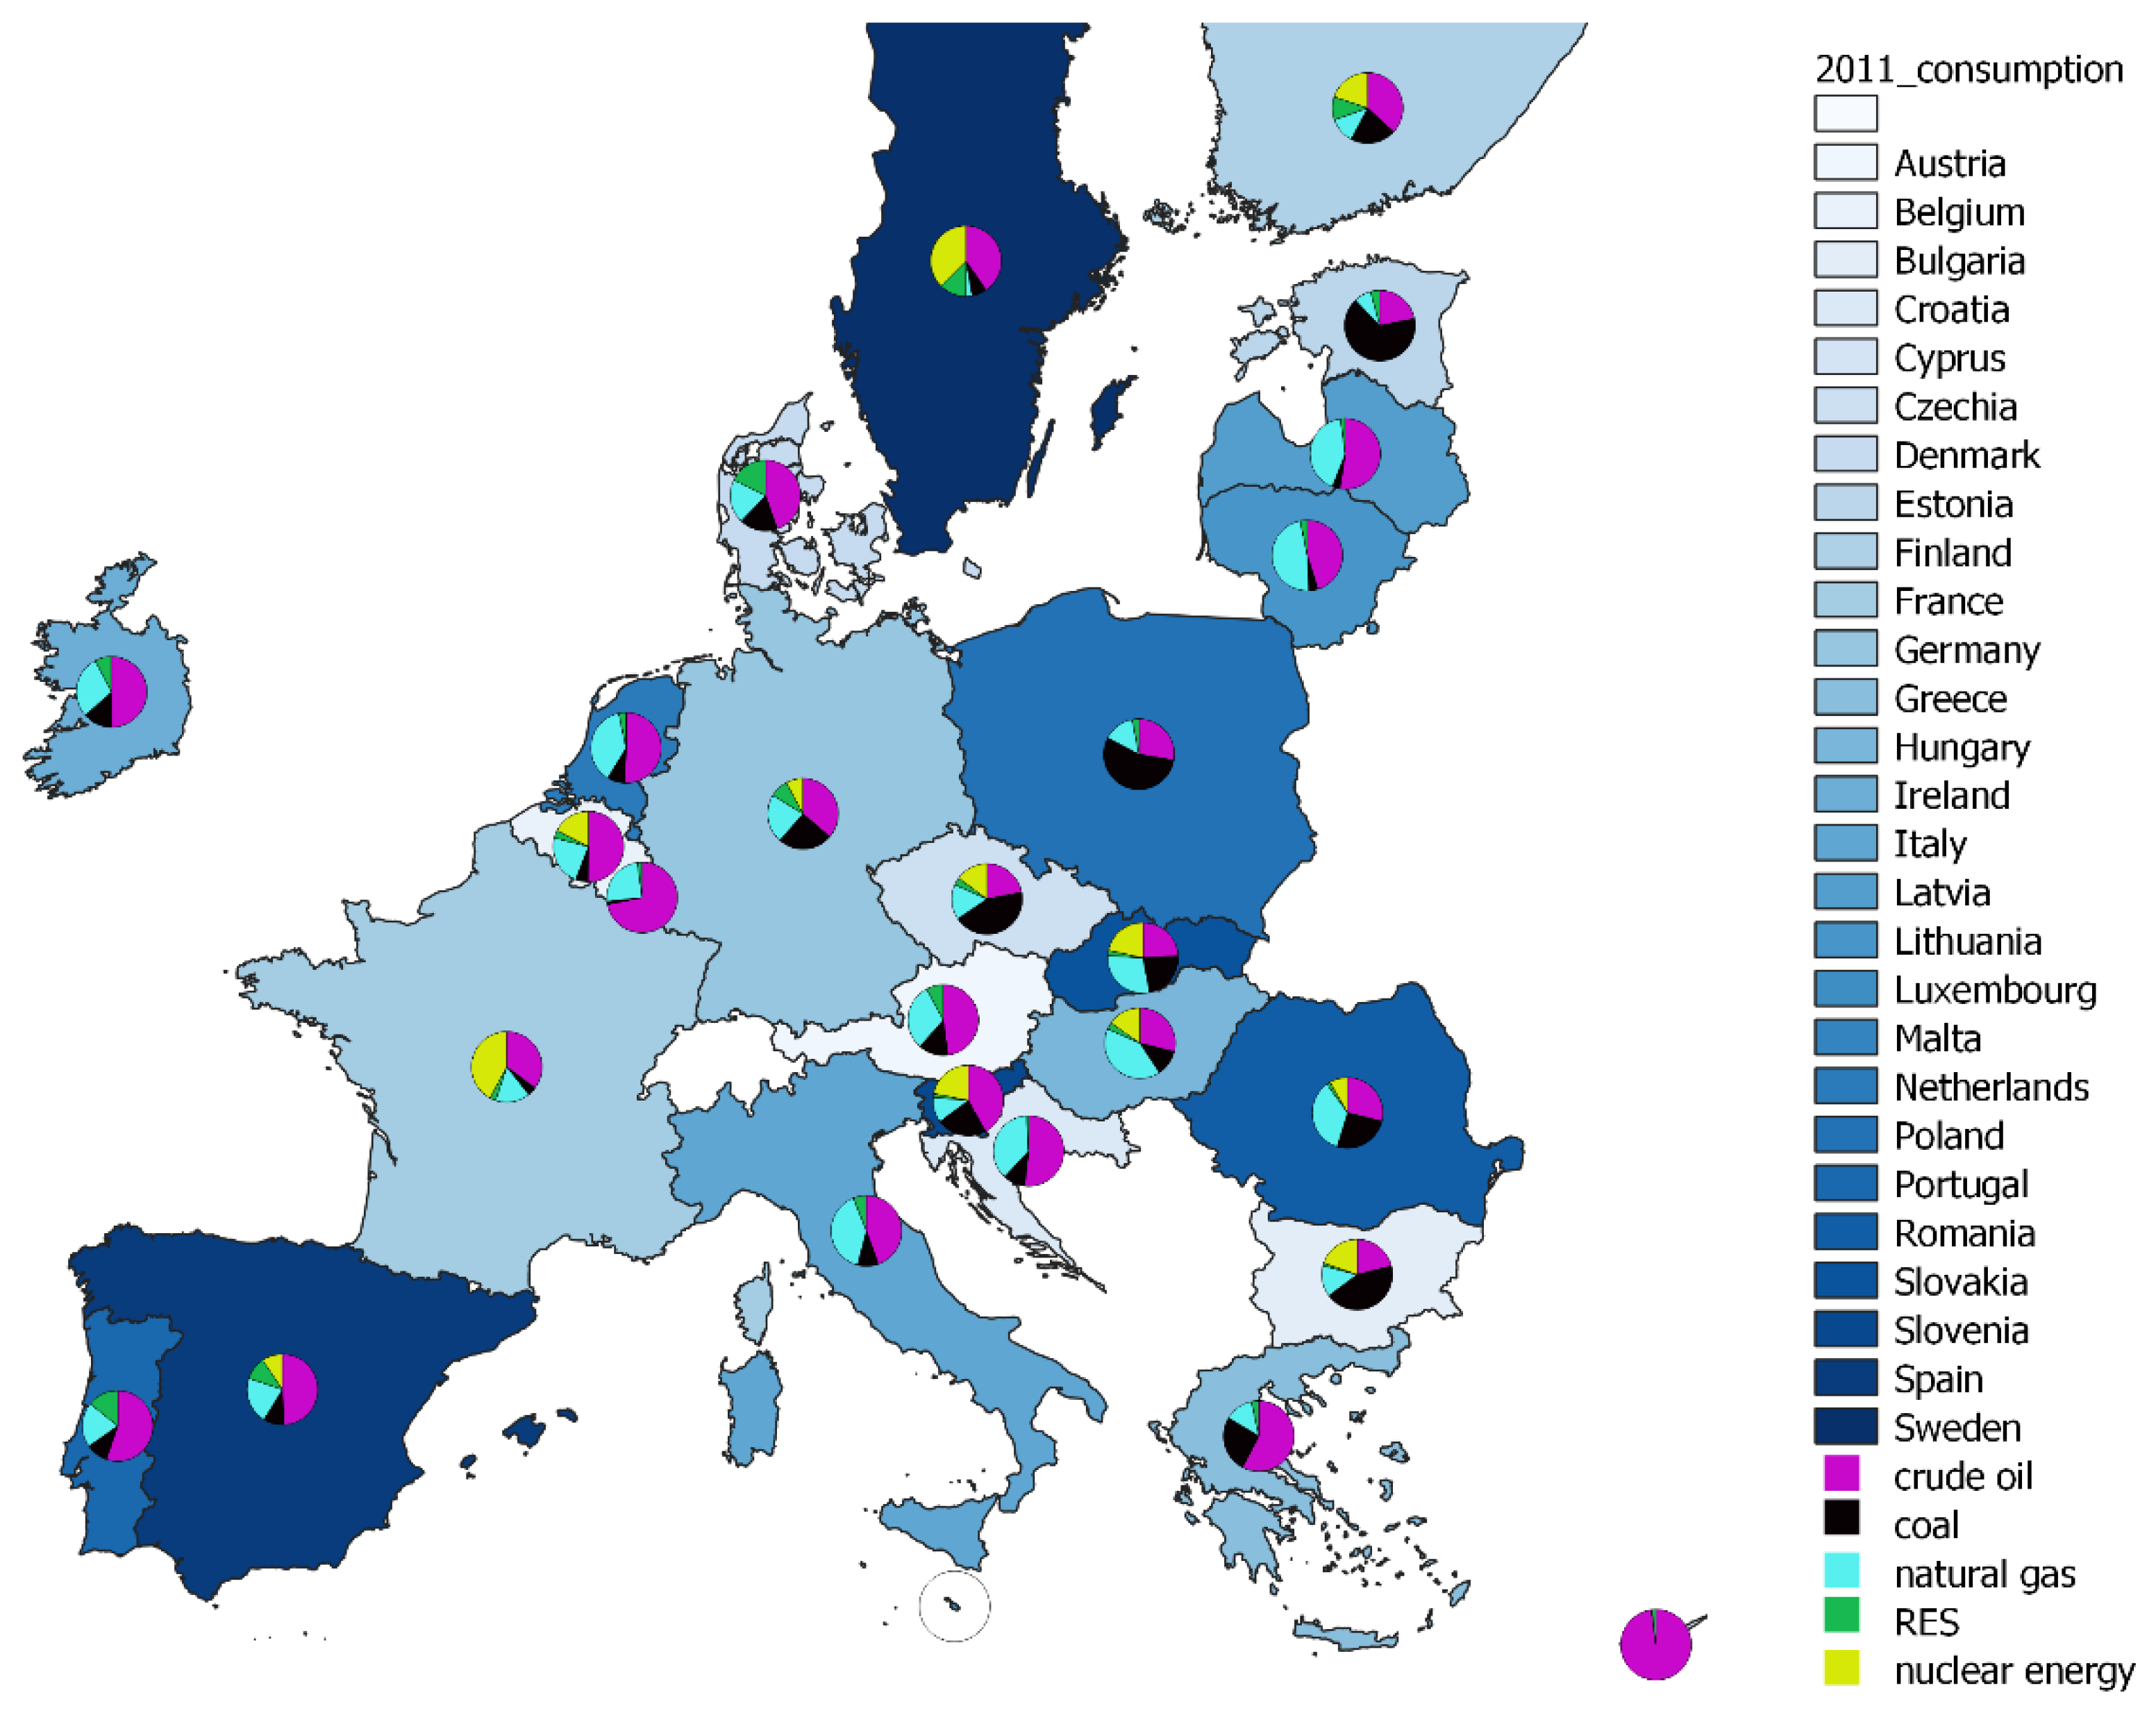
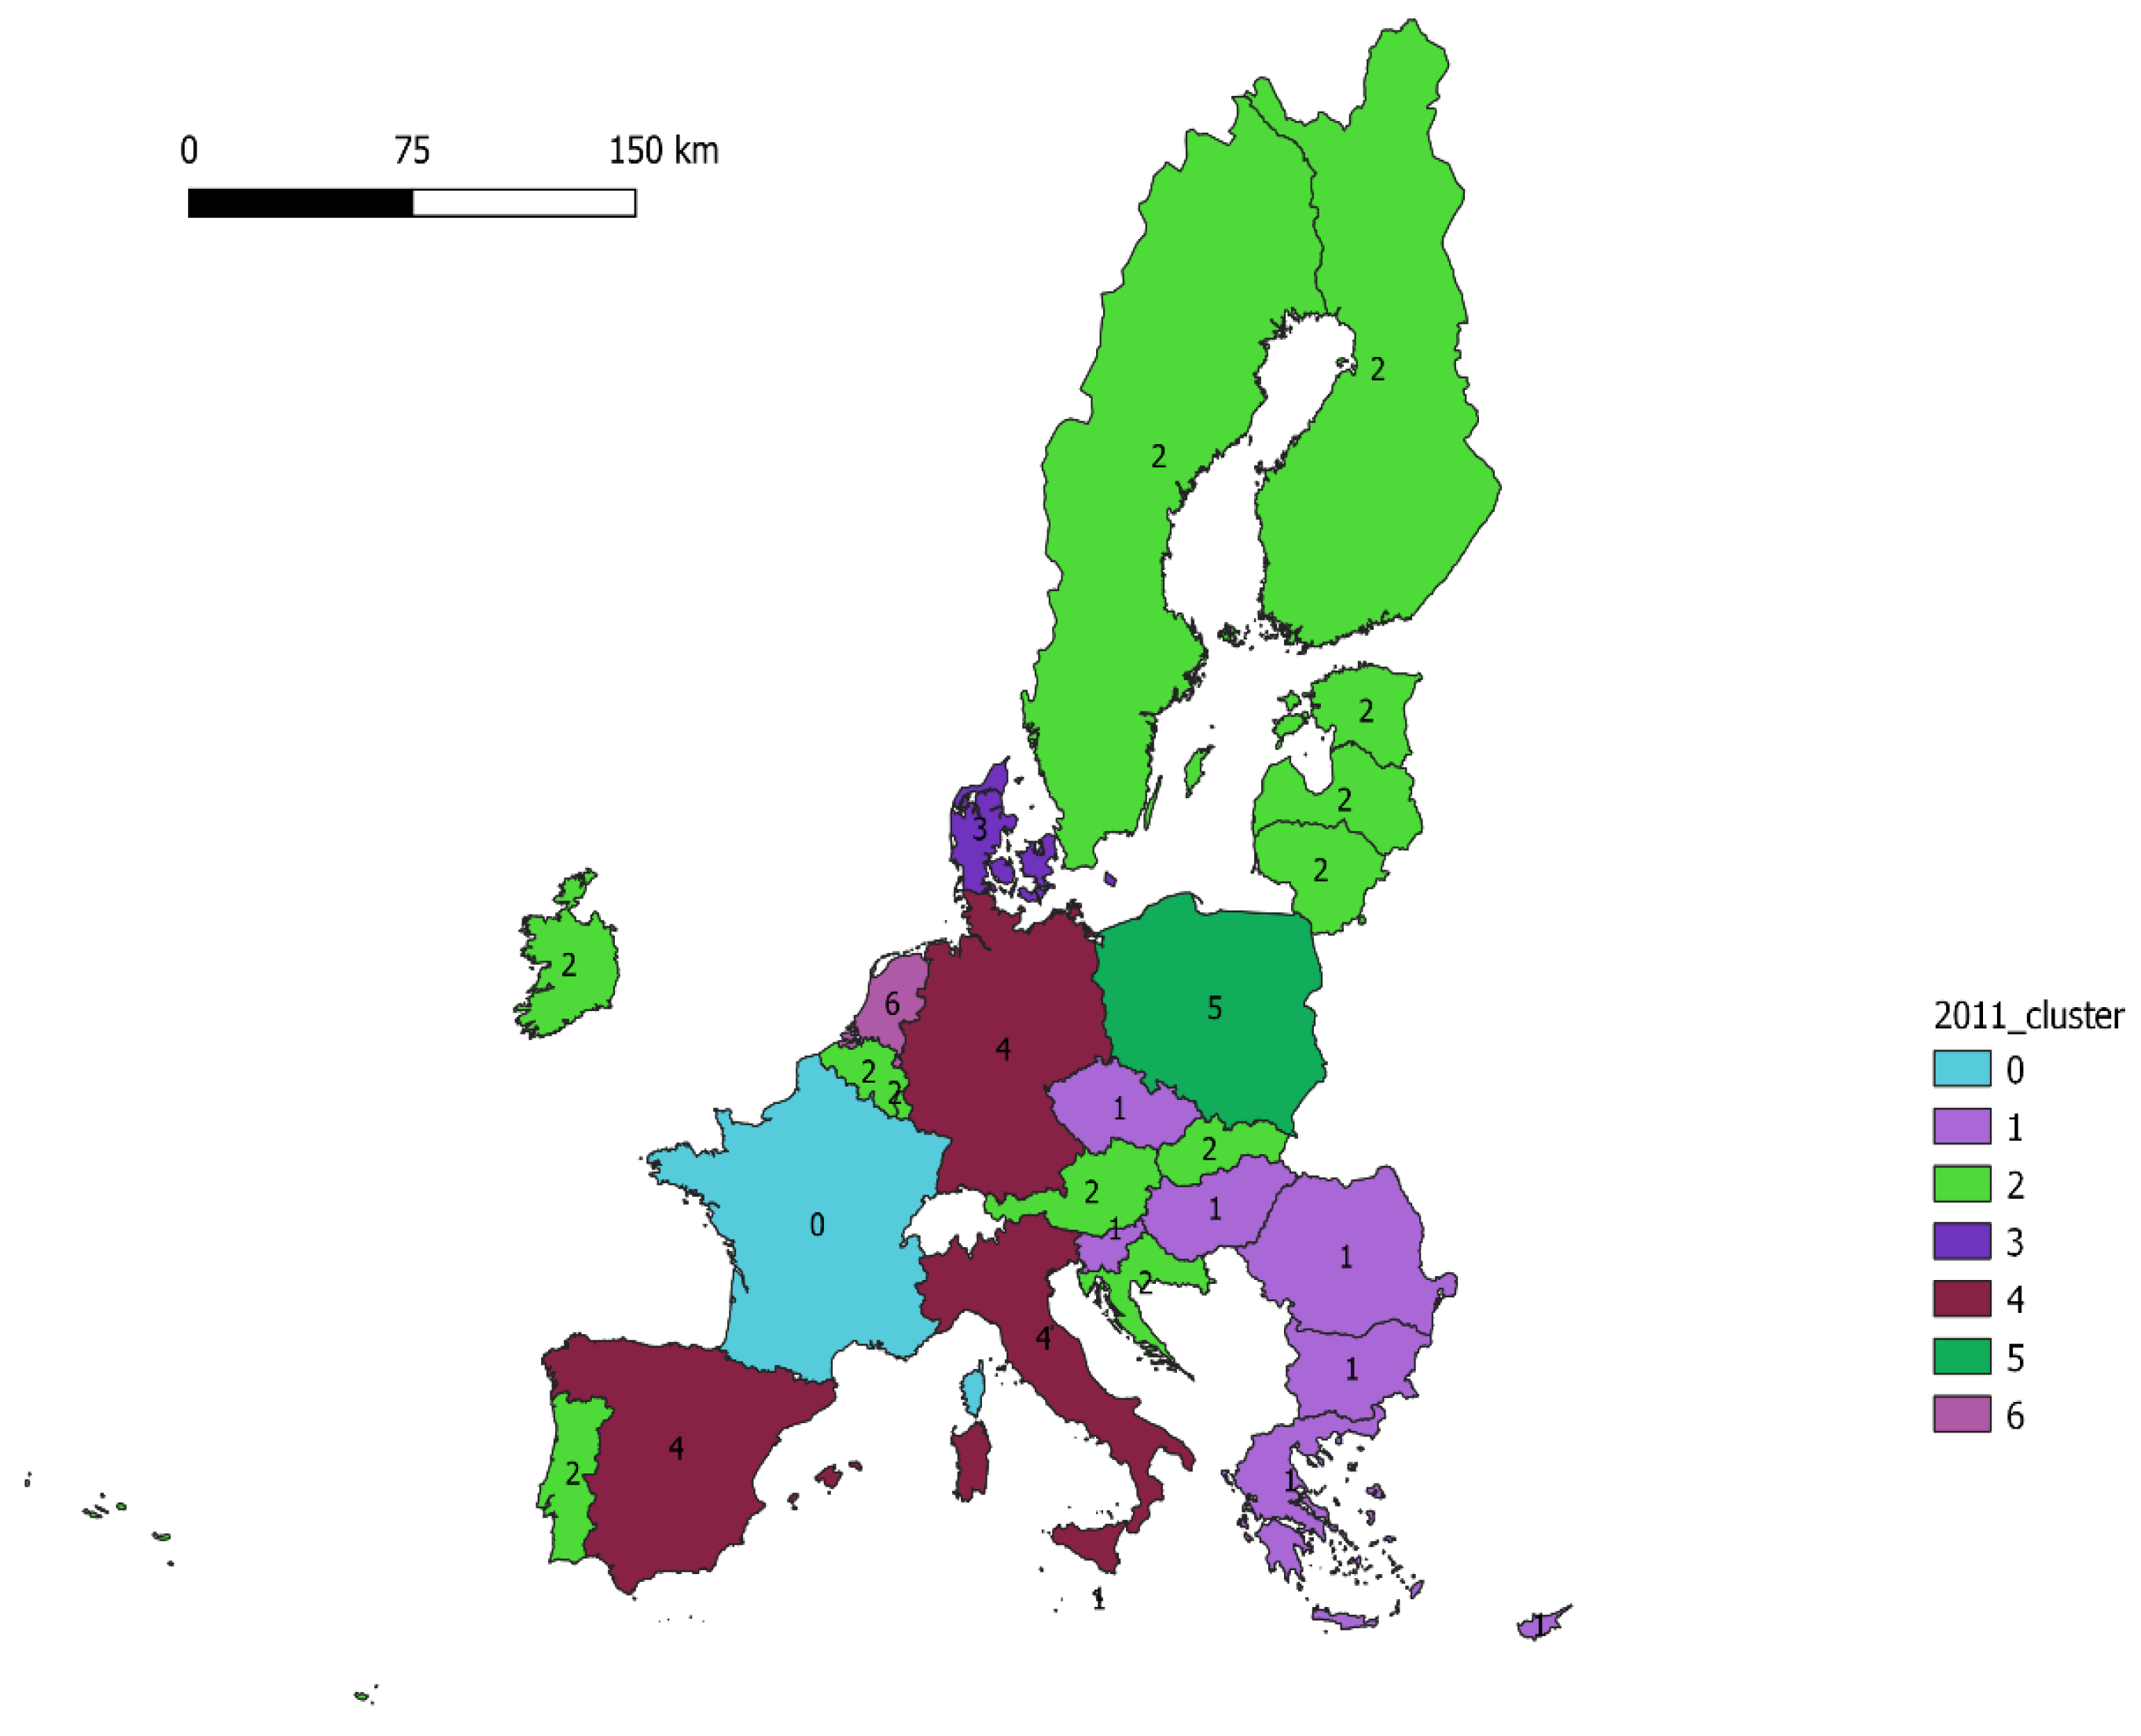
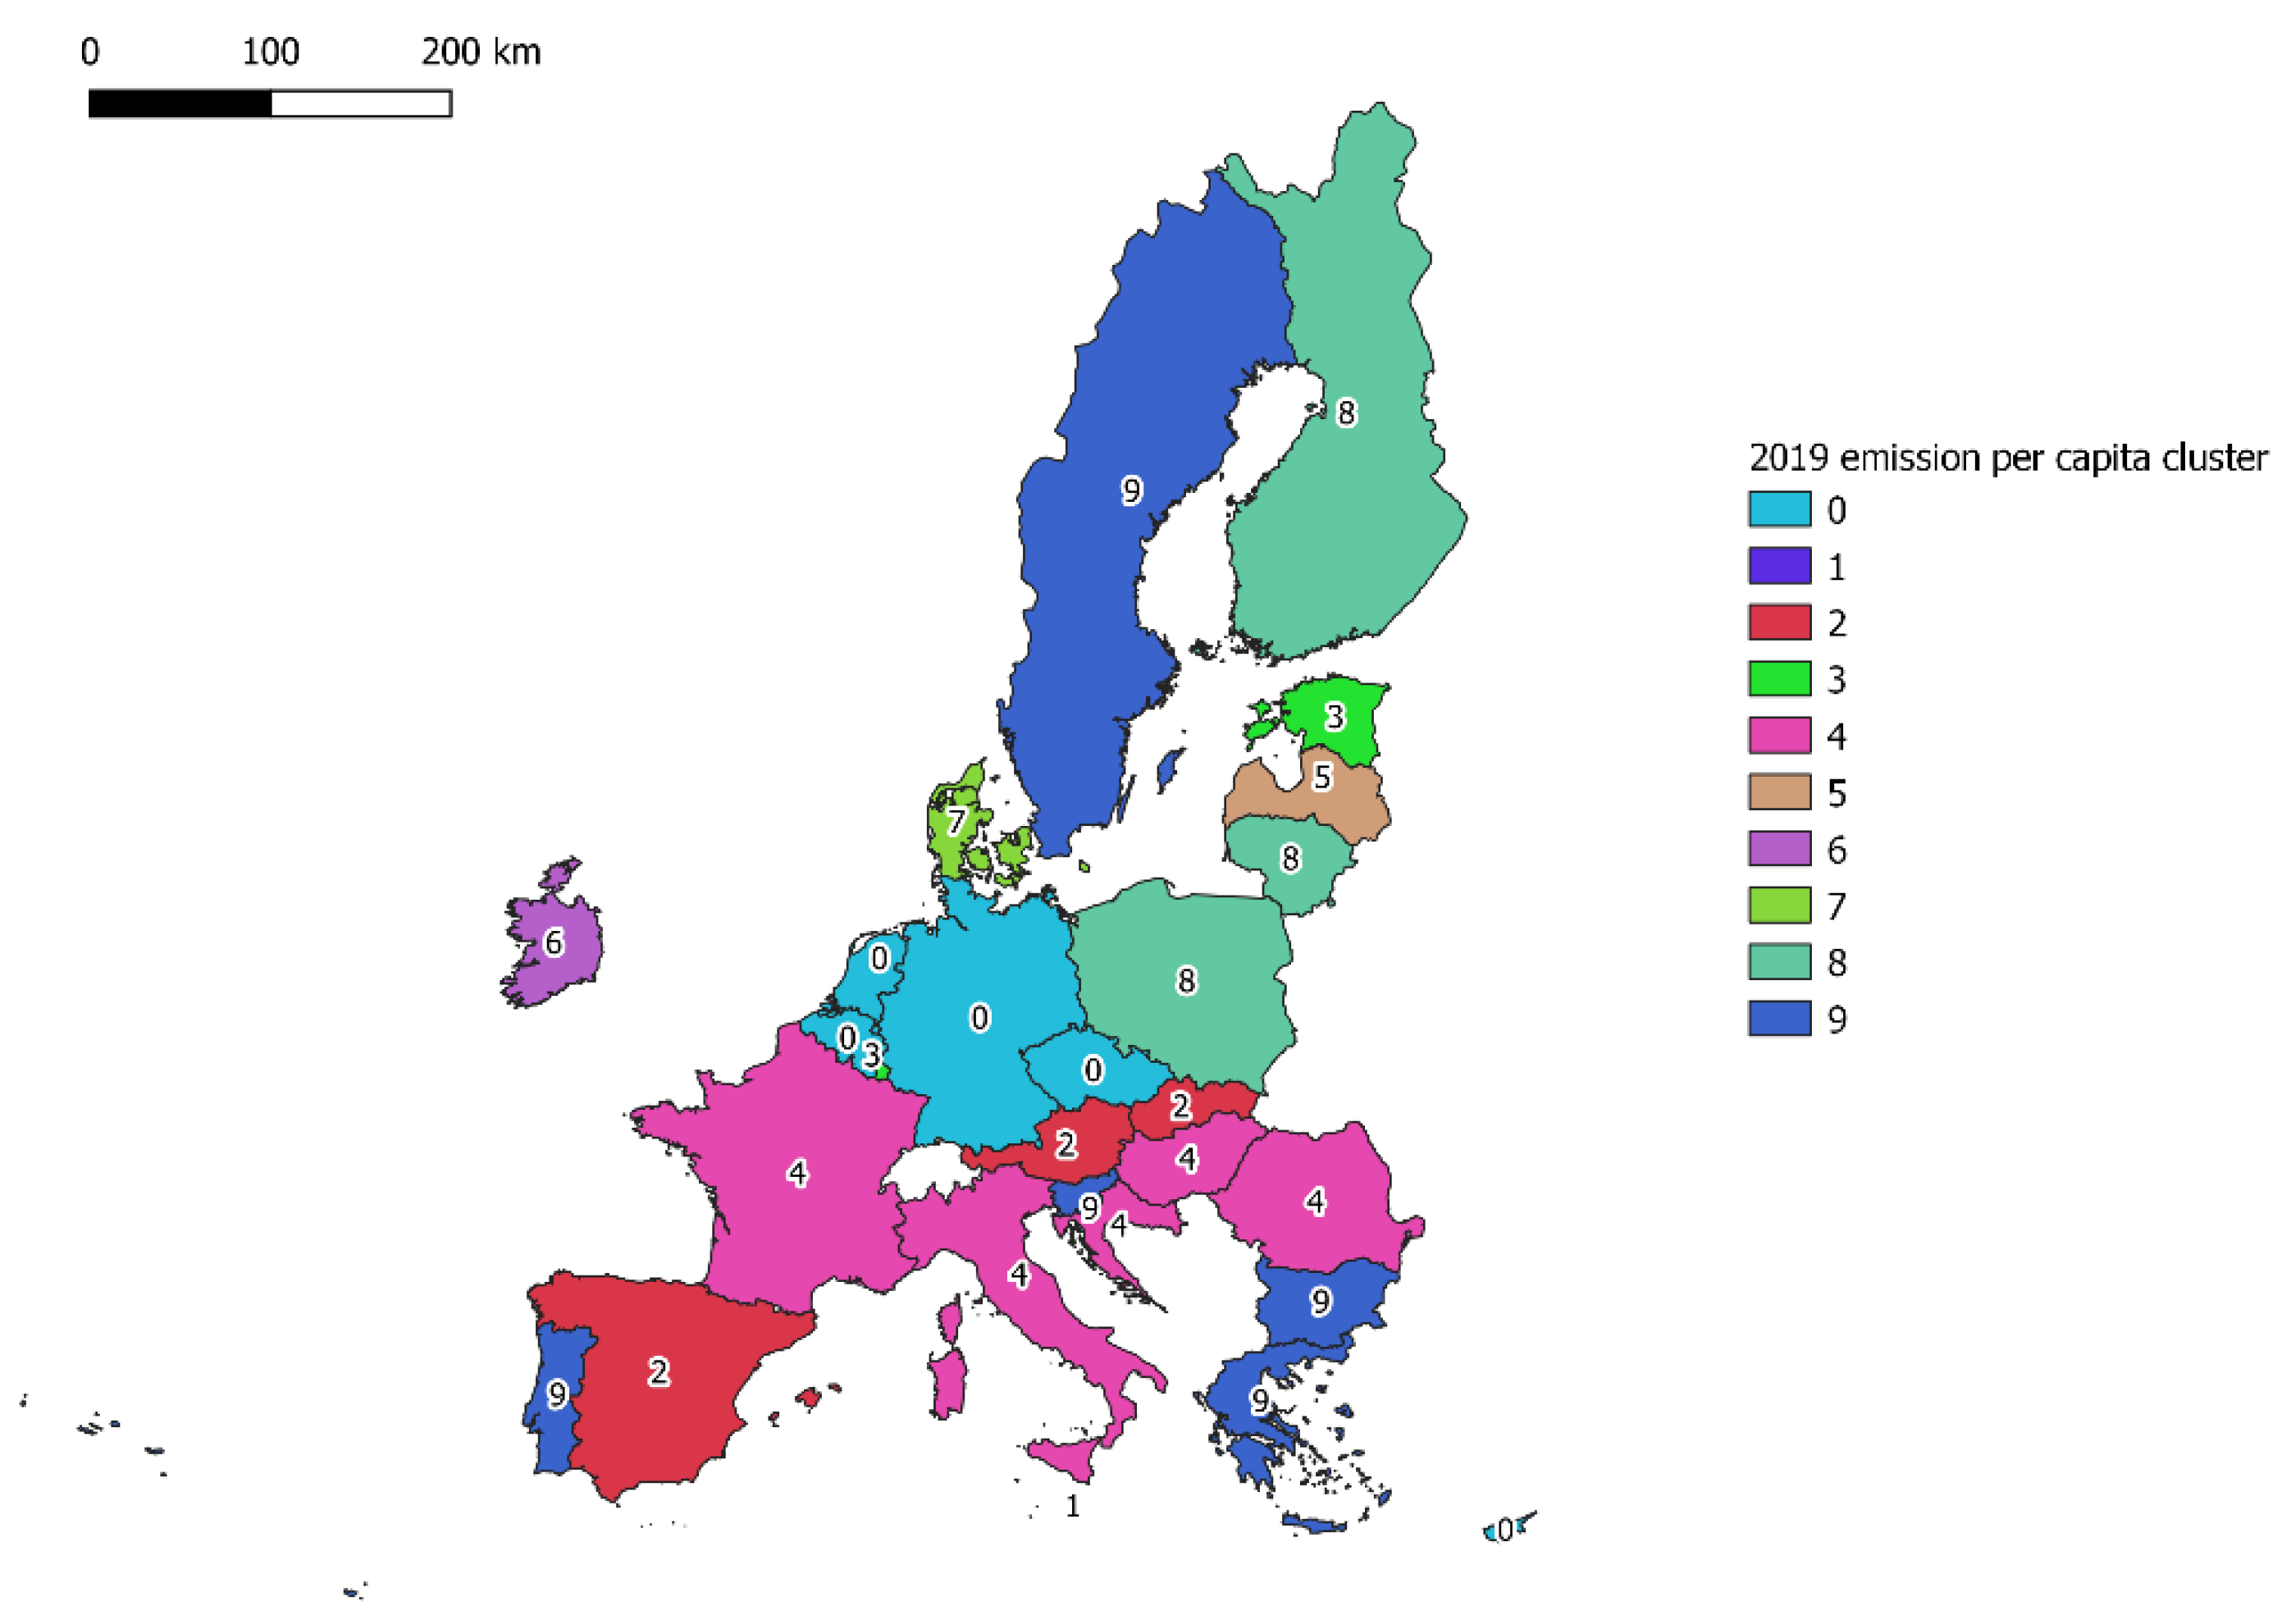
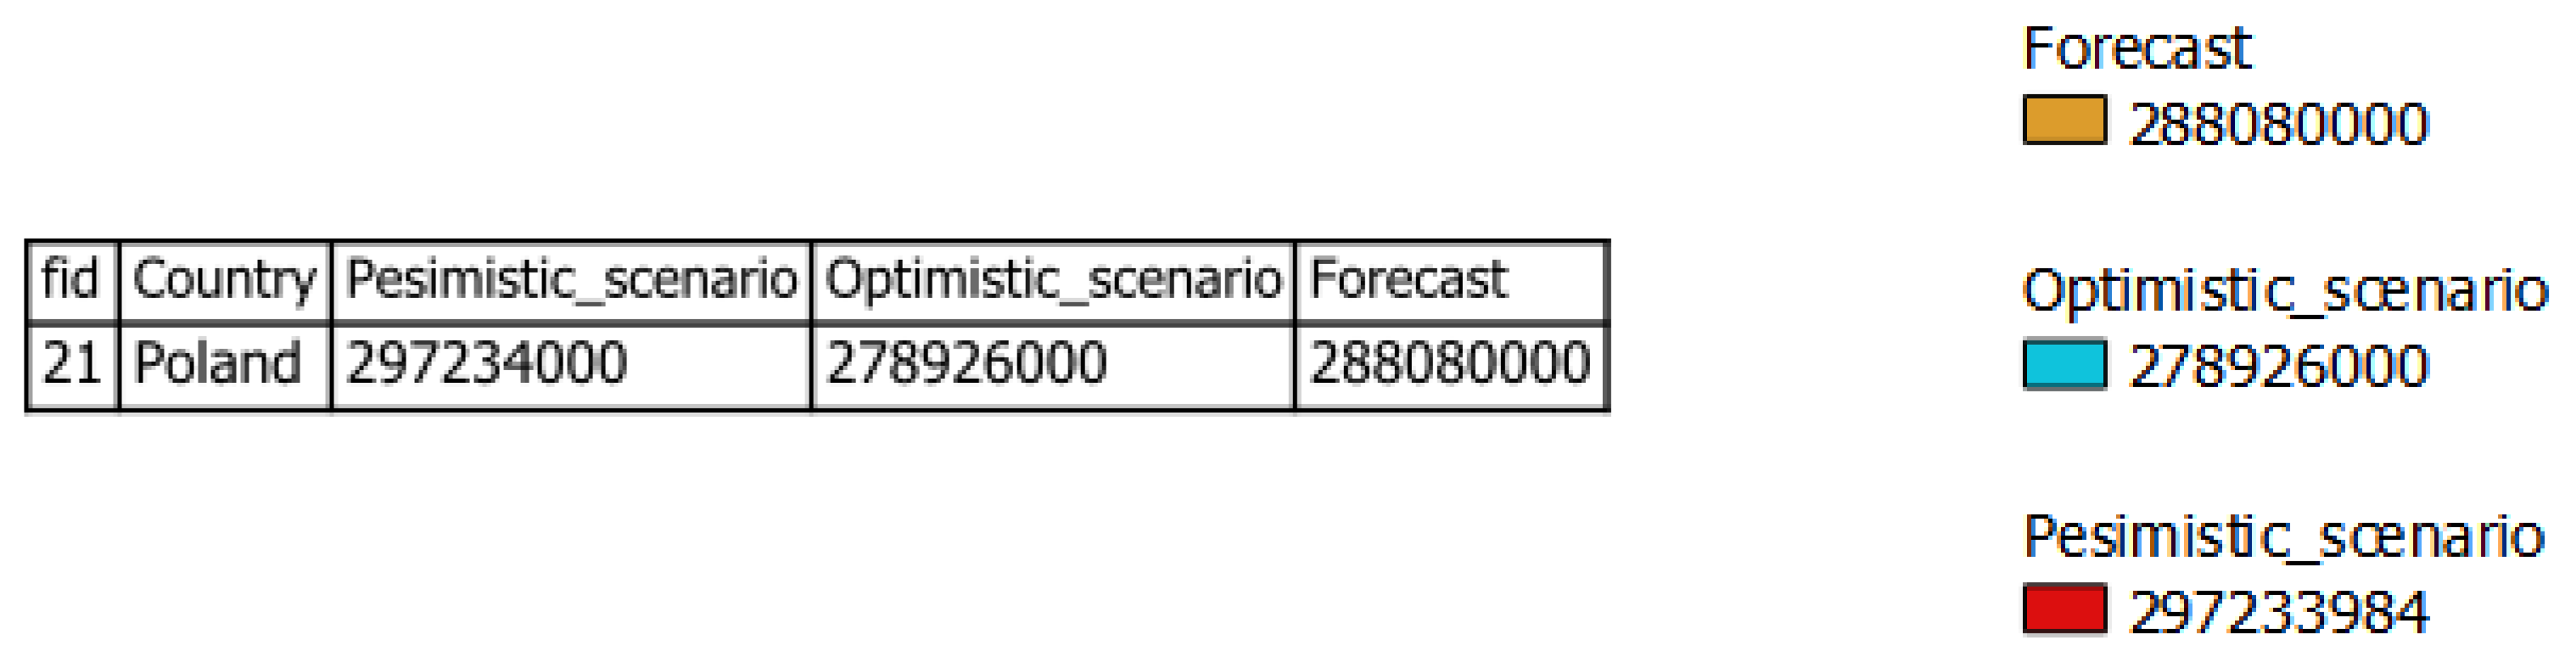
4. Results and Discussion

After analyzing the literature, research was conducted to verify the hypotheses. The first step was to create a vector map of the EU-27 countries. The basis for its implementation was obtained from the website [6]. Fields containing the values of selected indicators were added to the layer database. To analyze the components of the energy mixes of the member states, a set of Eurostat indicators from the Environment and Energy section was used. The following indicators were adopted:
  • Productivity (KGOE);
  • Import of solid fossil fuels (%);
  • Import of oil and petroleum products (excluding biofuel portion) (%);
  • Natural gas import (%);
  • Solid fossil fuel consumption (TJ);
  • Oil and petroleum product consumption (TJ);
  • Renewable and biofuel consumption (TJ);
  • Natural gas consumption (TJ);
  • Nuclear energy consumption (TJ);
  • Gross electricity production, solid fossil fuels (1000 toe);
  • Gross electricity production, natural gas (1000 toe);
  • Gross electricity production, oil and petroleum products (1000 toe);
  • Gross electricity production, renewables and biofuels (1000 toe);
  • CO2, CH4, N2O, SO2, CO, NOx, PM 2.5, PM10 emission.
The map is presented in Figure 3.
The composition of the energy mixes of the EU-27 countries was analyzed. Countries where coal has a significant share in the mix are Poland (44%), Estonia (57%), Bulgaria (37%), and the Czech Republic (36%). The countries whose energy industry is based on natural gas include, first of all, Italy (42%), Hungary (36%) and the Netherlands (38%). The largest share of RES in the mix occurs in Denmark (32%) and Sweden (22%). Nuclear energy is the basis of the energy sector in France (39%) and Sweden (36%). By contrast, most countries rely on crude oil. These are mainly Cyprus (95%), Luxembourg (75%), Belgium (55%), Croatia (50%), Greece (55%), Lithuania (57%), Latvia (56%), Portugal (53%), and Spain (50%). To present the composition of the mixes, pie chart diagrams were created, as shown in Figure 4.
To perform a dynamic analysis of the components of the energy mixes, an analogous diagram was prepared for the 2011 data (the first known observation), as shown in Figure 5. It should be noted that the changes that occurred in all countries concerned the decline in the share of coal in favor of RESs (the most desirable option), or alternatively natural gas and crude oil.
The conducted analysis made it possible to segment countries according to one criterion, i.e., the level of consumption of individual energy carriers. However, to be able to consider additional criteria during the segmentation, a cluster analysis was used. For this purpose, the k-means method and the attribute-based clustering algorithm were applied during the analysis. This made it possible to consider all the indicators listed in point 3. They were introduced into the model of many explanatory variables. Thus, when creating clusters, not geographic coordinates, but indicators proposed by Eurostat were taken into account. In order to determine the number of clusters, it was necessary in this method to use the Elbow method, because in the k-means method the number of clusters is not determined automatically. The results of using the Elbow method are shown in Figure 6. It was determined that, in the analyzed case, the optimal number of clusters is 10. This is the number of clusters where the sum of squared errors stops rapidly decreasing, and adding subsequent clusters does not bring much improvement.
The results of the cluster analysis are presented in Figure 7. Cluster no. 0 was the most numerous. The Czech Republic, Slovenia, Hungary, Romania, Bulgaria, Malta, and Greece were sorted into this group. Cluster no. 1 included Sweden, Finland, Portugal, Belgium, and Austria. They were placed in one group mainly due to similar levels of harmful substance emissions and the key share of RESs in electricity production (on average, at the level of 76%). The second cluster grouped Ireland and Luxembourg due to their very similar structure of energy resource consumption, where crude oil constitutes a minimum half of the mix (48% and 76%, respectively). The third group consisted of France, Italy, and Spain due to the similar structure of electricity production, energy import (over 90% solid fossil fuel, oil and natural gas import), and energy productivity (about 9 KGOE). Cluster number eight included Lithuania, Latvia, Estonia, and Slovakia, which are similar in terms of energy productivity (about 5 KGOE) and the structure of raw material import (over 100% of fossil fuels). The remaining clusters consisted of individual objects, the distinguishing features of which did not allow their incorporation into other clusters. Cluster number four was Cyprus, the energy mix of which is 95% based on crude oil. The fifth cluster was Germany, which managed to develop an almost proportional share of individual energy carriers in the mix. Cluster number six was Denmark, where emissions of harmful substances per capita (especially NOx, SO2) are the highest compared to the other EU-27 countries. The seventh cluster was the Netherlands, whose electricity production is based on natural gas with a low level of import for this raw material (25%). Cluster number nine, Poland, has the highest level of energy self-sufficiency resulting from access to domestic coal (mainly hard coal, but also lignite).
The activities carried out in the EU-27 countries aim to eliminate emissions from the energy sector. They should lead to the unification of mixes in the territory of the European Union. To verify this assumption, a cluster analysis was also performed for these indicators in 2011. The Elbow method showed that, in this case, seven clusters were determined (Figure 8). Thus, the number of clusters increased by three clusters. This means that each country implemented its own climate strategy, which means that the level of differentiation of the mixes of individual countries increased.
It should be noted that taking into account all 21 indicators and creating clusters on their basis did not clearly distinguish the group of countries whose energy systems are based on coal.
The main reason for the elimination of coal from the energy mixes of the member states is the negative impact of its combustion on the natural environment. Another stage of the research was carried out which allowed us to determine whether the largest source of greenhouse gas emissions in the EU-27 countries is coal-based energy. Therefore, the cluster analysis was performed again with analogous parameters; however, only the levels of pollutant emissions for individual EU-27 countries were introduced as variables in the model. To unify the emissions analyzed for individual countries, they were converted per capita. The results of the analysis are presented in Figure 9. The analysis showed that the countries where the energy industry is based on coal were classified into different clusters. This time, Poland joined cluster number eight along with Finland and Lithuania. These are countries where the energy mixes are not based on coal but on oil and gas. Bulgaria was placed in cluster number nine, the Czech Republic in cluster number zero, and Estonia in cluster number three.
Additionally, a column diagram of the individual gas emission levels in a given country was prepared (Figure 10). The graph enabled visual analysis to be carried out. To be able to present all gases in one graph, CO2 emissions are presented in Mg, while the remaining substances are presented in kg.
The conducted analysis showed that the emission of greenhouse gases was not the highest in the countries where the mix is based on coal. The highest level per emission was recorded in Denmark. The situation was similar in the case of Luxembourg and Ireland.
Therefore, the authors examined the main source of harmful emissions. Eighty percent of the world’s emissions are carbon dioxide. That is why this gas was selected for further analysis.
To illustrate the level of CO2 emissions and differences in individual member states, the trend surface analysis was used (Figure 11). The highest level of emissions per capita was characteristic for Denmark, Luxembourg, and Ireland. In each of these countries, crude oil forms the basis of the energy mix.
Therefore, the source of CO2 emissions in the countries with the highest levels of emissions per capita was verified. A bar chart was created that revealed that the source of the emissions was transport. The largest share was again observed in Denmark (69%), Luxembourg (63%), Ireland (48%), and Malta (88%). The results of the analysis are illustrated by a bar chart for the individual EU-27 countries (Figure 12). In Poland, the share of transport emissions is less than 10%. However, according to the Green Deal, these emissions should also be eliminated by 2050. However, as of today, no action has been taken to bring the country closer to this goal. On the contrary, the number of imported cars which were produced on average 12 years ago is increasing. Often, they are also diesel cars. In 2020, a record number of cars were imported to Poland, and this record was broken again in 2021, where imports increased by another 2.5% [43,44,45].
To build effective strategies for achieving the Green Deal goals within the clusters, it is necessary to analyze the time series of pollutant emissions. Because the Green Deal focuses mainly on CO2, a mathematical model for this greenhouse gas was built. The ARIMA prediction model (2,1,2) was used. The model was created for Poland as a country representing member states based on their energy mixes of coal. The model was selected from among several dozen created models. The selection was made on the basis of information criteria and a MAPE error of only 1.2%. The results of these indicators are presented in Table 1.
Empirical and forecast values are presented in Figure 13. Based on the model and the forecast, it can be concluded that the emission volume in Poland will decrease in the coming years. The forecast time series is characterized by a downward trend. Additionally, the series is subject to five-year cyclical fluctuations. In the case of using the ARIMA model, it is assumed that the forecast will be reliable if the trends shaping the factors influencing the amount of CO2 emissions are maintained. If these factors do not change significantly, then in 2024 the amount of emissions will decrease by about 3% compared to 2018.
However, to accelerate the rate of decline in CO2 emissions, numerous steps are being taken at global, EU, national, and local levels. There may also be factors that negatively affect carbon dioxide emissions. These are primarily economic recovery or, for example, unfavorable climatic conditions that make it impossible to use renewable energy. Due to the above, the authors additionally determined the confidence interval of the forecast. This is the range within which the projected emission volume can move with 95% probability. This enables the creation of three scenarios of CO2 emissions by 2024. These are the most likely (forecast), optimistic, and pessimistic scenarios. The difference in the level of emissions between the individual scenarios is 3% (Figure 14). It is also possible to make a forecast until 2050 (however, an increased prediction error should be considered). The results obtained should be compared with the guidelines of the climate policy and appropriate actions should be taken.

5. Discussion

The European Green Deal insists on removing coal from countries’ energy mixes. This applies primarily to countries where it is the basis of the energy sector. The aim of this action is to achieve climate neutrality by 2050 [46]. To ensure a smooth exit from coal, the European Commission established the Platform for Coal Regions in Transition [47]. Thus, the withdrawal from coal mining in most Western European countries is part of the EU climate and energy policy, which assumes achieving climate neutrality in the EU by 2050 [48,49,50]. Unfortunately, as the presented results of research conducted by the authors have shown, coal is often replaced with other fossil fuels, such as natural gas or crude oil. However, this does not bring the intended effects, as evidenced by the amount of emissions in countries whose energy mixes are based on sources other than coal. This also applies to natural gas, which for many years has been perceived as a fuel in the energy transformation process [51]. Natural gas combustion is, of course, characterized by about 50% lower CO2 emissions than coal or crude oil [25], but the growing demand for energy causes more and more fuel consumption, and thus higher greenhouse gas emissions. Therefore, according to the authors, the assumption that the level of greenhouse gas emissions will decrease with the elimination of coal is incorrect. Instead, the focus should be on the use of technologies that enable the clean combustion of hydrocarbons. This is also confirmed by the results of research that can be found in the literature [52,53]. However, the development of an action strategy tailored to specific countries and their energy mixes will be required.
In recent months, an additional factor has emerged that should be especially taken into account when shaping the future energy mixes of the EU member states. This is that energy security has been seriously threatened by the war in Ukraine and the related sanctions against the Russian Federation. According to the authors, it is necessary to redefine the priorities and promoted energy sources. As the authors have suggested in their previous publications [22,54], and as shown by recent events, basing the EU’s energy security on raw materials imported from politically unstable regions of the world is very risky. This applies not only to oil and gas imported from Russia, but also Arab countries. At present, the only 100% reliable source of fossil fuels for the EU should be domestic coal and gas resources located, for example, in Poland and Norway. Renewable energy sources should also be seen as a source of unwavering energy supply; however, there are several aspects that should be considered when planning the future of the EU. That is, the vast majority of RES technologies are produced outside of the European Union or are based on raw materials obtained outside its borders. These raw materials are mainly rare-earth elements. Therefore, in the event of further political conflicts, a situation may arise in which the EU will also be cut off from the technology ensuring access to renewable energy.
To eliminate the problem with energy security, technologies already developed can be used that:
  • Will eliminate the problem of greenhouse gas emissions, by trapping greenhouse gases before they are emitted to the atmosphere. These are mainly CCS and CCU technologies, but also the membrane techniques proposed by the authors [21,55,56];
  • Will enable the application of the circular economy model in the mining and energy industries. Membrane techniques make it possible to capture, for example, CO2 and CH4, and use them as valuable products, not a waste [57,58,59];
  • Will make it possible to process coal combustion, which is fly ash, and to extract the rare-earth elements necessary for the production of RES technology [60,61].
As mentioned above, only a properly designed strategy makes it possible to achieve the set goal effectively. The presented analyses and the conducted segmentation enable the development of joint detailed strategies for the implementation of the Green Deal for the countries included in the individual clusters. Within the given clusters, attention should be paid to the largest source of emissions, both in terms of the energy carrier and the sector of its consumption. This allows for the development of effective methods and ways to reduce emissions. Creating a strategy should be carried out in the following stages (Figure 15):
Steps 5 and 6 should be adjusted to a specific cluster. For example, for cluster no. 9 and cluster no. 0, a strategy that would include the following activities would be advisable:
  • The diversification of the components of the energy mix so that the share of each of them amounts to about 30%;
  • Increasing the share of renewable energy sources while expanding the potential for storing renewable energy;
  • Reducing emissions with the simultaneous implementation of technologies for capturing pollutants generated in the combustion process. This would make it possible to maintain coal in the energy mix structure of the EU countries. As a domestic fuel, coal is the basis for energy security, both in terms of the availability of the energy carrier and the maintenance of stable energy system operations;
  • The utilization of waste from the coal combustion process, including both gaseous and fly ash, which are valuable sources of rare-earth metals. Such solutions are in line with the assumptions of the circular economy;
  • At the same time, more emphasis should be placed on reducing emissions from transport. Currently, the countries of the “new union” and their energy systems may have problems catching up with countries that started implementing a greenhouse gas emissions reduction policy long before them. Therefore, intensive activities in the field of transport should start now, in order to plan activities in this area in advance;
  • It is also necessary to pay more attention to other pollutants, not only carbon dioxide. This applies primarily to methane, the negative impact of which on the natural environment is significantly harmful, as well as to pollutants that have a detrimental effect on the life and health of EU citizens. Among the analyzed, these are mainly NOx and dust.

6. Conclusions

The research presented in this publication shows that there is no evidence to suggest that a large share of carbon in the energy mix is the cause of increased greenhouse gas emissions. The assumption that the energy systems of EU countries are similar to each other has also not been confirmed. Currently, the EU-27 countries are following their own path towards the goals of the climate and energy policy, which has led to an even greater diversification of their energy systems.
In the authors opinion, the study of long-term relationships and the causality of greenhouse gas emissions should be extended in the future to the analysis of other variables. The scenarios created could be extended with the analysis of indicators used during the cluster analysis. Therefore, the conducted research could be supplemented with additional explanatory variables and, for example, the ARMAX model could be used, which would allow for this type of analysis.
The presented research makes it possible to propose managerial implications, the application of which will enable the effective implementation of the assumptions of the EU energy policy in all member states:
  • The energy and climate policy of the European Union requires taking very difficult and restrictive steps. Its objectives are correct, but detailed strategies must be developed for groups of countries similar to each other in terms of energy systems;
  • It is important to identify the main sources of emissions so that the actions taken are effective;
  • The measures taken should not negatively affect the energy security of the European Union and the comfort of citizens’ lives, and this will result from the rapid removal of fossil fuels from the energy mixes of the EU countries;
  • The European Union should place emphasis on the transformation of fossil fuel-based energy into an environmentally friendly industry operating in accordance with the guidelines of the circular economy.
Furthermore, in light of the situation in Ukraine and Russia, the methods of reaching and achieving climate goals should be verified. The energy security of the EU will soon be put to the test. To meet this challenge, it is necessary to turn to fossil fuels native to the EU. To reconcile the requirement of zero emissions with the stability of energy systems, the strategy proposed by the authors can be applied. This will allow for the combustion of fossil fuels while eliminating the emission of pollutants. Properly selected technology, such as CCU or membrane techniques, will ensure access to clean energy and will also enable the use of by-products of fossil fuel combustion (for example, REE) as a source of added value. The economic development of the EU should also be taken into account, which may also be slowed as a result of the imposed restrictions. Considering the negligible (9%) share of the EU in global greenhouse gas emissions, these sacrifices may not have the intended effects. On the other hand, the development and economy of the European Union will be overwhelmed by economies (such as China and the US) which will continue to thrive regardless of the level of greenhouse gas emissions.
The research conducted has focused mainly on climate goals, the integration of energy systems, and the reduction in pollutant emissions. The future direction of the research will be to extend the analysis to other goals of the Green Deal, such as sustainable and intelligent mobility or organic agriculture.

Author Contributions

Conceptualization A.R. (Aurelia Rybak), A.R. (Aleksandra Rybak), J.J. and S.D.K.; formal analysis A.R. (Aurelia Rybak); methodology A.R. (Aurelia Rybak); software A.R. (Aurelia Rybak) and A.R. (Aleksandra Rybak); writing—original draft preparation A.R. (Aurelia Rybak), A.R. (Aleksandra Rybak), J.J. and S.D.K.; supervision—A.R. (Aleksandra Rybak); investigation—A.R. (Aurelia Rybak) and A.R. (Aleksandra Rybak); validation—A.R. (Aurelia Rybak), A.R. (Aleksandra Rybak) and J.J.; visualization—A.R. (Aurelia Rybak) and A.R. (Aleksandra Rybak); funding acquisition—A.R. (Aleksandra Rybak) and J.J. All authors have read and agreed to the published version of the manuscript.

Funding

The research leading to these results has received funding from the Norway Grants 2014-2021 via the National Centre for Research and Development. Grant number NOR/SGS/MOHMARER/0284/2020-00.

Institutional Review Board Statement

Not applicable.

Informed Consent Statement

Not applicable.

Data Availability Statement

The data presented in this study are available on request from the corresponding author.

Conflicts of Interest

The authors declare no conflict of interest. The funder had no role in the design of the study; in the collection, analyses, or interpretation of data; in the writing of the manuscript, or in the decision to publish the results.

References

  1. The European Green Deal COM/2019/640. Communication from the Commission to the European Parliament, the European Council, the Council, the European Economic and Social Committee and the Committee of the Regions. Available online: https://eur-lex.europa.eu/legal-content/EN/TXT/uriCOM3A20193A6403AFIN(COM(2019)640 (accessed on 10 November 2021).
  2. Strategia Ramowa na Rzecz Stabilnej unii Energetycznej Opartej na Przyszłościowej Polityce w Dziedzinie Klimatu. Available online: https://eur-lex.europa.eu/resource.html?uri=cellar:1bd46c90-bdd4-11e4-bbe1-01aa75ed71a1.0007.02/DOC_1&format=PDF (accessed on 12 December 2021).
  3. Eur-Lex. Available online: https://www.europarl.europa.eu/ReData/etudes/STUD/2018/626092/IPOL_STU(2018)626092_EN.pdf (accessed on 12 December 2021).
  4. EU Science Hub. Available online: https://ec.europa.eu/jrc/en/news/global-co2-emissions-continue-rise-eu-bucks-global-trend (accessed on 20 December 2021).
  5. The World Data. Available online: https://data.worldbank.org/indicator/AG.LND.FRST.ZS (accessed on 20 December 2021).
  6. Eurostat. 2020. Available online: https://ec.europa.eu/eurostat/data/database (accessed on 7 October 2021).
  7. Mac Kinnon, M.A.; Brouwer, J.; Samuelsen, S. The Role of Natural Gas and its Infrastructure in Mitigating Greenhouse Gas Emissions, Improving Regional Air Quality, and Renewable Resource Integration. Prog. Energy Combust. Sci. 2018, 64, 62–92. [Google Scholar] [CrossRef]
  8. Kittner, N.; Fadadu, R.P.; Buckley, H.L.; Schwarzman, M.R.; Kammen, D.M. Trace Metal Content of Coal Exacerbates Air-Pollution-Related Health Risks: The Case of Lignite Coal in Kosovo. Environ. Sci. Technol. 2018, 52, 2359–2367. [Google Scholar] [CrossRef] [Green Version]
  9. IPCC. Climate Change-Response Strategies. IPCC, 1990. Available online: https://www.ipcc.ch/sie/assets/uploads/2018/03/ipcc_far_wg_III_full_report.pdf (accessed on 30 July 2019).
  10. European Commission. European Community Gas Supply And Prospects-COM(95) 478 Final. 1995. Available online: http://aei.pitt.edu/4999/1/4999.pdf (accessed on 1 August 2019).
  11. Flavin, C.; Lenssen, N. Power Surge: Guide to the Coming Energy Revolution; No. 333.79 F589; W. W. Norton & Company: New York, NY, USA, 1994. [Google Scholar]
  12. 2030 Climate Target Plan. Available online: https://ec.europa.eu/clima/eu-action/european-green-deal/2030-climate-target-plan_en (accessed on 1 June 2022).
  13. European Climate Pact. Available online: https://europa.eu/climate-pact/index_en (accessed on 1 June 2022).
  14. European Climate Law. Available online: https://ec.europa.eu/clima/eu-action/european-green-deal/european-climate-law_en (accessed on 4 June 2022).
  15. Rogelj, J.; Popp, A.; Calvin, K.V.; Luderer, G.; Emmerling, J.; Gernaat, D.; Fujimori, S.; Strefler, J.; Hasegawa, T.; Marangoni, G.; et al. Scenarios towards limiting global mean temperature increase below 1.5 °C. Nat. Clim. Chang. 2018, 8, 325–332. [Google Scholar] [CrossRef]
  16. Adoption of the Paris AgreementFCCC/CP/2015/L.9/Rev.1 (UNFCCC, 2015). Available online: https://unfccc.int/resource/docs/2015/cop21/eng/l09r01.pdf (accessed on 4 June 2022).
  17. Cao, L.; Caldeira, K. Atmospheric carbon dioxide removal: Long-term consequences and commitment. Environ. Res. Lett. 2010, 5, 24011. [Google Scholar] [CrossRef]
  18. Tokarska, K.; Zickfeld, K. The effectiveness of net negative carbon dioxide emissions in reversing anthropogenic climate change. Environ. Res. Lett. 2015, 10, 94013. [Google Scholar] [CrossRef] [Green Version]
  19. Zickfeld, K.; Azevedo, D.; Mathesius, S.; Matthews, H.D. Asymmetry in the climate–carbon cycle response to positive and negative CO2 emissions. Nat. Clim. Chang. 2021, 11, 613–617. [Google Scholar] [CrossRef]
  20. Roddy, D.J.; Younger, P.L. Underground coal gasification with CCS: A pathway to decarbonising industry. Energy Environ. Sci. 2010, 3, 400–407. [Google Scholar] [CrossRef]
  21. Sarfraz, M.; Ba-Shammakh, M. Water-stable ZIF-300/Ultrason® mixed-matrix membranes for selective CO2 capture from humid postcombustion flue gas. Chin. J. Chem. Eng. 2018, 26, 1012. [Google Scholar] [CrossRef]
  22. Rybak, A.; Rybak, A. Methods of Ensuring Energy Security with the Use of Hard Coal—The Case of Poland. Energies 2021, 14, 5609. [Google Scholar] [CrossRef]
  23. Burke, A.; Fishel, S. A coal elimination treaty 2030: Fast tracking climate change mitigation, global health and security. Earth Syst. Gov. 2020, 3, 1–9. [Google Scholar] [CrossRef]
  24. Twitter. Available online: https://twitter.com/RCB_RP/status/1466355518033780738 (accessed on 11 December 2021).
  25. Rybak, A. Rola I PrzyszłOść Węgla W Zapewnieniu Bezpieczeństwa Energetycznego Polski; Monografia 865, Wydawnictwo Politechniki Śląskiej: Gliwice, Poland, 2020. [Google Scholar]
  26. McQueen, J. Some Methods for Classification and Analysis of Multivariate Observations. In Proceedings of the Fifth Berkeley Symposium on Mathematical Statistics and Probability; U of California Press: Berkeley, CA, USA, 1967; Volume 1, pp. 281–297. [Google Scholar]
  27. Syakur, M.A.; Khotimah, B.K.; Rochman, E.M.S.; Satoto, B.D. Integration K-means clustering method and Elbow method for identification of the best customer profile cluster. IOP Conf. Ser. Mater. Sci. Eng. 2018, 335, 012017. [Google Scholar] [CrossRef] [Green Version]
  28. Thorndike, R.L. Who belongs in the family? Psychometrika 1953, 18, 267–276. [Google Scholar] [CrossRef]
  29. Nainggolan, R.; Perangin-angin, R.; Simarmata, E.; Tarigan, A. Improved the performance of the K-means cluster using the sum of squared error (SSE) optimized by using the Elbow method. J. Phys. Conf. Ser. 2019, 1361, 012015. [Google Scholar] [CrossRef]
  30. Yun, H.J.; Kang, D.J.; Kim, D.-K.; Kang, Y. A GIS-Assisted Assessment and Attribute-Based Clustering of Forest Wetland Utility in South Korea. Sustainability 2019, 11, 4632. [Google Scholar] [CrossRef] [Green Version]
  31. Bluszcz, A. European economies in terms of energy dependence. Qual Quant. 2017, 51, 1531–1548. [Google Scholar] [CrossRef] [PubMed] [Green Version]
  32. Le Roux, B.; Rouanet, H. Geometric Data Analysis: From Correspondence Analysis to Structured Data Analysis; Kluwer: Dordrecht, The Netherlands, 2004; p. xi + 475. [Google Scholar]
  33. Kufel, T. Ekonometria. Rozwiązywanie Problemów Z Wykorzystaniem Programu Gretl; PWN Warszawa: Warsaw, Poland, 2004. [Google Scholar]
  34. Kot, S.; Jakubowski, J.; Sokołowski, A. Statystyka; Difin: Warsaw, Poland, 2007. [Google Scholar]
  35. Piłatowska, M. Kryteria informacyjne w wyborze modelu ekonometrycznego. Studia I Pr. Uniw. Ekon. W Krakowie 2010, 140, 25–37. [Google Scholar]
  36. Almorox, J.; Benito, M.; Hontoria, C. Estimation of monthly Angström–Prescott equation coefficients from measured daily data in Toledo, Spain. Renew. Energy 2005, 30, 931–936. [Google Scholar] [CrossRef]
  37. Said, S.; Zeroual, A. Prediction of global daily solar radiation using higher order statistics. Renew. Energy 2002, 27, 647–666. [Google Scholar] [CrossRef]
  38. Bliemel, F. Theil’s Forecast Accuracy Coefficient: A Clarification. J. Mark. Res. 1973, 10, 444–446. [Google Scholar] [CrossRef]
  39. Farnum, N.R.; Stanton, W. Quantitative Forecasting Methods; PWS-Kent Publishing Company: Boston, MA, USA, 1989. [Google Scholar]
  40. Watson, G.S. Trend-surface analysis. Math. Geol. 1971, 3, 215–226. [Google Scholar] [CrossRef]
  41. Li, J.; Heap, A.D. Spatial interpolation methods applied in the environmental sciences: A review. Environ. Model. Softw. 2014, 53, 173–189. [Google Scholar] [CrossRef]
  42. Sen, Z. Spatial Modeling Principles in Eearth Sciences; Springer: New York, NY, USA, 2009. [Google Scholar]
  43. Instytut Badań Rynku Motoryzacyjnego. Available online: https://www.samar.pl/ (accessed on 7 December 2021).
  44. Xu, B.; Lin, B. Reducing carbon dioxide emissions in China’s manufacturing industry: A dynamic vector autoregression approach. J. Clean. Prod. 2016, 131, 594–606. [Google Scholar] [CrossRef]
  45. Bebkiewicz, K.; Chłopek, Z.; Lasocki, J.; Szczepański, K.; Zimakowska-Laskowska, M. Analysis of Emission of Greenhouse Gases from Road Transport in Poland between 1990 and 2017. Atmosphere 2020, 11, 387. [Google Scholar] [CrossRef] [Green Version]
  46. Claeys, G.; Tagliapietra, S.; Zachmann, G. How to Make the European Green Deal Work; Bruegel: Brussels, Belgium, 2019. [Google Scholar]
  47. European Commission—Press Release: No region Left Behind: Launch of the Platform for Coal Regions in Transition. Strasbourg. 11 December 2017. Available online: https://ec.europa.eu/commission/presscorner/detail/en/IP_17_5165 (accessed on 2 July 2021).
  48. Tomaszewski, K. The Polish road to the new European Green Deal—Challenges and threats to the national energy policy. Polityka Energetyczna Energy Policy J. 2020, 23, 5–18. [Google Scholar] [CrossRef]
  49. Frejowski, A.; Bondaruk, J.; Duda, A. Challenges and Opportunities for End-of-Life Coal Mine Sites: Black-to-Green Energy Approach. Energies 2021, 14, 1385. [Google Scholar] [CrossRef]
  50. Apostu, I.M.; Lazar, M.; Faur, F. Implications of coal disappearance from the energy mix in Romania. In Proceedings of the MATEC Web of Conferences 2022, Sesam 2021, Petrosani, Romania, 18 October 2021; p. 354. [Google Scholar]
  51. Safari, A.; Das, N.; Langhelle, O.; Roy, J.; Assadi, M. Natural gas: A transition fuel for sustainable energy system transformation? Energy Sci. Eng. 2019, 7, 1075–1094. [Google Scholar] [CrossRef]
  52. Kavouridis, K.; Koukouzas, N. Coal and sustainable energy supply challenges and barriers. Energy Policy 2008, 36, 693–703. [Google Scholar] [CrossRef]
  53. Bugge, J.; Kjær, S.; Blum, R. High-efficiency coal-fired power plants development and perspectives. Energy 2006, 31, 1437–1445. [Google Scholar] [CrossRef]
  54. Rybak, A.; Manowska, A. The future of crude oil and hard coal in the aspect of Poland’s energy security. Energy Policy J. 2018, 21, 141–154. [Google Scholar] [CrossRef]
  55. Bryan, N.; Lasseuguette, E.; van Dalen, M.; Permogorov, N.; Amieiro, A.; Brandani, S.; Ferrari, M.C. Development of mixed matrix membranes containing zeolites for post-combustion carbon capture. Energy Procedia 2014, 63, 160–166. [Google Scholar] [CrossRef] [Green Version]
  56. Sridhar, S.; Smith, B.; Ramakrishna, M.; Aminabhavi, T.M. Modified poly(phenylene oxide) membranes for the separation of carbon dioxide from methane. J. Membrane Sci. 2006, 280, 202–209. [Google Scholar] [CrossRef]
  57. Kokkoli, A.; Zhan, Y.; Angelidaki, I. Microbial electrochemical separation of CO2 for biogas upgrading. Bioresour. Technol. 2018, 247, 380–386. [Google Scholar] [CrossRef] [Green Version]
  58. Xiang, L.; Pan, Y.; Jiang, J.; Chen, Y.; Chen, J.; Zhang, L.; Wang, C. Thin poly(ether-block-amide)/attapulgite composite membranes with improved CO2 permeance and selectivity for CO2/N2 and CO2/CH4. Chem. Eng. Sci. 2017, 160, 236–244. [Google Scholar] [CrossRef]
  59. Rybak, A.; Joostberens, J.; Manowska, A.; Pielot, J. The Impact of Environmental Taxes on the Level of Greenhouse Gas Emissions in Poland and Sweden. Energies 2022, 15, 4465. [Google Scholar] [CrossRef]
  60. Kolker, A.; Scott, C.; Hower, J.C.; Vazquez, J.A.; Lopano, C.L.; Dai, S. Distribution of rare earth elements in coal combustion fly ash, determined by SHRIMP-RG ion microprobe. Int. J. Coal Geol. 2017, 184, 1–10. [Google Scholar] [CrossRef]
  61. Lin, R.; Howard, B.H.; Roth, E.A.; Bank, T.L.; Granite, E.J.; Soong, Y. Enrichment of rare earth elements from coal and coal by-products by physical separations. Fuel 2017, 200, 506–520. [Google Scholar] [CrossRef] [Green Version]
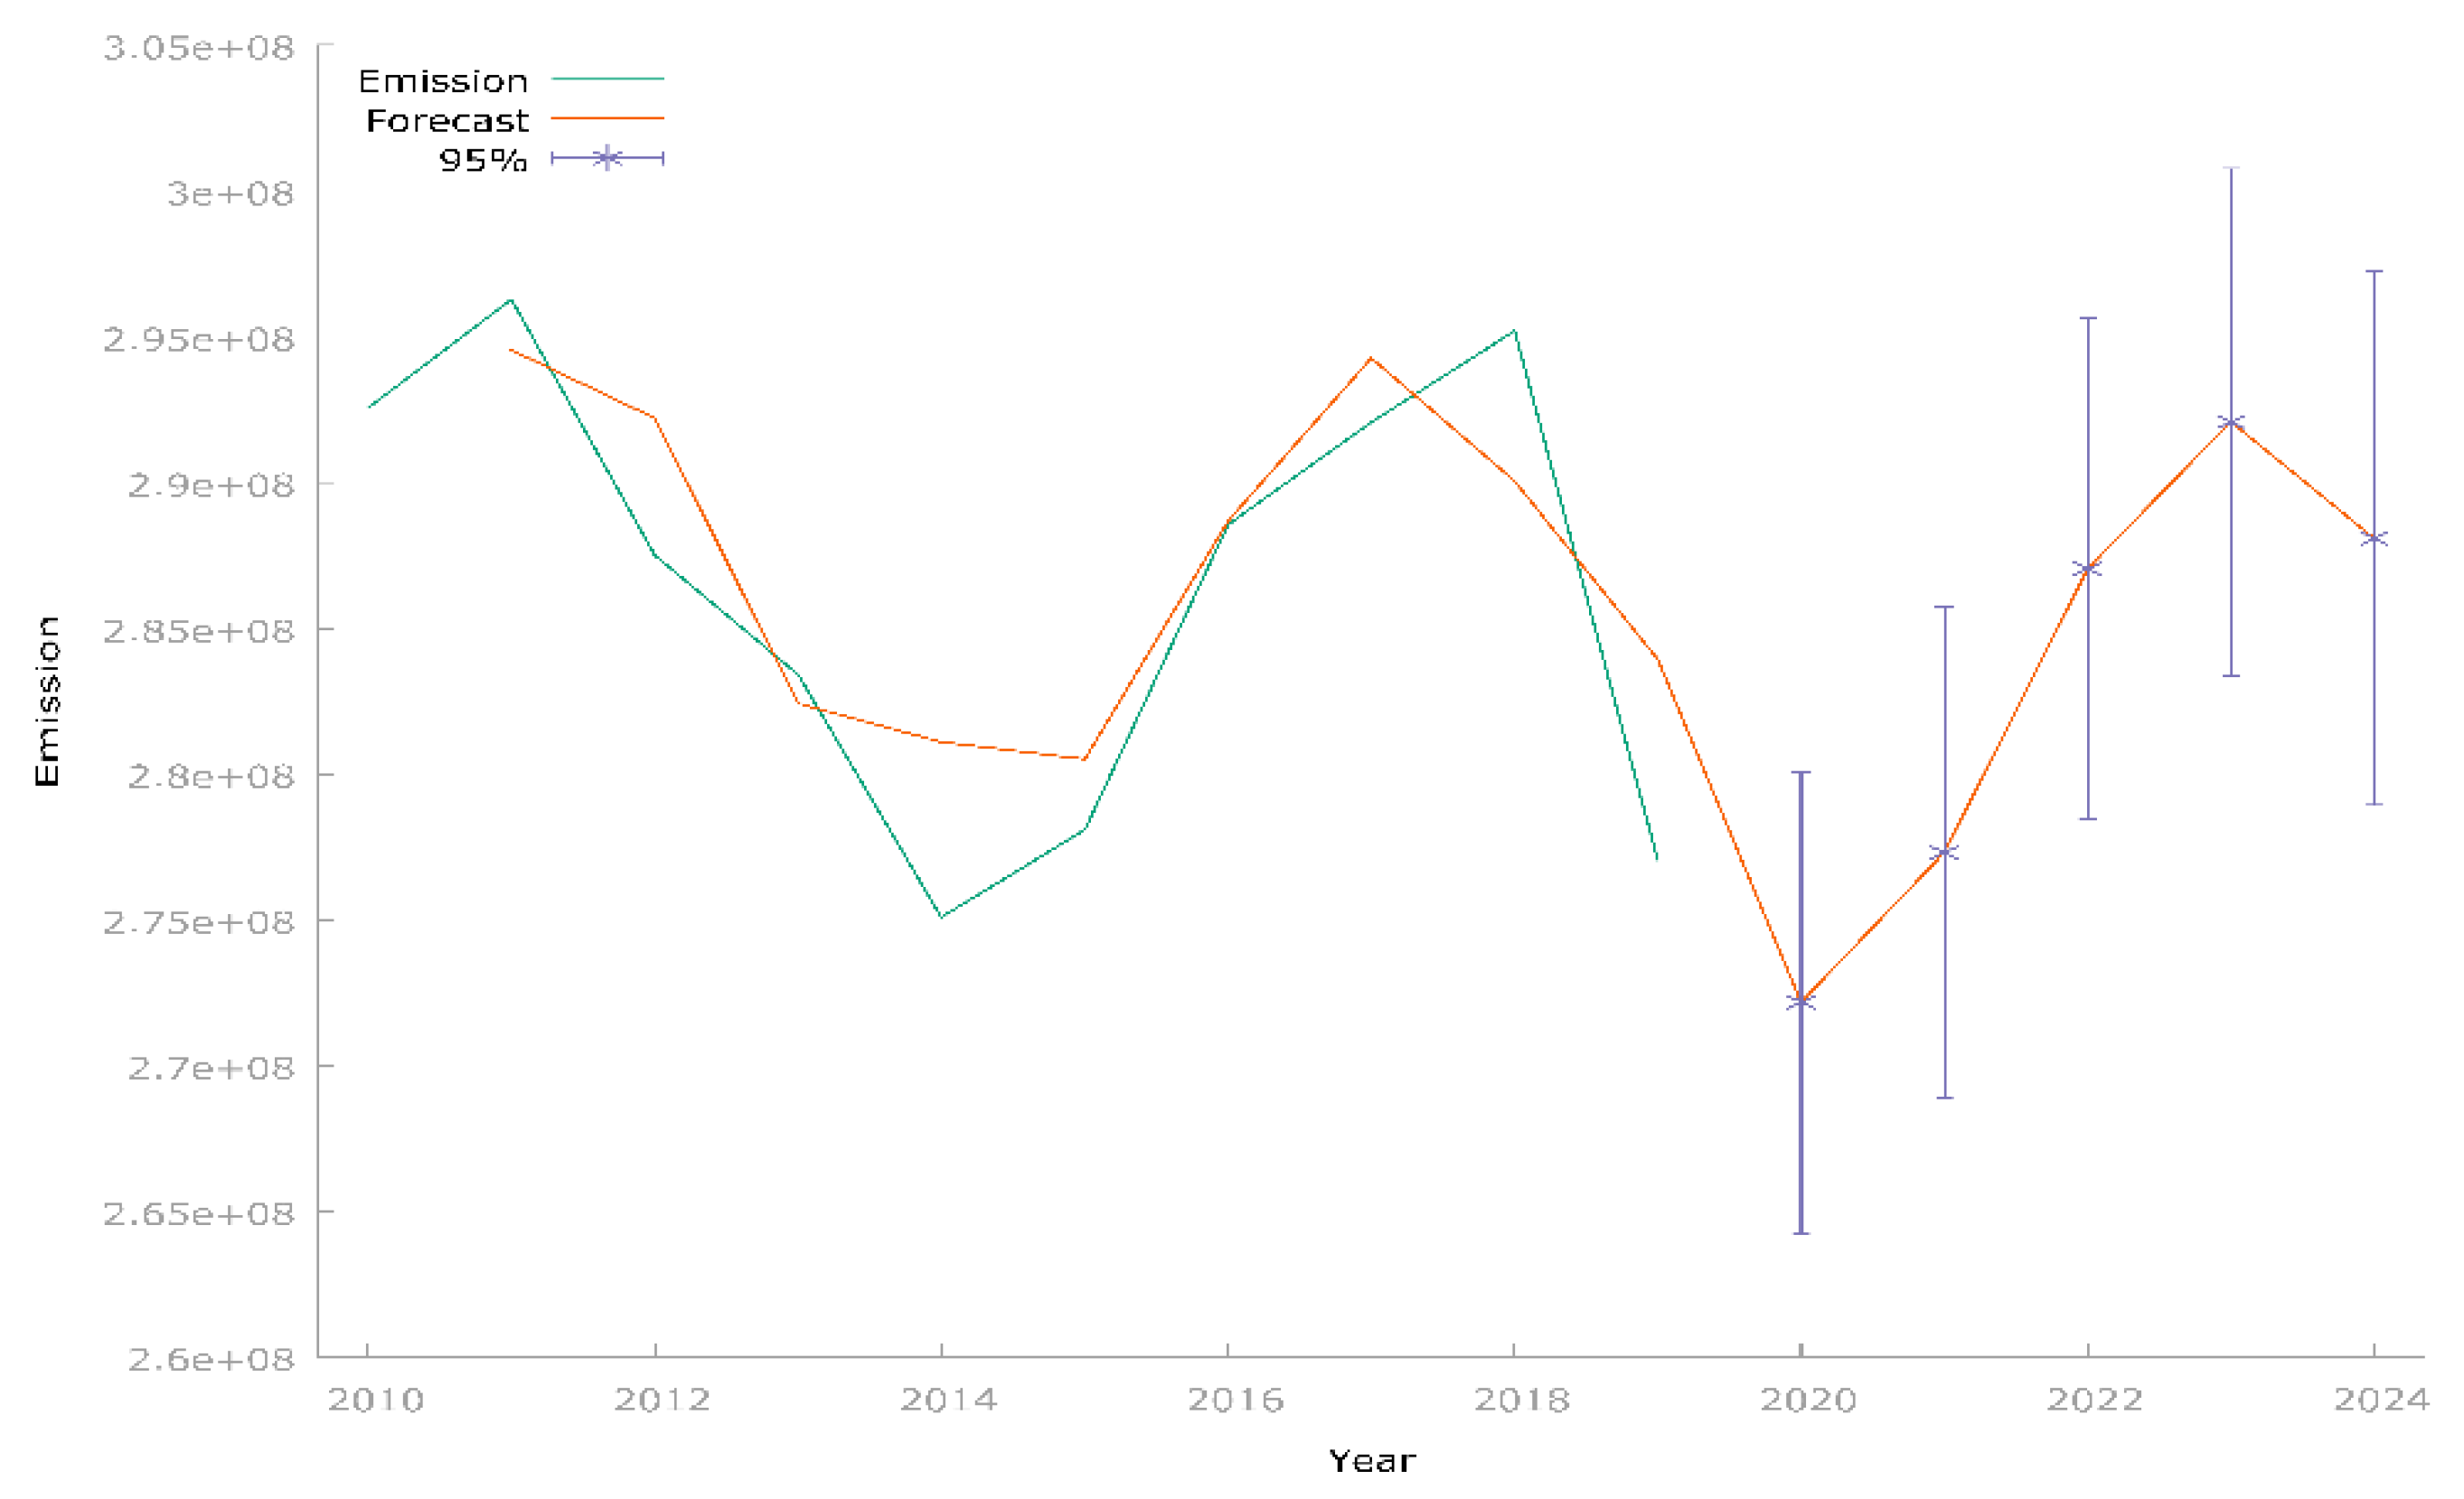
Figure 1. The level of afforestation in the EU-27 in 2020 (%). Source: own elaboration based on statistical data from [6].
Energies 15 05082 g001
Figure 2. Methodology of the presented research. Source: own elaboration.
Energies 15 05082 g002
Figure 3. Map of the EU-27 member states. Source: own elaboration based on statistical data from [6].
Energies 15 05082 g003
Figure 4. Composition of the EU-27 countries’ energy mixes in 2019. Source: own elaboration based on statistical data from [6].
Energies 15 05082 g004
Figure 5. Composition of the energy mixes of the EU-27 countries in 2011. Source: own elaboration based on statistical data from [6].
Energies 15 05082 g005
Figure 6. The results of the Elbow method analysis. Source: own elaboration.
Energies 15 05082 g006
Figure 7. The results of the cluster analysis for 2019. Source: own elaboration based on statistical data from [6].
Energies 15 05082 g007
Figure 8. The results of the cluster analysis for 2011. Source: own elaboration based on statistical data from [6].
Energies 15 05082 g008
Figure 9. Cluster analysis for pollutant emissions in 2019. Source: own elaboration based on statistical data from [6].
Energies 15 05082 g009
Figure 10. Diagram of pollutant emissions per capita in 2019. Source: own elaboration based on statistical data from [6].
Energies 15 05082 g010
Figure 11. TSA model of CO2 emissions in EU-27 countries in 2019. Source: own elaboration based on statistical data from [6].
Energies 15 05082 g011
Figure 12. Percentage of CO2 emissions from transport in EU-27 countries. Source: own elaboration based on statistical data from [6].
Energies 15 05082 g012
Figure 13. CO2 emissions with a forecast until 2024. Source: own elaboration.
Energies 15 05082 g013
Figure 14. Emission scenarios in 2024. Source: own elaboration based on statistical data from [6].
Energies 15 05082 g014aEnergies 15 05082 g014b
Figure 15. Scheme for creating a Green Deal strategy for clusters. Source: own elaboration.
Energies 15 05082 g015
Table 1. Information criteria and ARIMA (2,1,2) model errors.
IndexIndex Value
Akaike information criterion (AIC)316
Bayesian information criterion (BIC)–Hannan317
Quinn information criterion (HQ)316
RMSE4.03 × 106
MAPE, %1.2
Publisher’s Note: MDPI stays neutral with regard to jurisdictional claims in published maps and institutional affiliations.

