Article

Optimal Planning of Electric Vehicle Charging Stations Considering User Satisfaction and Charging Convenience

1
School of Information Science and Electrical Engineering, Shandong Jiaotong University, Jinan 250357, China
2
School of Control Science and Engineering, Shandong University, Jinan 250061, China
3
State Key Laboratory of Automotive Simulation and Control, Jilin University, Changchun 130022, China
*
Authors to whom correspondence should be addressed.
Energies 2022, 15(14), 5027; https://doi.org/10.3390/en15145027
Submission received: 20 June 2022 / Revised: 7 July 2022 / Accepted: 8 July 2022 / Published: 9 July 2022
(This article belongs to the Special Issue Modeling and Optimization Control of Power Battery)

Abstract

:
To solve the problem of layout design of charging stations in the early stage of the electric vehicle industry, the user’s satisfaction and the charging convenience are considered. An electric vehicle charging station site-selection model is established based on the kernel density analysis of the urban population. The goal of this model is maximum electric vehicle user satisfaction and the highest charging convenience. Then, according to model characteristics, the immune algorithm is designed and optimized to solve the model. The optimization of the immune algorithm includes two aspects. On the one aspect, judging that the stop condition is added in the mutation link. On the other aspect, two mutation operators are designed in the optimized immune algorithm. Finally, the simulation example is determined by a three-step method in Jinan City. The results show that the electric vehicle charging station site-selection model in this paper can better meet user needs compared with traditional models. Compared with the traditional immune algorithm, the convergence speed of the optimized immune algorithm is improved, and the proposed algorithm is superior to the traditional immune algorithm in terms of stability and accuracy.

1. Introduction

As of 2022, the number of electric vehicles is 8.915 million, and the ratio of electric vehicles to their charging infrastructure is around 7:1 in the early stage of the electric vehicle industry in China. At present, the lack of electric vehicle charging infrastructure and the unreasonable layout are the main factors restricting the development of the electric vehicle industry [1,2].
Researchers have carried out relevant research on the layout of electric vehicle charging stations. A Bayesian network model was proposed based on economic, environmental and social factors, and the established model was verified through sensitivity analysis in [3]. In addition, in literature [4], based on economic, environmental and social factors, the multicriteria decision-making method (MCDM) was used to evaluate the location-selection criteria of charging stations, and the fuzzy TOPSIS method was used to determine the location-selection scheme of electric vehicle charging stations. Ren et al. evaluated land cost, construction cost, road traffic flow, power grid conditions and the surrounding environment to establish an electric vehicle location model that minimized the total social cost, and the model was solved by a genetic algorithm [5]. Wu et al. comprehensively considered economic factors, social factors, environmental factors and the characteristics of residential quarters to establish an index evaluation system for the location of electric vehicle charging stations in residential areas, and used the fuzzy VIKOR method to rank the charging stations [6]. A mixed-integer programming model was proposed to maximize the number of users charging at the charging station in [7], and a mixed genetic algorithm was used to solve the model. A total social cost model was constructed based on economic cost and environmental cost in [8], and a genetic algorithm was used to solve the total social cost mode. The above literature mainly determines the location plan from the perspective of economic, environmental and social factors, ignoring the impact of users.
In the early stage of the electric vehicle industry, the impact of users is important. From the user’s point of view, Jia Yongji et al. determines the location plan considering user satisfaction [9]. However, the charging convenience of the charging station is ignored.
In response to the problems, this paper considers the user satisfaction of electric vehicles and the charging convenience of charging stations from the user’s point of view. The goal of the electric vehicle charging station site-selection model is maximum electric vehicle user satisfaction and the highest charging convenience.
Location theory is divided into location theory based on point and location theory based on path demand [10,11]. Location theory based on point mainly includes the p-median problem [12,13], p-center problem [14,15] and coverage problem [16,17]. Some site-selection problems such as the minimum cost of station construction [18,19], the maximization of revenue [20,21], the location based on the user’s position [22,23] and the location under uncertainty [24,25] also belong to this theoretical scope. Fitting the demand of demand points is an important link in the point location theory. The main fitting method in the above literature is the empirical method or demand-point data set. This method is inconvenient in urban simulations with too many demand points or no demand-point data sets. In response to the problems, demand is fitted through nuclear density analysis.
The artificial immune algorithm is a swarm intelligence search algorithm with the iterative process of generation and detection. It is widely used in many fields such as vehicle scheduling, machine learning, image processing and facility location selection [26].
An immune algorithm was used to solve the problem of site selection for urban medical-waste-disposal sites based on the actual situation of the new crown pneumonia epidemic and the guidelines for environmental impact assessment in [27]. Li et al. used an immune genetic algorithm to solve the traditional capacity-limited factory location problem [28]. The immune algorithm has problems such as slow convergence speed and low calculation accuracy. In order to improve the performance of the immune algorithm, the algorithm is optimized to different degrees. Ali et al. proposed a hybrid optimization method based on the immune algorithm and local search algorithm of mountain climbing, which solved the multiobjective I-beam and machine tool optimization problems and improved the convergence of the algorithm [29]. An improved immune algorithm based on extracting immune vaccines and injecting vaccines was proposed in [30]. The algorithm was used to solve the TSP problem, and it was verified that the algorithm has a faster convergence speed. Meng et al. combined the artificial immune algorithm and chaotic optimization algorithm, which improved the convergence speed and global search ability of the algorithm and provided ideas for economic load distribution of complex power systems [31]. An improved immune algorithm based on solution-space directional optimization was proposed in [32]. This algorithm can greatly reduce the search space of the objective function and was used to solve the problem of finding the minimum value of multimodal functions. The simulation result indicated that the algorithm has better real-time performance. The above literature mainly considers improving a certain performance of the immune algorithm, ignoring the improvement of the overall performance. To improve the overall performance, the improvement of the artificial immune algorithm in [33] included two aspects. One was mutation adaptation, and the other was computing affinity functions using vector distances with threshold limits. The improved immune algorithm solved the location problem of logistics distribution. The simulation results showed that the convergence speed and calculation accuracy of the improved immune algorithm was significantly improved. The artificial immune algorithm in three aspects was improved, including initial population generation, population update and crossover mutation [34]. The improved immune algorithm solved the problem of regional comprehensive energy station layout and location. The simulation results showed that the improved algorithm had higher convergence speed and calculation accuracy. However, the stability of the immune algorithm is not considered in [33,34]. The immune algorithm has problems of slow convergence, low accuracy and poor stability. In order to solve this problem, the traditional immune algorithm is optimized in two aspects referring to the above literature methods: On the one aspect, judging that the stop condition is added in the mutation link; on the other aspect, two mutation operators are designed in the optimized immune algorithm.
There are three innovations in this paper. First, the location model of the electric vehicle charging station based on the user’s position is improved by establishing the highest charging convention goal. Second, it provides a method for fitting demand in location theory based on point through Aernel density analysis. Finally, the mutation link of immune algorithm is optimized to solve problems of slow convergence, low accuracy and poor stability.

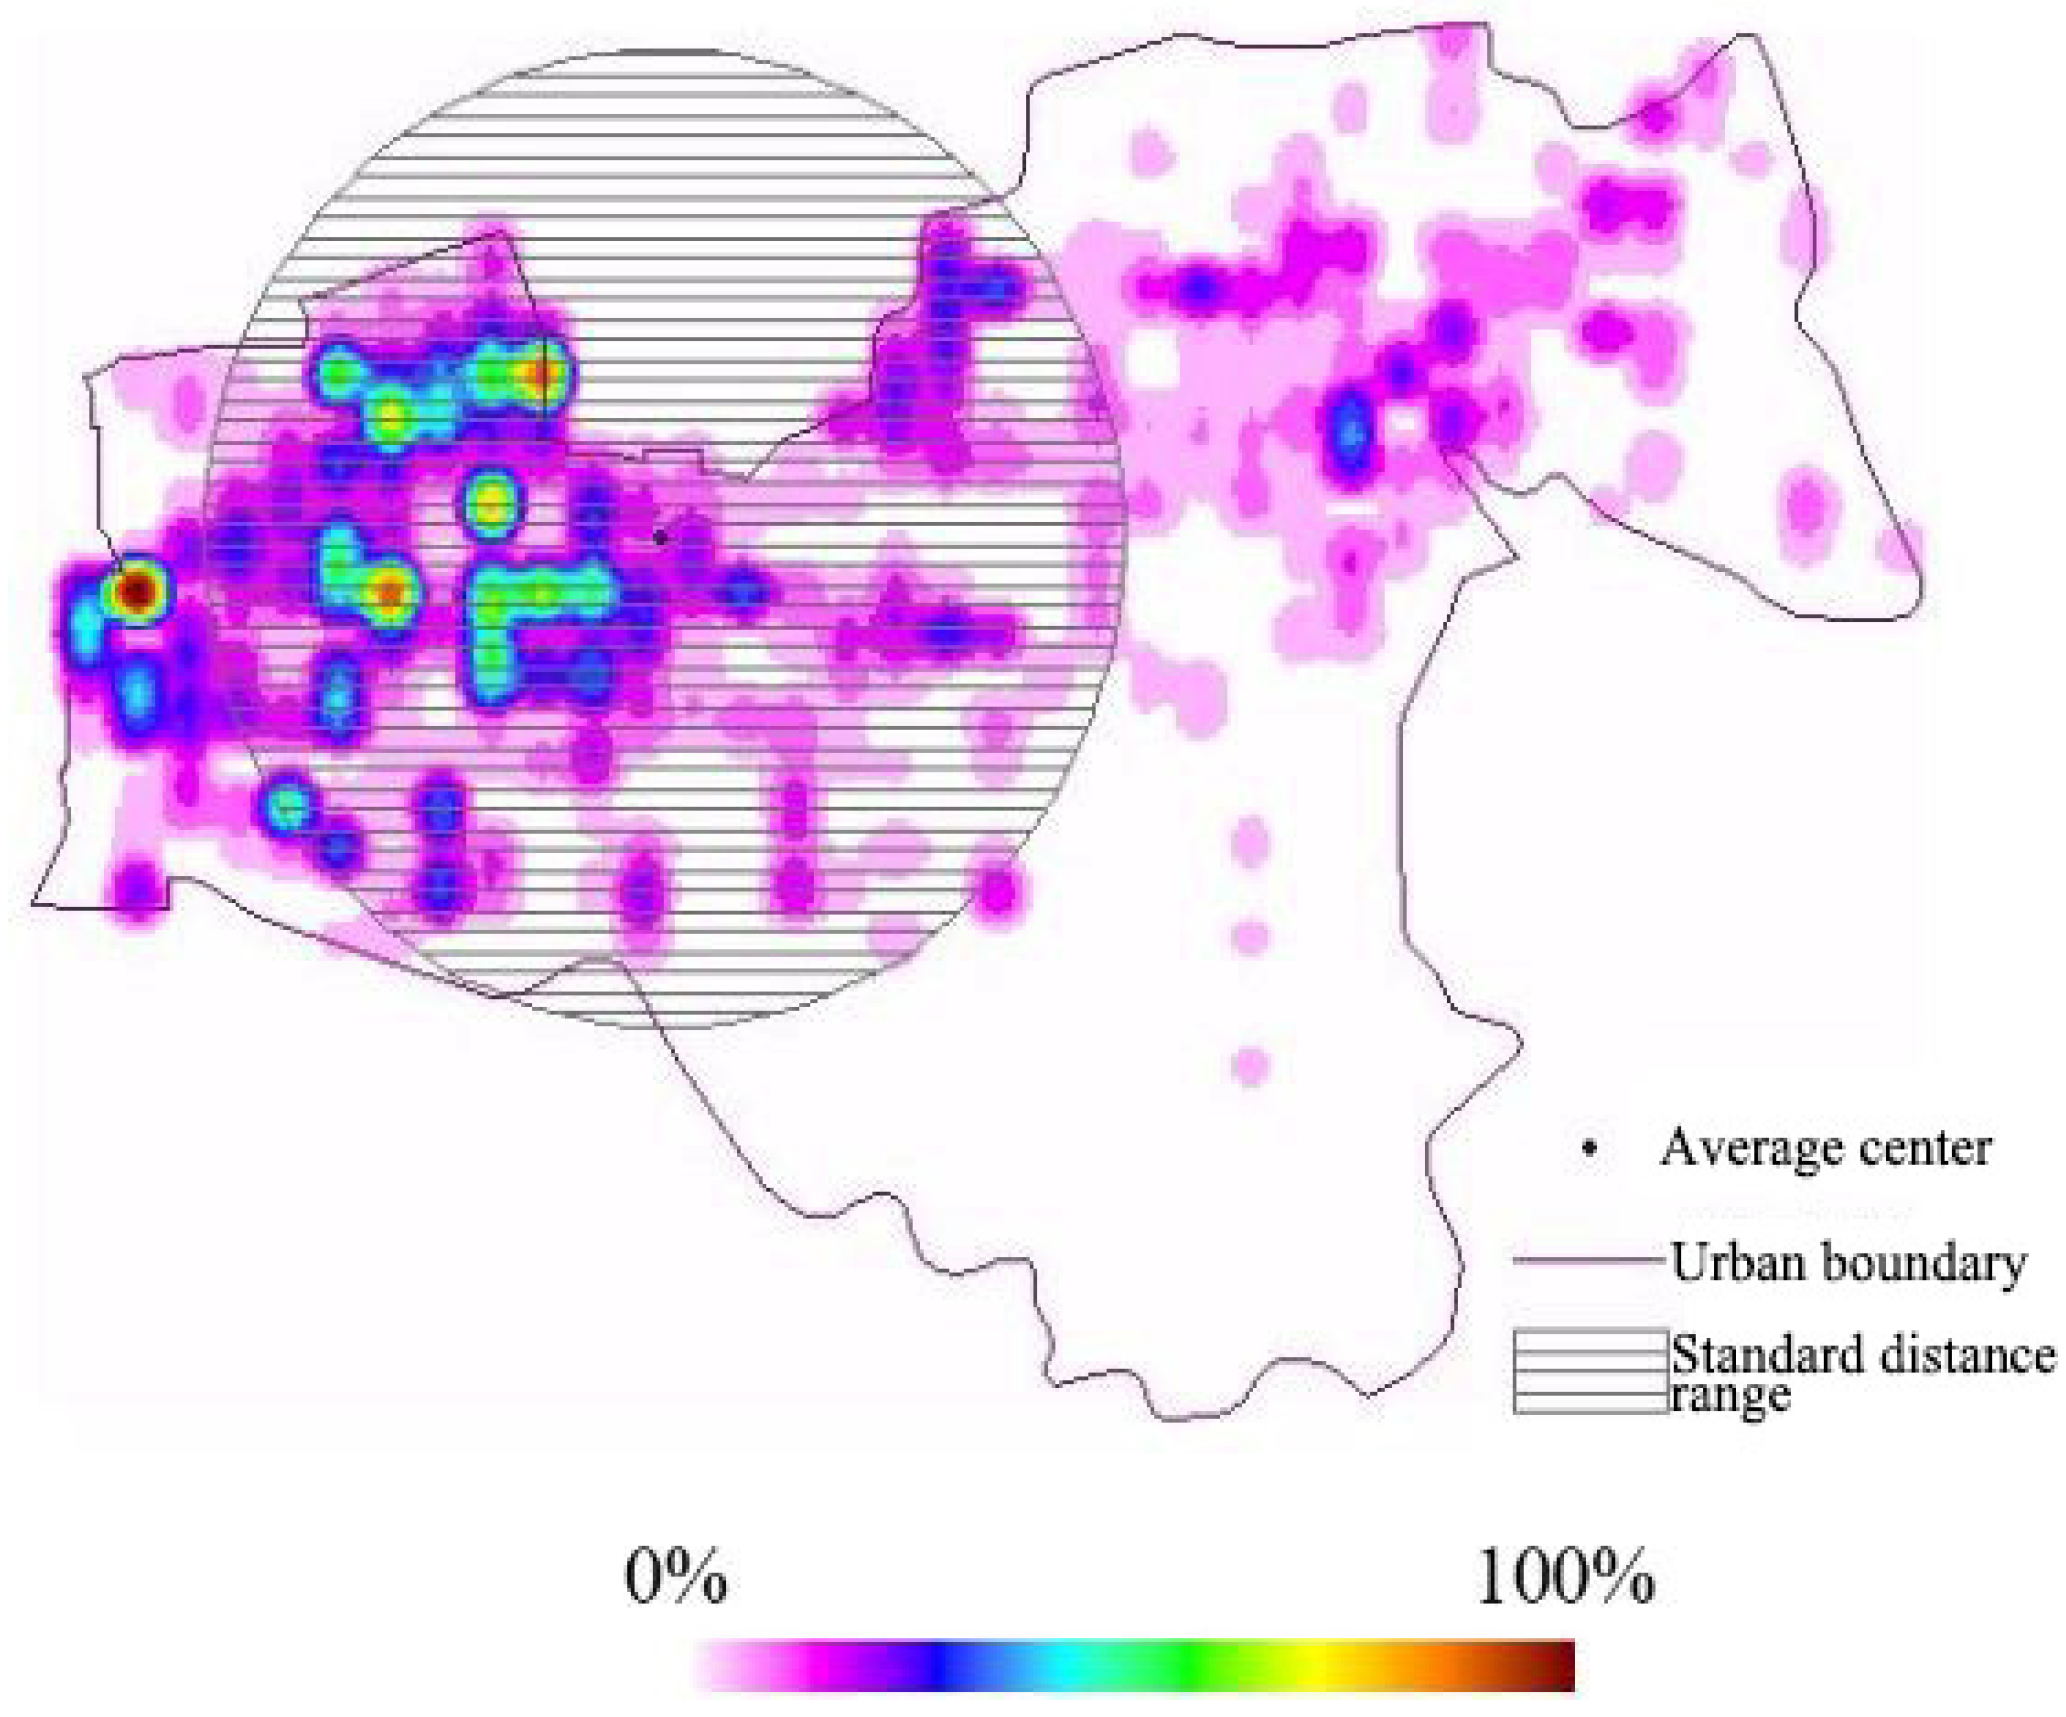
2. Aernel Density Analysis

The area with a large population has a greater possibility of charging demand than the area with a small population [35,36,37]. The population of an area can be known by performing a kernel density analysis for the population. Compared with traditional population density analysis, kernel density analysis overcomes the problem of uniform density within statistical cells. X represents the number of all sample points. h represents the bandwidth. The formula for calculating bandwidth h is Formula (3). The population density of the calculated point is Formula (1).
p = 1 h 2 x = 1 X K ( x )
P O P x represents the population of the sample point x . d i s t x   represents the distance between the calculated point and the sample point, which satisfies d i s t x < h . The kernel density function of kernel density analysis is Formula (2).
K ( x ) = 3 π P O P x [ 1 ( d i s t x h ) ] 2
D m is the median of the distance from the sample point to the average center. S D w is the standard distance. The calculation formula is Formula (4).
h = 0.9 * min ( S D w , 1 l n 2 * D m ) * ( x = 1 X P O P x ) 0.2
( X x , Y x ) is the latitude and longitude coordinate point of the sample point x . ( X w , Y w ) is the latitude and longitude coordinate point of the average center. The calculation formula is Formula (5).
S D w = x = 1 X P O P x ( X x X w ) 2 x = 1 X P O P x + x = 1 X P O P x ( Y x Y w ) 2 x = 1 X P O P x
( X w , Y w ) = x = 1 X P O P x X x x = 1 X P O P x + x = 1 X P O P x Y x x = 1 X P O P x
Population densities in different regions are classified by the natural discontinuity grading method (Jenks) of ArcGIS [38]. The cutoff value of Jenks can be expressed as a numerical value or a percentage. Similarly, population density values that fall between the cutoff values can also be expressed as either a numerical value or a percentage.

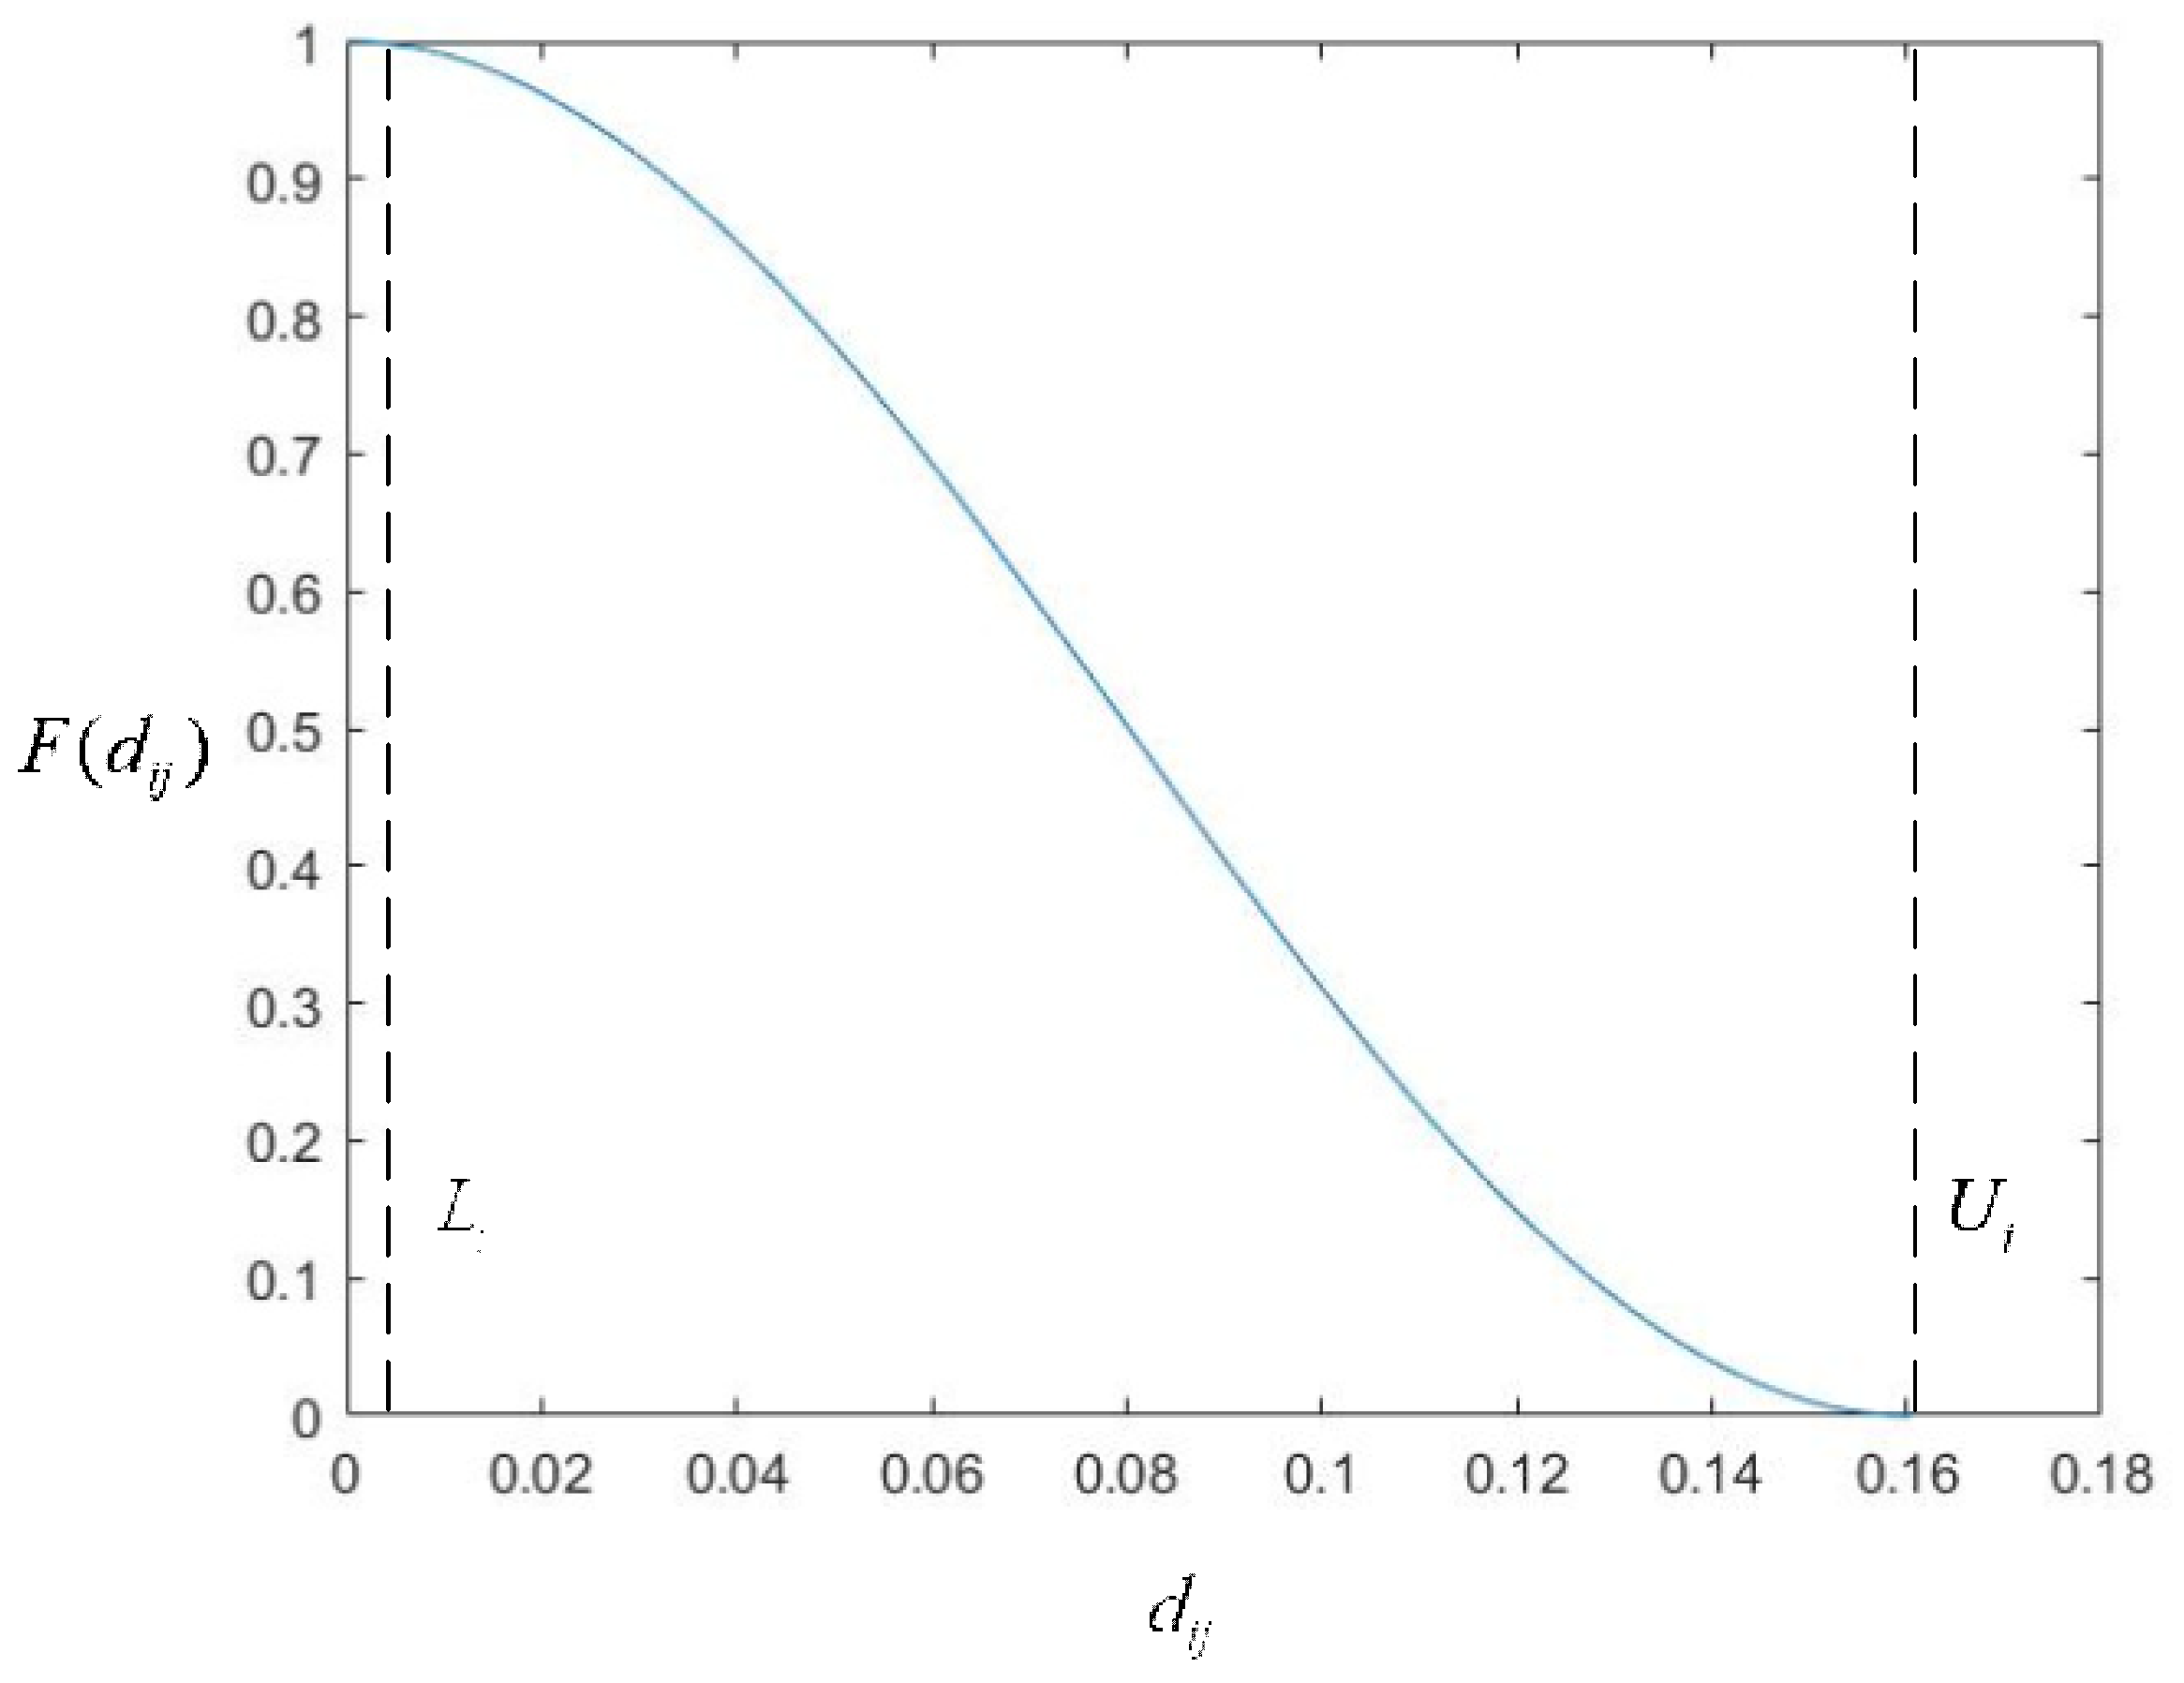
3. Electric Vehicle User Satisfaction Model

The user’s feelings and psychological changes are quantified in the electric vehicle user satisfaction function. L i is the lower limit of the distance between the demand point i and the to-be-taken point j . U i is the upper limit of the distance between the demand point i and the to-be-taken point j . d i j is the distance from the demand point i to the to-be-taken point j . F ( d i j ) is the user satisfaction evaluation value of electric vehicles at the demand point i . The electric vehicle user satisfaction model is Formula (6) [39].
F ( d i j ) = { 1 , d i j L i 1 2 + 1 2 cos ( π U i L i ( d i j U i + L i 2 ) + π 2 ) , L i < d i j U i 0 , d i j > U i
d i j < L i ,   F ( d i j ) = 1 . As d i j increases, F ( d i j ) decreases. When d i j > U i ,   F ( d i j ) = 0 . The relationship between F ( d i j ) and d i j is shown in Figure 1.

4. User Charging Convenience

The electric vehicle charging station is different from the general power infrastructure. Under the conditions of urban traffic, municipal planning and power quality of the power grid, the users’ charging convenience should be maximized. Therefore, the service range of the charging station depends on the time spent by the user in finding the longest path of the charging station. T represents the longest road time to find the charging station. V indicates the speed to find charging stations. is the traffic resistance coefficient. The charging station service radius model for user charging convenience is Formula (7).
R = T V
E is the battery power of the electric vehicle. W 100 is the power consumption of electric vehicles per 100 km. If the distance that the remaining electric quantity of electric vehicle can travel is less than R , the user’s location is not within the service range of this charging station. Therefore, the service radius limit of the charging station is Formula (8).
R 20 % E W 100
The actual distance of the service radius of the charging station is converted into the Euclidean distance by Zhou Yuyang’s method [40]. S i represents the area of the demand point numbered i . The service area of the charging station is S j = π R 2 . The number of demand points in the service area of the to-be-taken point S i is Formula (9).
n i j = c o u n t ( S i ) ( S i S j )

5. Electric Vehicle Charging Station Site-Selection Model

5.1. Suppose

For quantitative research, the following assumptions are made in the modeling process.
(1)
Each demand point only goes to the nearest charging station for charging;
(2)
Each demand point represents a small area of fixed area;
(3)
All electric vehicles have the same battery capacity and model;
(4)
While going to the charging station to charge, the driving speed of the electric vehicle remains constant;
(5)
In the study area, the demand for the demand point is the same every day, and the demand density is equal to the population density value expressed as a percentage.

5.2. Goals and Constraints

The basic symbols are explained as follows. i indicates the number of the demand point, i n i . n i represents the set of demand points. j represents the number of the to-be-taken point, j n j . n j represents the set of to-be-taken points. I represents the number of demand points. J represents the number of to-be-taken points. a represents the number of demand points within the service scope. P represents the number of charging stations. Y i j and Y j are the decision variable.
-
Objective function one: Maximize user satisfaction
The satisfaction and the level of the demand point’s own demand are considered in the location selection of the charging station. p i represents the demand density at the demand point i . User demand density is the number of electric vehicles with charging demand per unit land area. S indicates the area of a demand point. Based on the electric vehicle user satisfaction model and the results of the kernel density analysis, an electric vehicle user satisfaction model is established as shown in Formula (10).
m a x f 1 = j = 1 J i = 1 I F ( d i j ) p i S Y i j Y j
-
Objective function two: Maximize the charging convenience
Based on the user’s charging convenience, the service radius of the charging station is calculated. Then, the service area of the charging station is obtained. By the number of electric vehicles that fall within the service area of the charging station, the charging convenience of the to-be-taken point is judged. The to-be-taken point with the highest charging convenience is selected. p j a represents the demand density of the demand point number a within the service range of the to-be-taken point j . The charging convenience model for users within the service range of the charging station is established, as shown in Formula (11).
m a x f 2 = j = 1 J a = 1 n i j p j a Y j
Restrictions:
(1)
Each demand point can only correspond to one to-be-taken point.
j = 1 J Y i j = 1   i n i , j n j
(2)
Meeting priority conditions and charging needs of electric vehicles. Formula (13) indicates that the user satisfaction is satisfied under the condition that the charging convenience of the electric vehicle charging station is satisfied. Meanwhile, the charging demand of electric vehicles is met at the to-be-taken point j .
Y i j Y j i n i , j n j
(3)
Meeting demand points are allocated to corresponding charging stations. Formula (14) indicates that the built electric vehicle charging station meets the changing needs of all demand points.
j = 1 J Y i j Y j 1 i n i , j n j
(4)
Meeting the capacity requirements of the site-selection scheme. Formula (15) represents the number of charging stations in all site-selection schemes.
j = 1 J Y j = P j n j
(5)
Y i j = 1 indicates that the user is satisfied with the electric vehicle charging station at the to-be-taken point j . Y i j = 0 indicates that the user is not satisfied with the electric vehicle charging station at the to-be-taken point j . Y j = 1 indicates that the charging convenience of the electric vehicle charging station is high in the to-be-taken point j . Y j = 0 indicates that the charging convenience of the electric vehicle charging station is low at the to-be-taken point j . Analyzing conditions are:
Y i j { 0 , 1 }   i n i , j n j Y i j { 0 , 1 } j n j
To sum up, the objective function one is Formula (17), which represents the maximization of user satisfaction based on electric vehicles. Objective function two is Formula (18), which indicates that the charging convenience for users within the service range of the charging station is the highest. The location model of the electric vehicle charging station is as follows:
m a x f 1 = j = 1 J i = 1 I F ( d i j ) p i S Y i j Y j
m a x f 2 = j = 1 J a = 1 n i j p j a Y j
Restrictions:
j = 1 J Y i j = 1       i n i , j n j
Y i j Y j       i n i , j n j
j = 1 J Y i j Y j 1       i n i , j n j
j = 1 J Y j = P       j n j
Y i j { 0 , 1 }     i n i , j n j       Y i j { 0 , 1 }       j n j    

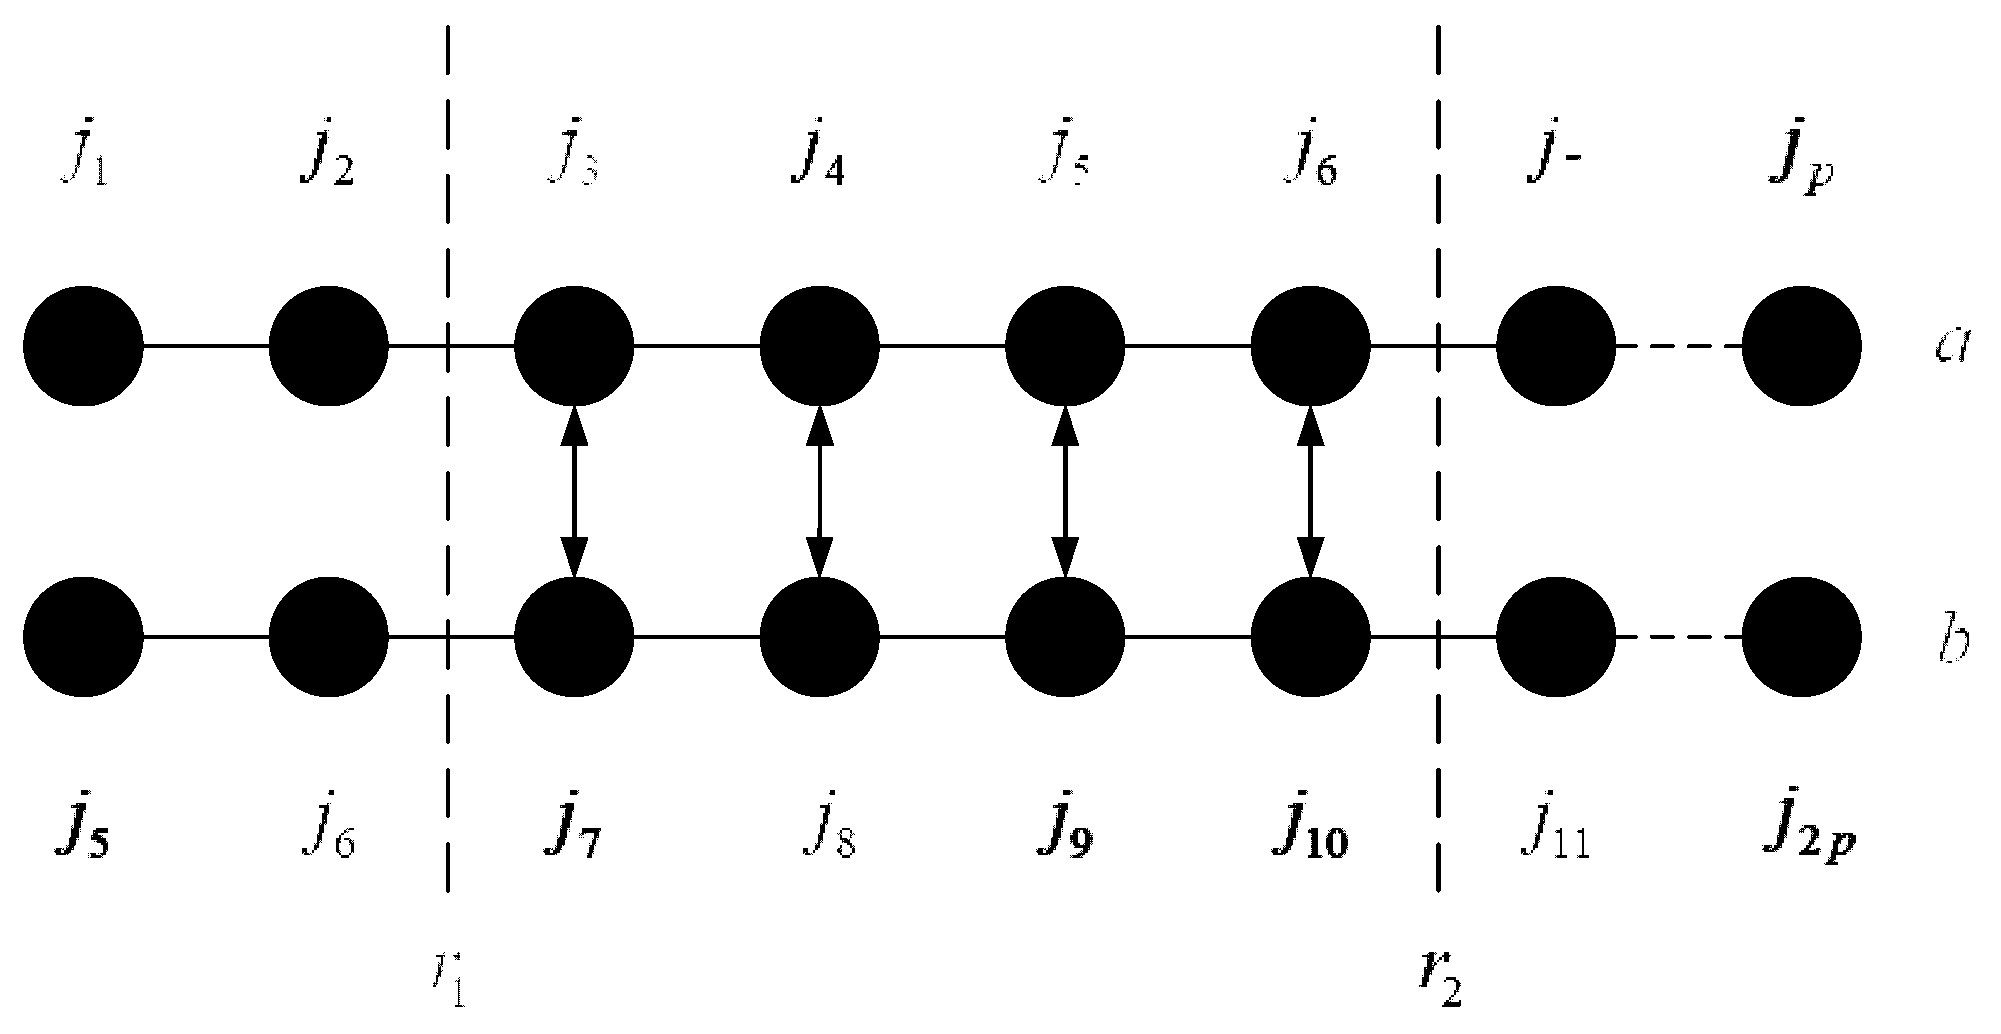
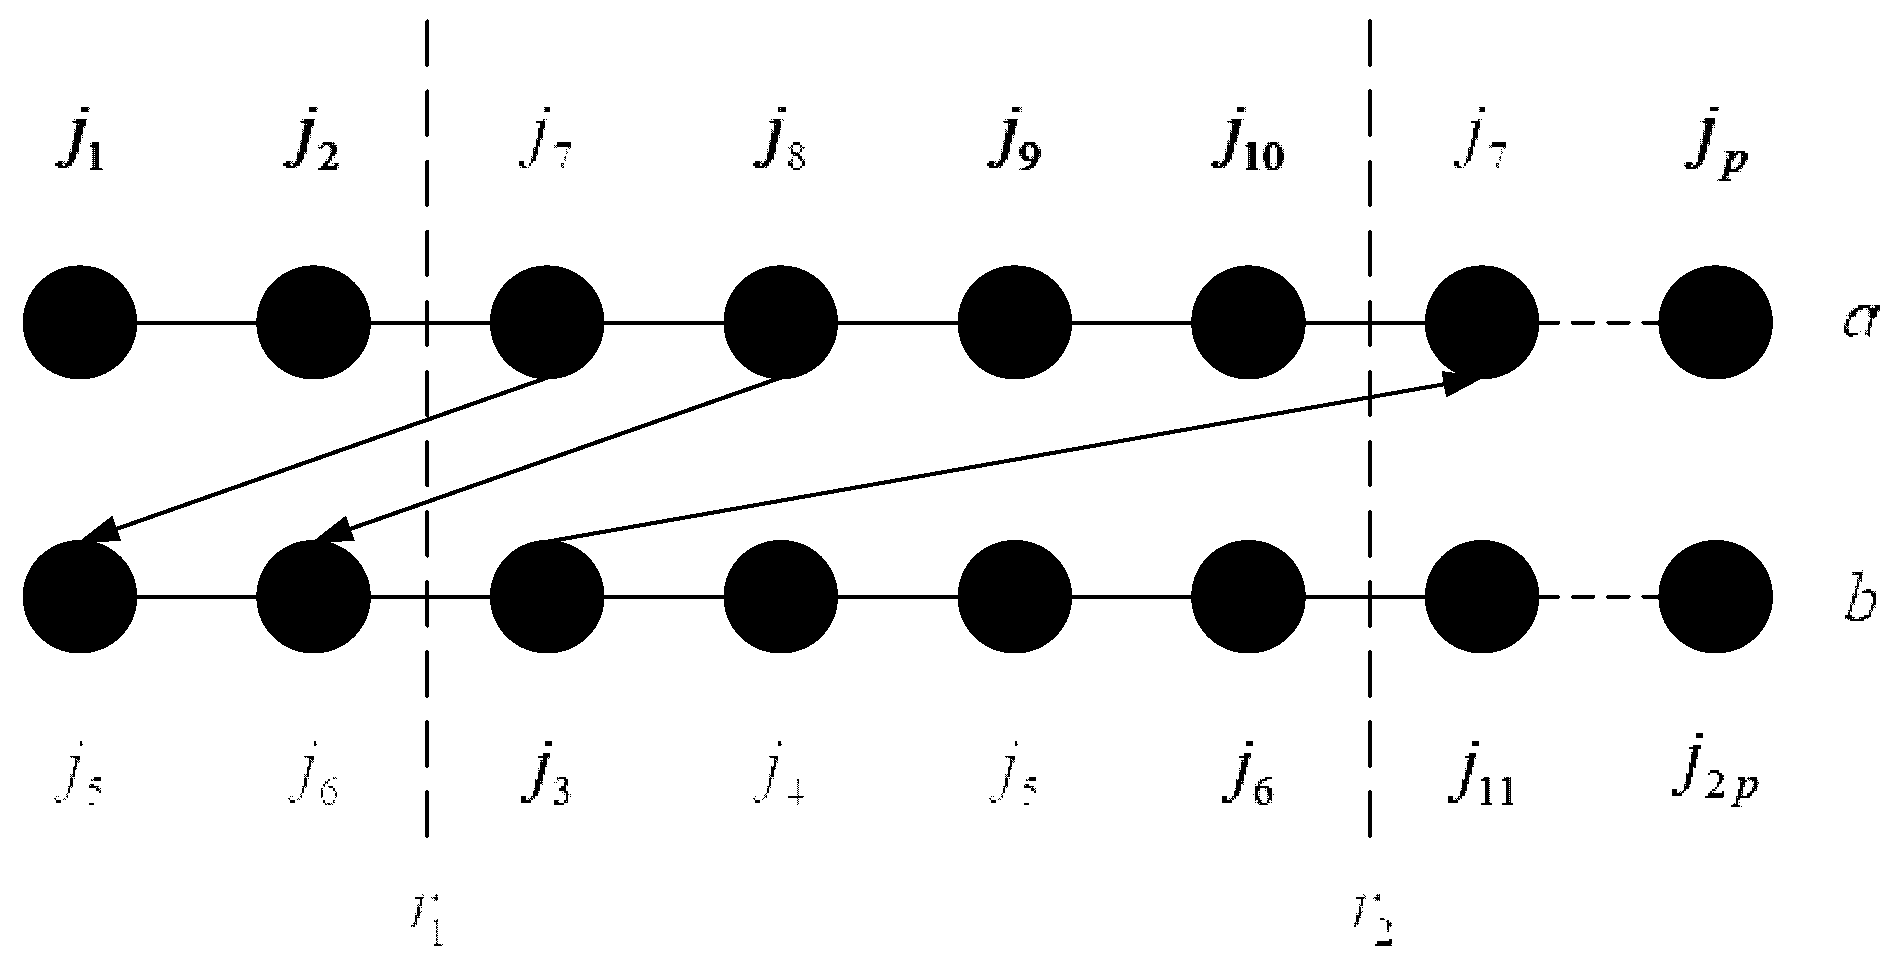
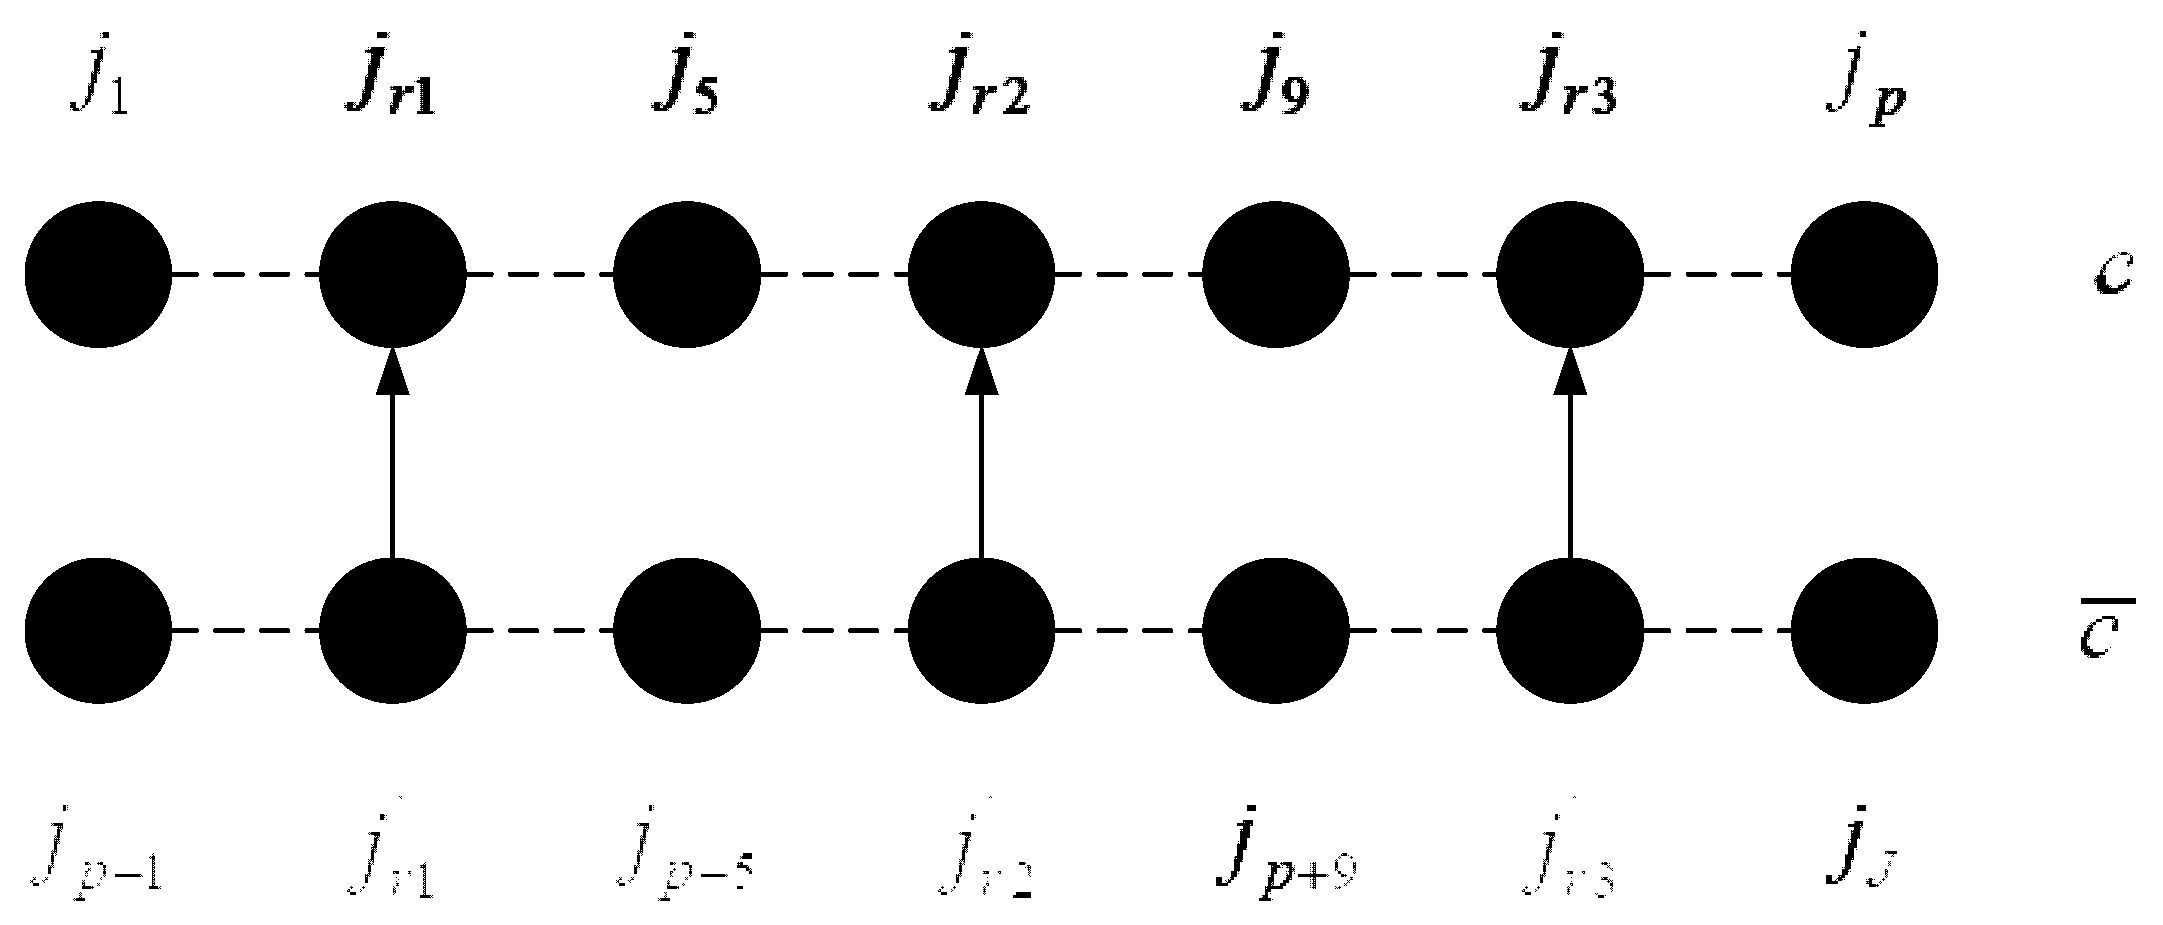
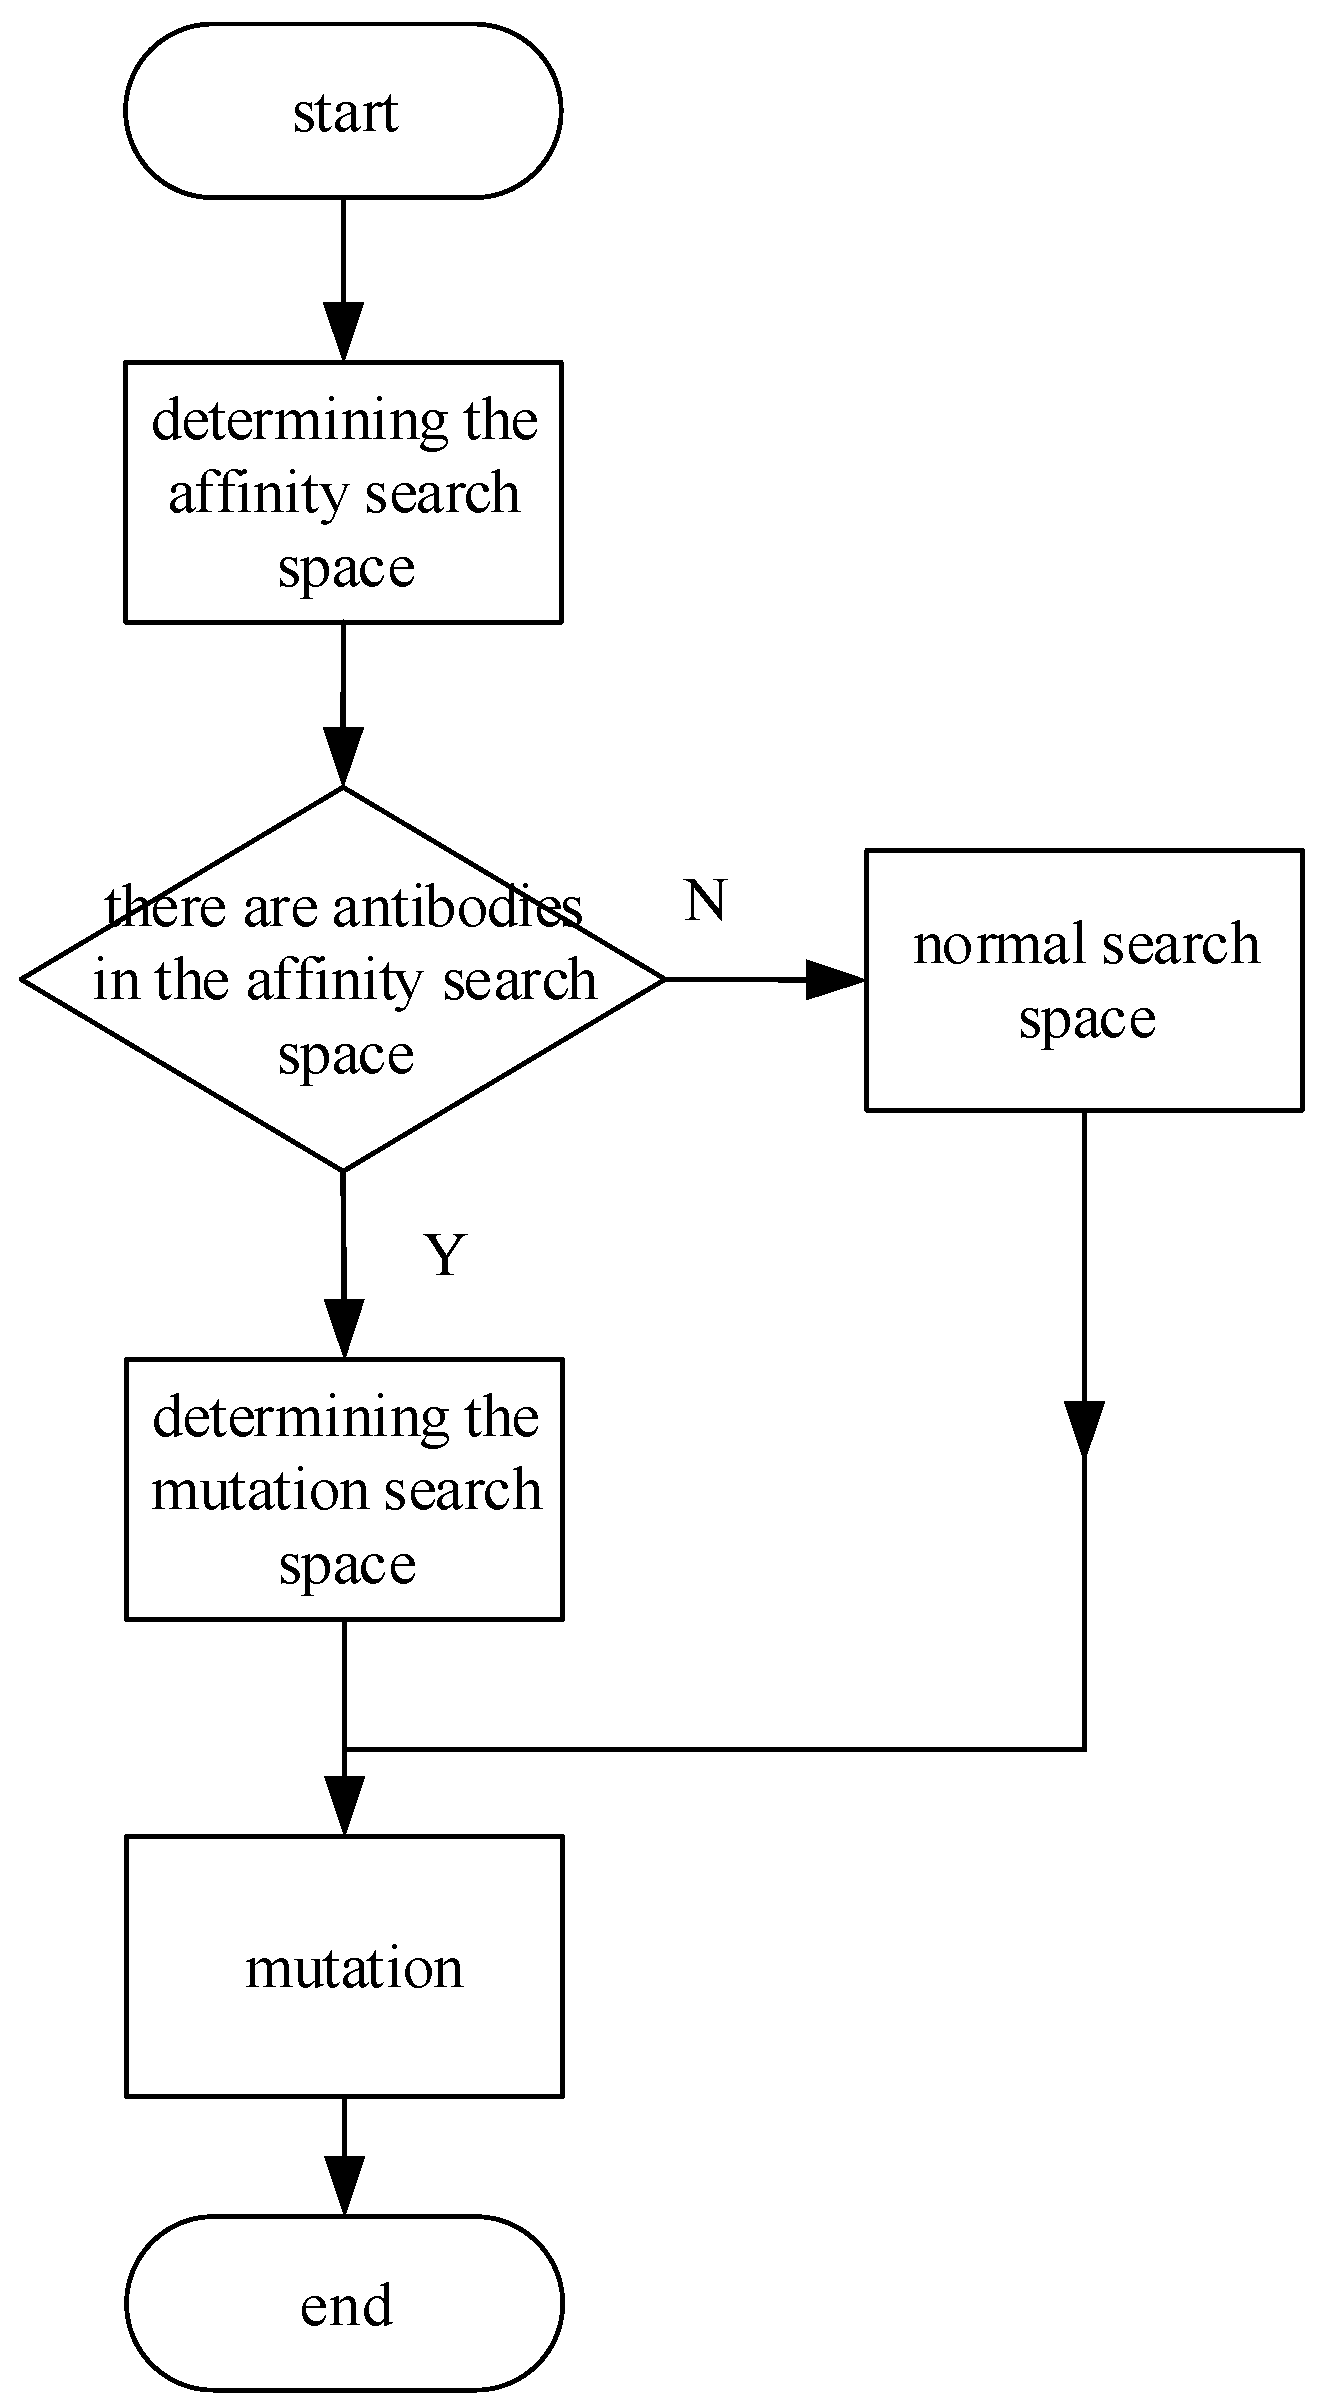
6. Optimized Immune Algorithm

In the optimized immune algorithm, the antigen is the objective function of the electric vehicle charging station location model. Antibodies are the solutions to this objective function. Affinity is equivalent to the ability of an antibody to resolve an antigen. In the mutation link of the traditional immune algorithm, a mutation operator of multipoint mutation is added. The mutation search space for the mutation operator of the traditional immune algorithm is added. Judging stop condition is written between two mutation operators. According to the characteristics of the electric vehicle charging station model, the population generation of the immune algorithm, the affinity function, the crossover operator and the mutation operator are designed. The flowchart of the optimized immune algorithm is as follows:
Step 1 (forming a population): The element variable in each antibody consists of the number of to-be-taken points. The length of the antibody is the capacity of the addressing scheme. The population is composed of several antibodies. For example, the location problem is considered to select P charging stations from J to-be-taken points. Suppose the number of the to-be-taken points is represented by 1 , 2 , , J . Antibody a n t j = { j 1 , j 2 , , j p } represents a feasible solution to the objective function. It represents that the to-be-taken point numbered 1 , 2 , , P is selected as an electric vehicle charging station. The similarity between j 1 , j 2 , , j p is zero.
Step 2 (affinity value): The electric vehicle charging station site-selection model is processed through a linear weighting method. f i t ( a n t ) is the affinity value of antibody a n t . ω 1 and ω 2 are the weight coefficients of each target and satisfy ω 1 , ω 2 ( 0 , 0.5 ] . The affinity value is Formula (24).
f i t ( a n t ) = 1 ( ω 1 f 1 + ω 2 f 2 )
m a x f 1 and m i n f 1 are the maximum and minimum values of f 1 . m a x f 2 and m i n f 2 are the maximum and minimum values of f 2 . The formula for calculating f 1 , f 2 is Formula (25).
f 1 = f 1 m i n f 1 m a x f 1 m i n f 1   f 2 = f 2 m i n f 2 m a x f 2 m i n f 2  
Step 3 (generate parent): The parent is generated based on the affinity value of the initial population of each generation. The antibody with a small affinity value is selected in the initial population to be retained as an elite. The remaining antibodies are used as parents. The parents are selected according to the expected reproductive rate. p is the expected reproductive rate value. is a fixed value whose value range is ( 0 , 1 ) . C v is the concentration between the antibody and the population, The formula for the expected reproductive rate is Formula (26).
p = f i t ( a n t ) f i t ( a n t ) + ( 1 ) C v C v
M is the total number of antibodies. S v , s is the number of antibodies that meet the requirements, and its value is the sum of all S v , s values. C v is calculated as Formula (27).
C v = j M S v , s M × 100 %
T is the diversity evaluation parameter. S v , s is the concentration between antibodies. The expression of the judgment condition S v , s   is Formula (28).
S v , s = { 1 , S v , s > T 0 , S v , s T
k v , s represents the similarity between antibodies. S v , s   is calculated as Formula (29).
S v , s = k v , s P × 100 %
Step 4 (crossover and mutation): The judgment stop condition is added in the mutation process. Therefore, the invalid search space is excluded from the iterative process of the algorithm whose convergence speed is improved. a n t t + 1 represents a mutated antibody. a n t t represents primary antibody. The judgment stop condition is formula (30).
i f   f i t ( a n t t + 1 ) < f i t ( a n t t )                 c o n t i n u e       e n d
Two crossover operators and two mutation operators are designed, namely crossover operator a and crossover operator b , and mutation operator c and mutation operator d . The 2-point crossover method is used in the crossover operator process, and a partial mapping method was used to exclude duplicate variables. For multipoint mutation of mutation operator c , the chance of solving the optimal solution group is increased. The search space of the mutation operator d is reduced by referring to related literatures, and the probability of obtaining the optimal solution can be improved in the algorithm.
The crossover and mutation operators of antibodies are designed to solve the problem according to this paper. Suppose n j = { j 1 , j 2 , , j p , , j J } is the set of to-be-taken points. { j 1 , j 2 , , j p } is the crossover operator a . { j 5 , j 6 , , j 2 p } is the crossover operator b . { j 1 , j 2 , , j p } is the mutation operator c . The search space of the mutation operator c is c ¯ = { j p + 1 , , j J } and satisfies c c ¯ = , c c ¯ = n j . { j 1 , j 2 , , j p } is the mutation operator d . The search space of the mutation operator d is d .
The case of crossover operator a and crossover operator b is shown in Figure 2. The middle-part set { j 3 , j 4 , j 5 , j 6 } a and { j 7 , j 8 , j 9 , j 10 } b is formed by randomly selecting the intersection position r 1 ,     r 2 . The exchanged crossover operator a = { j 1 , j 2 , j 7 , j 8 , j 9 , j 10 , j 7 , , j p } and crossover operator b = { j 5 , j 6 , j 3 , j 4 , j 5 , j 6 , j 11 , , j 2 p } are obtained by exchanging the intermediate part sets with each other. The set of repeated elements is { j 7 } in the crossover operator a . The set of repeated elements is { j 5 , j 6 } in the crossover operator b .
The weight of the crossover operator can be reduced by the mapping substitution method in Figure 3. The set of repeated elements { j 7 } is replaced in the crossover operator a by the set { j 3 } in the crossover operator b . Then, the set of repeated elements { j 5 , j 6 } is replaced in the crossover operator b by the set { j 7 , j 8 } in the crossover operator a .
The mutation operator c is shown in Figure 4. The mutation position set { j r 1 , j r 2 , j r 3 } is randomly selected in the mutation operator c . The mutation position set { j r 1 , j r 2 , j r 3 }   is randomly selected in the mutation search space c ¯ . The mutated mutation operator c = { j 1 , , j r 1 , , j r 2 , , j r 3 , , j P } is obtained by replacing the set { j r 1 , j r 2 , j r 3 } c with the set { j r 1 , j r 2 , j r 3 } c ¯ .
If the mutation operator c satisfies the judgment stop condition, the mutation operator d is not calculated. If not satisfied, mutation operator d is determined by Figure 5.
The affinity search space ( ( 1 v i s u a l ) f i t ( d ) , f i t ( d ) ) is determined according to the affinity value of the mutation operator d . The affinity value of any antibody within the affinity search range is less than the affinity value of the antibody d . The variant search space d is determined by randomly selecting an antibody. i n d e x is the index collection of antibodies in v i s u a l . a n t i n d e x is the mutation search space index. The method of randomly selecting antibodies is formula (31).
a n t i n d e x = i n d e x ( c e i l ( r a n d * s i z a ( i n d e x , 2 ) ) )
The mutation operator d and the normal search space d satisfy d d = , d d = n j . The mutation operator d is shown in Figure 6. The mutation position set { j r } is randomly selected in the mutation operator d . The mutation position set { j r } is randomly selected in the mutation search space d . The mutated mutation operator d = { j 1 , , j r , , j P } is obtained by replacing the set { j r } with the set { j r } .
If the similarity between set { j r } and other variable sets in the mutation operator d excluding set { j r } is not zero, the random mutation position is selected in the mutation search space to replace the set { j r } . If the mutation operator d after mutation does not meet the judgment stop condition, the mutation operator d is mutated in the normal search space again.

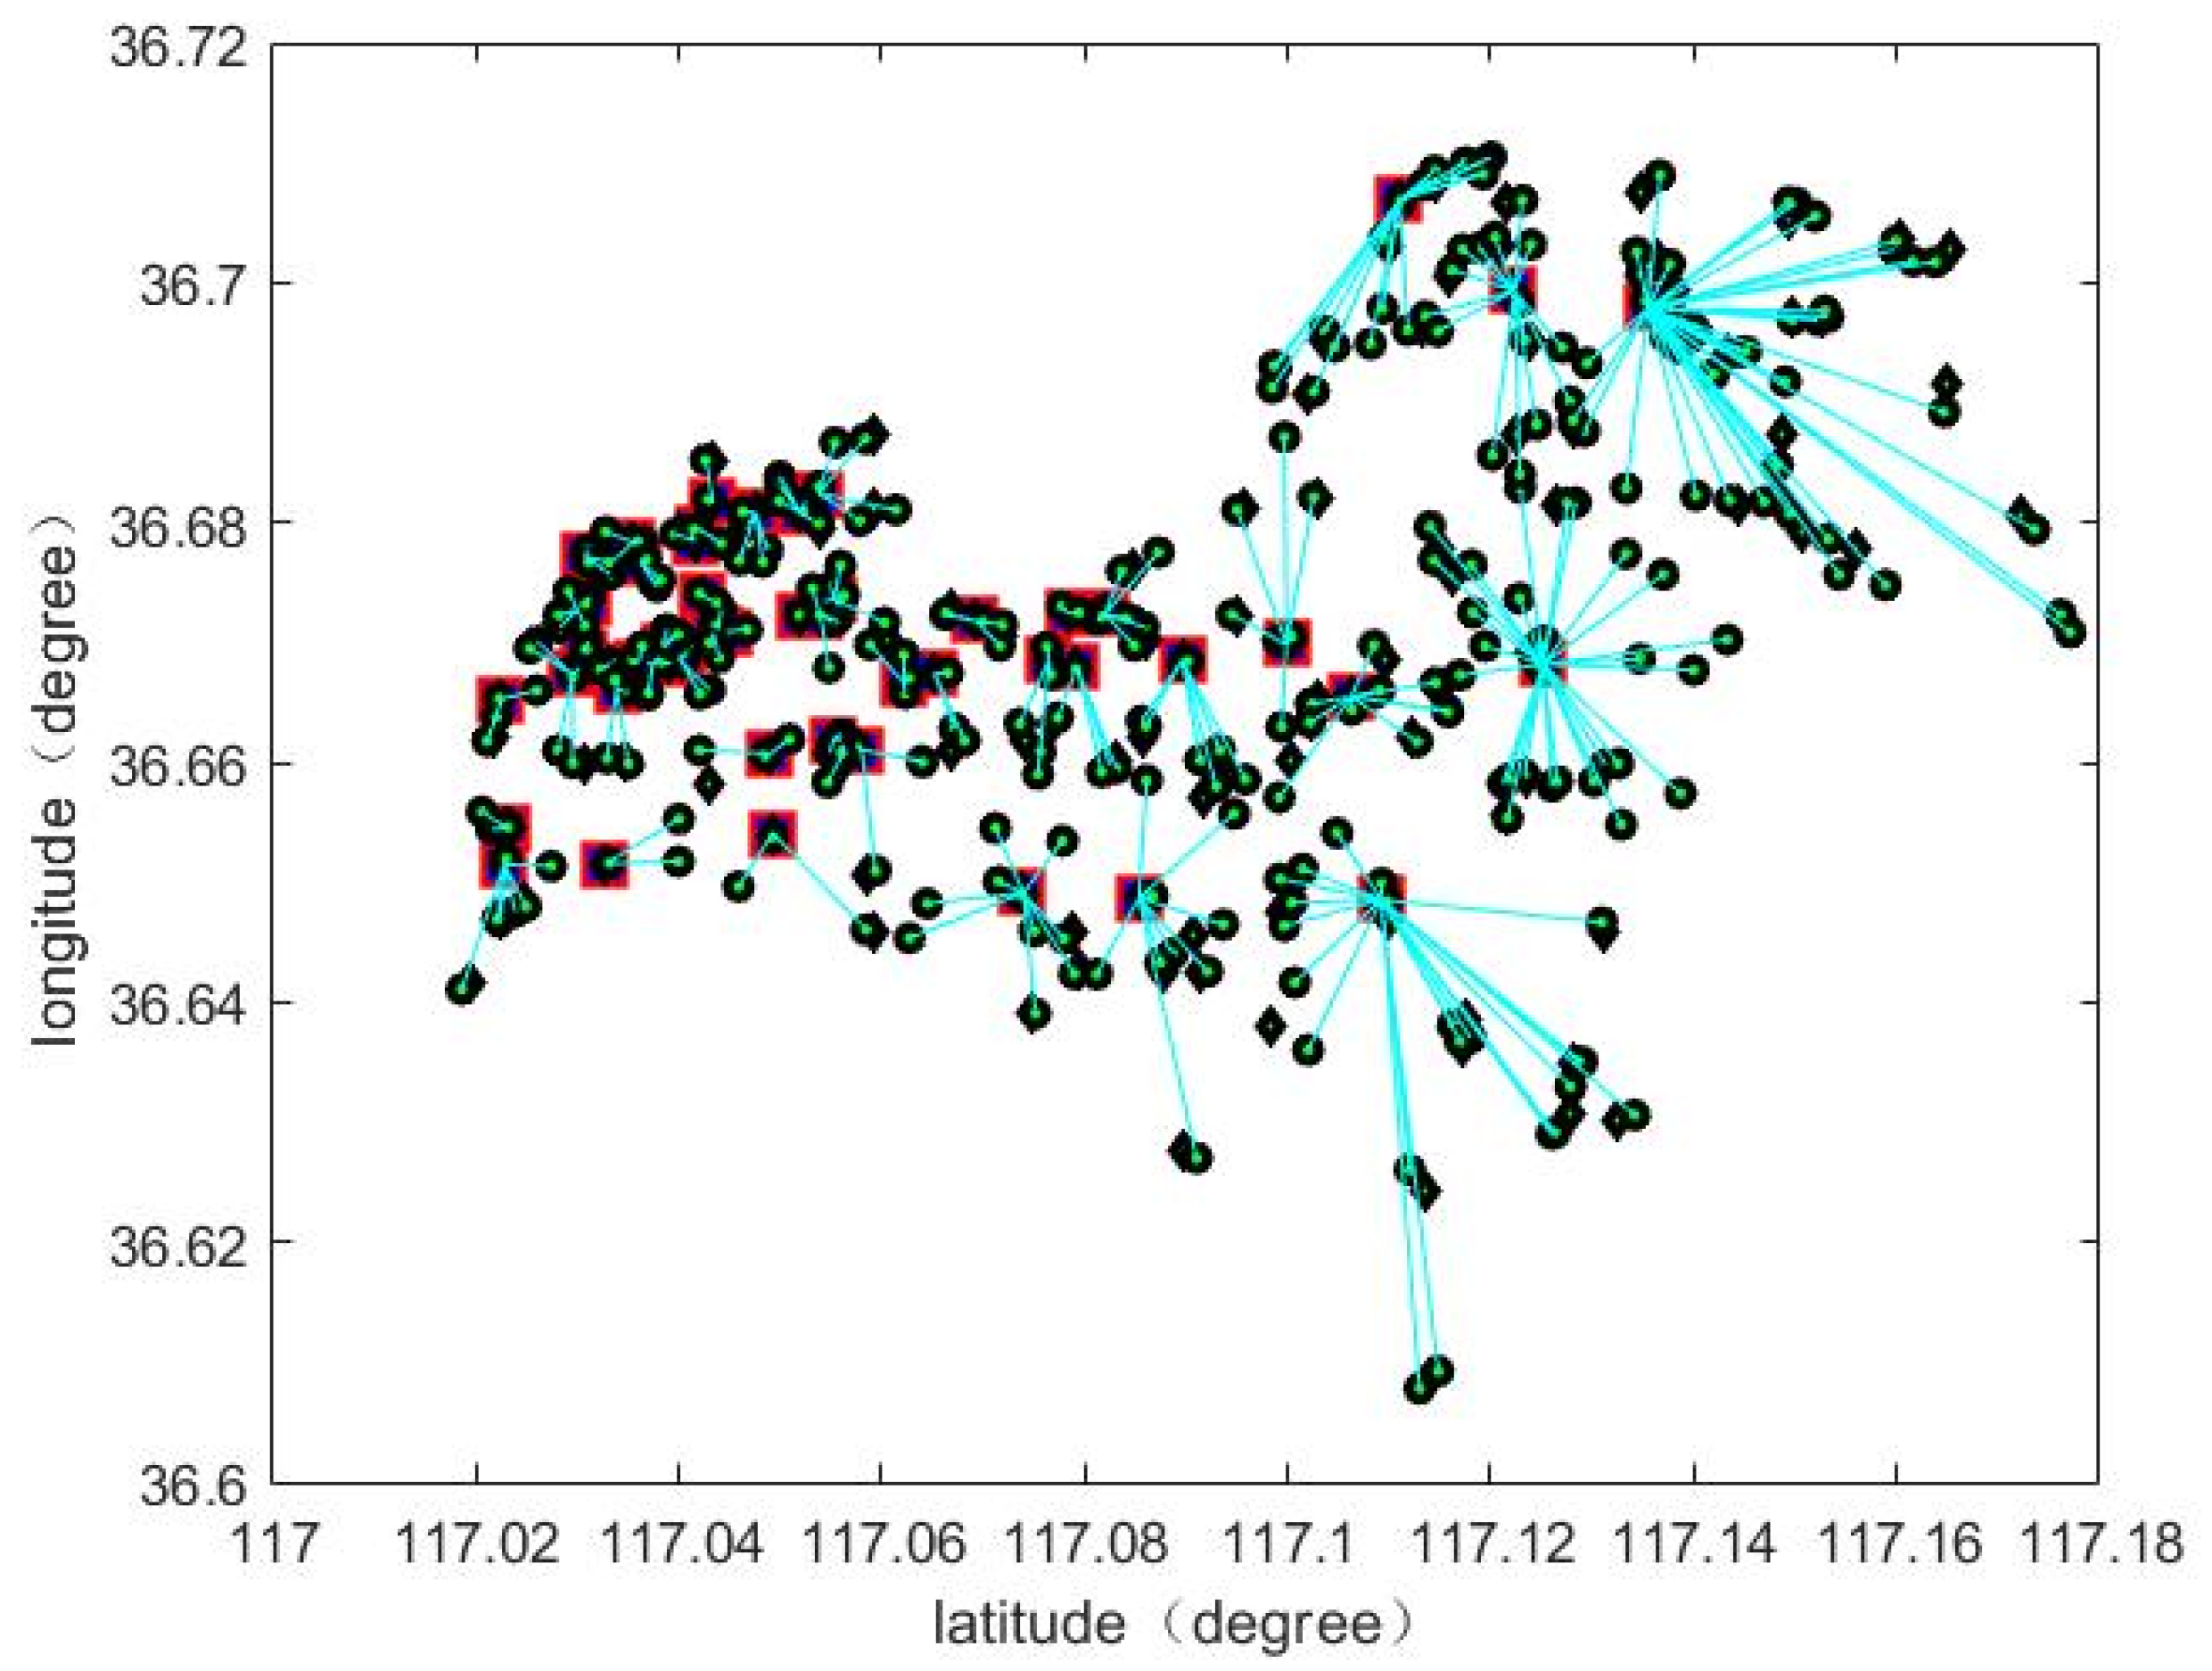
7. Region and Points Are Selected

An example is determined using the three-step method. The three-step method includes selecting the central urban area based on the weight, selecting the demand point based on the area type and selecting the to-be-taken point based on the unit grid. The selection of the central city mainly considers the influence of the regional economy, personal GDP, population parameters and car ownership on consumers’ willingness to buy electric vehicles. By establishing a decision-making team composed of 10 researchers in the field of electric vehicle charging station site selection, the expert evaluation parameters were obtained by scoring the above four factors respectively and taking the average value. The scoring standard is Table 1.
The weight of each urban area is obtained by combining the expert evaluation parameters with the linear weighting of each factor. x r is the weight value of the urban area r . x i r represents the expert evaluation parameter of the influence of factor i on the purchase of electric vehicles in the urban area r . f i r represents the value of factor i within the urban area r . f i z represents the total value of the factor i . x 4 represents the expert evaluation parameter of the impact of car ownership on the purchase of electric vehicles. f 4 r represents the value in car ownership. f 4 z represents total car ownership. The weight of each city area is Formula (32).
x r = i = 1 3 x i r f i r f i z + ( 1 f 4 r f 4 z ) x 4
Areas with dense population, high traffic flow and high probability of charging demand are selected as demand points. The area types of demand points include working areas such as factories, schools and hospitals, business areas such as supermarkets and restaurants, parking lots, residential areas and tourist areas. The central city is divided into cells of equal area. According to the characteristics of the road distribution in the cell, the layout of demand points and the charging station for electric vehicles that have been built, several to-be-taken points are selected.

8. Simulation

8.1. Analysis of the Example

In this paper, Jinan City was selected for the research. The expert evaluation parameters of the regional economy, personal GDP, population parameters and car ownership in each district are 3, 5, 4 and 2, respectively. The weight of each district is Figure 7.
The Lixia region with the largest weight value is selected. the number of demand points is 378. The number of to-be-taken points is 155. The locations of demand points and to-be-taken points are determined at the Lixia region in Figure 8.
For the Lixia area kernel density analysis, the population density distribution map is shown in Figure 9.
Through sensitivity analysis, the number of charging stations is determined in Table 2. The number of electric vehicle charging stations is 53, which is determined by selecting the maximum difference in average satisfaction with the number of adjacent stations.
In this paper, the parameters of the optimized immune algorithm are set as follows. The population size is 100; the memory bank capacity is 20; the number of iterations is 400; the crossover probability is 0.5; the mutation probability is 0.4; the diversity evaluation parameter is 0.95; the affinity search range is 0.0001. The site-selection scheme is shown in Figure 10. The circle represents the demand point. The diamond represents the to-be-taken point. The red square represents the to-be-taken point selected to build the charging station.
The traditional site-selection scheme only considers the electric vehicle user satisfaction. That is, objective function 1 is solved. The average service capacity represents the average number of demand points served by each charging station within the scheme. The average charging convenience represents the number of electric vehicles that fall within the service range of an average charging station within the scheme. In Table 3, the average service of the site-selection scheme in this paper can serve 12 more demand points than the traditional site-selection scheme. The user density is 3% higher than the traditional site-selection scheme. The average charging convenience is 462 vehicles higher than the traditional site-selection scheme. The comparison between the site-selection scheme in this paper and the traditional site-selection scheme is as follows:

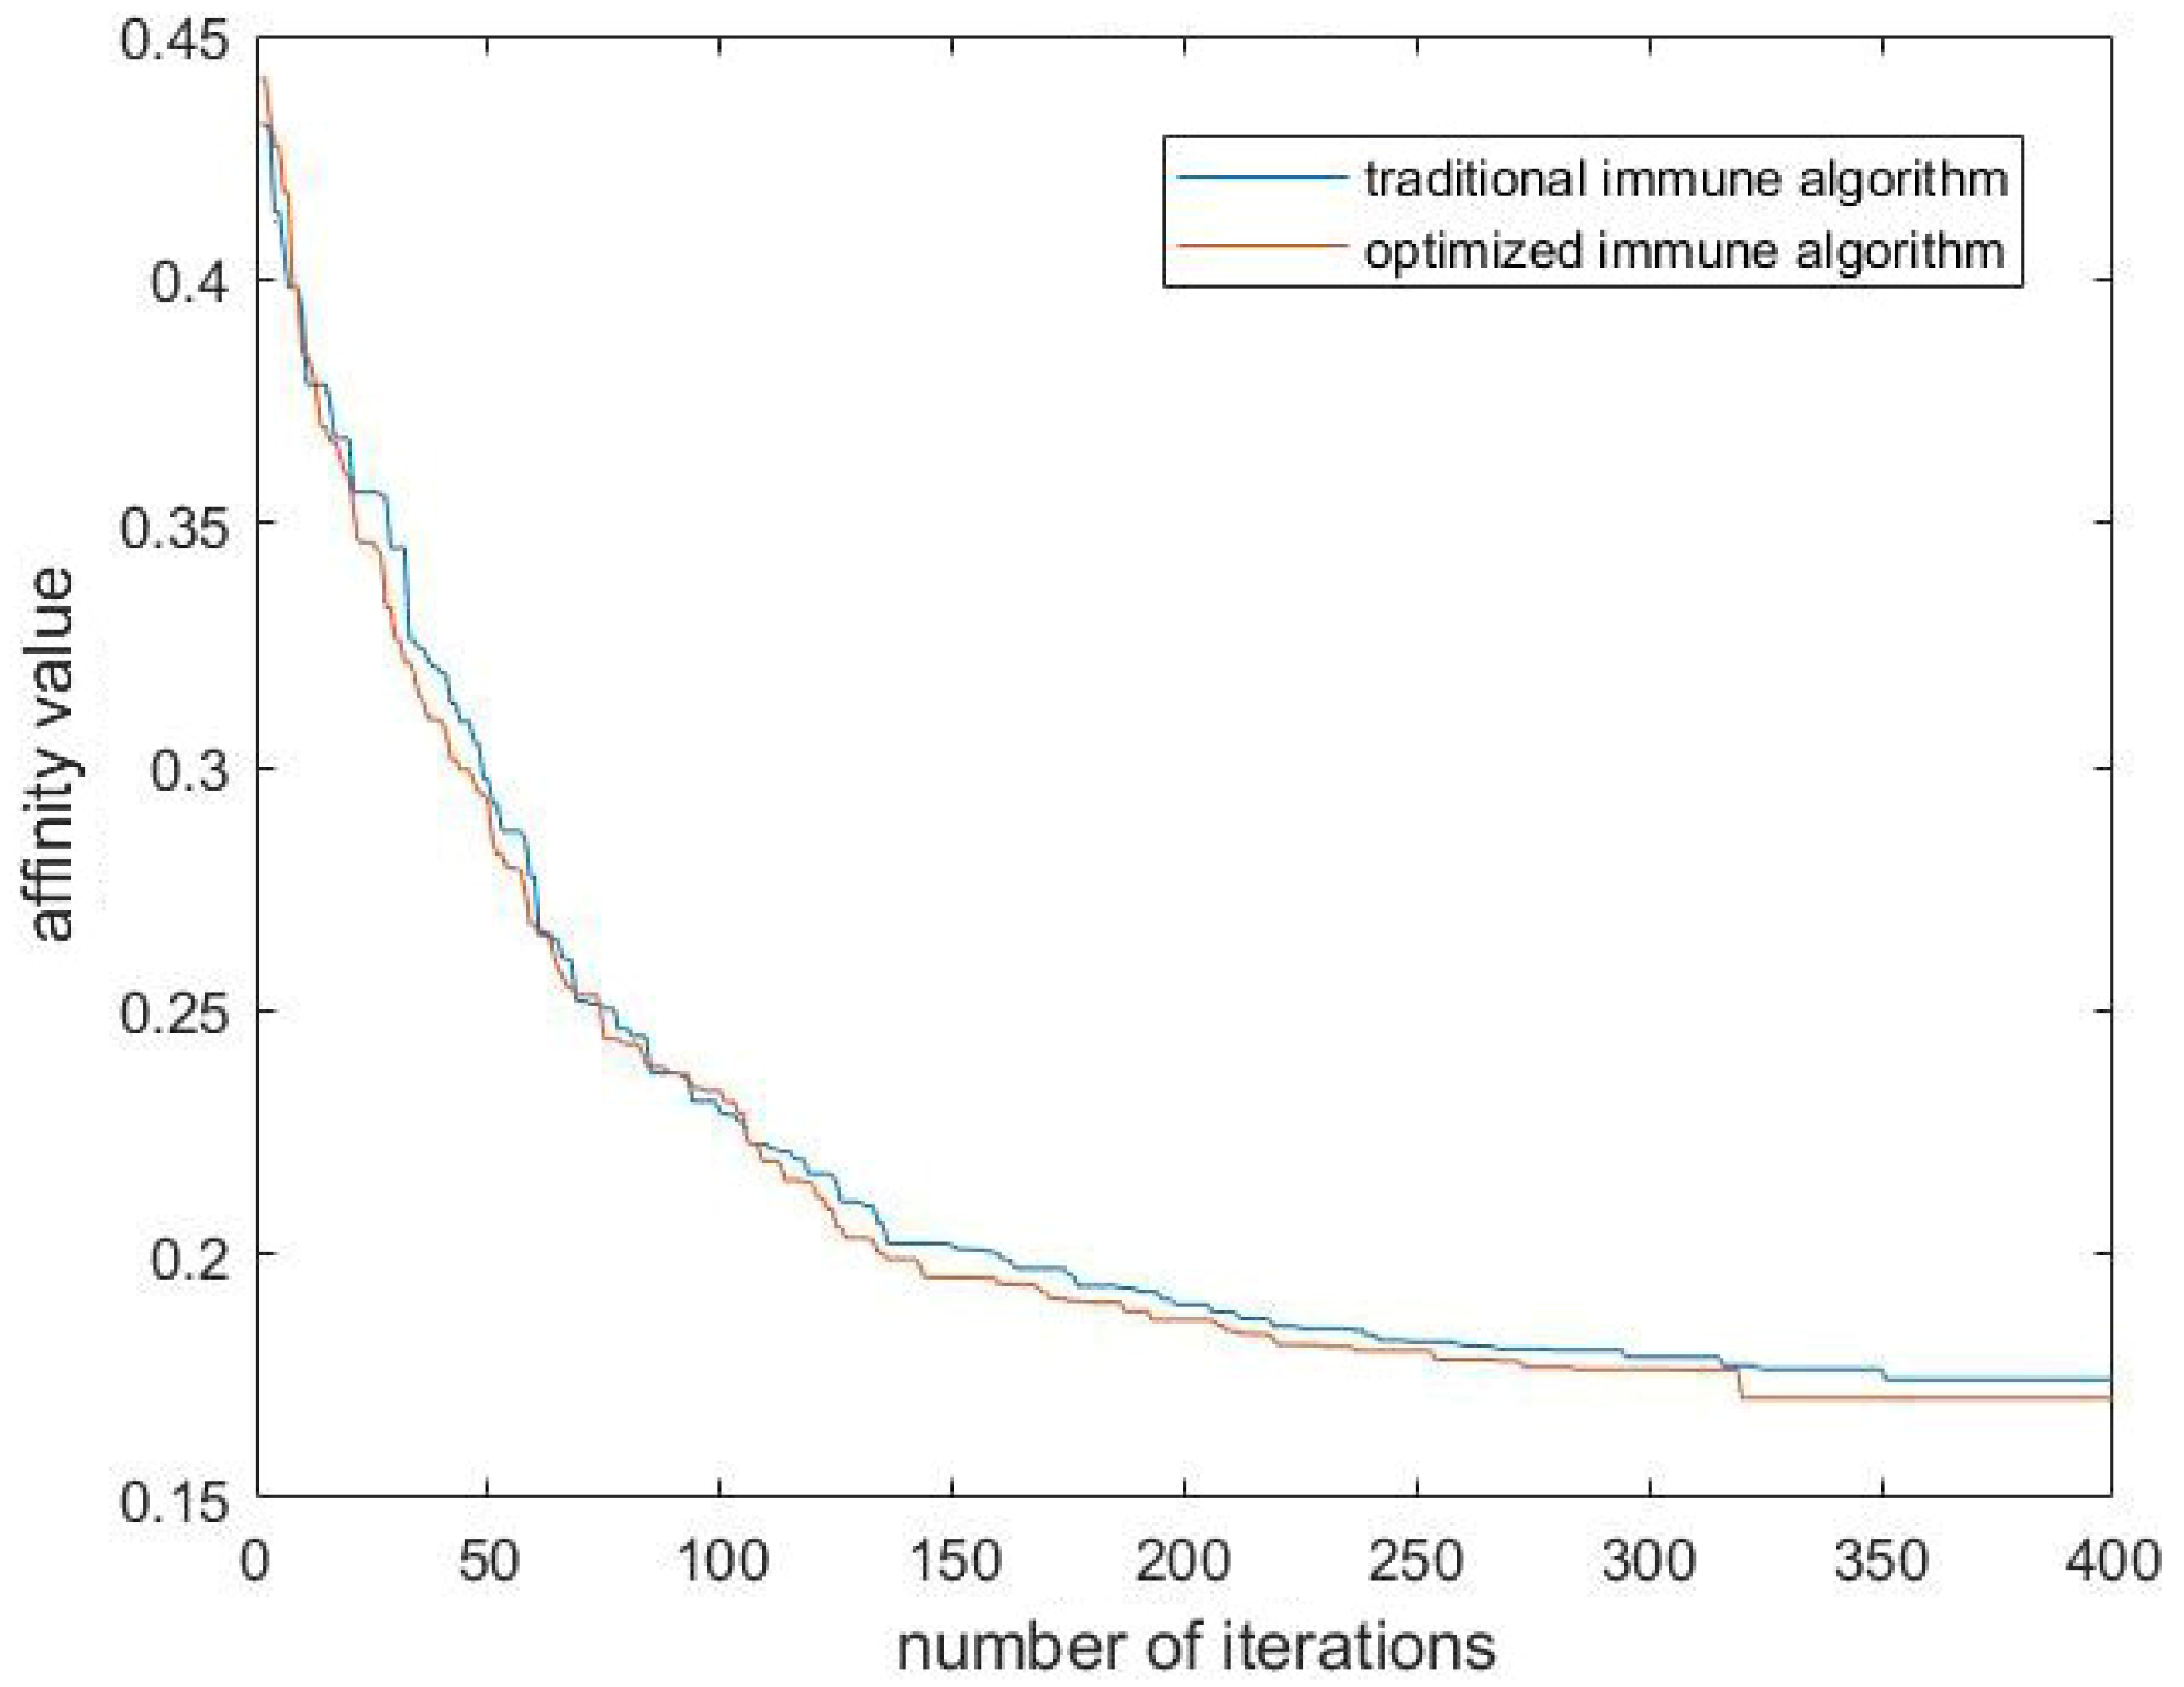
8.2. Algorithm Comparison

The traditional immune algorithm and the optimized immune algorithm were independently run 20 times. In Table 4, the optimal solution of the immune algorithm after optimization is 0.00518 smaller than that of the traditional immune algorithm. The average solution of the optimized immune algorithm is close to the optimal solution. The standard deviation of the optimized immune algorithm is 0.03131 smaller than that of the traditional immune algorithm. This shows that the calculation accuracy of the optimized immune algorithm is 0.00518 higher than that of the traditional immune algorithm. The search accuracy of the optimized immune algorithm is higher than that of the traditional immune algorithm. The stability of the optimized immune algorithm is 0.03131 higher than that of the traditional immune algorithm. Table 4 is the comparison of search accuracy and stability performance of the immune algorithm.
In Figure 11, the traditional immune algorithm and the optimized immune algorithm obtained the optimal solutions in the 351st generation and the 320th generation, respectively. The convergence speed of the optimized immune algorithm is 31 generations higher than that of the traditional immune algorithm. The convergence curves of the traditional immune algorithm and the optimized immune algorithm are as follows:

9. Conclusions

At present, China’s ratio of electric vehicles to their charging infrastructure is around 7:1. The lack of electric vehicle charging infrastructure and the unreasonable layout are the main factors restricting the development of the electric vehicle industry. In the stage, it is most suitable to determine the location scheme of electric vehicles based on the position of users.
In this paper, a user-based location scheme is proposed. To improve the location model of electric vehicle charging stations in the scheme, the highest charging convention goal is added in the model. The immune algorithm is optimized to improve the convergence speed, accuracy and stability of the immune algorithm for large cases. The optimization process includes two aspects: First, judging that the stop condition is added in the mutation link; second, designing two mutation operators in the optimized immune algorithm. Finally, the Lixia District of Jinan City is taken as the simulation by analyzing people’s willingness to buy electric vehicles. Through nuclear density analysis, the population quantity in the region is analyzed to determine the demand at the demand point.
The experimental results show that the electric vehicle location model in this paper serves 12 more demand points than the traditional electric vehicle location model. The average user density increased by 3%. The average charging convenience is 462 more than the traditional site-selection scheme. The performance improvement of the immune algorithm is as follows. The calculation accuracy of the optimized immune algorithm is 0.00518 higher. The search accuracy of the immune algorithm is higher. The stability of the optimized immune algorithm is 0.025 higher. The convergence speed of the optimized immune algorithm is 31 generations higher.
The user’s satisfaction and the charging convenience are considered in the paper. However, user travel rate is one of the important factors based on user position. Further considering user’s satisfaction, the charging convenience and user travel rate, the electric vehicle location model is established.

Author Contributions

Conceptualization, D.X., W.P. and Q.Z.; methodology, D.X. and W.P.; software, D.X.; validation, D.X., W.P. and Q.Z.; formal analysis, D.X., W.P. and Q.Z.; investigation, D.X. and W.P.; resources, D.X.; data curation, D.X., W.P. and Q.Z.; writing—original draft preparation, D.X.; writing—review and editing, W.P. and Q.Z.; visualization, D.X. and W.P.; supervision, W.P. and Q.Z.; project administration, W.P. and Q.Z.; funding acquisition, W.P. and Q.Z. All authors have read and agreed to the published version of the manuscript.

Funding

This research was funded by Shandong Provincial Natural Science FoundationShandong Provincial Natural Science Foundation, grant number ZR2020QF059, ZR2021MF131; Foundation of State Key Laboratory of Automotive Simulation and Control, grant number 20181119.

Institutional Review Board Statement

Not applicable.

Informed Consent Statement

Not applicable.

Data Availability Statement

Not applicable.

Conflicts of Interest

The authors declare no conflict of interest.

References

  1. Yan, G.; Liu, H.; Han, N. Optimization method for charging station location and capacity considering the spatiotemporal distribution of electric vehicles. Chin. J. Electr. Eng. 2021, 41, 1–14. [Google Scholar]
  2. Yu, J. Research and application of electric vehicle fast charging station site selection and capacity. Master Thesis, Northeast Agricultural University, Harbin, China, 2019. [Google Scholar]
  3. Hosseini, S.; Sarder, M.D. Development of a Bayesian network model for optimal site selection of electric vehicle charging station. Int. J. Electr. Power Energy Syst. 2019, 105, 110–112. [Google Scholar] [CrossRef]
  4. Guo, S.; Zhao, H. Optimal site selection of electric vehicle charging station by using fuzzy TOPSIS based on sustainability perspective. Appl. Energy 2015, 158, 390–402. [Google Scholar] [CrossRef]
  5. Ren, X.; Zhang, H.; Hu, R.; Qiu, Y. Location of Electric Vehicle Charging Stations: A Perspective Using the Grey Decision-making Model. Energy 2019, 173, 548–553. [Google Scholar] [CrossRef]
  6. Wu, Y.; Xie, C.; Xu, C.; Li, F. A Decision Framework for Electric Vehicle Charging Station Site Selection for Residential Communities under an Intuitionistic Fuzzy Environment: A Case of Beijing. Energies 2017, 10, 1270. [Google Scholar] [CrossRef]
  7. You, P.; Hsieh, Y. A hybrid heuristic approach to the problem of the location of vehicle charging stations. Comput. Ind. Eng. 2014, 70, 195–204. [Google Scholar] [CrossRef]
  8. Zhou, G.; Zhu, Z.; Luo, S. Location optimization of electric vehicle charging stations: Based on cost model and genetic algorithm. Energy 2022, 247, 0360–5442. [Google Scholar] [CrossRef]
  9. Jia, Y.; Xing, F. Site selection of electric vehicle charging station based on Satisfactory Optimization. J. Donghua Univ. 2017, 43, 1671–1680. [Google Scholar]
  10. Rezvani, Z.; Jansson, J. Advances in consumer electric vehicle adoption research: A review and research agenda. Transp. Res. Part D Transp. Environ. 2015, 34, 122–136. [Google Scholar] [CrossRef] [Green Version]
  11. Di, S. Research on Hierarchical Location Planning and Capacity Determination Method of Urban Electric Vehicle Charging Facilities. Master Thesis, Southeast University, Nanjing, China, 2017. [Google Scholar]
  12. Church, R.L.; ReVelle, C.S. Theoretical and computational links between the p-median location set-covering and the maximal covering location problem. Geogr. Anal. 1976, 8, 406–415. [Google Scholar] [CrossRef]
  13. Yang, F.; Hua, G.; Deng, M.; Li, J. Some advances in the study of location problem Operations. Res. Manag. 2002, 14, 1–7. [Google Scholar]
  14. Hakimi, S.L. Optimum locations of switching centers in a communication network and medians of graph. Oper. Res. 1964, 12, 450–459. [Google Scholar] [CrossRef]
  15. Lin, Z.; Ogden, J.; Fan, Y.; Chen, C.W. The Fuel-Travel-Back Approach to Hydrogen Station Siting. Int. J. Hydroge. Energy 2008, 33, 3096–3101. [Google Scholar] [CrossRef] [Green Version]
  16. Wang, Y.; Wang, C.R. Locating Passenger Vehicle Refueling Stations. Transp. Res. Part E 2010, 46, 791–801. [Google Scholar] [CrossRef]
  17. Wang, Y.W.; Wang, C.R. Locating multiple types of recharging stations for battery powered electric vehicle transport. Transp. Res. Part E Logist. Transp. Rev. 2013, 58, 76–87. [Google Scholar] [CrossRef]
  18. Zhao, S.; Li, Z. Optimal planning of urban electric vehicle charging station based on differential evolution particle swarm optimization algorithm Draw. J. North China Electr. Power Univ. (Nat. Sci. Ed.) 2015, 42, 1–7. [Google Scholar]
  19. Hui, W.; Guibin, W.; Junhua, Z. Electric vehicle charging station planning considering traffic network flow. Powersystem Autom. 2013, 37, 63–69. [Google Scholar]
  20. Song, Z.; Wang, X.; Lun, L. Location planning of electric vehicle charging station based on revenue maximization. East China J. Jiaotong Univ. 2014, 31, 50–55. [Google Scholar]
  21. Zhang, D.; Jiang, J.; Zhang, W. Economic operation of electric vehicle replacement station based on genetic algorithm. Power Grid Technol. 2013, 8, 2101–2107. [Google Scholar]
  22. Riemann, R.; Wang, D.Z.W.; Busch, F. Optimal location of wireless charging facilities for electric vehicles: Flow-capturing location model with stochastic user equilibrium. Transp. Res. Part C Emerg. Technol. 2015, 58, 1–12. [Google Scholar] [CrossRef]
  23. Ge, S.; Feng, L.; Liu, H. Electric vehicle charging station planning considering user convenience. Electr. Energy Electr. New Technol. 2014, 33, 70–75. [Google Scholar]
  24. Ren, Y.; Shi, L.; Zhang, Q.; Han, W.; Huang, S. Study on the optimal distribution and scale of electric vehicle charging stations. Power Syst. Autom. 2011, 35, 53–57. [Google Scholar]
  25. Sun, X.; Liu, K.; Zuo, Z. Layout model of electric vehicle charging station considering time and space constraints. Land Prog. Sci. 2012, 6, 686–692. [Google Scholar]
  26. Jerne, N.K. Towards a network theory of the immune system. Annu. Immunol. 1974, 125, 373–389. [Google Scholar]
  27. Liu, Z.; Li, Z.; Chen, W.; Zhao, Y.; Yue, H.; Wu, Z. Path Optimization of Medical Waste Transport Routes in the Emergent Public Health Event of COVID-19: A Hybrid Optimization Algorithm Based on the Immuneâ “Ant Colony Algorithm. Int. J. Environ. Res. Public Health 2020, 17, 5831. [Google Scholar] [CrossRef]
  28. Li, R.; Ma, L.; Liu, Y. Site selection simulation of capacity-limited factory based on improved immune algorithm. Comput. Simul. 2021, 38, 401–405. [Google Scholar]
  29. Yıldız, A.R. A novel hybrid immune algorithm for global optimization in design and manufacturing. Robot. Comput.-Integr. Manuf. 2009, 25, 261–270. [Google Scholar] [CrossRef]
  30. Zhang, L.; Lu, J. Improved immune algorithm to solve TSP problem. Comput. Eng. Des. 2005, 4, 978–980+984. [Google Scholar]
  31. Meng, W.C.; Qiu, J.J.; Bian, X.M. Artificial immune algorithm integrated with chaotic optimization for economic dispatch of power system. Power Syst. Technol. 2006, 23, 41–44. [Google Scholar]
  32. Wang, B.; Hu, J.; Zhang, K.; Li, X.; Zhang, Y.; Sun, S. Research and Application of Improved Immune Algorithm Based on Solution Space Oriented Optimization. Firepower Command. Control. 2020, 45, 64–67. [Google Scholar]
  33. Ping, H.; Song, C.; Jiang, J.Q. Application of self-adaptive mutation immune algorithm in logistics distribution. J. Inn. Mong. Univ. Natl. Nat. 2017, 32, 406–411. [Google Scholar]
  34. Xu, Y.; Zhang, J. Regional Integrated Energy Site Layout Optimization Based on Improved Artificial Immune Algorithm. Energies 2020, 13, 4381. [Google Scholar] [CrossRef]
  35. Cao, X.; Hu, P.; Liu, D. Research progress on site selection of electric vehicle charging stations. Adv. Geogr. Sci. 2019, 38, 139–152. [Google Scholar]
  36. Dong, J.; Liu, C.; Lin, Z. Charging infrastructure planning for promoting battery electric vehicles: An activity—Based approach using multiday travel data. Transp. Res. Part C Emerg. Technol. 2014, 38, 44–55. [Google Scholar] [CrossRef] [Green Version]
  37. Sathaye, N.; Kelley, S. An approach for the optimal planning of electric vehicle infrastructure for highway corridors. Transp. Res. Part E Logist. Transp. Review. 2013, 59, 15–33. [Google Scholar] [CrossRef]
  38. Li, N.; Xu, G. Grid analysis of land use data based on natural discontinuous point classification method. Bull. Surv. Mapp. 2020, 60, 106–110+156. [Google Scholar]
  39. Ma, Y.; Yang, C.; Zhang, M. The problem of maximum coverage location selection based on time satisfaction. Chin. Manag. Sci. 2006, 14, 45–51. [Google Scholar]
  40. Zhou, Y.; Zhang, H.; Ma, L. Improved immune algorithm for solving hierarchical and progressive location problem of emergency medical facilities. J. Oper. Res. 2021, 25, 15–34. [Google Scholar]
Figure 1. User satisfaction evaluation function.
Energies 15 05027 g001
Figure 2. Crossover process.
Energies 15 05027 g002
Figure 3. Mapping substitution process.
Energies 15 05027 g003
Figure 4. The mutation process of the mutation operator c .
Energies 15 05027 g004
Figure 5. Flowchart of mutation operator d.
Energies 15 05027 g005
Figure 6. The mutation process of mutation operator d.
Energies 15 05027 g006
Figure 7. Regional weight value.
Energies 15 05027 g007
Figure 8. Distribution of pending points and demand points.
Energies 15 05027 g008
Figure 9. Population kernel density analysis.
Energies 15 05027 g009
Figure 10. Site-selection scheme.
Energies 15 05027 g010
Figure 11. Immune algorithm convergence curve.
Energies 15 05027 g011
Table 1. The scoring standard table.
DegreeScore
Big impact5
Greater impact4
General impact3
Lesser impact2
No impact1
Table 2. Sensitivity analysis of the number of electric vehicle charging stations constructed.
Number of Sites BuiltAverage Satisfaction
5160.63%
5265.82%
5374.7%
5479.94%
5583.18%
5685.04%
Table 3. Comparison of two site-selection schemes.
Average Service CapacityAverage User DensityAverage Charging Convenience
Traditional site selection11670%4195
Site-selection plan in this paper12873%4657
Table 4. The comparison of search accuracy and stability performance.
Optimal SolutionAverage SolutionStandard Deviation
Traditional immune algorithm0.174930.211100.04843
Optimized immune algorithm0.169750.183910.01712
Publisher’s Note: MDPI stays neutral with regard to jurisdictional claims in published maps and institutional affiliations.

