Article

Numerical Simulation of Gaseous Detonation Performance and Wall Reflection Effect of Acetylene-Rich Fuel

1
College of Energy and Power Engineering, Nanjing University of Aeronautics and Astronautics, 29 Yudao St., Nanjing 210016, China
2
Aero-Engine Thermal Environment and Structure Key Laboratory of Ministry of Industry and Information Technology, Nanjing University of Aeronautics and Astronautics, Nanjing 210016, China
*
Author to whom correspondence should be addressed.
Energies 2022, 15(14), 4985; https://doi.org/10.3390/en15144985
Submission received: 20 May 2022 / Revised: 1 July 2022 / Accepted: 6 July 2022 / Published: 7 July 2022
(This article belongs to the Section I2: Energy and Combustion Science)

Abstract

:
The efficient utilization of energy in rich fuel detonation processes and the effective control method of soot are important topics in combustion research. In this paper, we numerically study the detonation wave behavior of acetylene–air systems in rich fuel condition by using a reduced reaction mechanism. The non-stiff terms of the governing equations are solved explicitly using the gas kinetic scheme, and the stiff terms are solved implicitly. Our results show that the acetylene pyrolysis is the dominant reaction process. The oxidation reaction is exploited to initiate the reaction induction process, providing the required energy to overcome the potential energy barrier. The secondary detonation structure is due to the stable interaction of the transverse waves and the combined action of the vinyl reaction system, thus effectively improve the energy release rate and providing a powerful solution for the fuel-rich high-energy release of advanced heat engines. The area of the unreacted pocket increases with the acetylene concentration, resulting in an irregular wave-front and detonation cell. The reflected shock wave impacting on the wall induces the secondary reaction of the detonation products. The concentration of polycyclic aromatic hydrocarbons decreases significantly and regenerates near the wall. Our approach provides an effective tool for controlling detonation soot and the preparation of carbon particles.

1. Introduction

Detonation is an efficient combustion method. However, it is also quite destructive. The reliable control and effective use of this process comprise the main current research directions. Acetylene is the most important fuel for studying detonation because of its instability. This fuel can not only detonate when mixed with oxygen, but also form self-sustained detonation in oxygen-free environments [1,2,3], even releasing more energy [4]. Acetylene is a key intermediate in the formation of PAHs (polycyclic aromatic hydrocarbons) during the combustion of hydrocarbon fuels [5] and has its reactive characteristics during the detonation of hydrocarbon fuels. Understanding the acetylene-rich detonation process is important in several fields, including the combustion efficiency of actual gas phase fuel [6,7,8], material preparation [9,10], human health effects [11], and astrophysical explosion process [12]. In particular, it is relevant to understand the propagation of the acetylene-rich detonation process and the component distribution behind the detonation wave-front, as well as the consumption and regeneration process. Moreover, it is of great significance to understand the explosion behavior of high-concentration hydrocarbon fuels in caves and tunnels. In fact, the detailed analysis of the wall reflection mechanism of detonation is crucial to describe the behavior of the reflected shock wave on the species after the detonation wave, which is of theoretical significance for understanding the propagation process of the detonation wave in a confined space or a closed space. The secondary damage caused by the reflected shock wave formed after the impact on the wall during the detonation process may be also better controlled.
These topics are also relevant for the preparation of carbon materials and the reduction in the emission of soot and may provide a deeper understanding about the overall dynamics of the process, paving the way for the macro-scale and controllable preparation of promising carbon nanoparticles. Finally, efficient energy release and effective soot control scheme for the potential applications to high-power new heat engines based on acetylene.
To design an efficient dynamic cycle based on the acetylene detonation process and to reduce PAHs production or yield fixed-structure carbon nanoparticles, one requires a reliable knowledge of the dynamics and thermodynamics of each stage of acetylene oxidation and pyrolysis, as well as the subsequent formation of carbon particles. Although it has been known for a long time that the self-decomposition phenomenon exists in the detonation process of acetylene [13], there are few detailed studies on detonation wave induction and heat release process. The main difficulty in studying these phenomena lies in the presence of a large number of intermediates and complex reaction processes in the growth of PAHs after the detonation and the shock waves.
In order to study the detonation behavior of acetylene, a large number of numerical calculations and experiments have been carried out. Guilly et al. [14] performed lossless 2D axisymmetric numerical simulations of the detonation propagation process diluted by Ar under acetylene oxygen stoichiometry in an 80 mm inner diameter circular tube by considering two irreversible exothermic reactions. Results for different experimental conditions have been obtained, providing the time between the leading shock and the maximum reaction rate, namely the induced reaction time. Results are in good agreement with experiment. Smirnov et al. [15] used a simplified acetylene combustion kinetic model, consisting in 11 reactions involving nine components, introducing a mathematical model to study the detonation reaction of acetylene mixed with different proportions of oxygen. The transition from deflagration to detonation has been studied in a cylindrical tube with a section of obstruction.
Emelianov et al. [2] experimented with the formation of shock-induced condensation waves of carbon nanoparticles after the self-decomposition of C2H2. Results show that the reaction C2H2 = H2 + soot releases a lot of heat and forms self-sustaining condensation waves under high pressure. Batraev et al. [16] studied the detonation of mixtures of acetylene and oxygen in a range of over-rich concentrations. The detonation cell size and the detonation velocity have been measured to study the complex characteristics of the detonation products transformation from pure gas to heterogeneous mixtures and the corresponding influence on the detonation waves.
Although a large number of experiments and numerical simulations have been carried out on the detonation process of acetylene, the specific features of the process in fuel-rich conditions did not receive proper attention. This paper aims to analyze the structure and self-sustaining propagation of detonation waves for acetylene–air mixtures in rich-fuel conditions, as well as the compositional changes and complex dominant reaction conversion process involved in oxidation and pyrolysis processes underlying detonation.
In order to analyze the propagation of detonation waves, high-precision schemes are usually employed [17,18,19,20,21,22], and results help understand the detailed propagation process and mechanism analysis of detonation waves. However, in the presence of multi-component and multi-element reactions, this approach may be computationally very expensive. We thus employ a second-order precision solution method based on gas kinetic equations [23,24]. This method satisfies the entropy condition and is positivity-preserving. The method solves the macro process using the micro parameters, such that the subtle viscous properties has better precision for capturing shock waves [25]. MUSCL reconstruction with Van Albada limiter [26,27] is used to suppress the nonphysical oscillations of the shock discontinuity. On the other hand, in the recent study of the combustion process of a new type of fossil fuel, a gas–solid coupled combustion calculation method is provided [28], which is advantageous for predicting the particle formation process in the detonation process. However, it still has many limitations of shock wave capture and composition preservation; thus, it cannot be well adapted to the simulation of hypersonic reaction flow.
Compared to the traditional methods of solving NS, the gas kinetics scheme (GKS) has good features that the solution process of the chemical reaction source term can be easily iterated in a loose coupling manner. To reduce stiffness, an implicit iteration method is adopted for the source term of chemical reaction, such as to enhance the stability and efficiency of calculations. GKS maintains the second-order accuracy both in time and space, and the implicit time iteration of the source term is performed with second-order accuracy.
The accuracy of numerical results depends not only on the algorithm used to solve the problem but also on the prediction of acetylene oxidation and self-decomposition reactions. The rapid development of elementary reactions of acetylene and hydrocarbon fuels in recent years has produced a large number of reaction rate coefficients with reliable precision [29]. Many general chemical reaction mechanisms for the formation of PAHs have been proposed [30,31,32,33]. Using sensitivity and flux analysis, a simplified acetylene reaction model was obtained for numerical calculations.

2. Materials and Methods

2.1. Numerical Modeling

2.1.1. Governing Equation

The governing equations are multi-component Euler equations. For the solution of multicomponent flow, here, we mainly focus on the two-dimensional N-component Euler equation, which is expressed as follows:
ρ 1 ρ 2 ρ N ρ U ρ V ρ E t + ρ 1 U ρ 2 U ρ N U ρ U 2 + p ρ U V U ρ E + p x + ρ 1 V ρ 2 V ρ N V ρ U V ρ V 2 + p V ρ E + p y = 0 ,
where ρ 1 , ρ 2 , , ρ N is the density of the components participating in the reaction, ρ = i = 1 N ρ i is the total density, ρ E = i = 1 N ρ i E i is total energy included the total energy of kinetic energy and thermal energy, and U and V are the average flow velocity in the x and y directions, respectively. Each component has its specific heat capacity γ s . p = i = 1 N p i is the total pressure. The equation of state can be expressed as p i = ρ i R i T .

2.1.2. Reduced Chemical Kinetics Model

This paper is based on the mechanism of Burke [34], Glarborg [35], HP-Mech [36], Norinaga et al. [37], and Liu et al. [38]; by conducting flux and sensitivity analyses of components, a simplified mechanism adapting to the reaction characteristics of acetylene rich at high temperature and high pressure is presented. The mechanism consists of 90 species and 179 reactions. Of these, 53 reactions involve O atoms, and 70 reactions were above C6.
The mechanism is mainly based on hydrogen abstraction C2H2 addition (HACA) and hydrogen abstraction vinyl acetylene addition (HAVA), which mainly reflects the formation process of initial carbon molecules, and the polycyclic aromatic hydrocarbon precursors contain the main components of C6~C16. The thermochemical species properties are calculated using the National Aeronautics and Space Administration (NASA) thermochemical polynomials.

2.1.3. Numerical Methods

For the two-dimensional problem, the BGK model controlled by the time evolution of N components is described as follows:
f i t + u f i = g i f i τ i = 1 , 2 , , N ,
where f i is the gas distribution function of each component, and τ is the collision time. The compatibility condition of the multicomponent BGK model satisfied by the equilibrium state is described as follows:
i = 1 N ( g i f i ) ψ i d Ξ i = 0 ,
where ψ i = ( 1 , u , v , 1 2 ( u 2 + v 2 + ξ i 2 ) ) . In this multicomponent model, for the equilibrium state under Euler’s equation, the vigorous exchange of momentum and energy, with the same velocity and temperature, has the following form:
g i = ρ i λ 0 π K i + 2 2 e λ 0 ( ( u U 0 ) + ξ i 2 ) .
Based on a finite volume element, in order to update the parameter variables in the element, a numerical flux calculation formula with an integration time t of is constructed at the element interface x j + 1 / 2 based on the gas kinetic model:
f i x j + 1 / 2 , t , u , v , ξ i = 1 τ 0 t g i x , u , v , ξ i e t t / τ d t + e t / τ f i 0 x j + 1 / 2 u t , u , v , ξ i i = 1 , 2 , , N ,
where x j + 1 / 2 is the location of the cell interface, x = x j + 1 / 2 u t t is particle path. f 0 s is the initial gas distribution function of the component i at the beginning t = 0 for each time step, and g i is the corresponding equilibrium state. The distribution function f i x j + 1 / 2 , t , u , v , ξ i for the x-direction at cell interface x j + 1 / 2 can be expressed as follows.
f i ( x j + 1 / 2 , t , u , v , ξ i ) = ( 1 e t / τ ) g i + τ ( t / τ 1 + e t / τ ) A ¯ i g i + ( ( t + τ ) e t / τ τ ) ( ( a ¯ i l H ( u ) + a ¯ i r ( 1 H ( u ) ) ) u + b ¯ i v ) g i + e t / τ ( 1 u t a i l v t b i l ) H ( u ) g i l + e t / τ ( 1 u t a i r v t b i r ) ( 1 H ( u ) ) g i r
Through the spatial numerical reconstruction of the macroscopic flow variables, the equilibrium states g i l and g i r of each component can be determined.
Finally, by taking the moments of the gas distribution function f s 0 , 0 , t , the time-varying numerical fluxes of the component gases at the cell interface can be obtained as follows.
F ρ 1 F ρ 2 F ρ N F ρ U F ρ V F ρ E j + 1 / 2 = i = 1 N     u ϕ i f i x j + 1 / 2 , t , u , v , ξ i d Ξ i .
After obtaining the flux function through the cell interface, we need to solve the ODE to account for the source term, W t = S . The update of the flow variable in cell i , j from step n to step n + 1 is achieved by the formula:
W i , j n + 1 = W i , j n + 1 Δ V i , j e = 1 B i , j Δ l e 0 Δ t F e d t + Δ t S i , j ,
where S i , j is the corresponding source phase in cell i , j , Δ l e is the interface length, F e is the numerical flux at interface e obtained by multicomponent GKS, B i , j is the number of interfaces corresponding to cell i , j , and Δ V i , j is the cell for two-dimensional cells area of i , j .
Taylor expansion of the source term S i , j , ignoring the higher-order terms, can be obtained as follows.
S n + 1 = S n + S W δ W n .
When i = 1 , 2 , 3 , N , j = 1 , 2 , 3 , N , we obtain the following.
S i W j = ω ˙ i ρ j .
To simplify the operation process, for S i / W j = 0 if i j . For the source term of the energy equation, we have the following.
ω ˙ e ρ ϵ = i = 1 s ρ i ω ˙ i q i ρ ϵ = i = 1 s q i ρ i T T ρ ϵ ω ˙ i + ρ i ω ˙ i T T ρ ϵ .
The partial derivative with respect to temperature is as follows.
T ρ j = 1 ρ c v U 2 + V 2 2 c v j T ,   T ρ ϵ = 1 ρ c v .
Productivity ω ˙ i of the i-th species can be written as the sum of the progression rate variables for all reactions involving the i-th species:
ω ˙ i = k = 1 R v k , i σ i , i = 1 , , N ,
where v k , i = v k , i v k , i . Superscript ′ denotes the forward stoichiometric coefficient, while ″ denotes the reverse stoichiometric coefficient.
The progression rate variable σ i for the k-th reaction is given by the difference between the forward and reverse rates:
σ i = k f , k i = 1 N X i v k , i k r , k i = 1 N X i v k , i ,
where X i is the molar concentration of the i-th species, and k f , k and k r , k are the forward and reverse rate constants for the k-th reaction, respectively.

2.1.4. Initial and Boundary Condition

Numerical simulations reveal the evolution mechanism of the free-propagating cellular structure and reaction-induced transition of acetylene–air rich fuels at different equivalence ratios in two-dimensional space. The unburned mixture gas is a completely mixed gas with acetylene and air distributed according to the equivalent ratio (ER), and the initial pressure and temperature are 1 atm and 300 K, respectively. The global uniform mesh size is fixed at 5 × 10⁻⁶ m.
In order to quickly obtain a stable propagating detonation wave structure, the initial calculation uses the CJ-state as the post-detonation wave parameter. Time step d t = min ( Δ t CFL , 5 × 10 10 ) . No artificial disturbance was added to the calculation, and the transverse wave can be formed spontaneously after 5 µs. Moreover, the detonation wave-front is gradually strengthened, forming the positive feedback of shock wave amplification by coherent energy release (SWCER). After 20 µs, the detonation wave structure is stable, and the data used in this paper are about 30 µs, which guarantees a fully developed detonation structure. The extrapolation boundary condition and the Neumann boundary condition are applied to the inlet and outlet, respectively. The slip-wall boundary condition was used at the top and bottom walls.

2.2. Numerical Method Verification

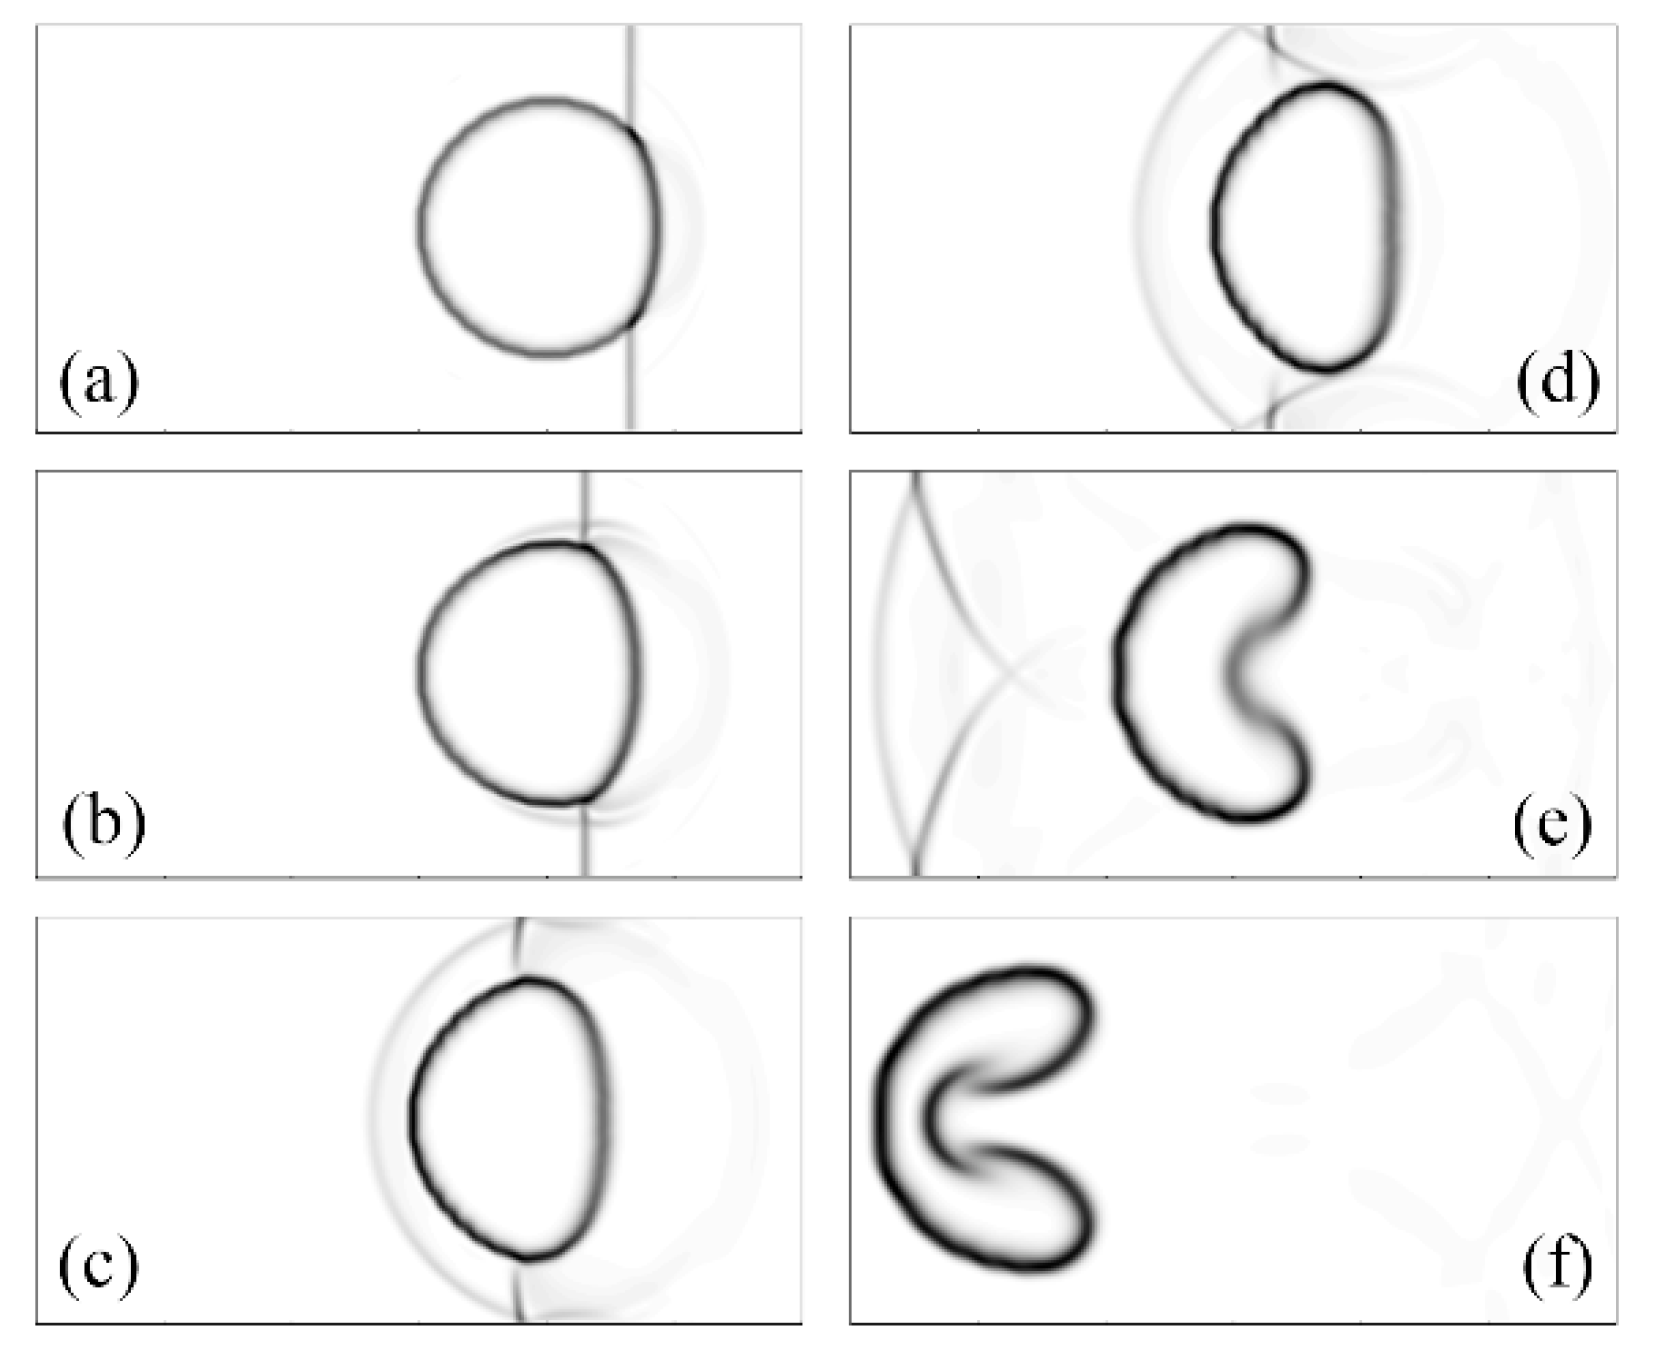
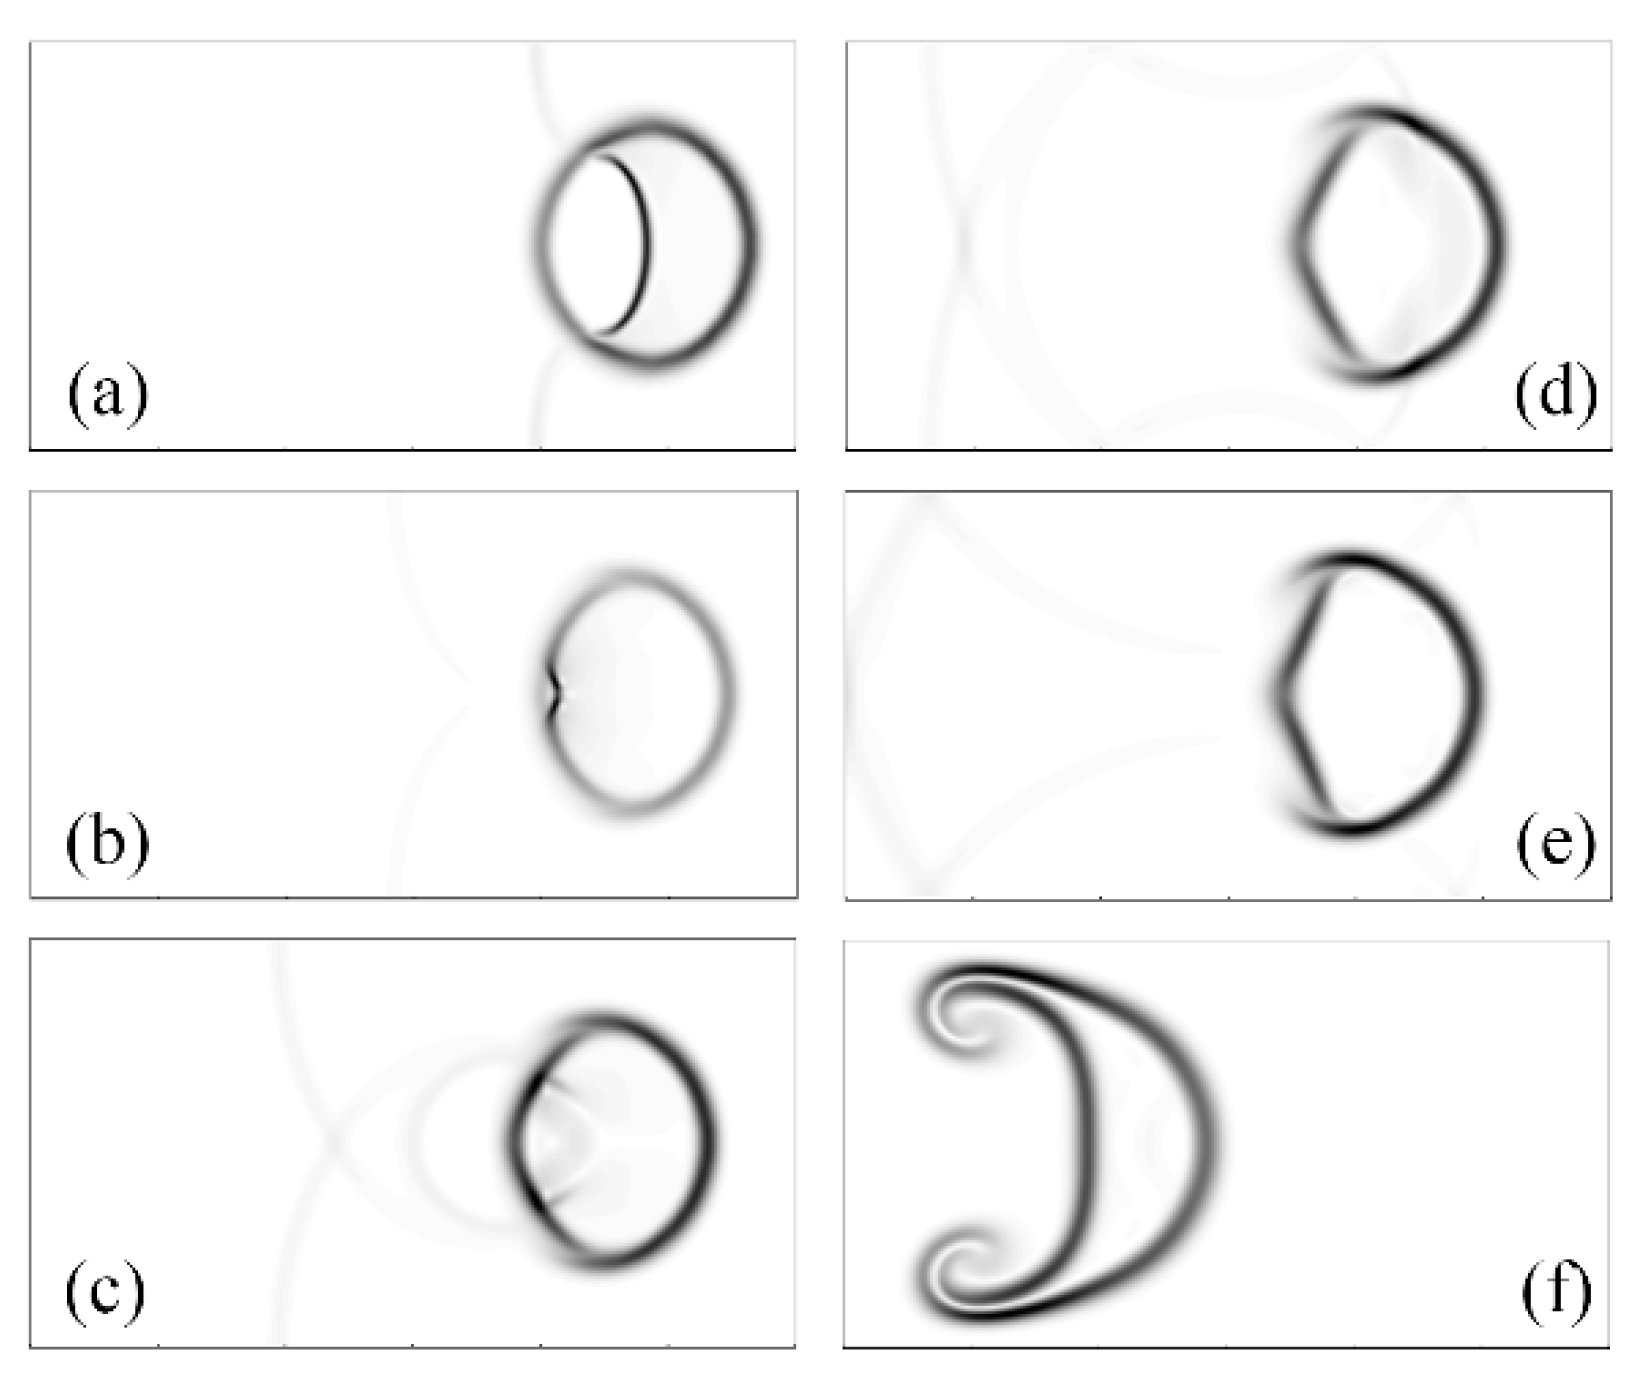
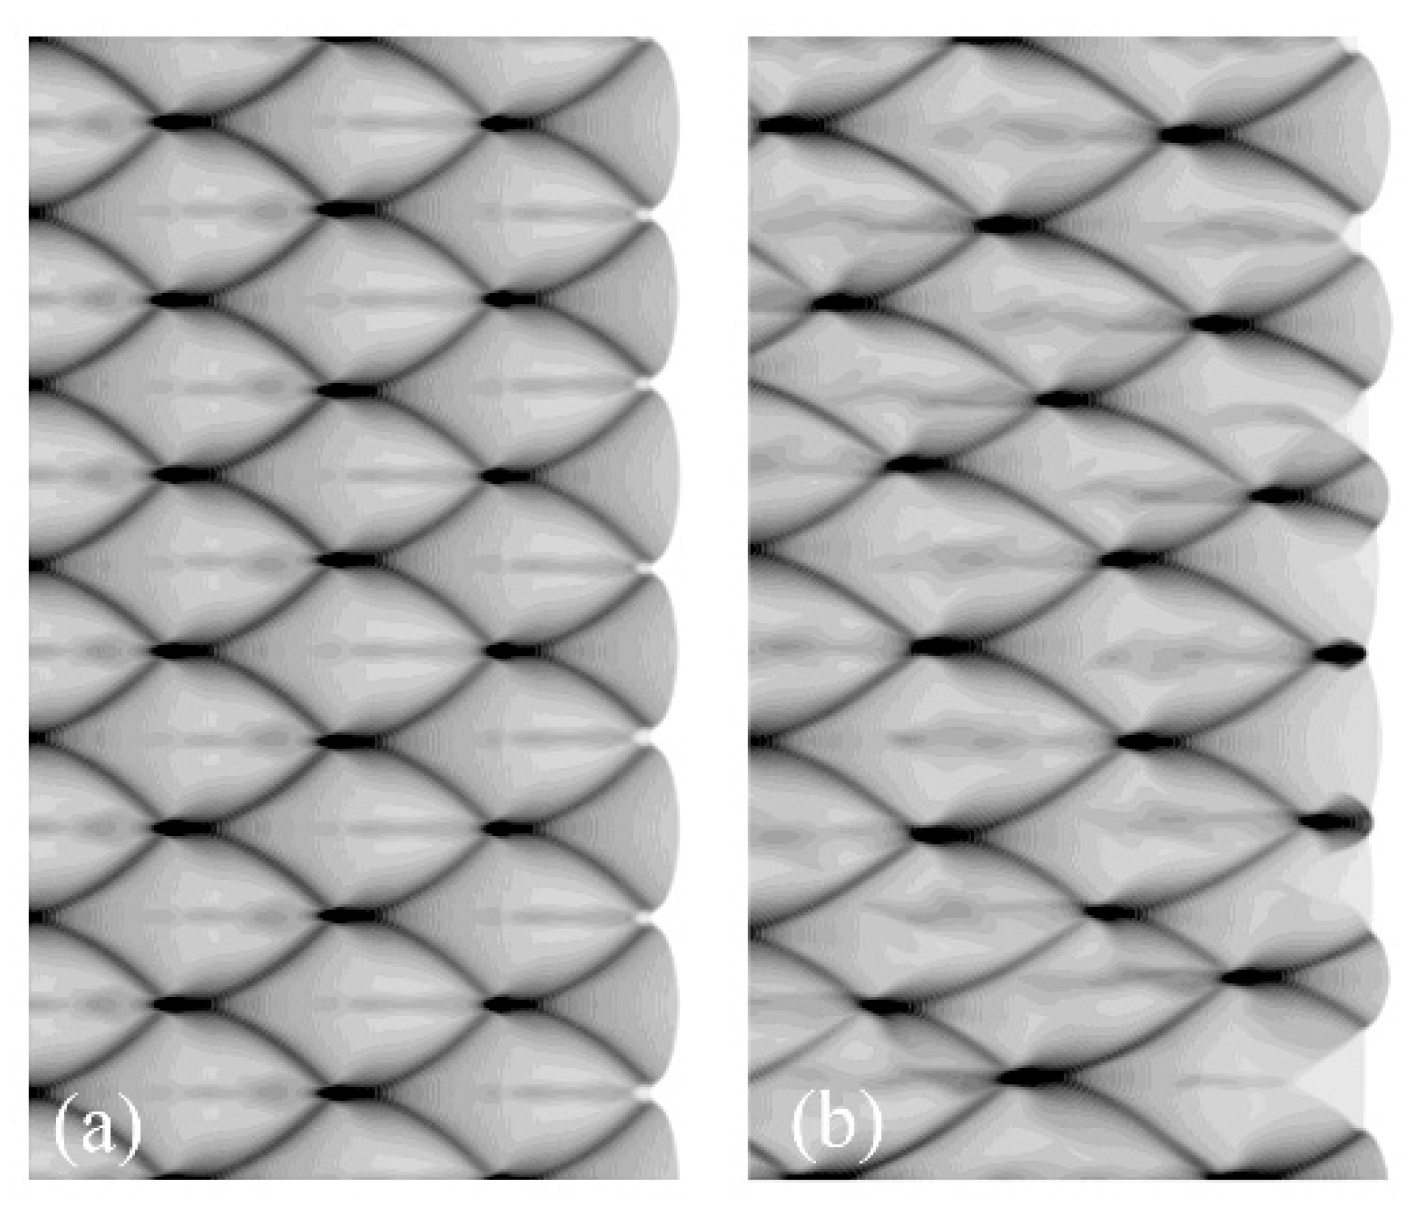
2.2.1. Interaction of Shock Waves and Bubbles

In order to assess whether our method is effective capturing the interaction between the shock wave and the multi-component interface, specific situations are considered. The situation is the classical shock–bubble interaction problem. This is the collision process between a shock wave and circular bubble in air. In this case, the right Mach 1.22 shock propagates to the left, passing through a bubble with a radius of 25 mm located in the center of the channel. The computing space consists of a 900 × 160 uniform grid. The upper and lower boundary conditions correspond to sliding walls, whereas the left and right boundaries are assumed to fulfil the non-reflection outflow condition. For a detailed description of geometric conditions and initial settings, see Ref. [24].
The density gradient of numerical calculation results is shown in Figure 1 and Figure 2. The numerical simulations well reproduce the bubble change process observed in experiments [39]. Before the shock wave hits the bubble, due to the natural diffusion property in the numerical format, which is the intrinsic dissipation term, the boundary of the bubble cannot be kept in a relatively clear state. The two species will interpenetrate and generate vibrations. These oscillations reach the boundaries and are reflected back. However, the impact of the entire process is negligible and can be ignored. When the shock wave hits the bubble, the initial shock wave splits into two parts. The first one turns into a reflected shock due to density changes. The other part transfers energy to the internal part of the bubble, giving birth to a new propagating shock wave. Compared to experimental results, numerical simulations are able to reproduce the features of the entire process in a consistent way.

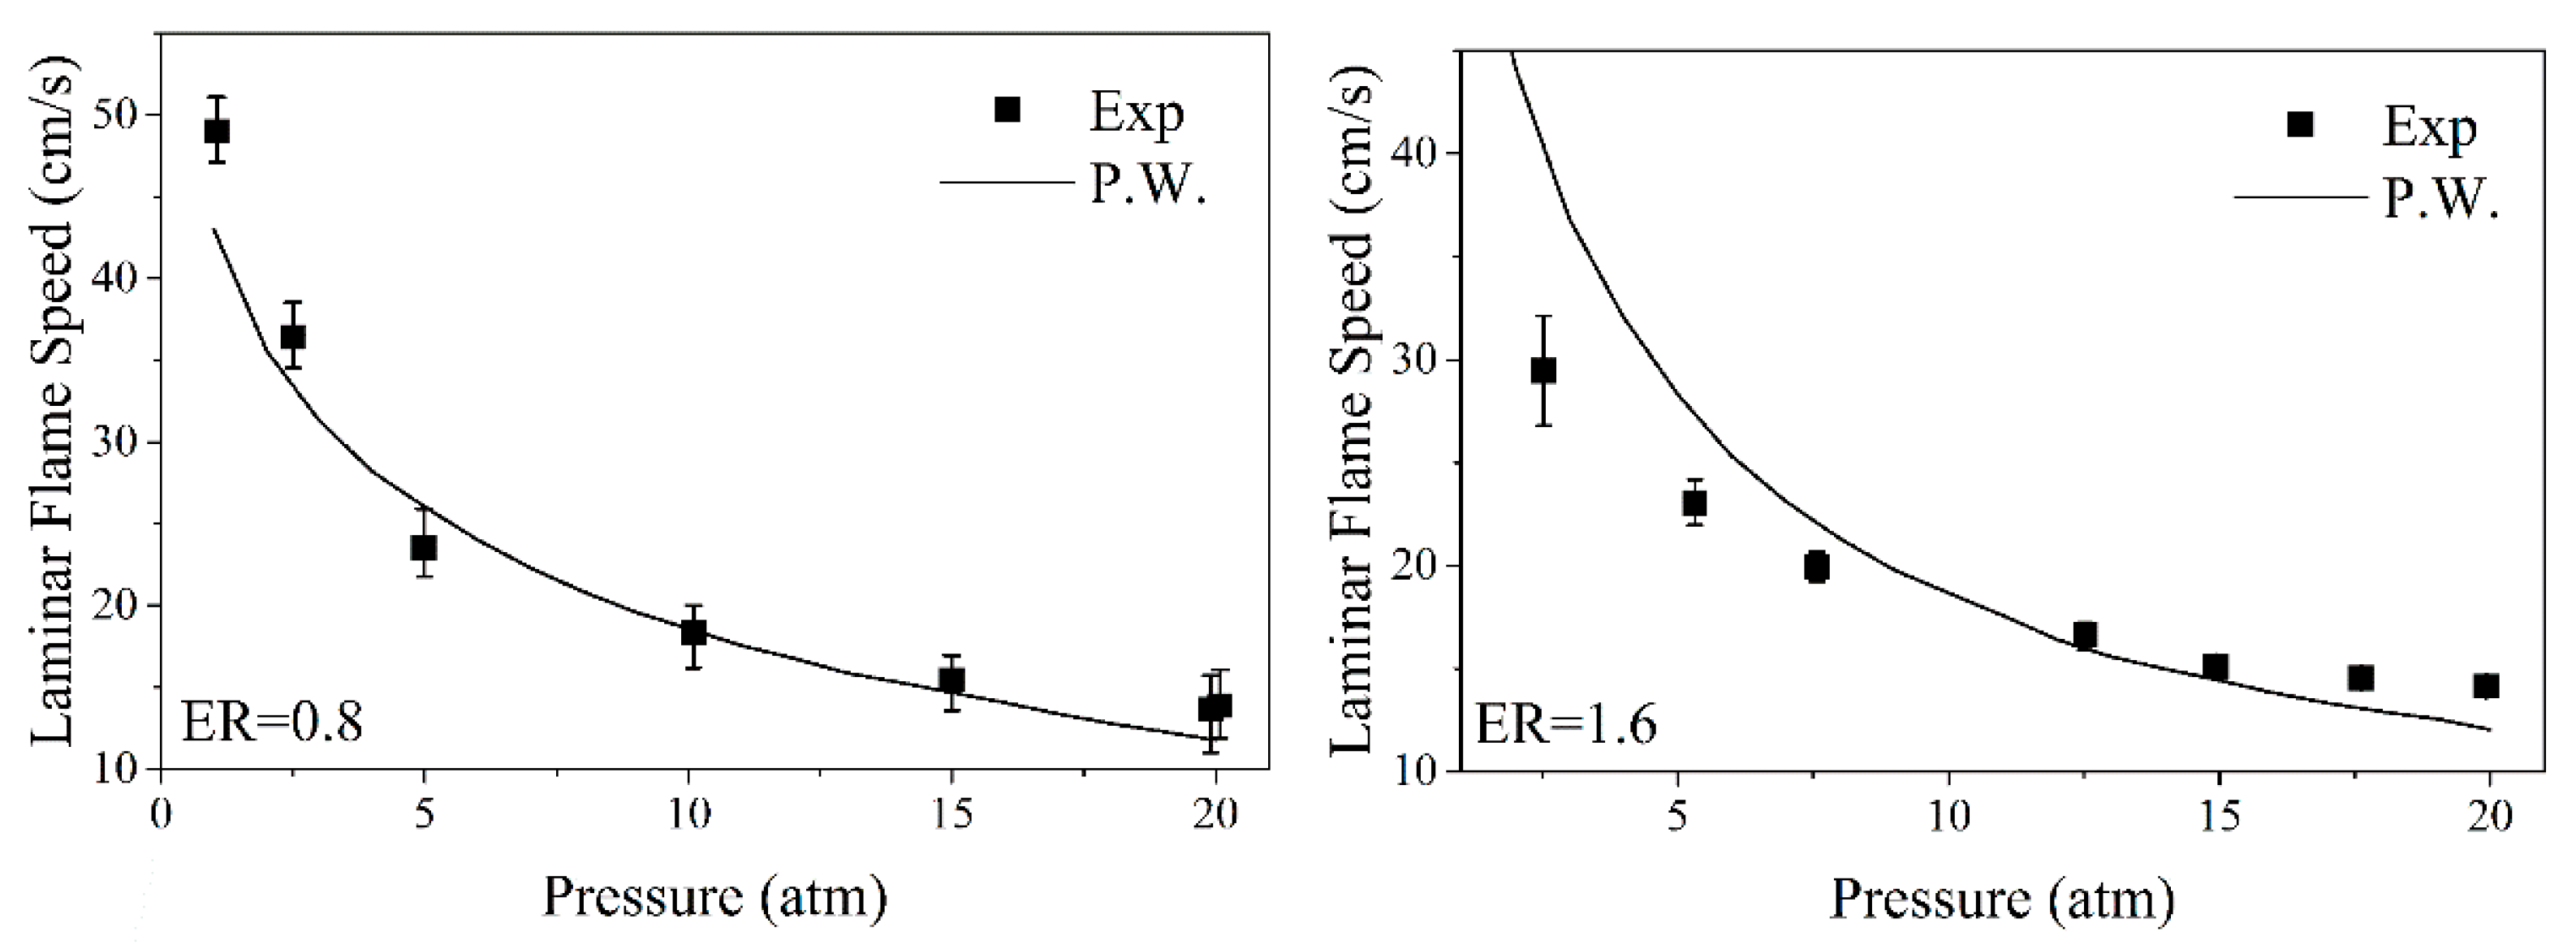
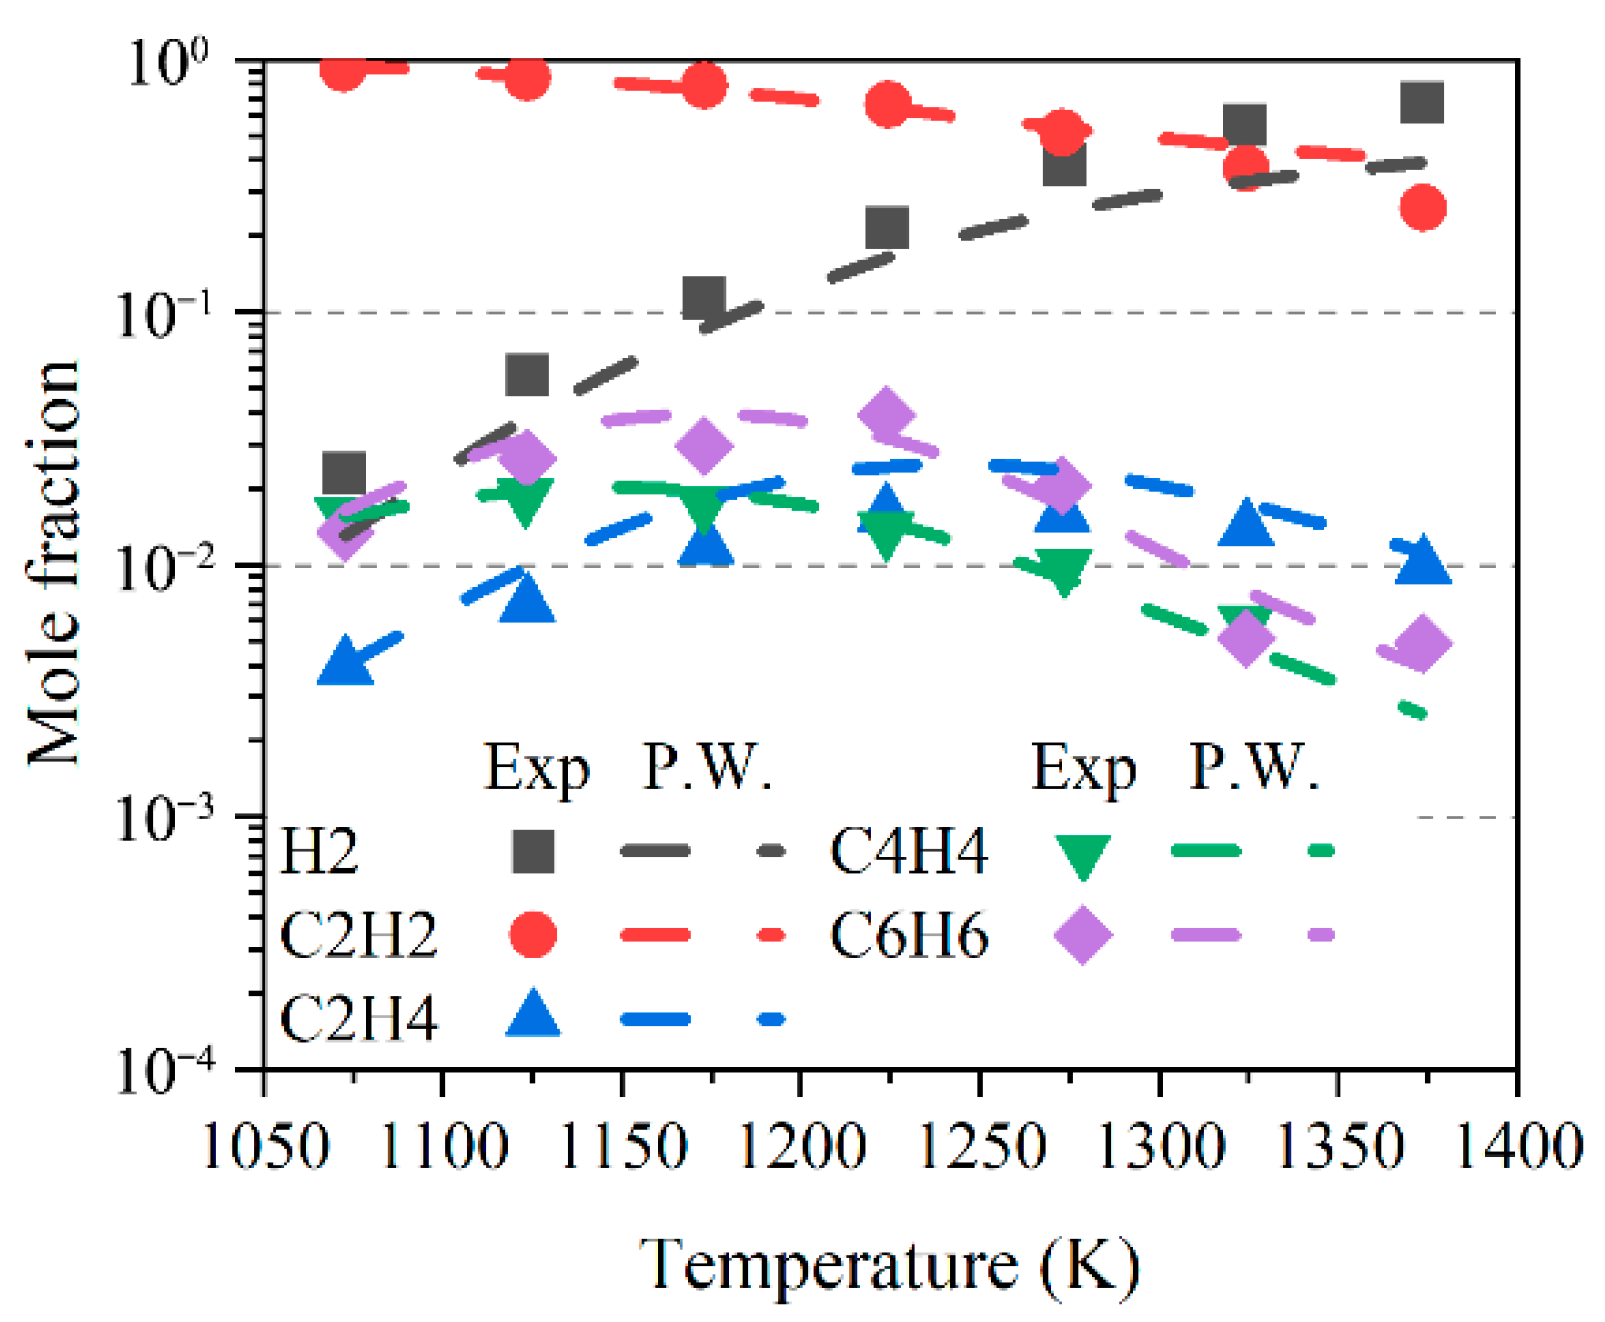
2.2.2. Acetylene Oxidation and Pyrolysis

The ignition delay times (IDTs) predicted by the reduced chemical reaction model are shown in Figure 3. Compared to the reference mechanism [35], it has better high-pressure prediction characteristics. In the high-temperature region, the predicted results differ little from the detailed reaction mechanism. The predicted results for the reduced reaction mechanism increase in time compared to the detailed chemical reaction mechanism with increasing temperature. In the mid-low temperature range, the higher the pressure, the more underestimated the prediction time of IDTs. The main reason is that the reactions sensitive to high temperature are retained in the simplified process, whereas the sensitivity to low temperature was ignored. The change of equivalence ratio has little effect on the reduced reaction model, the difference of IDTs at high temperatures is small, and the numerical results are stable. A reasonable induction time at high temperatures for high-pressure chemical reaction processes can, thus, be guaranteed in the rich fuel condition.
For the laminar flame speed, high pressure conditions are often considered to explain the adaptability of the simplified chemical reaction model under detonation conditions. Predictions of laminar flame speed for high-pressure acetylene have been compared with experimental results [36] for equivalence ratios equal to 0.8 and 1.6 and pressures from 1 atm to 20 atm, and the performance and predictive power of this reaction mechanism under high pressure have been discussed. As shown in Figure 4, experimental results show that the flame’s velocity decreases with pressure under different equivalence ratios. The simplified chemical reaction models provide consistent predictions. For pressures larger than 10 atm, numerical results are in agreement with the experimental results. When the pressure is less than 5 atm, the predicted value of the laminar flame speed is different from the experimental results. For the detonation propagation process considered in this paper, the average pressure is larger than 15 atm, i.e., far away from the critical region where the model is not properly working. In other words, the simplified chemical reaction model is able to predict the correct flame burning speed and is used in numerical simulations.
For the pyrolysis process, the experimental results of Norinaga et al. [37] are shown in Figure 5 and Figure 6. The temperature there is the temperature of the gas stays in the reactor, and this makes possible to compare quantitatively the pyrolysis processes. For small molecules, it can be seen that the overall gap is small, and a better prediction result was achieved. However, for species above C10, the concentration of substances varies greatly due to the reduction in some irreversible one-way reactions, and some species with larger molecular weights (coronene) are ignored. To obtain a simplified chemical reaction model for numerical calculation, the types of PAHs are divided into six- and five-membered ring structures, and the representative components are FLTHN, A3R5, and A4. These components are used as the chain termination reaction of the chemical reaction model. At high temperature, they cannot be converted into larger molecules and accumulate. As representatives of such components, they have a certain concentration of transition accumulation. This results in an over-prediction at high temperature, but this is also a good feature of the model, which fully reflects the way in which the different types of PAHs form at high temperature. The concentration of these two species increased, resulting in an increase in the concentration distribution of the species along the generation path to the equilibrium. In general, high molecular weight PAHs are underestimated, whereas the reduced reaction model has good predictions for small molecules, and the branching ratio of the high molecular weight components is maintained, which in turn leads to better simulation results for high temperature and high pressure oxidation and pyrolysis process of acetylene.

2.2.3. Initial Detonation Cell Characteristic Parameters

Numerical results, reported in Figure 7, show that the structure of the detonation wave is very regular in the fuel-rich condition (ER = 3.0). In the over-rich condition (ER = 6.0), the structure of the detonation wave front shows an irregular trend instead.
A detonation cell is characterized by a longitudinal length, l, and a transverse width, λ along the detonation propagation and its perpendicular direction, respectively. The detonation cells for ER = 3.0 is regular with an approximately size of 0.27 mm in width and 0.51 mm in length. However, when ER = 6.0, the detonation cells lose their regularity and exhibit variability in width and length due to the increase in acetylene concentration. As it can be seen from Table 1, as the equivalence ratio increases, incident angle β decreases, exit angle α increases, and the overall cell geometry is stretched.
For ER = 3.0, the average detonation velocity propagation is approximately 1890 m/s, which is about 0.93 times the value of the VCJ after overdrive detonation in this condition. For ER = 6.0, the average detonation velocity is approximately 1700 m/s, which is about 0.88 times the value of the VCJ after overdrive detonation in this condition. Results confirm that the calculation method and the chemical reaction model can provide reliable predictions of the acetylene-rich detonation process.

3. Results and Discussion

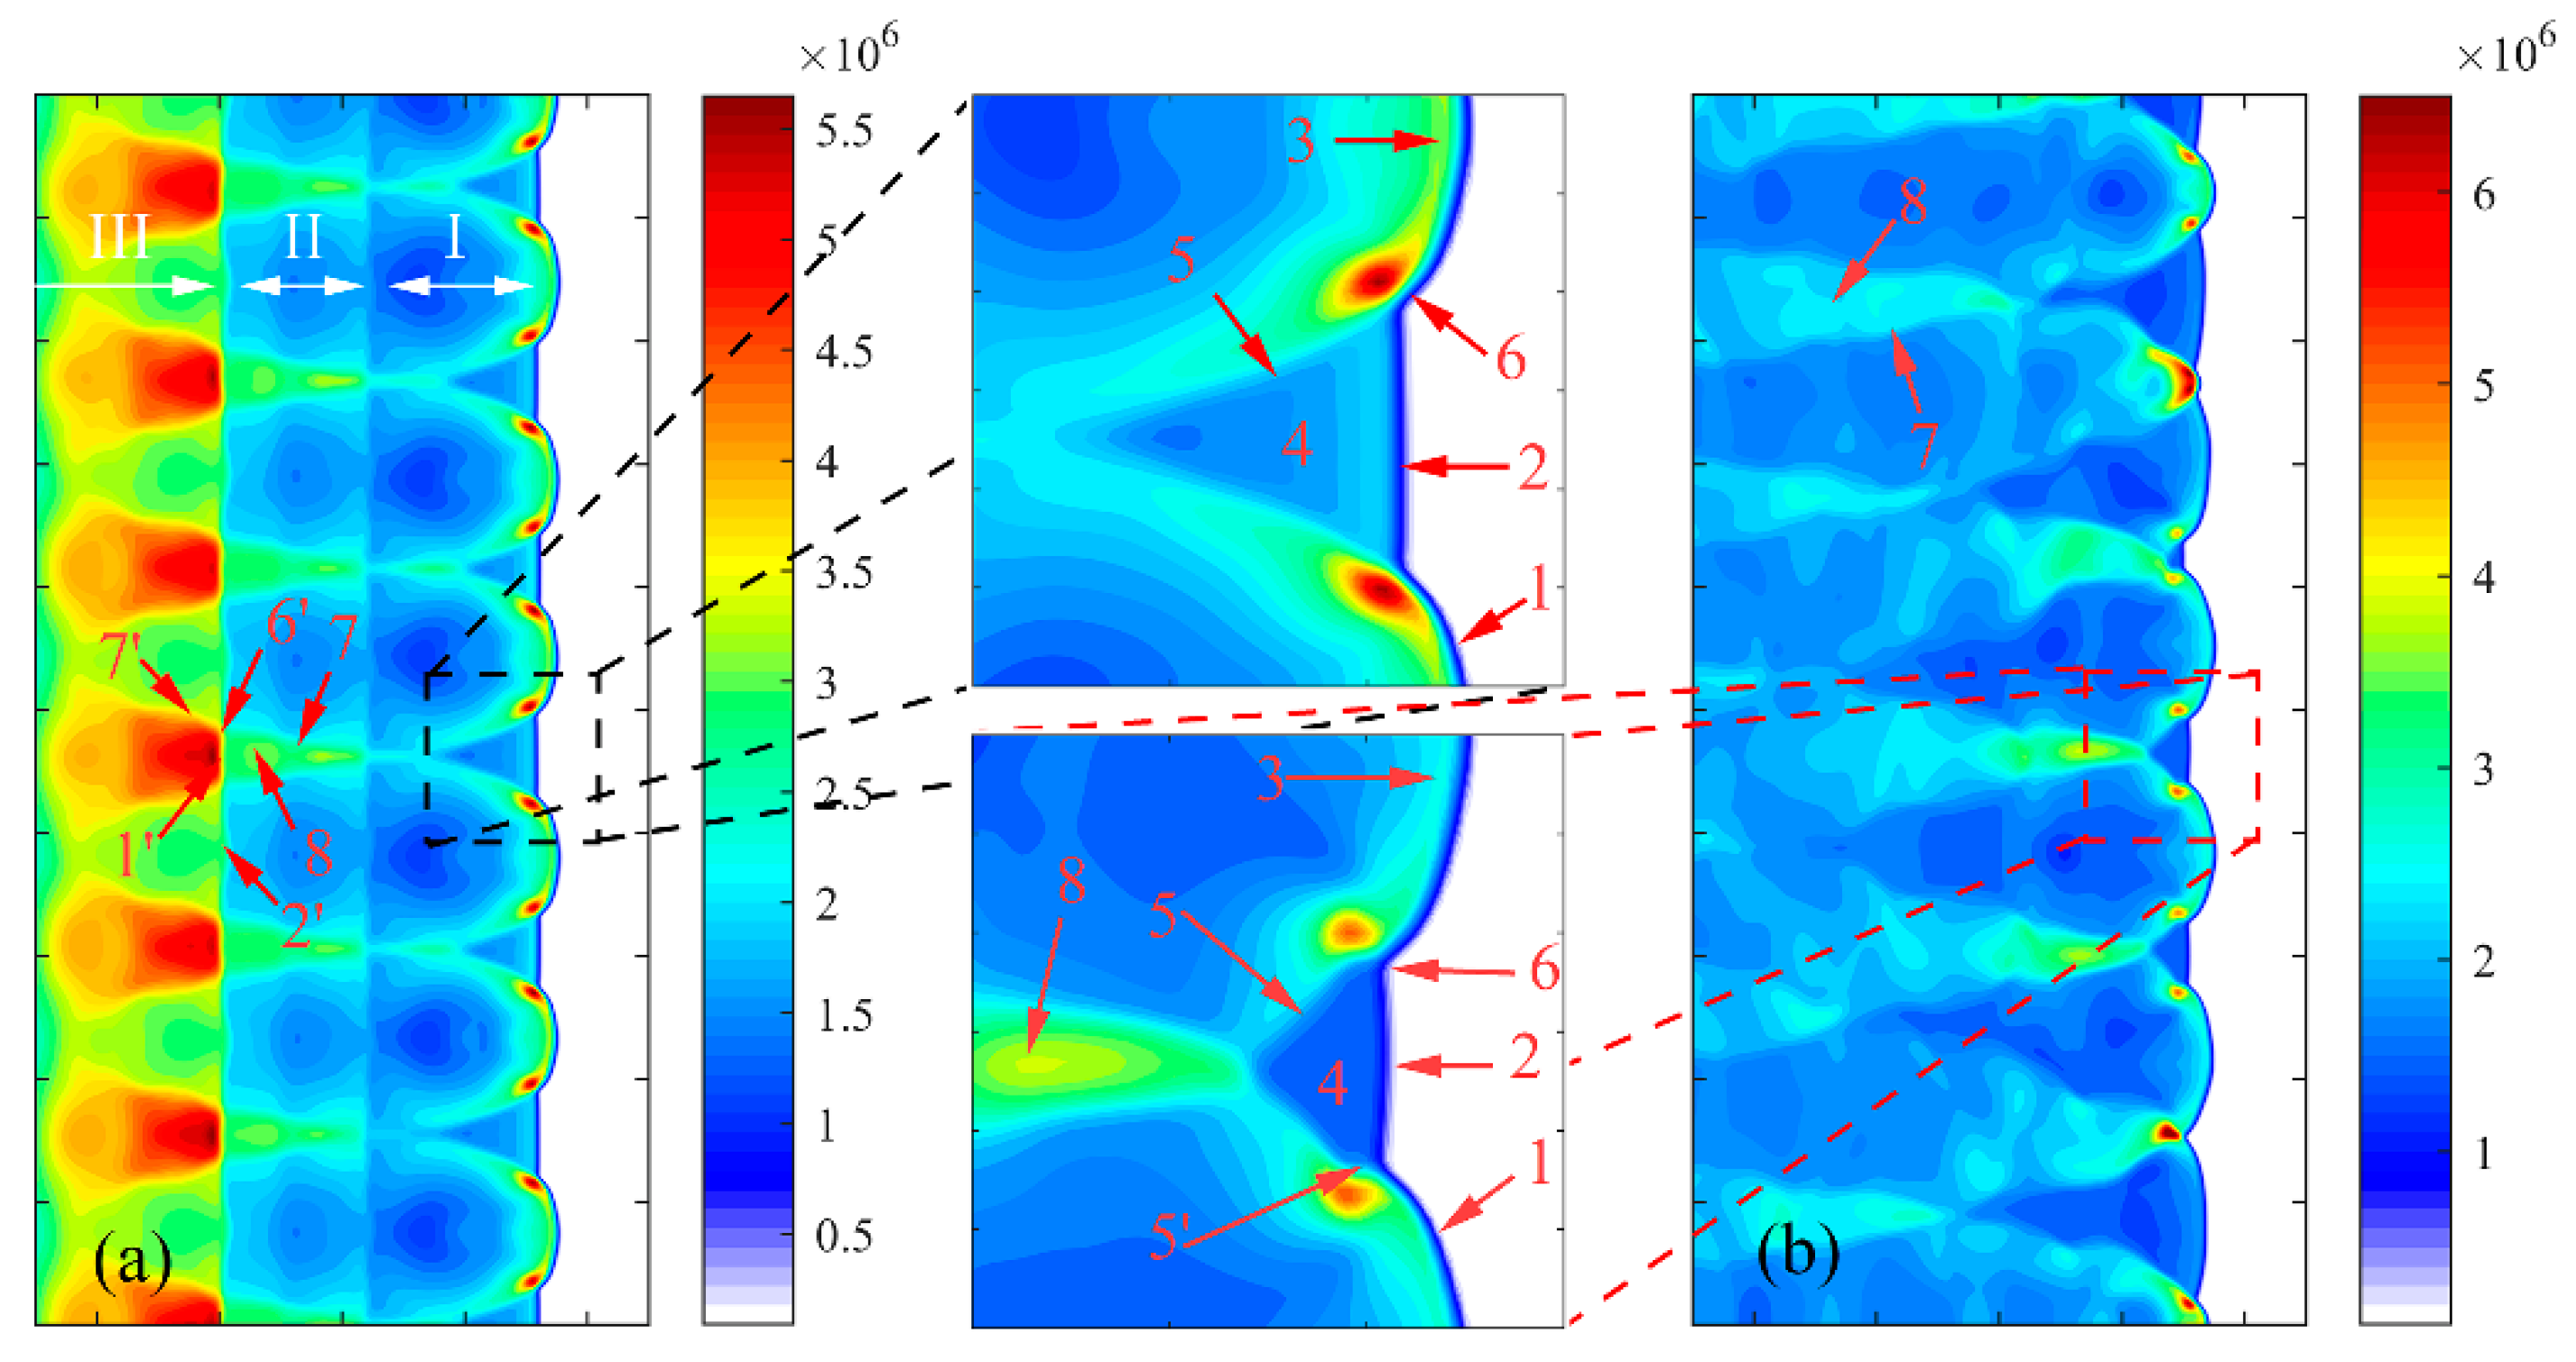
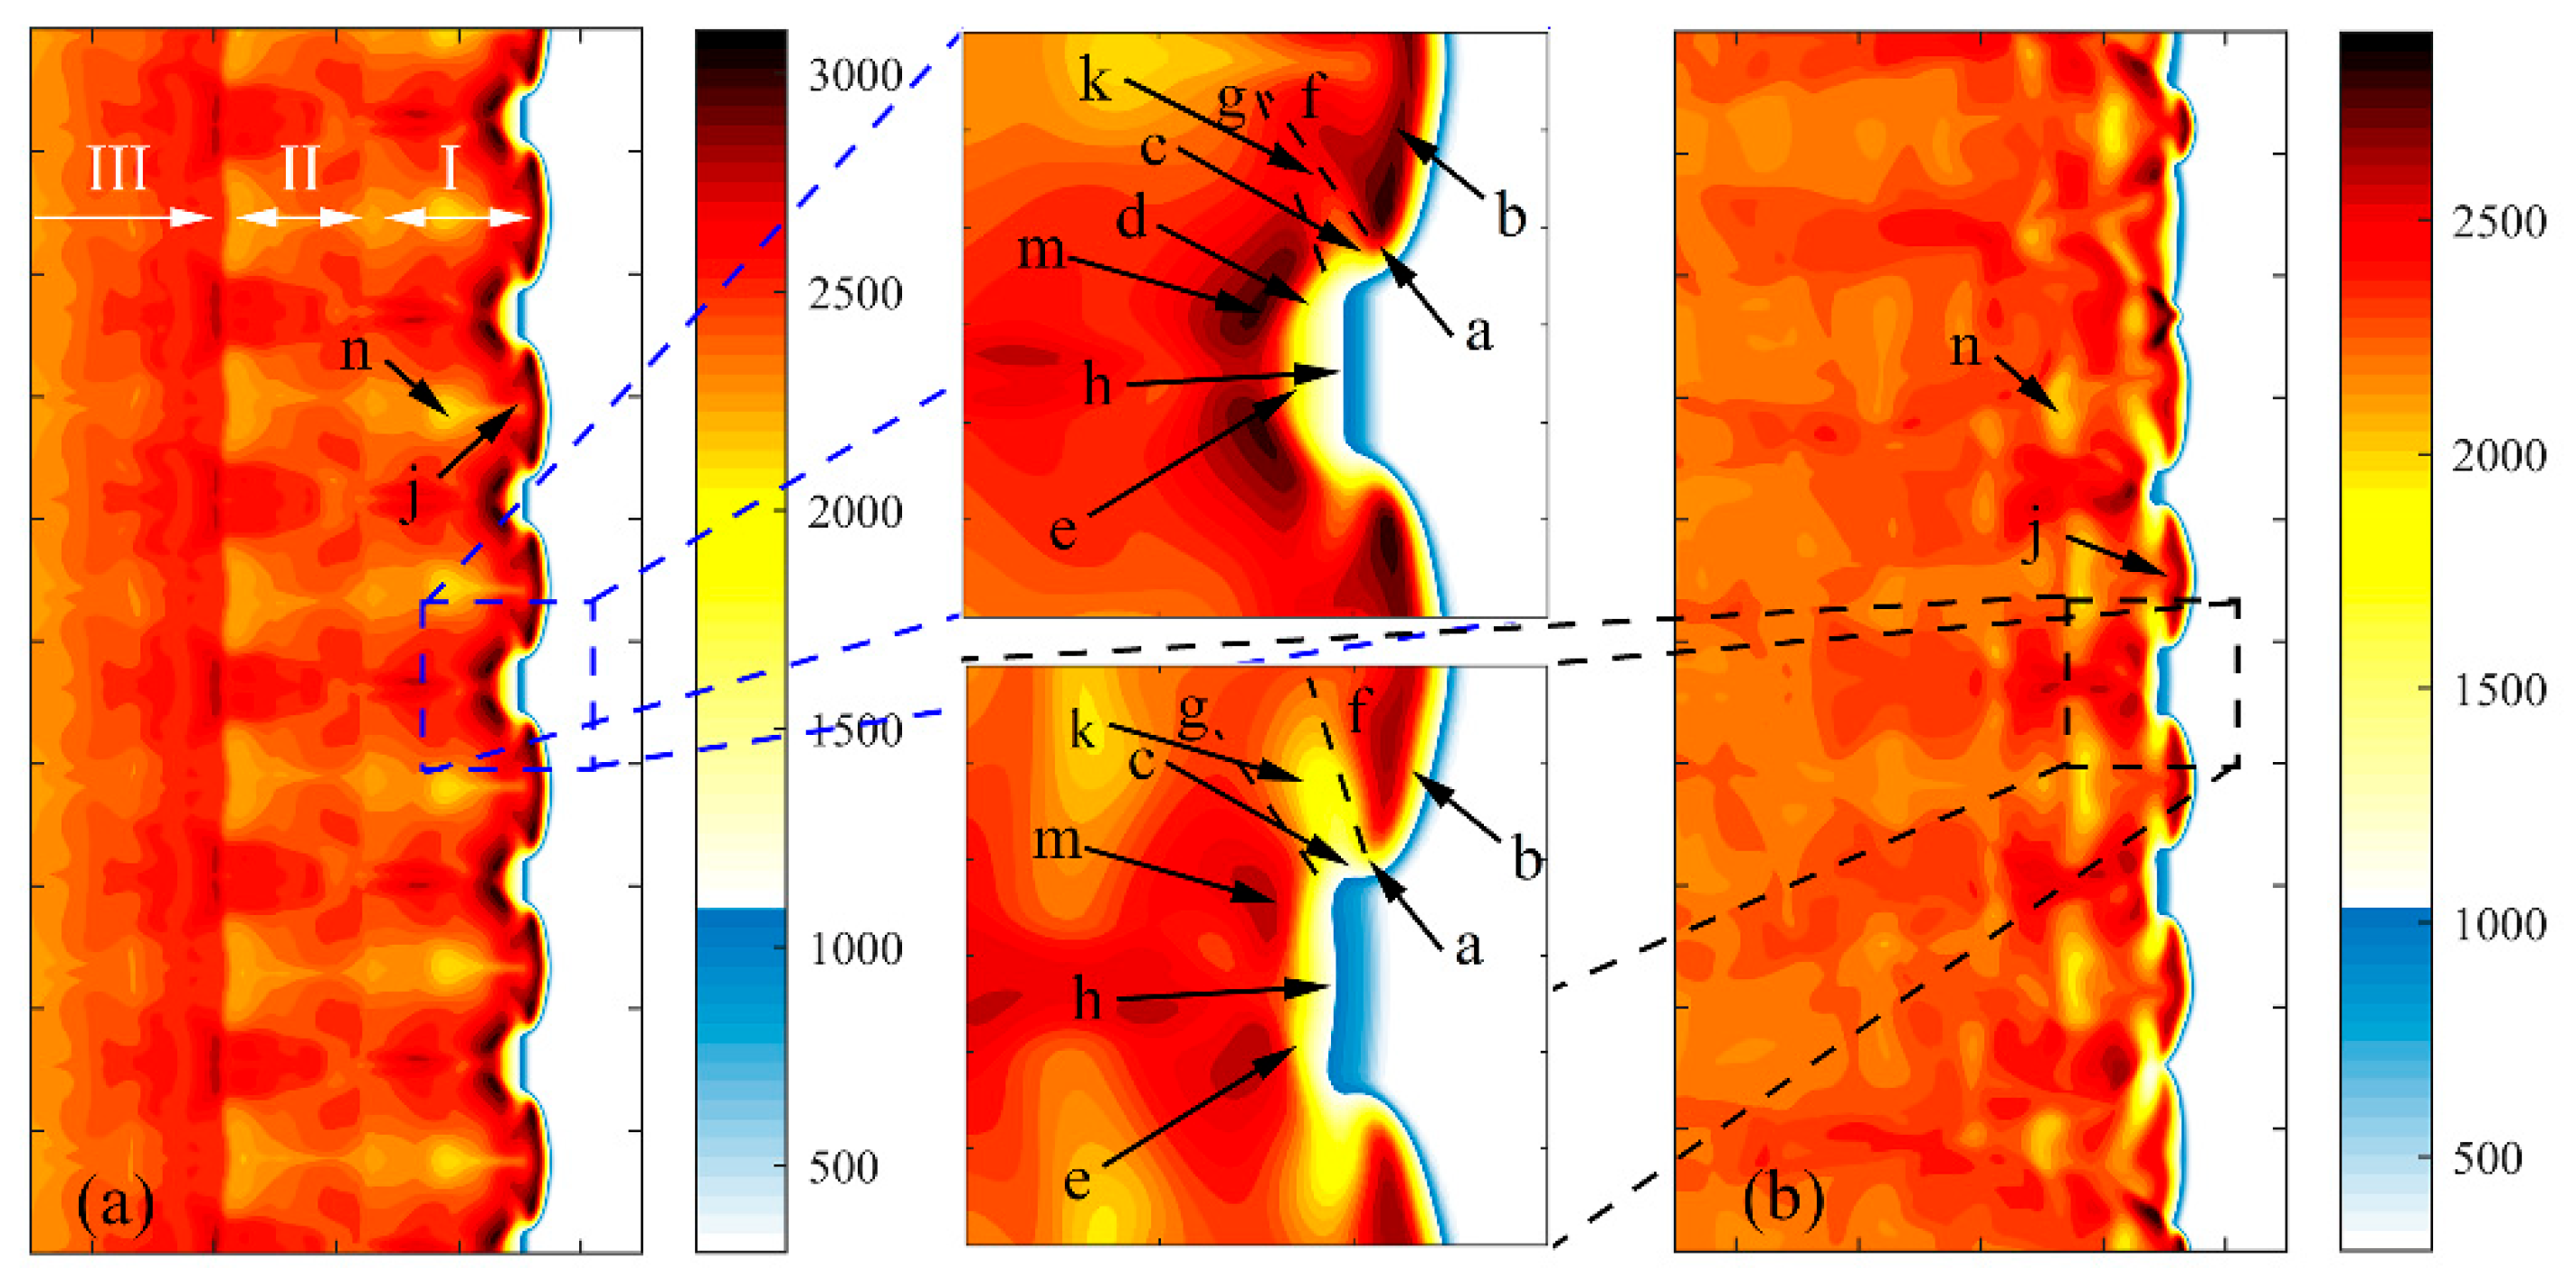
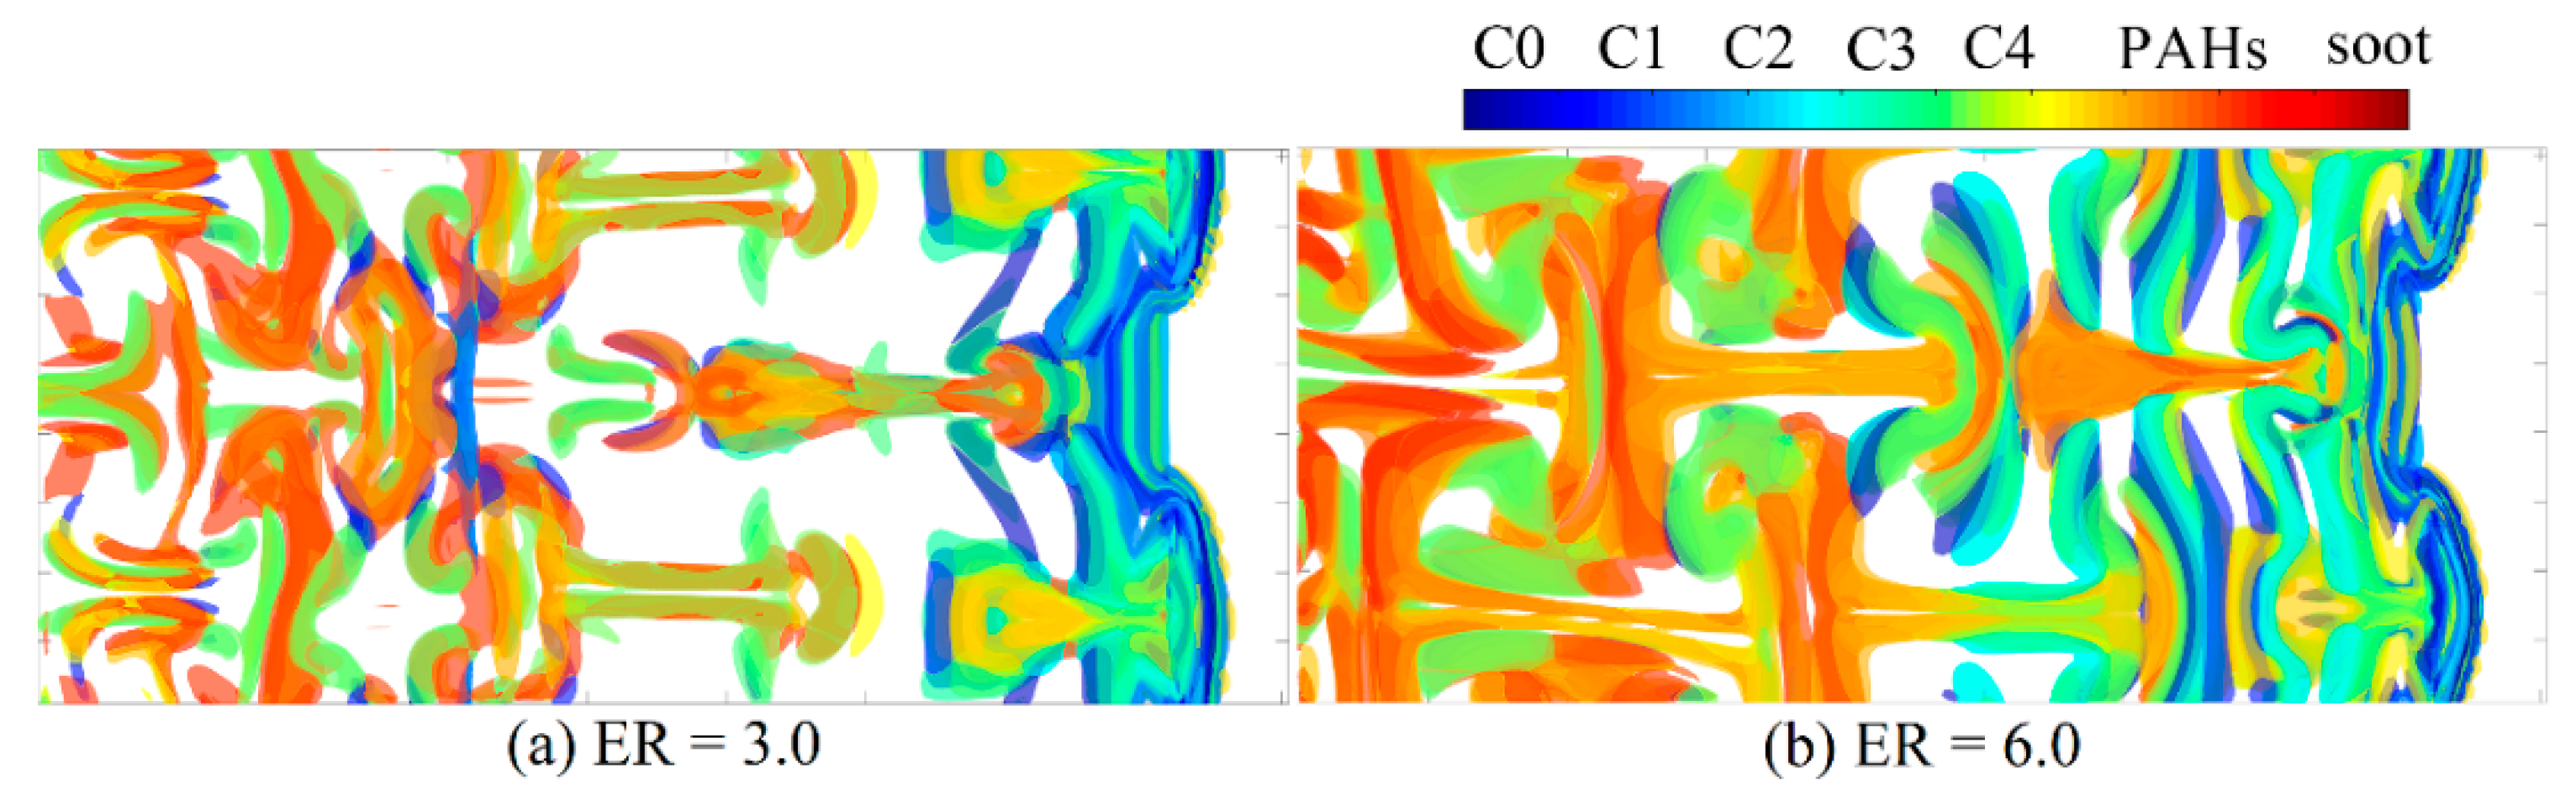
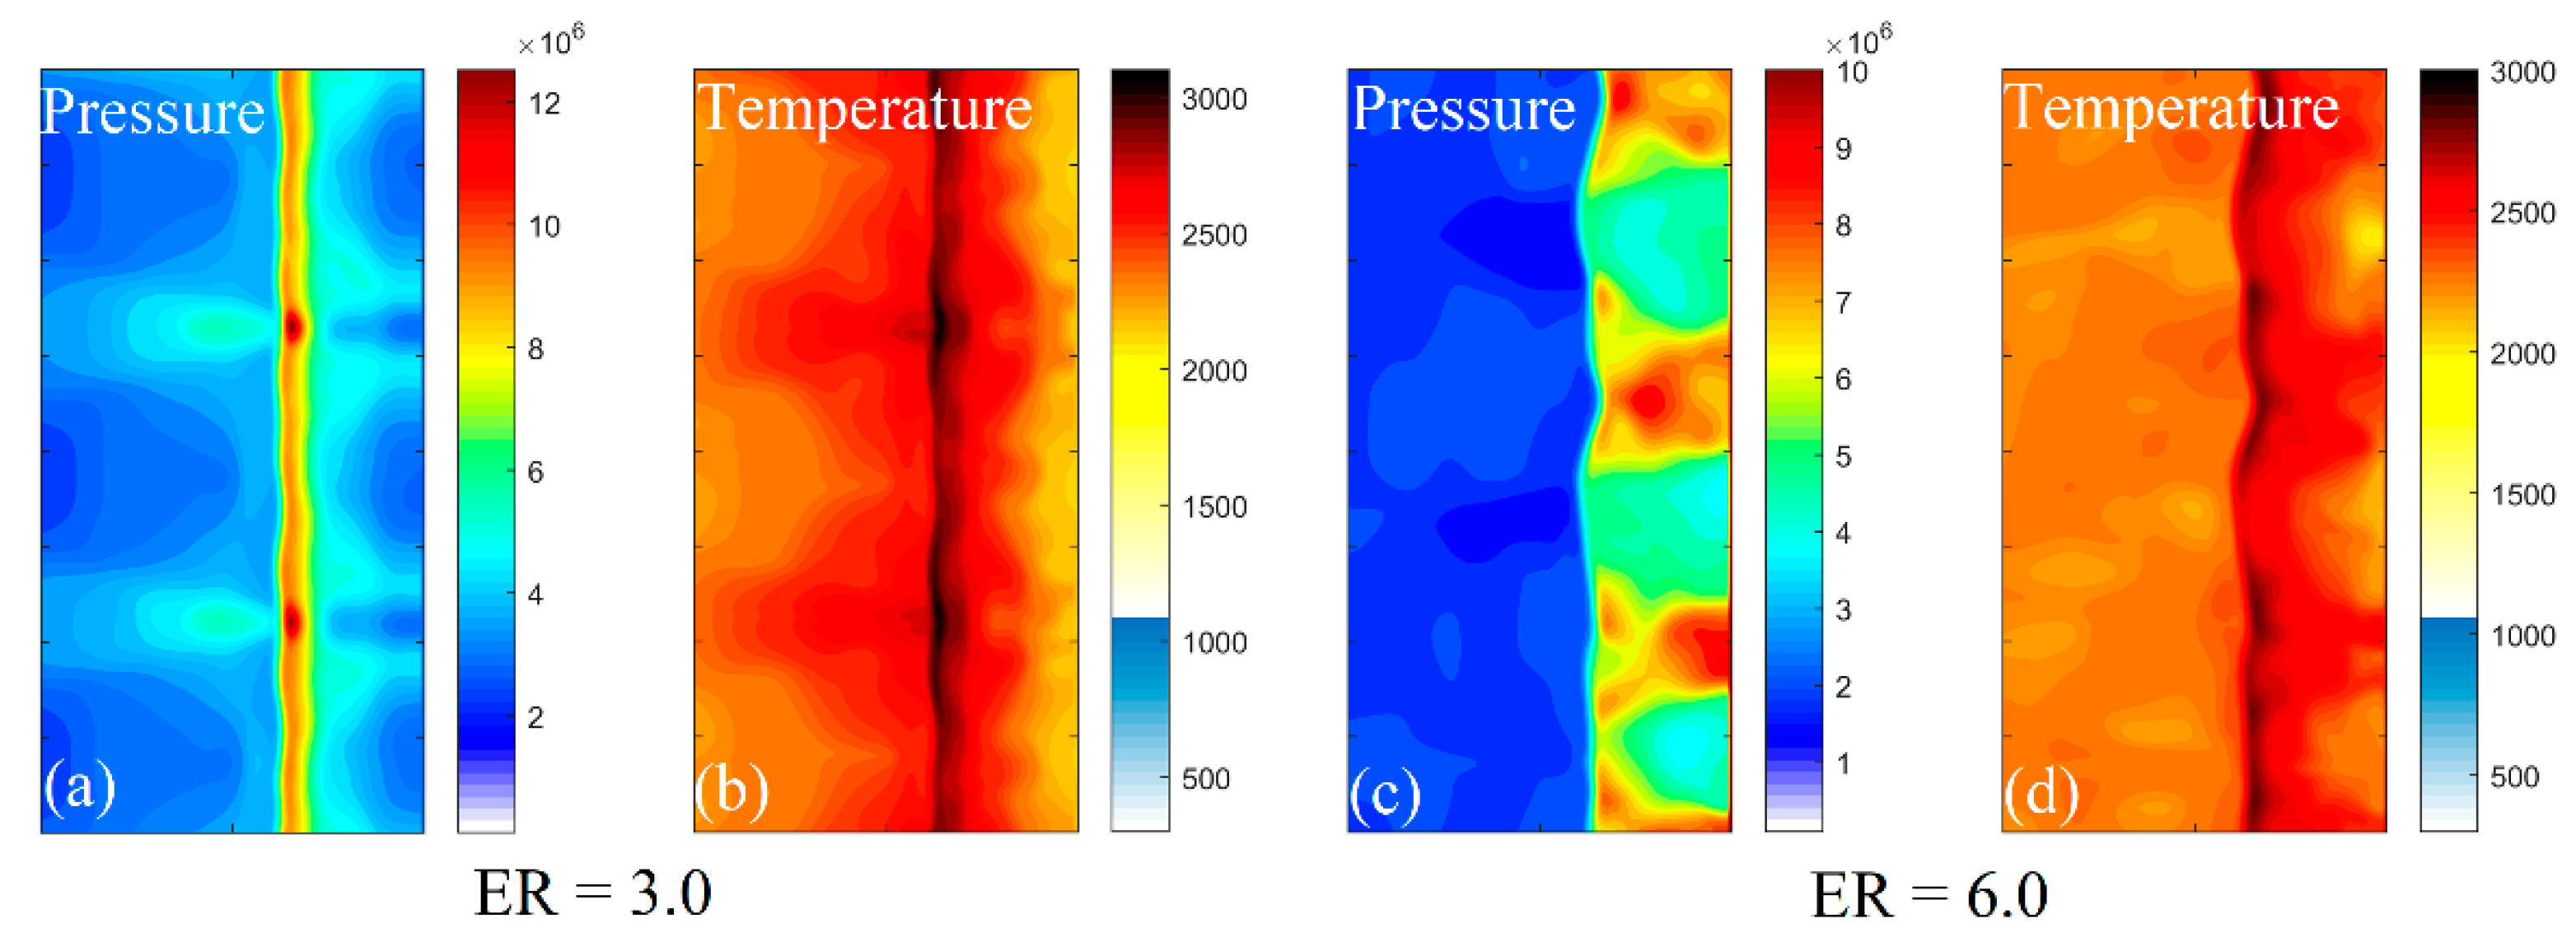
3.1. Structure of Detonation

From the pressure distribution (Figure 8), it can be seen that when the equivalence ratio is 3.0, the wave structure is that of a detonation with a weak transverse wave [6]. At this time, the main effect of the transverse wave is to maintain the self-sustained propagation of the detonation wave. Due to the gradual weakening of the leading shock front 2 during the propagation process and according to the INWPCR (interaction of nonlinear wave propagation and chemical-reaction) theory, the chemical reaction intensity in the combustion zone is weakened, and the energy released by the combustion decreases, i.e., a negative feedback mechanism is established. The transverse wave is behind the leading shock wave, further increasing the pressure in the area behind the leading shock wave, and feeding back to the chemical reaction. This strengthens the reaction rate, providing support and maintenance for the transverse wave and overall leading to a positive feedback process (SWCER), which catches up with the leading shock wave to form a new Mach stem to support the propagation of the detonation wave.
Behind the detonation wave, an area where the pressure is further increased can be clearly seen. The leading edge of this region has a structure similar to the detonation wave, which is a secondary detonation wave structure caused by chemical reactions. According to the pressure change, the post-detonation wave region can be divided into three regions: I, the initial reaction zone; II, the secondary induction zone; III, the secondary reaction zone. The formation of these regions is influenced by transverse waves. After the intersection with the transverse wave, the reaction process is enhanced and the extended wave is reinforced. Region 8 has a higher reaction activation energy due to the lack of oxygen and cannot lead to a fast reaction chain. At the intersection of the extended transverse wave, the temperature and pressure increase again, which stimulates the reactivity of the species in region II. The explosive reaction is accompanied by the release of a large amount of heat. The structure contains induced shock waves, reflected shock waves, and transverse waves. These three shock waves intersect at triple points and a stable shock-chemical reaction coupling structure was formed.
When the equivalence ratio is equal to 6.0, in addition to the above structure, there is a weak transverse wave 5’ structure between the strong transverse wave and the triple point. The transverse wave cannot induce a quick progress of the reaction, and so the induction process of the leading shock wave is continued (see Figure 8). This leads to the formation of an unreacted pocket when strong transverse waves formed a new Mach stem. A weak transverse wave is formed in this case because the O2 concentration decreases with the increasing equivalence ratio. As a result, the reaction-induced transformation is dominated by the self-decomposition process of acetylene, and the induction time becomes longer. The intensity at the triple points is not enough to quickly induce the reaction at the rear transverse wave, and this produces the formation of an unreacted region. The presence of this region leads to an irregular structure relative to the detonation wave-front.
The irregular detonation front also disturbs the interaction of the shear wave coming after the detonation wave, and the most evident manifestation is the disappearance of the secondary detonation structure. As discussed previously, the secondary detonation structure is a subsidiary phenomenon of the transverse wave interaction in fuel-rich conditions. As the detonation front propagates, the leading shock decreases in intensity, causing the shock to decouple from the chemical reaction. The interaction with the transverse wave leads to a new leading shock wave, which itself sustains the propagation of the detonation. When the extended transverse wave is perturbed, the intersection position is not fixed in a small range but it may fluctuate widely. In turn, this affects the stable energy release of the secondary reaction process and ultimately prevents the formation of a secondary detonation structure.
After that, the shock wave passes through the unburned gas, and the pressure and temperature increased, providing the initial induction energy for the chemical reaction. According to the ZND theory, the reaction is not completed instantaneously, but a combustion surface is formed after a certain accumulation time. This area is referred to as the induction zone. Figure 9 shows the instantaneous temperature distributions for two values of the equivalence ratio: 3.0 and 6.0. The average temperatures of the detonation wave-fronts are 3020 and 2986 K, which are slightly lower than the corresponding values of TCJ of 3101 and 3068 K, respectively.
The induction length and time are mainly affected by the temperature and pressure of the leading shock. The flame front induced by the Mach stem has a shorter induction length, and the corresponding induction time is, thus, shorter. The flame front is induced by the incident shock, but the reaction area is far away from the incident shock. Since pressure is much smaller than PCJ, the temperature is also smaller than TCJ, and this increases the length of the induced region. Due to the negative feedback of INWPCR, the shock wave is gradually decoupled from the chemical reaction. The flame front c, extended by the triple point a, is weakly exothermic and splits the unreacted pocket k with the slip lines g and h. The size of the unreacted pocket k depends on the strength of the triple point and the transverse wave. It can be seen that, for ER = 3.0, the unreacted pocket is very small. During the propagation of the detonation wave, slip lines f and g become more and more parallel. Before the triple points merge, this area reaches the maximum, forming an unreacted pocket, indicating that there are weak transverse waves in the propagation process. However, the time is short and does not affect the periodicity of the cell and the detonation wave-front. For ER = 6.0, slip lines f and g are consistent with the diffusion angle, and region k hardly changes. There is a flame front after the weak transverse wave. Due to the insufficient strength of the transverse wave, no strong reaction process is formed behind this flame front, and a general combustion process occurs in the area where the shock wave and the reaction are decoupled.
A high temperature is present in the reaction zone m behind the flame front d. Here the flame front is a strong transverse wave-induced reaction. Compared to the Mach stem, the strong transverse waves are weaker. At the same time, the induced region of the transverse wave is located inside the induced region of the incident shock wave. The induced region shown on the temperature distribution is, thus, provided by the induced length of the incident shock wave plus the full induced region length of the strong shear wave. Flame front h is induced by the incident shock wave, and the induced region is about 3 times the length of the induced region of the Mach stem. At this time, the energy released by the chemical reaction is gradually unable to support the rapid propagation of the shock wave, and the chemical reaction is gradually decoupled from the shock wave. Comparing the results obtained with ER = 3.0 to those corresponding to ER = 6.0, it can be seen that the length of the induced region of the incident shock wave is the same, but the temperature gradients are different. Since the O2 content is high when the equivalence ratio is 3.0, the initial temperature increase is affected by the oxidation reaction. The high activation energy in the subsequent self-decomposition reaction of C2H2 increases the induction length. When the equivalence ratio is 6.0, the O2 content is low, and the oxidation and pyrolysis processes are carried out simultaneously. In the subsequent stage, the pyrolysis reactants also participate in the oxidation process, and a large number of H atoms are released at the initial stage, which accelerates the subsequent induction process.

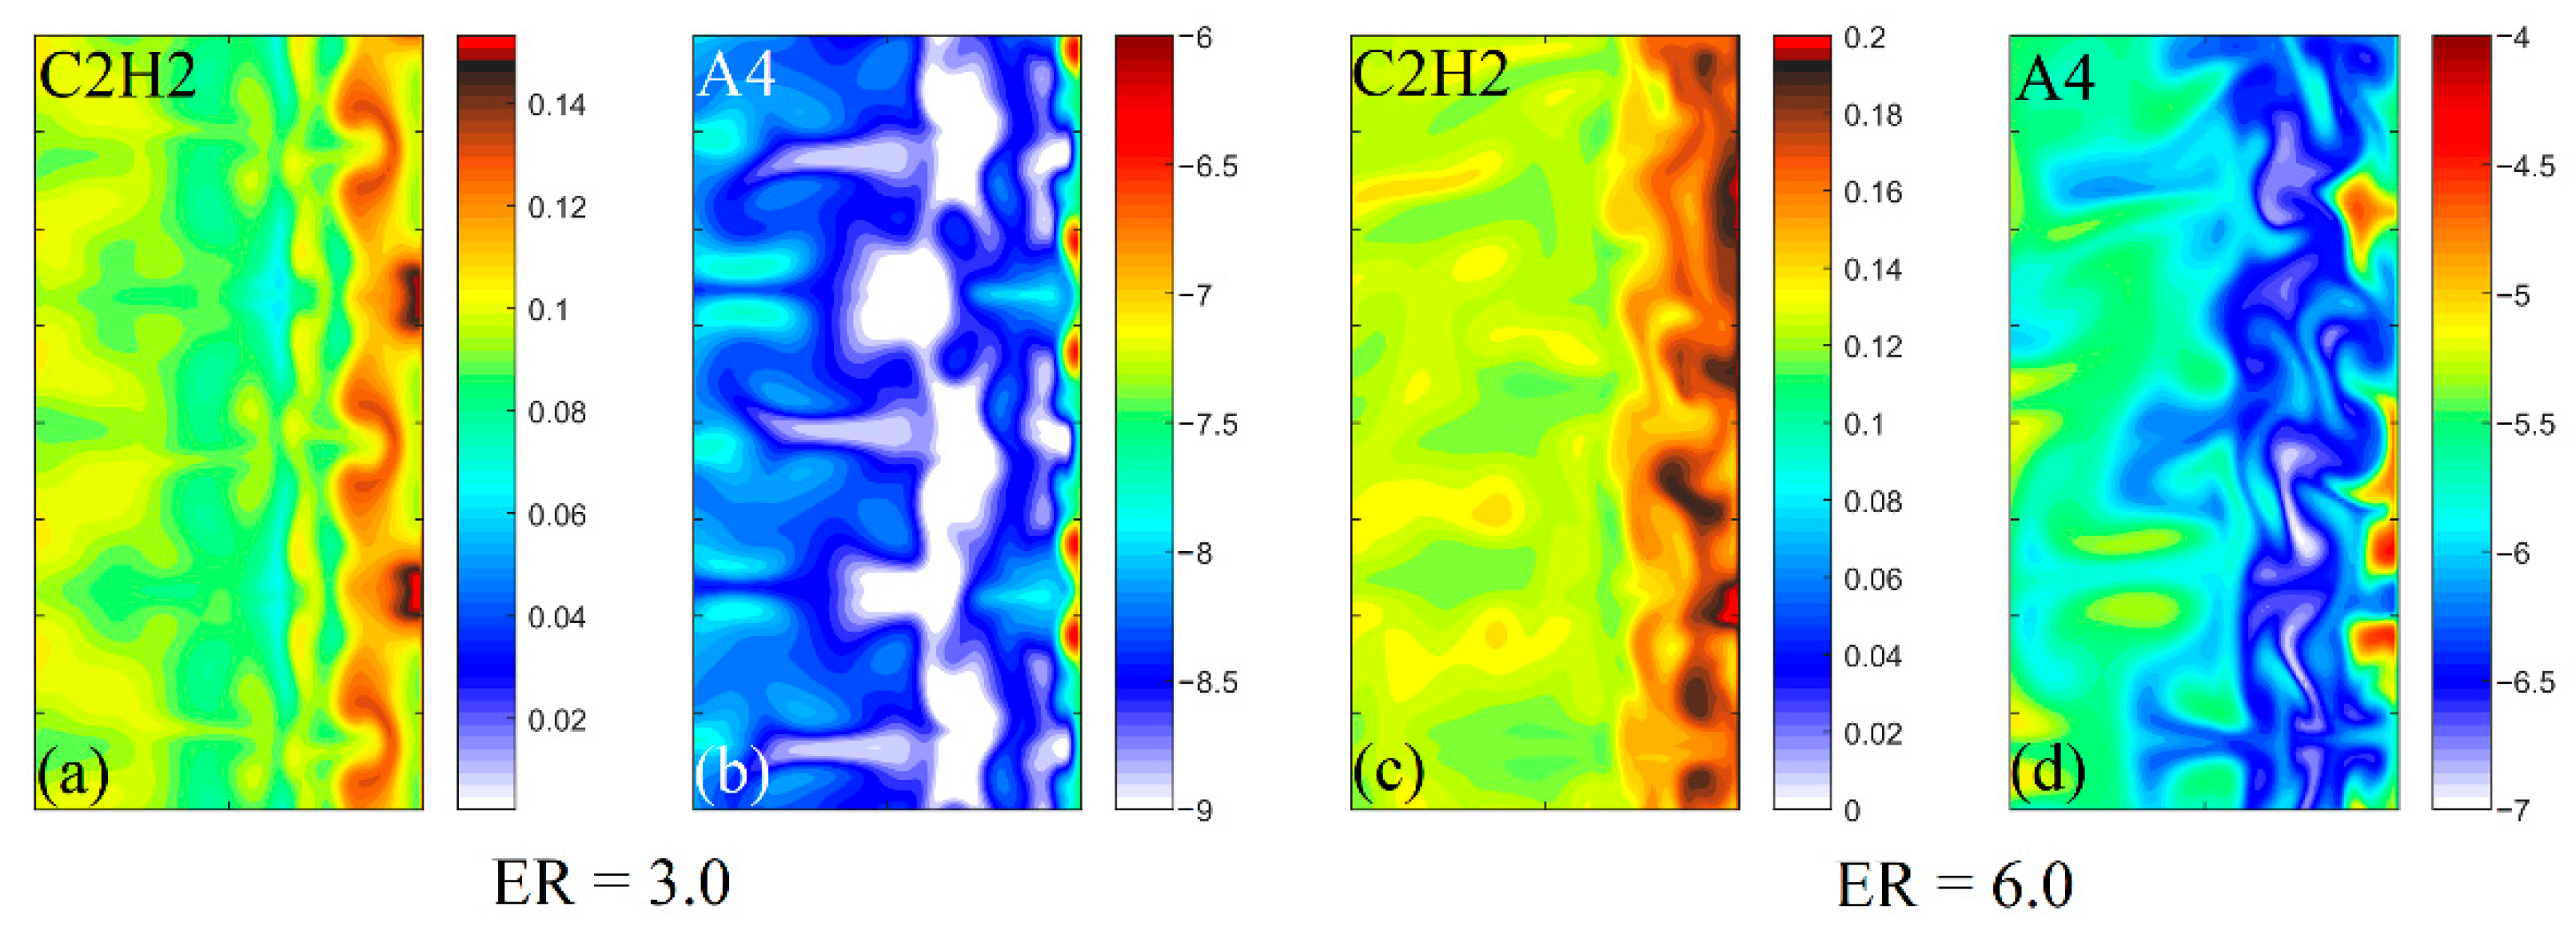
3.2. Characteristics of Reaction Dynamics

A detailed chemical kinetic analysis is helpful to understand the complex structure of the acetylene-rich detonation process, especially for what concerns the effects of induced process changes and the generation and consumption of components depending on the pressure and temperature distributions. The chemical reaction process during acetylene-rich detonation will be analyzed in detail, and the different behavior for different ERs will be compared.
In order to facilitate the analysis of species change, the gradient R is provided here to represent the processes under investigation. Gradient R of the species is given by the following:
R = [ X ] x 2 + [ X ] y 2 ,
where [ X ] is the mass concentration of the species. A high gradient value corresponds to a rapid change in the concentration of the species at that location, indicating that the specie is involved in the main reaction process. There are two positions where the gradient is low: one is where the reaction has achieved equilibrium and the other is where the reaction is no longer proceeding. The R diagram is, thus, a good representation of the reaction mechanism.
Detailed instructions are shown in Figure 10. Apart from C2H2 and O2, which are placed in the blue area as the initial starting materials, the other species are sorted according to the C content and the formation steps. Species closer to the red area are those with higher C content such that more reaction steps are required to obtain this specie. The picture illustrates PAH generation in the post-detonation reaction process from a certain nature.
In acetylene-rich conditions, the initial process of the shock-induced reaction the main pathway is not the reaction of C0 and C1 but rather that of C2 and C4 species as vinylidene radical (H2CC), ethynyloxy radical (HCCO), acetaldehyde (CH2CHO), diacetylene (C4H2), butatrienyl radical (I-C4H3), and 1-butene-3-yne-4-yl radical (N-C4H3). In the induction region, the temperature rises slowly, the partial oxidation reaction provides energy, and the acetylene pyrolysis reaction absorbs part of the energy to overcome the reaction barrier, and thus releasing a small amount of energy during the reaction. Small molecules then dominate the process, and the reaction process is accompanied by a large amount of heat release. At this time, the temperature and pressure greatly increased, leading to the positive feedback process SWCER, which maintains and supports the propagation of detonation. After oxygen is terminated, the system switches to the acetylene pyrolysis process. The reduction in heat release and the decrease in temperature behind the reaction zone provide favorable conditions for the formation of PAHs with larger molecular mass.
For ER = 3.0, incident shock wave 2 decays gradually, and the reaction process in induction zone 4 is elongated. The reaction process is dominated by C4 and C6 species due to the relatively low temperature of flame front e. Compared to the ignition induction process after Mach stem, the induction length is three times longer. According to SWCER, the leading shock wave is weakened when the chemical reaction support is insufficient. The corresponding combustion reaction energy release decreases, and the leading shock wave decouples from the chemical reaction.
Concerning the secondary detonation structure, in the induced region II, region 8 is compressed by the extended transverse wave. C3, C4, and the initial PAHs gradually enter the reaction. After the incident shock 1′, the gradient values of the three species of H, CH2, and H2CC increase. This shows that the following:
( R 1 ) :   C 2 H 3 + H H 2 CC + H 2
which is the dominant reaction of the reaction at this time. In terms of the amount of H2CC increasing, we have the following:
( R 2 ) :   H 2 CC + H 2 2 CH 2
( R 3 ) :   2 CH 2 C 2 H 2 + 2 H
which accelerates in the forward direction of the reaction. At the same time, we have the following:
( R 4 ) :   H 2 CC C 2 H 2
which balances the concentration of H2CC and C2H2, further increasing the concentration of H. This vinyl (C2H3) reaction system accelerates the reaction rate, thereby forming a secondary detonation structure. The formation of this structure greatly increases the concentration of acetylene, and according to the HACA mechanism, hydrogen atoms provide activated free radicals that undergo additional reactions with acetylene to accelerate the formation of PAHs. The late reaction is dominated by C4 and PAHs species and gradually develops into soot.
For ER = 6.0, the large unreacted pocket and the existence of weak transverse waves induced irregularly changes in detonation waves. In turn, the cells also show an irregular structure. This perturbs the temperature and pressure distribution after the detonation wave. The dominant region of component distribution and chemical reaction process is also perturbed.
When the temperature reaches 1000 K, the gradient peak of N-C4H3 appears, mainly due to the existence of the following reaction.
( R 5 ) :   C 2 H + C 2 H 2 ( + M ) N - C 4 H 3 ( + M )
This is followed by a gradient of C-C6H4 and HCO due to the following.
( R 6 ) :   N - C 4 H 3 + C 2 H 2 C - C 6 H 4 + H
( R 7 ) :   O 2 + C 2 H CO + HCO
It can be seen that the oxidation reaction assists the pyrolysis reaction. The heat released is mostly used to overcome the potential energy barrier of the reaction initiated by the pyrolysis reaction chain. C3 and C4 species are the main reaction paths in the post-flame front reaction. Compared with the composition gradient distribution at ER = 3.0, there is also a second induction zone 8 at ER = 6.0; however, it is not clearly observed in the pressure profile. Due to the synthesis of a large number of components with high molecular weight PAHs in the induction zone, there is no concomitant release of a large amount of heat. In the subsequent reactions, C2H3, which is the primary specie in the (R5), (R6), and (R7) reaction systems, is mostly converted to ethylene (C2H4) due to lower temperature and pressure. As a consequence, the secondary detonation reaction is not formed in this case. With the exception of PAHs, the C3 component dominates the reaction after the detonation wave.
When pressure increases, the N-C4H3 reaction is dominant, and a high temperature region behind the pressure wave is induced by formyl radical (HCO) and hydrogen (H2). After that, formaldehyde (CH2O) and triacetylene (C6H2) gradually entered the reaction process and the temperature further drops. At the intersection of the Mach stem, the generation of hydroxyl radicals (OH), HCO, and CH2O is the main process where O2 is consumed. The high-pressure region ethynyl (C2H) and I-C4H3 successively takes over the dominant process of N-C4H3, and the reaction process in the rear region continues to strengthen.

3.3. Wall Reflection

During the propagation of the detonation wave, the existence of obstacles guides the reflection of the shock wave, thereby causing secondary damage. At the same time, the compression of the reflected shock wave has a great effect on the reaction dynamics of the detonation wave and on the presence of polycyclic aromatic hydrocarbons after the detonation wave. We thus devote attention to the detonation wave reflection phenomenon using the detonation method phase wall reflection to numerically simulate the process.
Taking stable detonation as the initial condition, the wall reflection processes of detonation at ER = 3.0 and ER = 6.0 are simulated under the condition of the adiabatic non-slip wall. Figure 11 shows the pressure and temperature distributions after the detonation hits the wall. When ER = 3.0, the reflected shock wave produces a strong pressure and temperature increase. Reflected shock waves are usually the result of incident shock waves and of the Mach stem, while transverse waves hardly form relevantly reflected waves. When the reflected shock wave interacts with the post-detonation flow, not only does it not decay rapidly, but it tends to reform the reflected detonation. After the detonation wave, acetylene content is still relevant and may fuel a detonation again. The high temperature and high pressure regions are mainly concentrated behind the reflected shock wave, while they are lower near the wall.
At ER = 6.0, the behavior of the detonation reflection is nearly the opposite. However, the results are the same, namely the induction mechanism of the secondary detonation wave. At ER = 6.0, the components are located in the secondary induction zone 8. However, there is no sudden change of temperature and pressure, and the stability of pressure and temperature maintains the rapid progress of the reaction. Due to the excitation of the reflected shock wave, the reaction rate is intensified instantaneously and a large amount of energy is released. This results in higher pressure and temperature after the reflected shock wave than after the detonation wave. This process ends with the end of the secondary induction zone 8, and the pyrolysis reaction of acetylene in the detonation product is gradually induced in the overdrive detonation state. For ER = 3.0, the reflected shock excitation process only lasts until the reflected shock intersects the secondary detonation structure and reaches the highest point of temperature and pressure. It then induces the pyrolysis process of acetylene in the detonation product.
Acetylene and pyrene are used as the initial reactant and final product of the reaction, respectively. Looking at their concentrations provides a picture of the overall progress of the reaction. Figure 12 shows the concentration profiles of the two species at different ERs after the detonation hits the wall. Compared with the acetylene content in the flow after detonation, the concentration is higher. Comparing the concentration distributions of pyrene, it can be seen that the concentration of PAH components decreases sharply after the impact of the reflected shock wave. High temperature and high pressure affect the chemical reaction equilibrium, resulting in the fragmentation of PAHs. The process of fragmentation of these species usually involves the reverse process of HACA, which releases large amounts of acetylene and further leads to new PAHs in the low temperature region near the wall. Another remarkable phenomenon is that although the reflected shock wave breaks up the PAHs formed after the detonation wave, the PAHs generated near the wall are two orders of magnitude higher than the original concentration. Even at ER = 6.0, it is an order of magnitude higher. This shows that wall reflection can not only reduce the emission of carbon particles during detonation but also concentrate these carbon particles near the wall. This is a result with important implications for the optimization and control of the carbon particle formation during the detonation process.

4. Conclusions

The detonation behavior of acetylene–air-rich fuel has been numerically simulated based on GKS and a simplified reaction mechanism. Results for the pressure, temperature, and average detonation velocity are slightly lower than the theoretical value of the CJ state. Starting from the macroscopic parameters and specie concentration gradients, the induced reaction process between the detonation propagating shock structure and the chemical reaction region of the flame front has been discussed in detail. To this aim, the process of the detonation hitting the wall has been preliminarily discussed.
Our results show that, in rich fuel conditions, the oxidation reaction only acts as an auxiliary reaction during the induction reaction due to the low oxygen concentration. The energy released is mainly used to overcome the potential energy barrier in the acetylene pyrolysis process and to accelerate the pyrolysis reaction leading to an exothermic reaction process. When the oxygen concentration is further reduced, energy release decreases, and this delays the activation induction time of the acetylene pyrolysis reaction, increases the unreacted pocket, and forms an irregular detonation front structure.
In the acetylene–air-rich fuel condition, there is a secondary detonation wave structure formed by the shear wave interaction. The formation of this structure is mainly due to two reasons. On the one hand, the transverse wave interaction process is stable and has periodic variation. This provides a stable hot spot for secondary detonation, which stimulates the reaction during induction. On the other hand, the vinyl reactant system accelerates the formation of hydrogen atoms and vinylidene radicals. A positive feedback mechanism is thus established and further increases in temperature and pressure were obtained. In turn, a detonation wave powered by the pyrolysis of acetylene is formed.
The reflected shock wave after the detonation hits the wall, destroys the PAHs species in the acetylene detonation products, and releases acetylene. A region of high acetylene concentration is thus formed near the wall, and it gradually forms PAHs again with the decrease in pressure and temperature. This process accumulated PAH detonation products near the wall and may be exploited to effectively control the distribution of PAHs. In the absence of secondary detonation, a strongly exothermic process is obtained, indicating that the flow after detonation is in an induced process activated by the reflected shock wave. Our analysis of the wall’s reflection process provides an explanation for the secondary detonation structure. This has theoretical and practical significance for understanding the detonation propagation process and the parameter changes that control the detonation.

Author Contributions

Conceptualization, H.G.; methodology, H.G.; software, H.G.; validation, H.G.; formal analysis, H.G.; investigation, H.G.; resources, H.G.; data curation, H.G.; writing—original draft preparation, H.G.; writing—review and editing, H.G.; visualization, H.G.; supervision, H.G.; project administration, H.G.; funding acquisition, H.T. All authors have read and agreed to the published version of the manuscript.

Funding

This research was funded by National Natural Science Foundation of China, grant number 50776045, 51576098.

Institutional Review Board Statement

Not applicable.

Informed Consent Statement

Not applicable.

Data Availability Statement

Not applicable.

Conflicts of Interest

The authors declare no conflict of interest.

References

  1. Emel’Yanov, A.V.; Eremin, A.V.; Fortov, V.E. Formation of a detonation wave in the process of chemical condensation of carbon nanoparticles. J. Eng. Phys. Rus 2010, 83, 1197–1209. [Google Scholar] [CrossRef]
  2. Emelianov, A.; Eremin, A.; Jander, H.; Wagner, H. Carbon condensation wave in C3O2 and C2H2 initiated by a shock wave. Proc. Combust. Inst. 2011, 33, 525–532. [Google Scholar] [CrossRef]
  3. Knorre, V.G.; Kopylev, M.S.; Tesner, P.A. Role of soot in acetylene detonation. Combust. Explos. Shock. Waves 1977, 13, 732–736. [Google Scholar] [CrossRef]
  4. Golub, V.V.; Gurentsov, E.; Emel’Yanov, A.V.; Eremin, A.V.; Fortov, V.E. Energy gain of the detonation pyrolysis of acetylene. High Temp. 2015, 53, 363–369. [Google Scholar] [CrossRef]
  5. Frenklach, M.; Mebel, A.M. On the mechanism of soot nucleation. PCCP 2020, 22, 5314–5331. [Google Scholar] [CrossRef] [PubMed]
  6. Mikhalchenko, E.V.; Nikitin, V.F. Rotating detonation engine fed by acetylene-oxygen combustible mixture modeling. AIP Conf. Proc. 2020, 2304, 020022. [Google Scholar]
  7. Nabavi-Pelesaraei, A.; Bayat, R.; Hosseinzadeh-Bandbafha, H.; Afrasyabi, H.; Chau, K.-W. Modeling of energy consumption and environmental life cycle assessment for incineration and landfill systems of municipal solid waste management—A case study in Tehran Metropolis of Iran. J. Clean. Prod. 2017, 148, 427–440. [Google Scholar] [CrossRef]
  8. Nabavi-Pelesaraei, A.; Rafiee, S.; Mohammadkashi, N.; Chau, K.-W.; Mostashari-Rad, F. Principle of Life Cycle Assessment and Cumulative Exergy Demand for Biodiesel Production: Farm-To-Combustion Approach; Springer International Publishing: Cham, Switzerland, 2022; pp. 127–169. [Google Scholar]
  9. Martin, J.W.; Salamanca, M.; Kraft, M. Soot inception: Carbonaceous nanoparticle formation in flames. Prog. Energy Combust. 2022, 88, 100956. [Google Scholar] [CrossRef]
  10. Shtertser, A.; Rybin, D.; Ulianitsky, V.; Park, W.; Datekyu, M.; Wada, T.; Kato, H. Characterization of nanoscale detonation carbon produced in a pulse gas-detonation device. Diam. Relat. Mater. 2020, 101, 107553. [Google Scholar] [CrossRef]
  11. Premnath, N.; Mohanrasu, K.; Rao, R.G.R.; Dinesh, G.; Prakash, G.S.; Ananthi, V.; Ponnuchamy, K.; Muthusamy, G.; Arun, A. A crucial review on polycyclic aromatic Hydrocarbons - Environmental occurrence and strategies for microbial degradation. Chemosphere 2021, 280, 130608. [Google Scholar] [CrossRef]
  12. Poludnenko, A.Y.; Chambers, J.; Ahmed, K.; Gamezo, V.N.; Taylor, B.D. A unified mechanism for unconfined deflagration-to-detonation transition in terrestrial chemical systems and type Ia supernovae. Science 2019, 366, 7365. [Google Scholar] [CrossRef] [PubMed] [Green Version]
  13. Kistiakowsky, G.B.; Knight, H.T.; Malin, M.E. Gaseous Detonations. IV. The Acetylene-Oxygen Mixtures. J. Chem. Phys. 1952, 20, 884–887. [Google Scholar] [CrossRef]
  14. Guilly, V.; Khasainov, B.; Presles, H.-N.; Desbordes, D. Simulation numérique des détonations à double structure cellulaire. Cr. Mec. 2006, 334, 679–685. [Google Scholar] [CrossRef]
  15. Smirnov, N.; Betelin, V.; Nikitin, V.; Phylippov, Y.; Koo, J. Detonation engine fed by acetylene–oxygen mixture. Acta Astronaut. 2014, 104, 134–146. [Google Scholar] [CrossRef]
  16. Batraev, I.S.; Vasil’Ev, A.A.; Ul’Yanitskii, V.Y.; Shtertser, A.A.; Rybin, D.K. Investigation of Gas Detonation in Over-Rich Mixtures of Hydrocarbons with Oxygen. Combust. Explos. Shock Waves 2018, 54, 207–215. [Google Scholar] [CrossRef]
  17. Mahmoudi, Y.; Mazaheri, K. High resolution numerical simulation of triple point collision and origin of unburned gas pockets in turbulent detonations. Acta Astronaut. 2015, 115, 40–51. [Google Scholar] [CrossRef]
  18. Yi, T.H.; Lu, F.K.; Wilson, D.R.; Emanuel, G. Numerical study of detonation wave propagation in a confined supersonic flow. Shock Waves 2017, 27, 395–408. [Google Scholar] [CrossRef]
  19. Ago, A.; Tsuboi, N.; Dzieminska, E.; Hayashi, A.K. Two-Dimensional Numerical Simulation of Detonation Transition with Multi-Step Reaction Model: Effects of Obstacle Height. Combust. Sci. Technol. 2019, 191, 659–675. [Google Scholar] [CrossRef]
  20. Deng, X.; Xie, B.; Teng, H.; Xiao, F. High resolution multi-moment finite volume method for supersonic combustion on unstructured grids. Appl. Math. Model. 2019, 66, 404–423. [Google Scholar] [CrossRef]
  21. Fang, Y.; Zhang, Y.; Deng, X.; Teng, H. Structure of wedge-induced oblique detonation in acetylene-oxygen-argon mixtures. Phys. Fluids 2019, 31, 026108. [Google Scholar]
  22. Xiao, H.; Oran, E.S. Shock focusing and detonation initiation at a flame front. Combust. Flame 2019, 203, 397–406. [Google Scholar] [CrossRef]
  23. Lian, Y.; Xu, K. A Gas-Kinetic Scheme for Multimaterial Flows and Its Application in Chemical Reactions. J. Comput. Phys. 2000, 163, 349–375. [Google Scholar] [CrossRef] [Green Version]
  24. Pan, L.; Cheng, J.; Wang, S.; Xu, K. A Two-Stage Fourth-Order Gas-Kinetic Scheme for Compressible Multicomponent Flows. Commun. Comput. Phys. 2017, 22, 1123–1149. [Google Scholar] [CrossRef]
  25. Yang, L.M.; Shu, C.; Chen, Z.; Liu, Y.Y.; Wu, J.; Shen, X. Gas kinetic flux solver based high-order finite-volume method for simulation of two-dimensional compressible flows. Phys. Rev. E 2021, 104, 015305. [Google Scholar] [CrossRef] [PubMed]
  26. Van Leer, B. Towards the ultimate conservative difference scheme. V. A second-order sequel to Godunov’s method. J. Comput. Phys. 1979, 32, 101–136. [Google Scholar] [CrossRef]
  27. Van Albada, G.D.; van Leer, B.; Roberts, W.W. A Comparative Study of Computational Methods in Cosmic Gas Dynamics, in Upwind and High-Resolution Schemes; Springer: Berlin/Heidelberg, Germany, 1997; pp. 95–103. [Google Scholar]
  28. Yin, Z.; Linga, P. Methane hydrates: A future clean energy resource. Chin. J. Chem. Eng. 2019, 27, 2026–2036. [Google Scholar] [CrossRef]
  29. Reizer, E.; Viskolcz, B.; Fiser, B. Formation and growth mechanisms of polycyclic aromatic hydrocarbons: A mini-review. Chemosphere 2022, 291, 132793. [Google Scholar] [CrossRef]
  30. Tao, H.; Wang, H.-Y.; Ren, W.; Lin, K.C. Kinetic mechanism for modeling the temperature effect on PAH formation in pyrolysis of acetylene. Fuel 2019, 255, 115796. [Google Scholar] [CrossRef]
  31. Kathrotia, T.; Oßwald, P.; Naumann, C.; Richter, S. Combustion kinetics of alternative jet fuels, Part-II: Reaction model for fuel surrogate. Fuel 2021, 302, 120736. [Google Scholar] [CrossRef]
  32. Glarborg, P.; Miller, J.A.; Ruscic, B.; Klippenstein, S.J. Modeling nitrogen chemistry in combustion. Prog. Energy Combust. 2018, 67, 31–68. [Google Scholar] [CrossRef] [Green Version]
  33. Alekseev, V.A.; Bystrov, N.; Emelianov, A.; Eremin, A.; Yatsenko, P.; Konnov, A.A. High-temperature oxidation of acetylene by N2O at high Ar dilution conditions and in laminar premixed C2H2 + O2 + N2 flames. Combust. Flame 2022, 238, 111924. [Google Scholar] [CrossRef]
  34. Burke, M.P.; Chaos, M.; Ju, Y.; Dryer, F.L.; Klippenstein, S.J. Comprehensive H2/O2 kinetic model for high-pressure combustion. Int. J. Chem. Kinet. 2012, 44, 444–474. [Google Scholar] [CrossRef]
  35. Lopez, J.G.; Rasmussen, C.L.; Alzueta, M.U.; Gao, Y.; Marshall, P.; Glarborg, P. Experimental and Kinetic Modeling Study of C2H2 Oxidation at High Pressure. Int. J. Chem. Kinet. 2016, 48, 724–738. [Google Scholar] [CrossRef]
  36. Shen, X.; Yang, X.; Santner, J.; Sun, J.; Ju, Y. Experimental and kinetic studies of acetylene flames at elevated pressures. Combust. Inst. 2015, 35, 721–728. [Google Scholar] [CrossRef]
  37. Norinaga, K.; Janardhanan, V.M.; Deutschmann, O. Detailed chemical kinetic modeling of pyrolysis of ethylene, acetylene, and propylene at 1073–1373 K with a plug-flow reactor model. Int. J. Chem. Kinet. 2008, 40, 199–208. [Google Scholar] [CrossRef]
  38. Liu, M.; Chu, T.-C.; Jocher, A.; Smith, M.C.; Lengyel, I.; Green, W.H. Predicting polycyclic aromatic hydrocarbon formation with an automatically generated mechanism for acetylene pyrolysis. Int. J. Chem. Kinet. 2021, 53, 27–42. [Google Scholar] [CrossRef]
  39. Haas, J.-F.; Sturtevant, B. Interaction of weak shock waves with cylindrical and spherical gas inhomogeneities. J. Fluid Mech. 1987, 181, 41–76. [Google Scholar] [CrossRef] [Green Version]
Figure 1. The schlieren-type images of density of the numerical results for shock bubble interaction (air-helium interaction). (a) t = 32 μs; (b) t = 52 μs; (c) t = 82 μs; (d) t = 105 μs; (e) t = 245 μs; (f) t = 427 μs.
Energies 15 04985 g001
Figure 2. The schlieren-type images of density of the numerical results for shock bubble interaction (air-R22 interaction). (a) t = 115 μs; (b) t = 187 μs; (c) t = 247 μs; (d) t = 342 μs; (e) t = 417 μs; (f) t = 1020 μs.
Energies 15 04985 g002
Figure 3. Influence of different pressure (left) and different equivalent ratio (right) on ignition delay time. P.W.—present work. Glarborg—[35].
Energies 15 04985 g003
Figure 4. Influence of different pressure on laminar flame speed. P.W.—present work. Exp—experimental data [36].
Energies 15 04985 g004
Figure 5. Numerical simulation of the prediction results of acetylene pyrolysis species concentrations (light molecules) and data with experimental results. P.W.—present work. Exp—Norinaga et al. [37].
Energies 15 04985 g005
Figure 6. Numerical simulation of the prediction results of acetylene pyrolysis species concentrations (heavy molecules) and data with experimental results. P.W.—present work. Exp—Norinaga et al. [37].
Energies 15 04985 g006
Figure 7. Characteristic geometrical dimensions of a detonation cell for (a) ER = 3.0; (b) ER = 6.0. The dark area is the trajectory of the triple points. The numerical result is the maximum pressure during detonation propagation.
Energies 15 04985 g007
Figure 8. The instantaneous pressure distribution of the detonation wave at ER is 3.0 (a); ER is 6.0 (b). The propagation direction is from left to right: 1, 1′, shock front (Mach stem); 2, 2′, shock front (incident shock); 3, flame front; 4, induction zone; 5, transverse wave; 5′, weak transverse wave; 6, 6′, triple point; 7, extend of transverse wave; 7′, tail of transverse wave; 8, second induction zone; I, II, III, different reaction zone.
Energies 15 04985 g008
Figure 9. The instantaneous temperature distribution of the detonation wave at (a) ER is 3.0; (b) ER is 6.0. The propagation direction is from left to right. a, triple point; b–e, flame front; f, g, slip line; h, induction zone; j, m, gas region after flame front; k, unreacted pocket; n, low temperature zone; I, II, III, different reaction zone.
Energies 15 04985 g009
Figure 10. Detailed indication of local species gradient at a triple point.
Energies 15 04985 g010
Figure 11. Pressure and temperature distributions at different equivalence ratios after detonation impacts the wall for 0.2 µs. (a) Pressure at ER = 3.0; (b) Temperature at ER = 3.0; (c) Pressure at ER = 6.0; (d) Temperature at ER = 6.0.
Energies 15 04985 g011
Figure 12. Mass concentration distribution of acetylene (C2H2) and pyrene (A4) at different equivalence ratios after detonation impacts the wall for 0.2 µs. (a) acetylene at ER = 3.0; (b) pyrene at ER = 3.0; (c) acetylene at ER = 6.0; (d) pyrene at ER = 6.0.
Energies 15 04985 g012
Table 1. Cell characteristic parameters under different ER obtained by numerical calculation.
Characteristic ParametersComputation Results
ER = 3.0ER = 6.0
λ/l0.530.44~0.5
α11.5010.68~15.35
β37.9428.78~36.87
Publisher’s Note: MDPI stays neutral with regard to jurisdictional claims in published maps and institutional affiliations.

