
Key Points and Current Studies on Seepage Theories of Marine Natural Gas Hydrate-Bearing Sediments: A Narrative Review


 ,
,
Abstract
:1. Introduction
2. Application of Seepage Law in NGHs
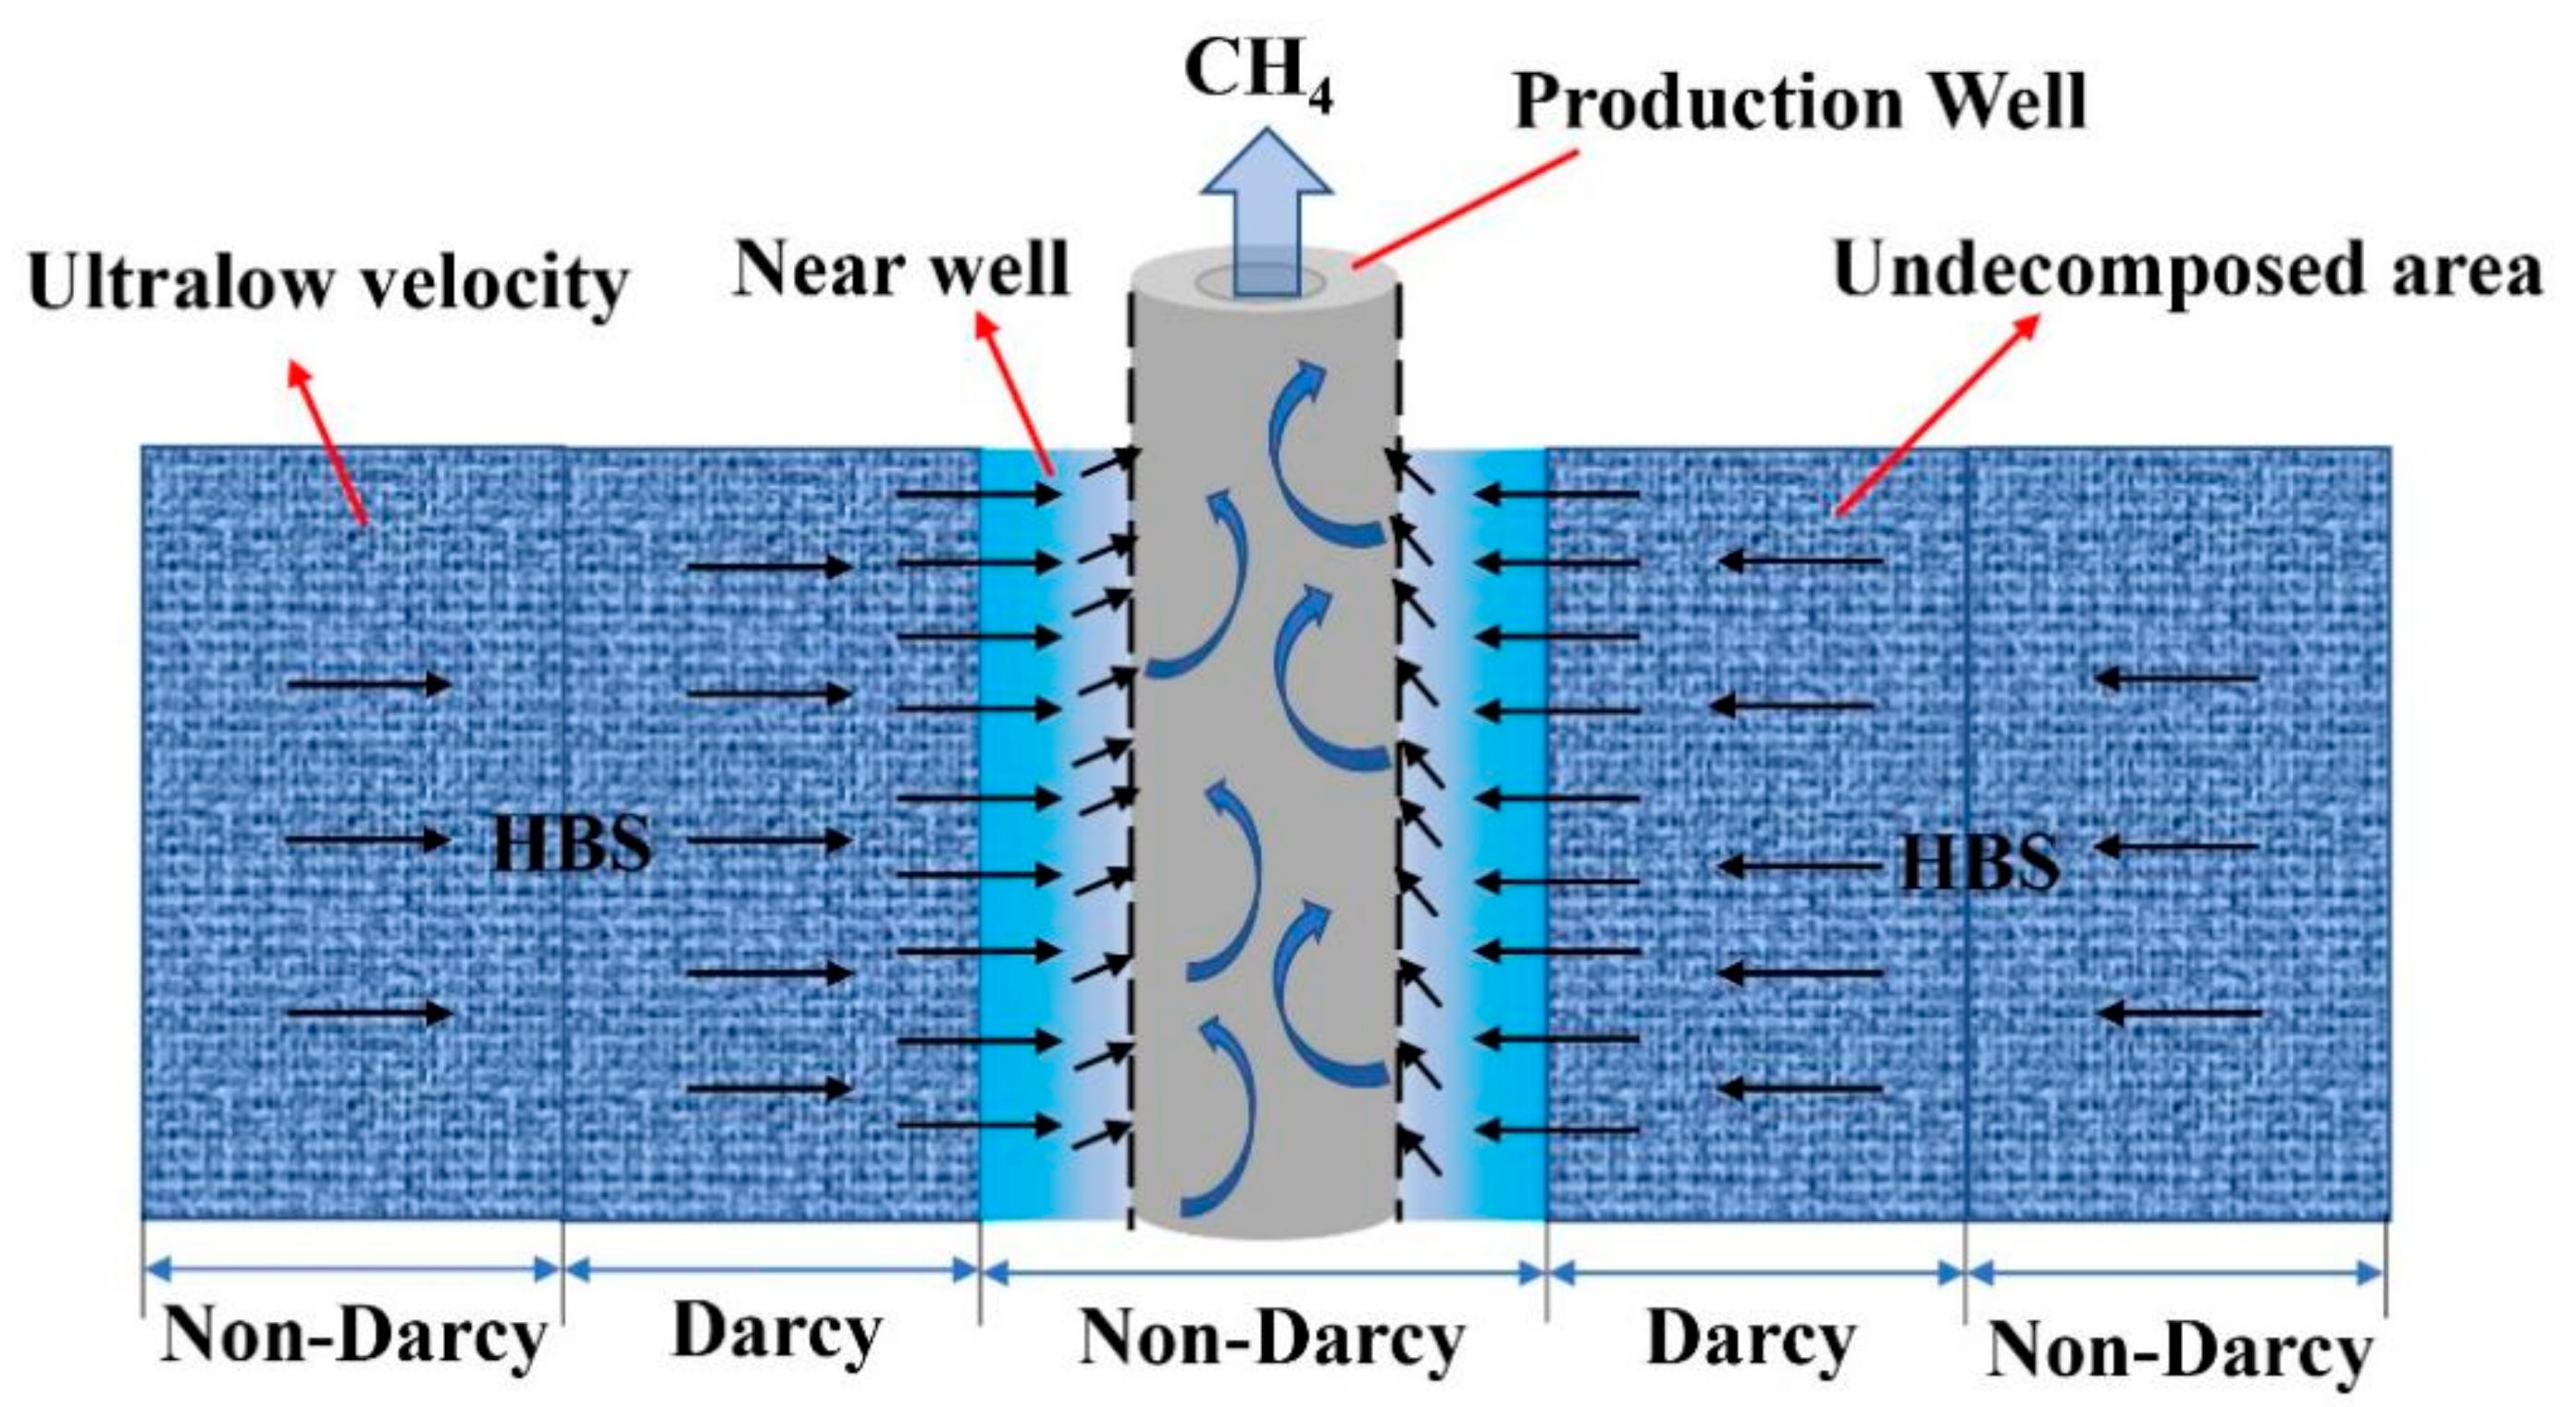
- (1)
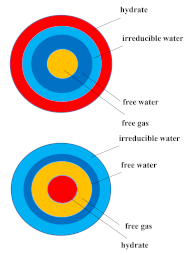
- The exploitation area near the production well: Because the pressure at the bottom of the production well is less than that in HBS, NGHs transition into methane and water. Under the pressure difference between the front and the back, the fluid velocity is too fast to satisfy the linear relationship between flow velocity and pressure drop. This phenomenon belongs to high-speed non-Darcy flow. Three kinds of non-Darcy flow (up warping, down bending and compound) will appear due to the obvious change in the pressure drop. For some areas with large pore size or decomposition, the influence of velocity with pressure drop is small, and the trend of down bending appears easily. Conversely, if the pore size of the area is small, a small amount of hydrate decomposes and there is no obvious dominant channel. When the pressure breaks through the starting pressure gradient, the flow rate and pressure drop show an obvious upward trend. Similarly, complex piecewise non-Darcy flows also exist.
- (2)
- Stability zone of HBS: This region is far away from the production well. HBS is relatively stable and does not decompose. However, this area determines the final effect of exploitation because the decomposition front is continuously spreading to the HBS stability zone to achieve continuous mining. In this process, permeability is a crucial parameter for evaluating the exploitation efficiency.
- (3)
- Boundary of HBS: This is often an unexploited area where the pressure drop does not propagate. In this region, there is no pressure difference driving without reaching the staring pressure gradient, the fluids in an ultralow velocity. Low-velocity non-Darcy flow will happen, which belongs to the down-bending curve. According to the flow characteristics, we should attach more importance to describe flow capacity in the stability zone.
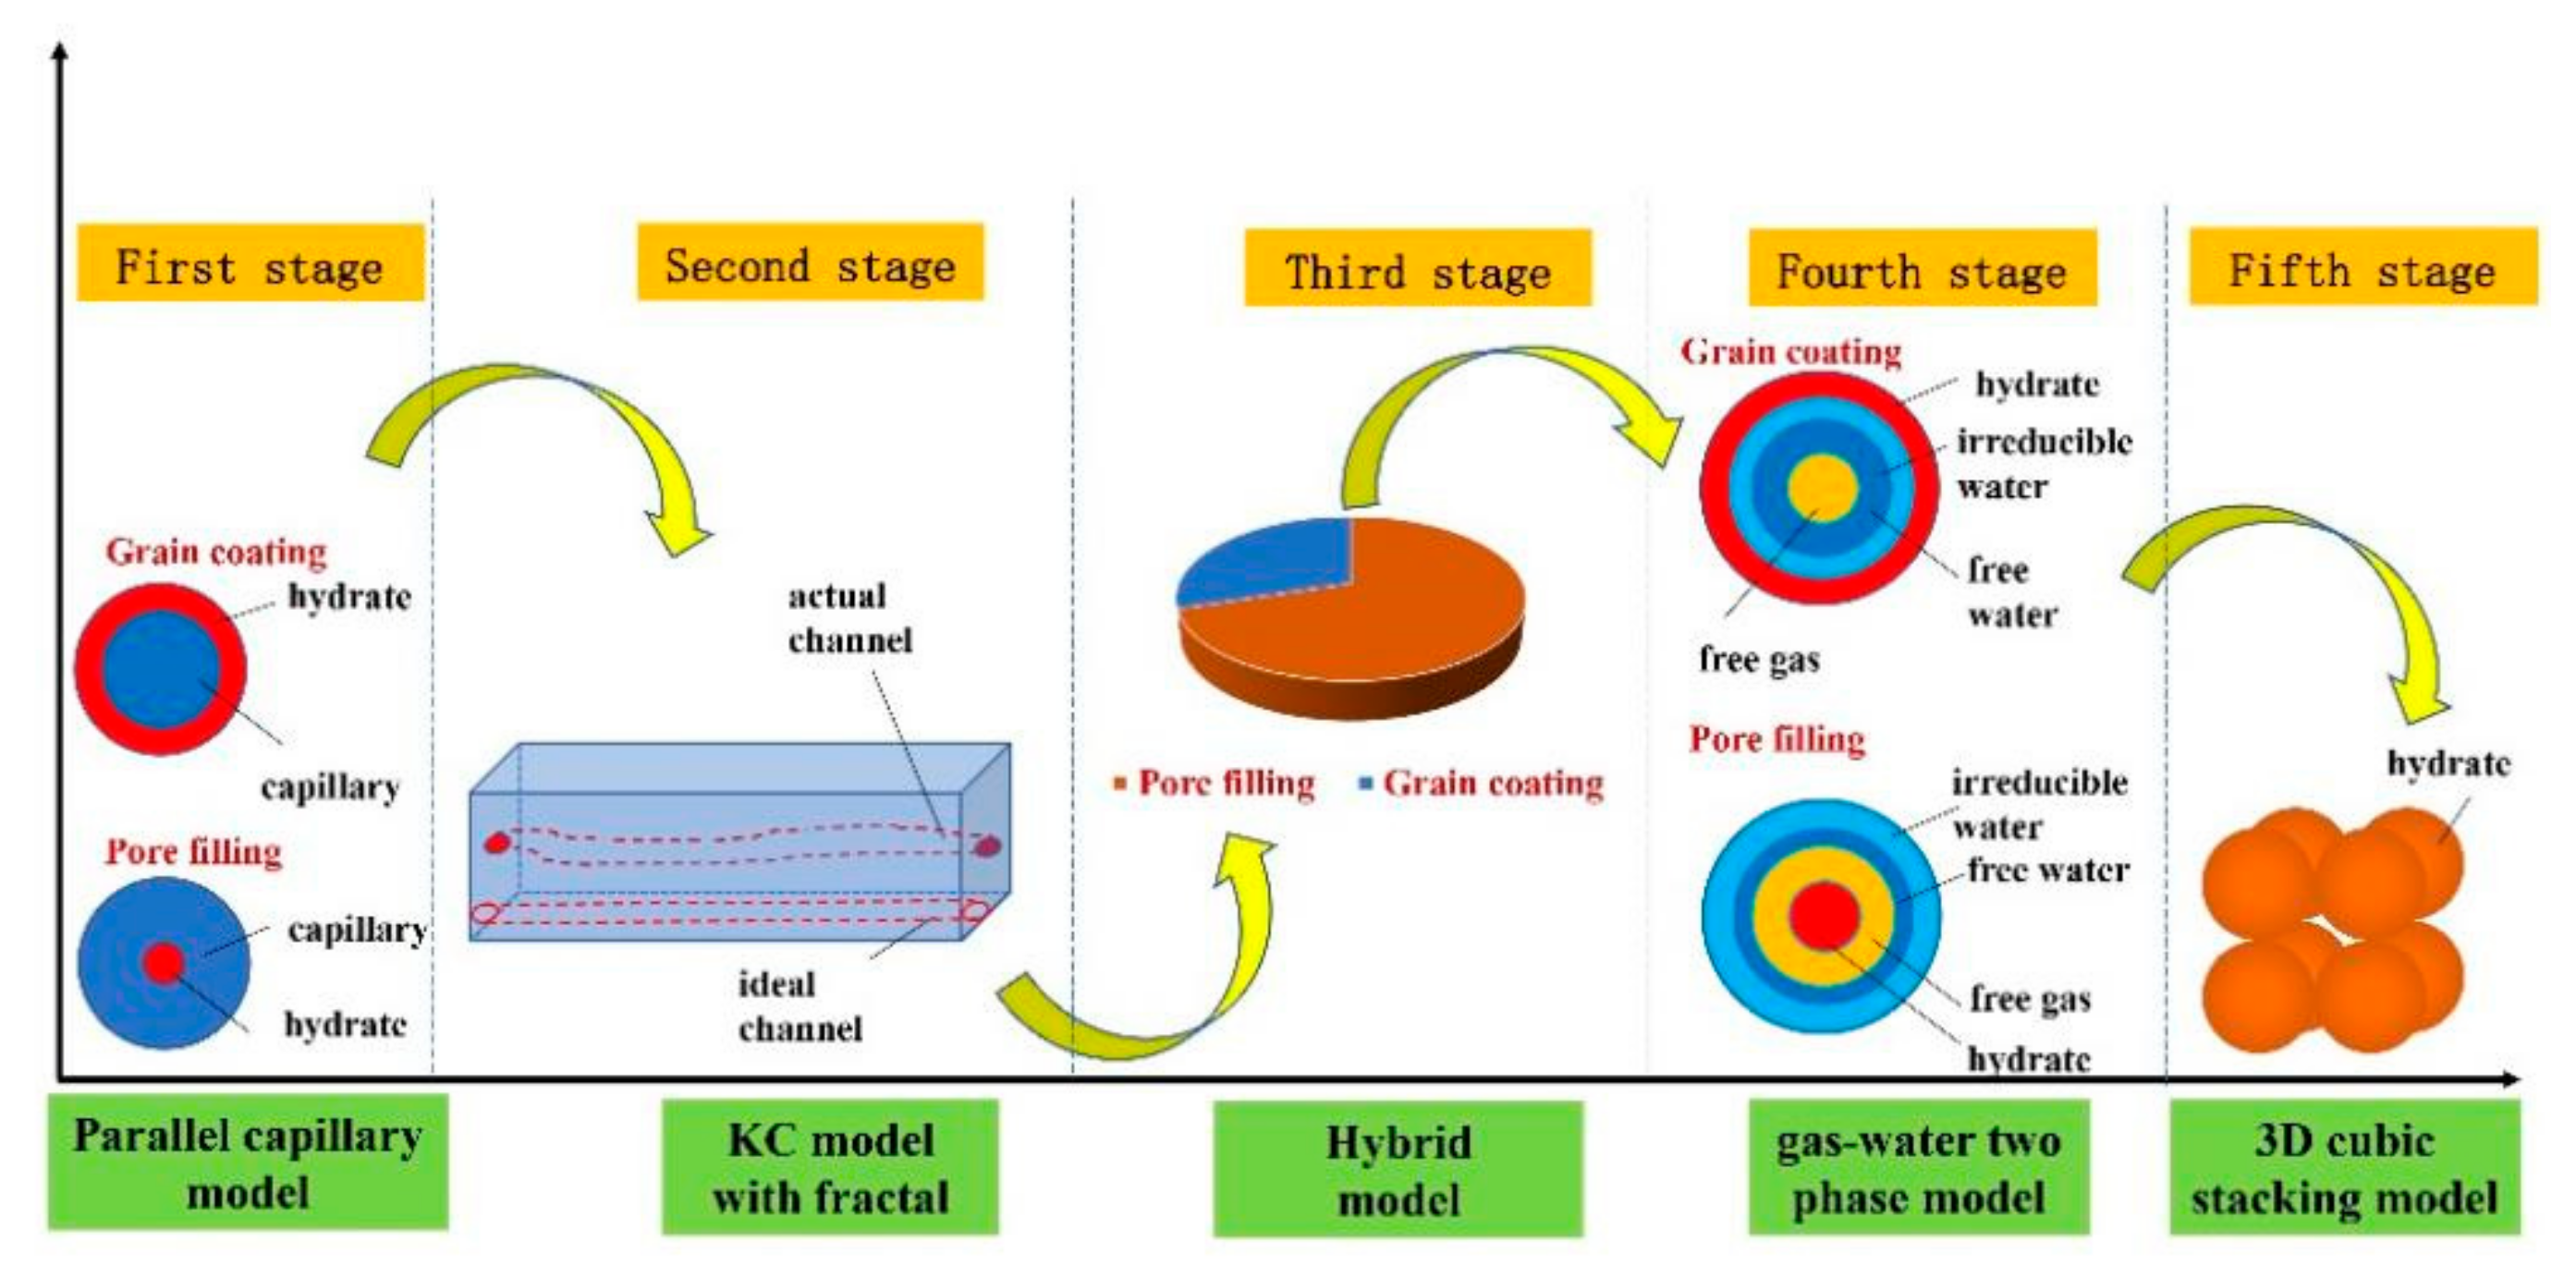
3. Traditional Seepage Theories in NGHs
3.1. Parallel Capillary Model
3.2. Kozeny–Carman Model with Fractal Theory
3.2.1. Development of Tortuosity in Fractal Theory
3.2.2. Electrical Tortuosity in HBS
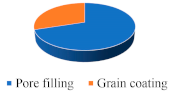
- (1)
- Grain coating
- (2)
- Pore filling
3.3. Hybrid Model
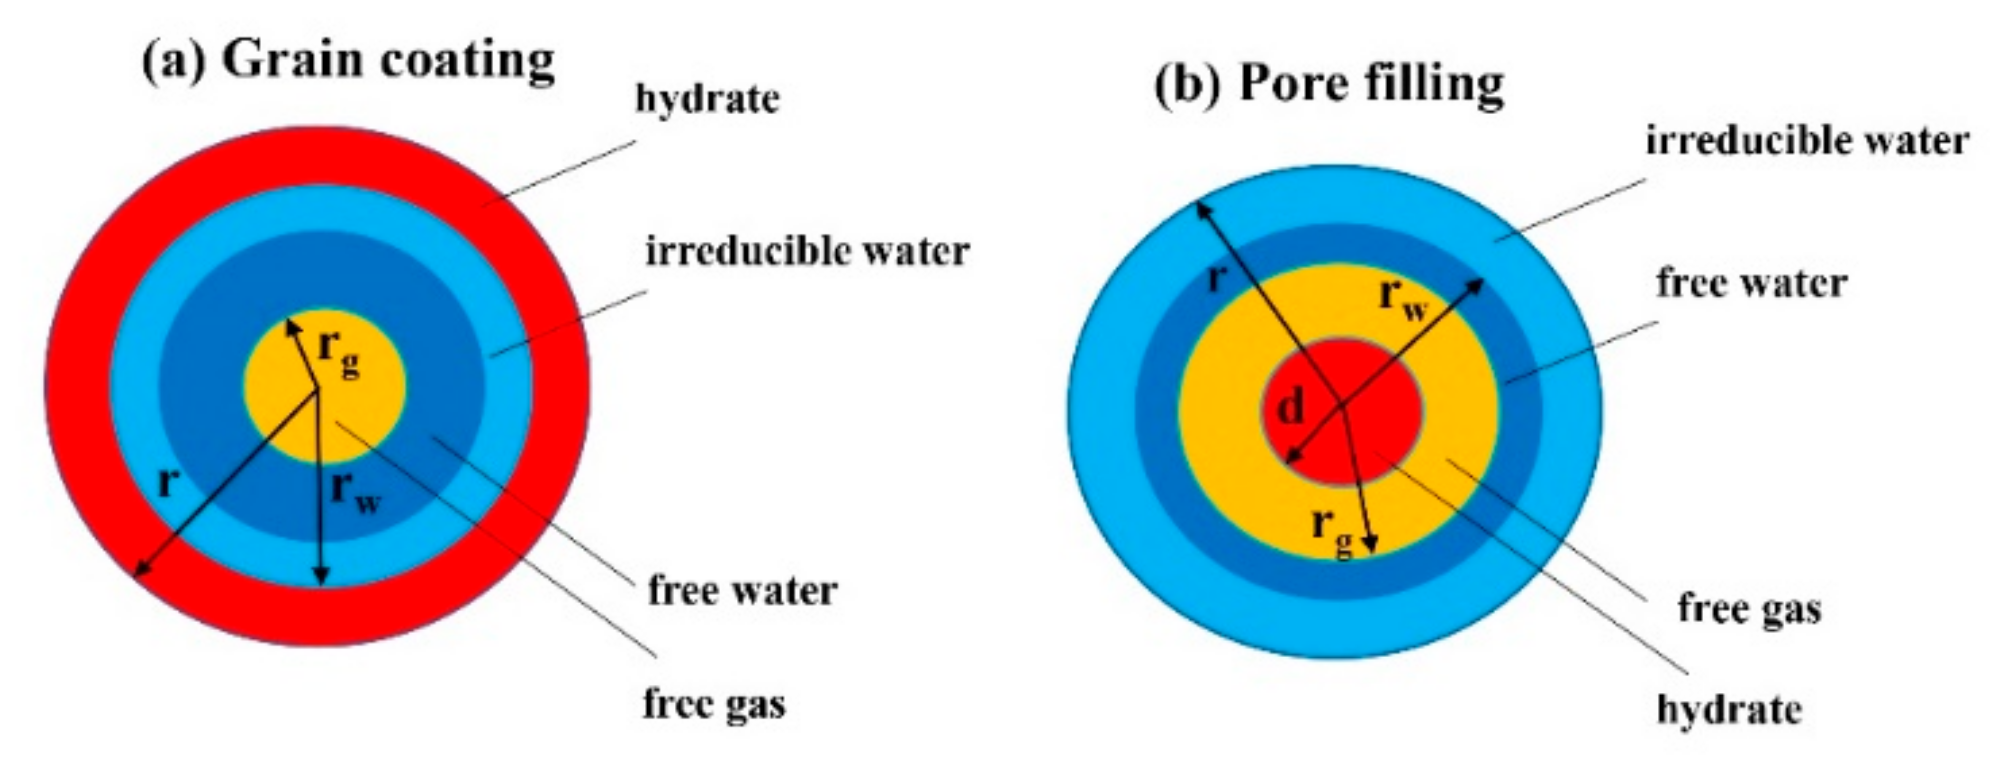
3.4. Gas–Water Two-Phase Seepage Model
- (1)
- Grain coating
- (2)
- Pore filling
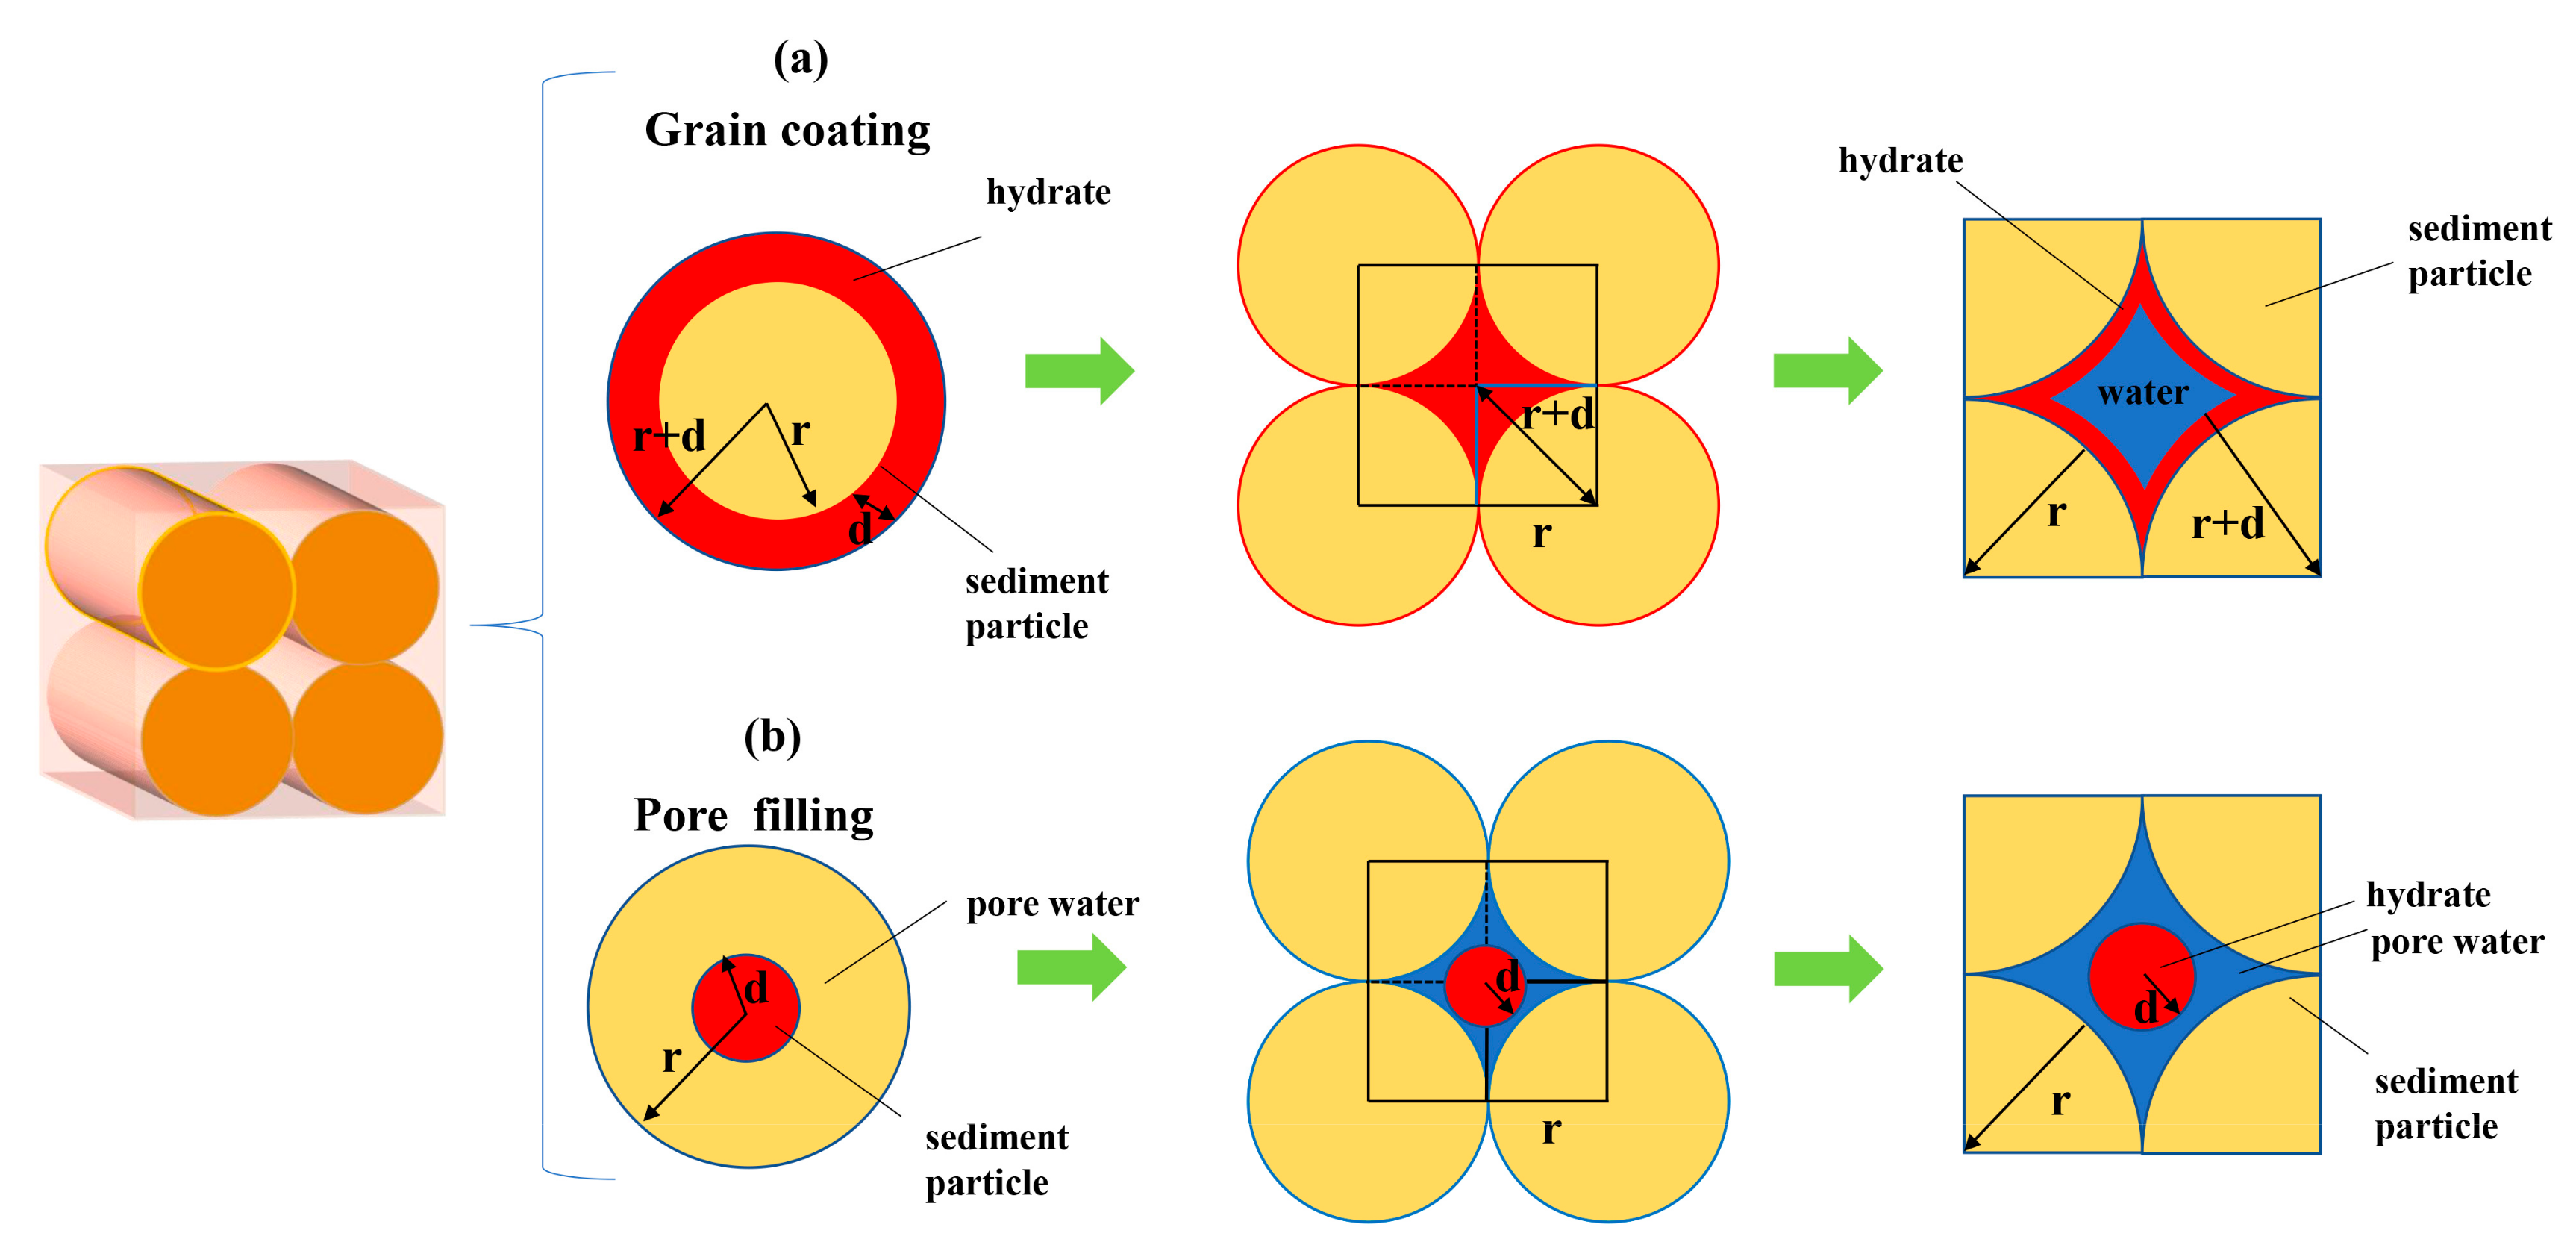
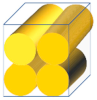
3.5. Three-Dimensional Cubic Stacking Model
3.5.1. Cylindrical Accumulation
- (a)
- Grain coating
- (b) Pore filling
3.5.2. Spherical Accumulation
- (1)
- Grain coating
- (2)
- Pore filling
3.5.3. Random Accumulation
3.6. Other Models
3.7. Overview of Permeability Models in HBS
3.8. Permeability Prediction Model of Original Sediments
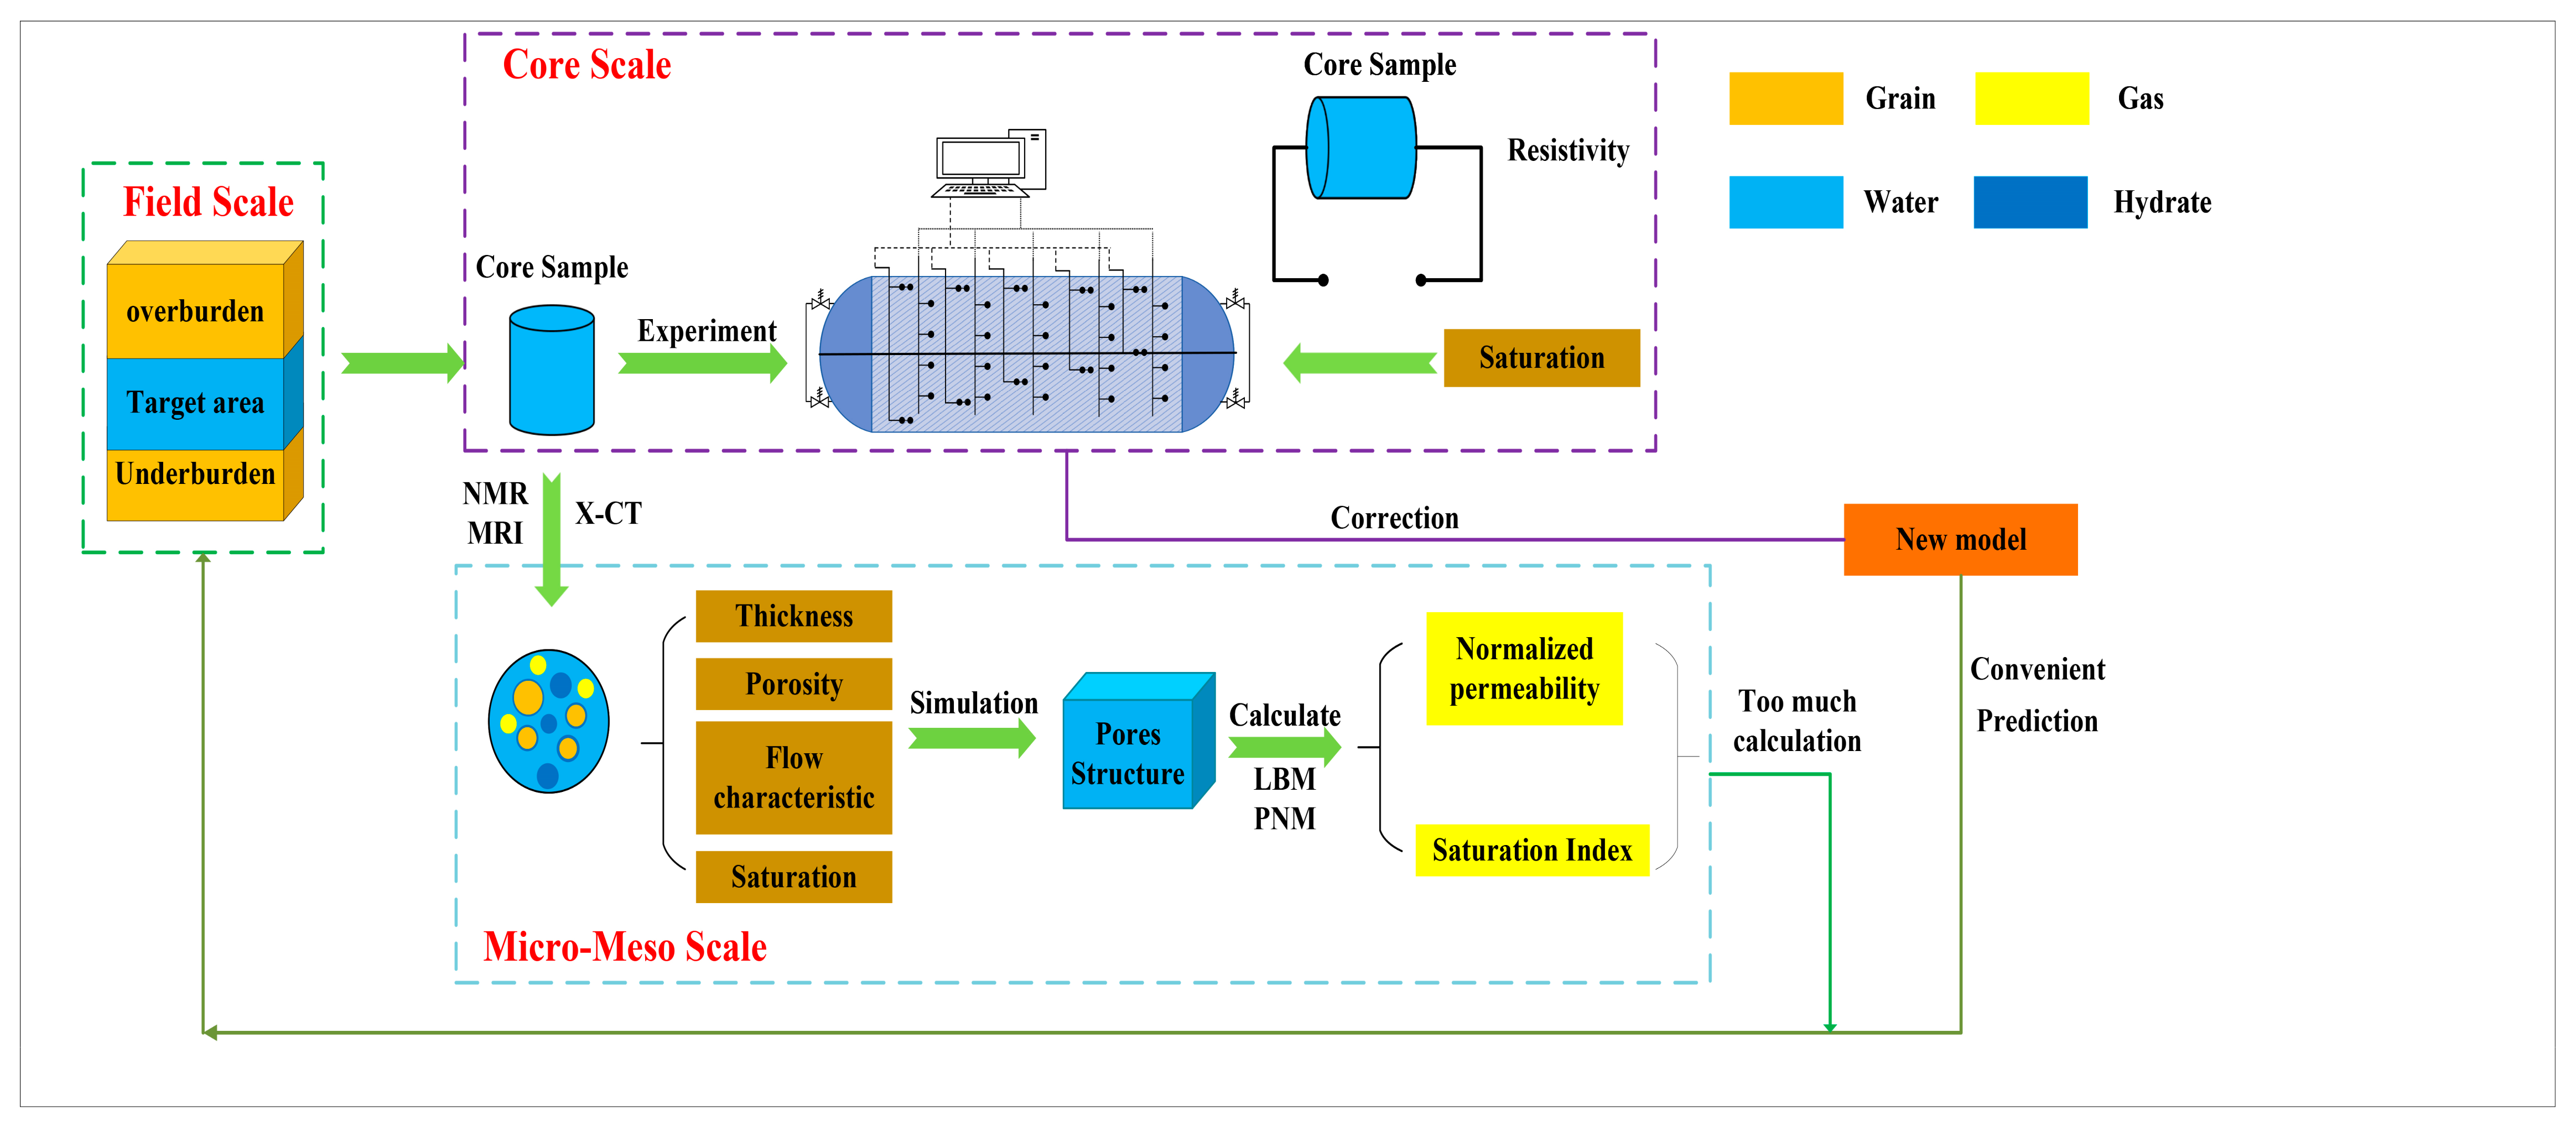
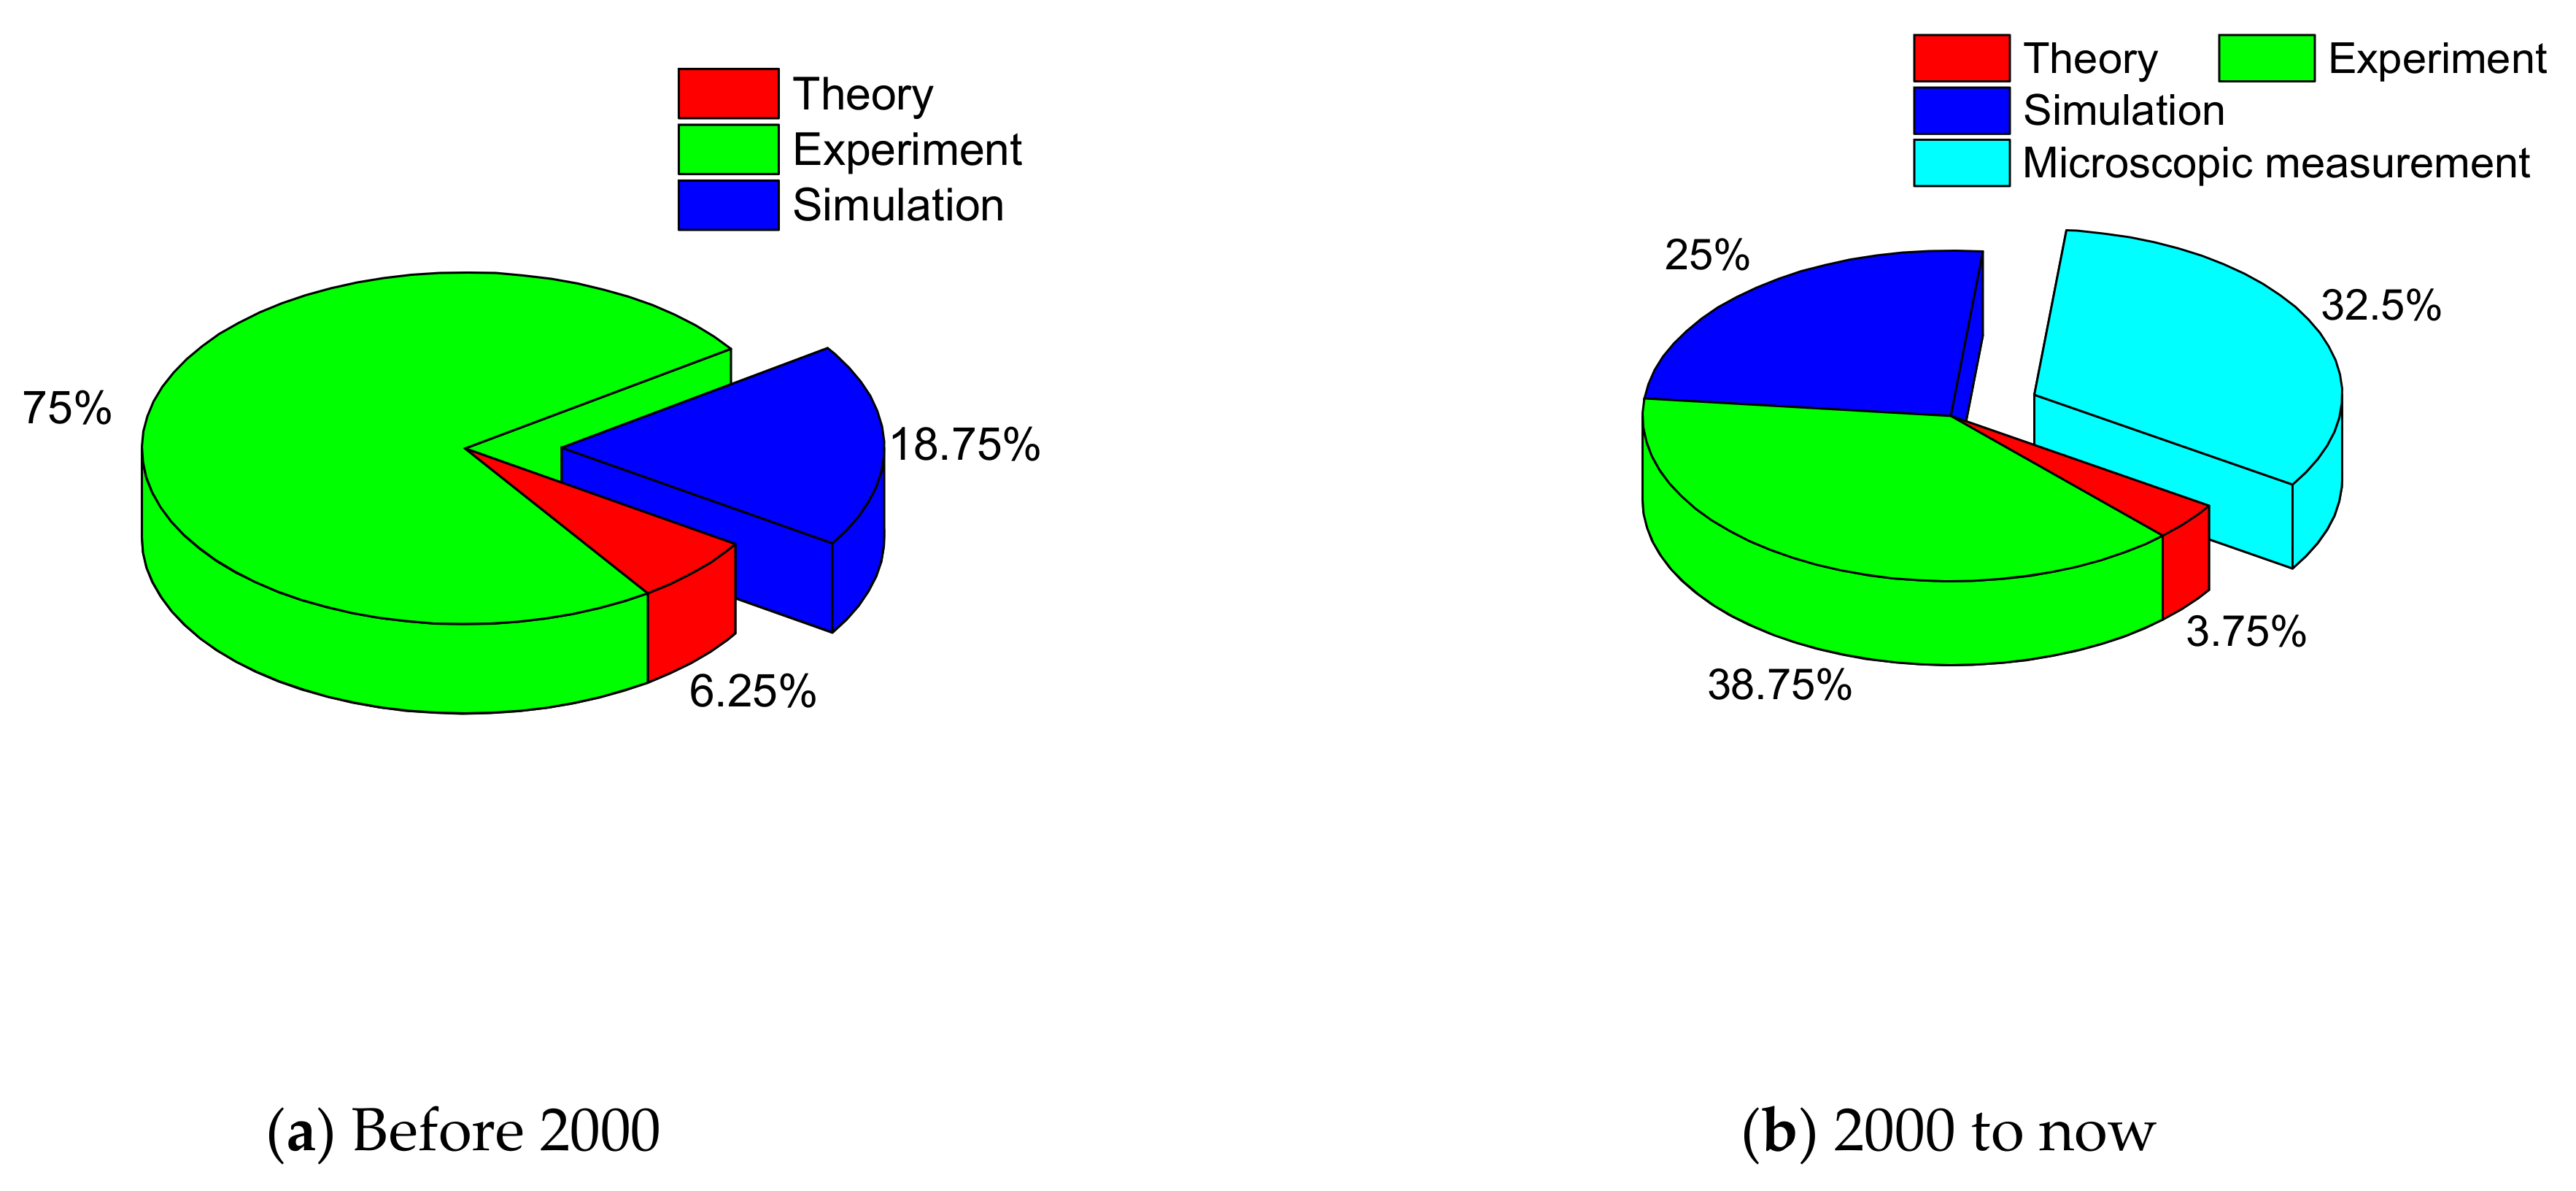
4. Extension of Seepage Theories in NGHs Combined with Frontier Technology
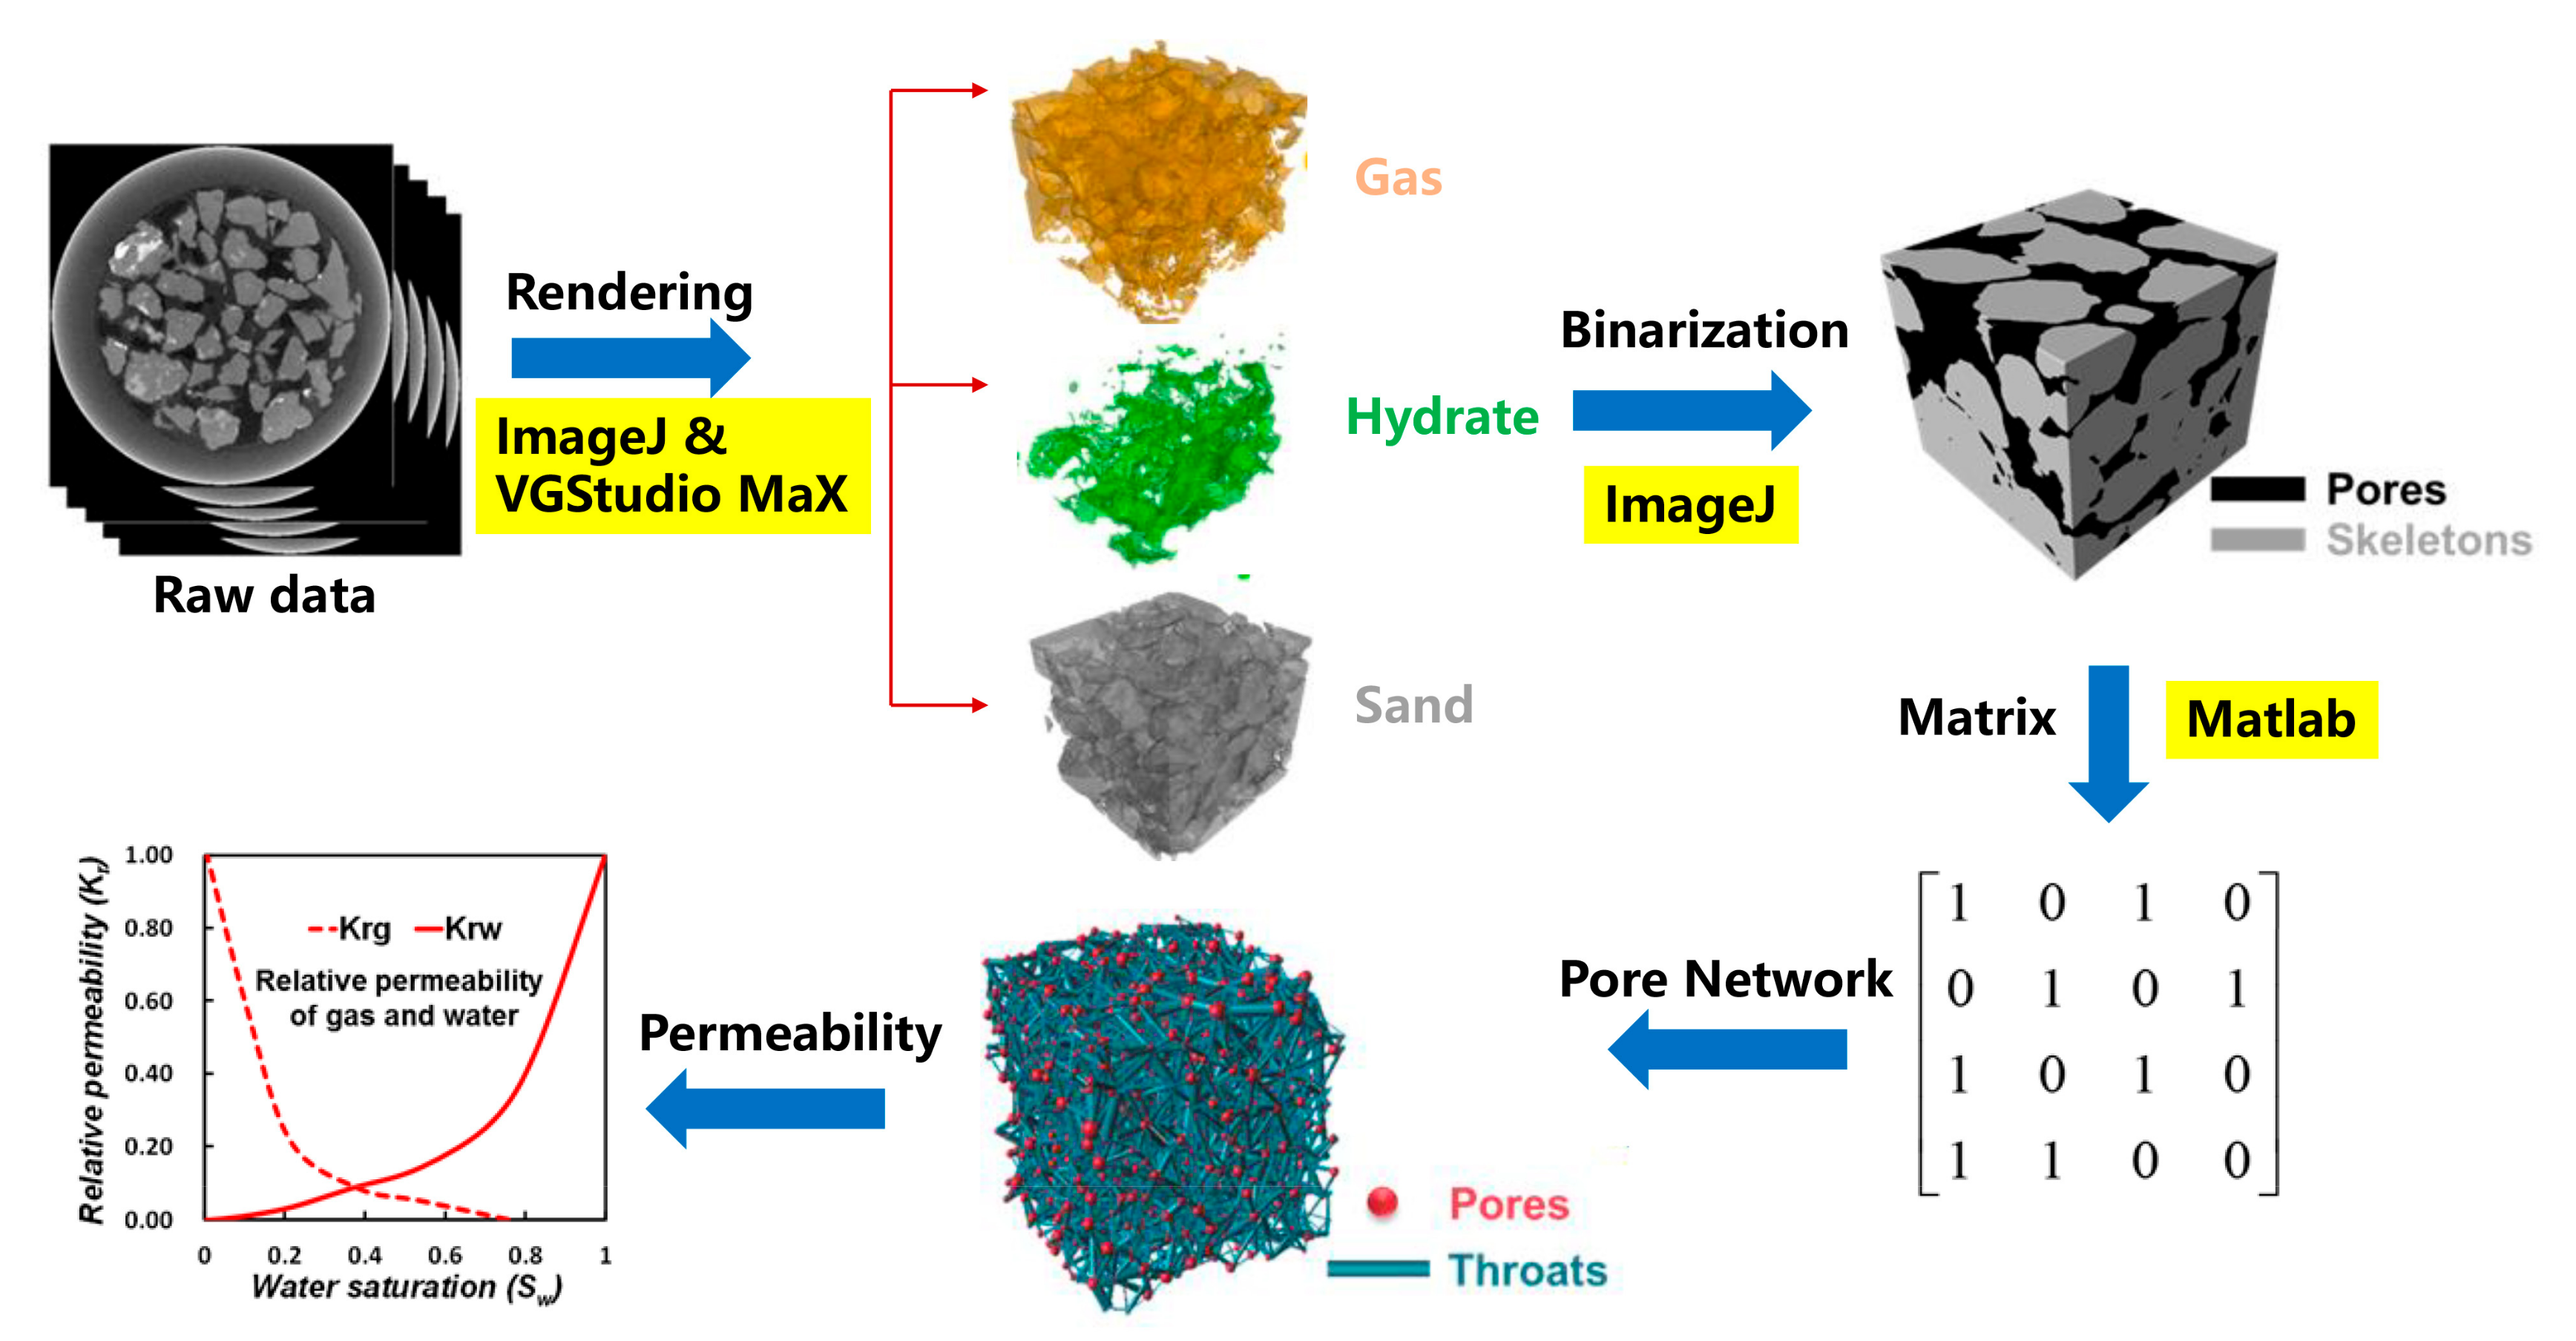
4.1. Seepage Theories in NGHs Using CT Technique
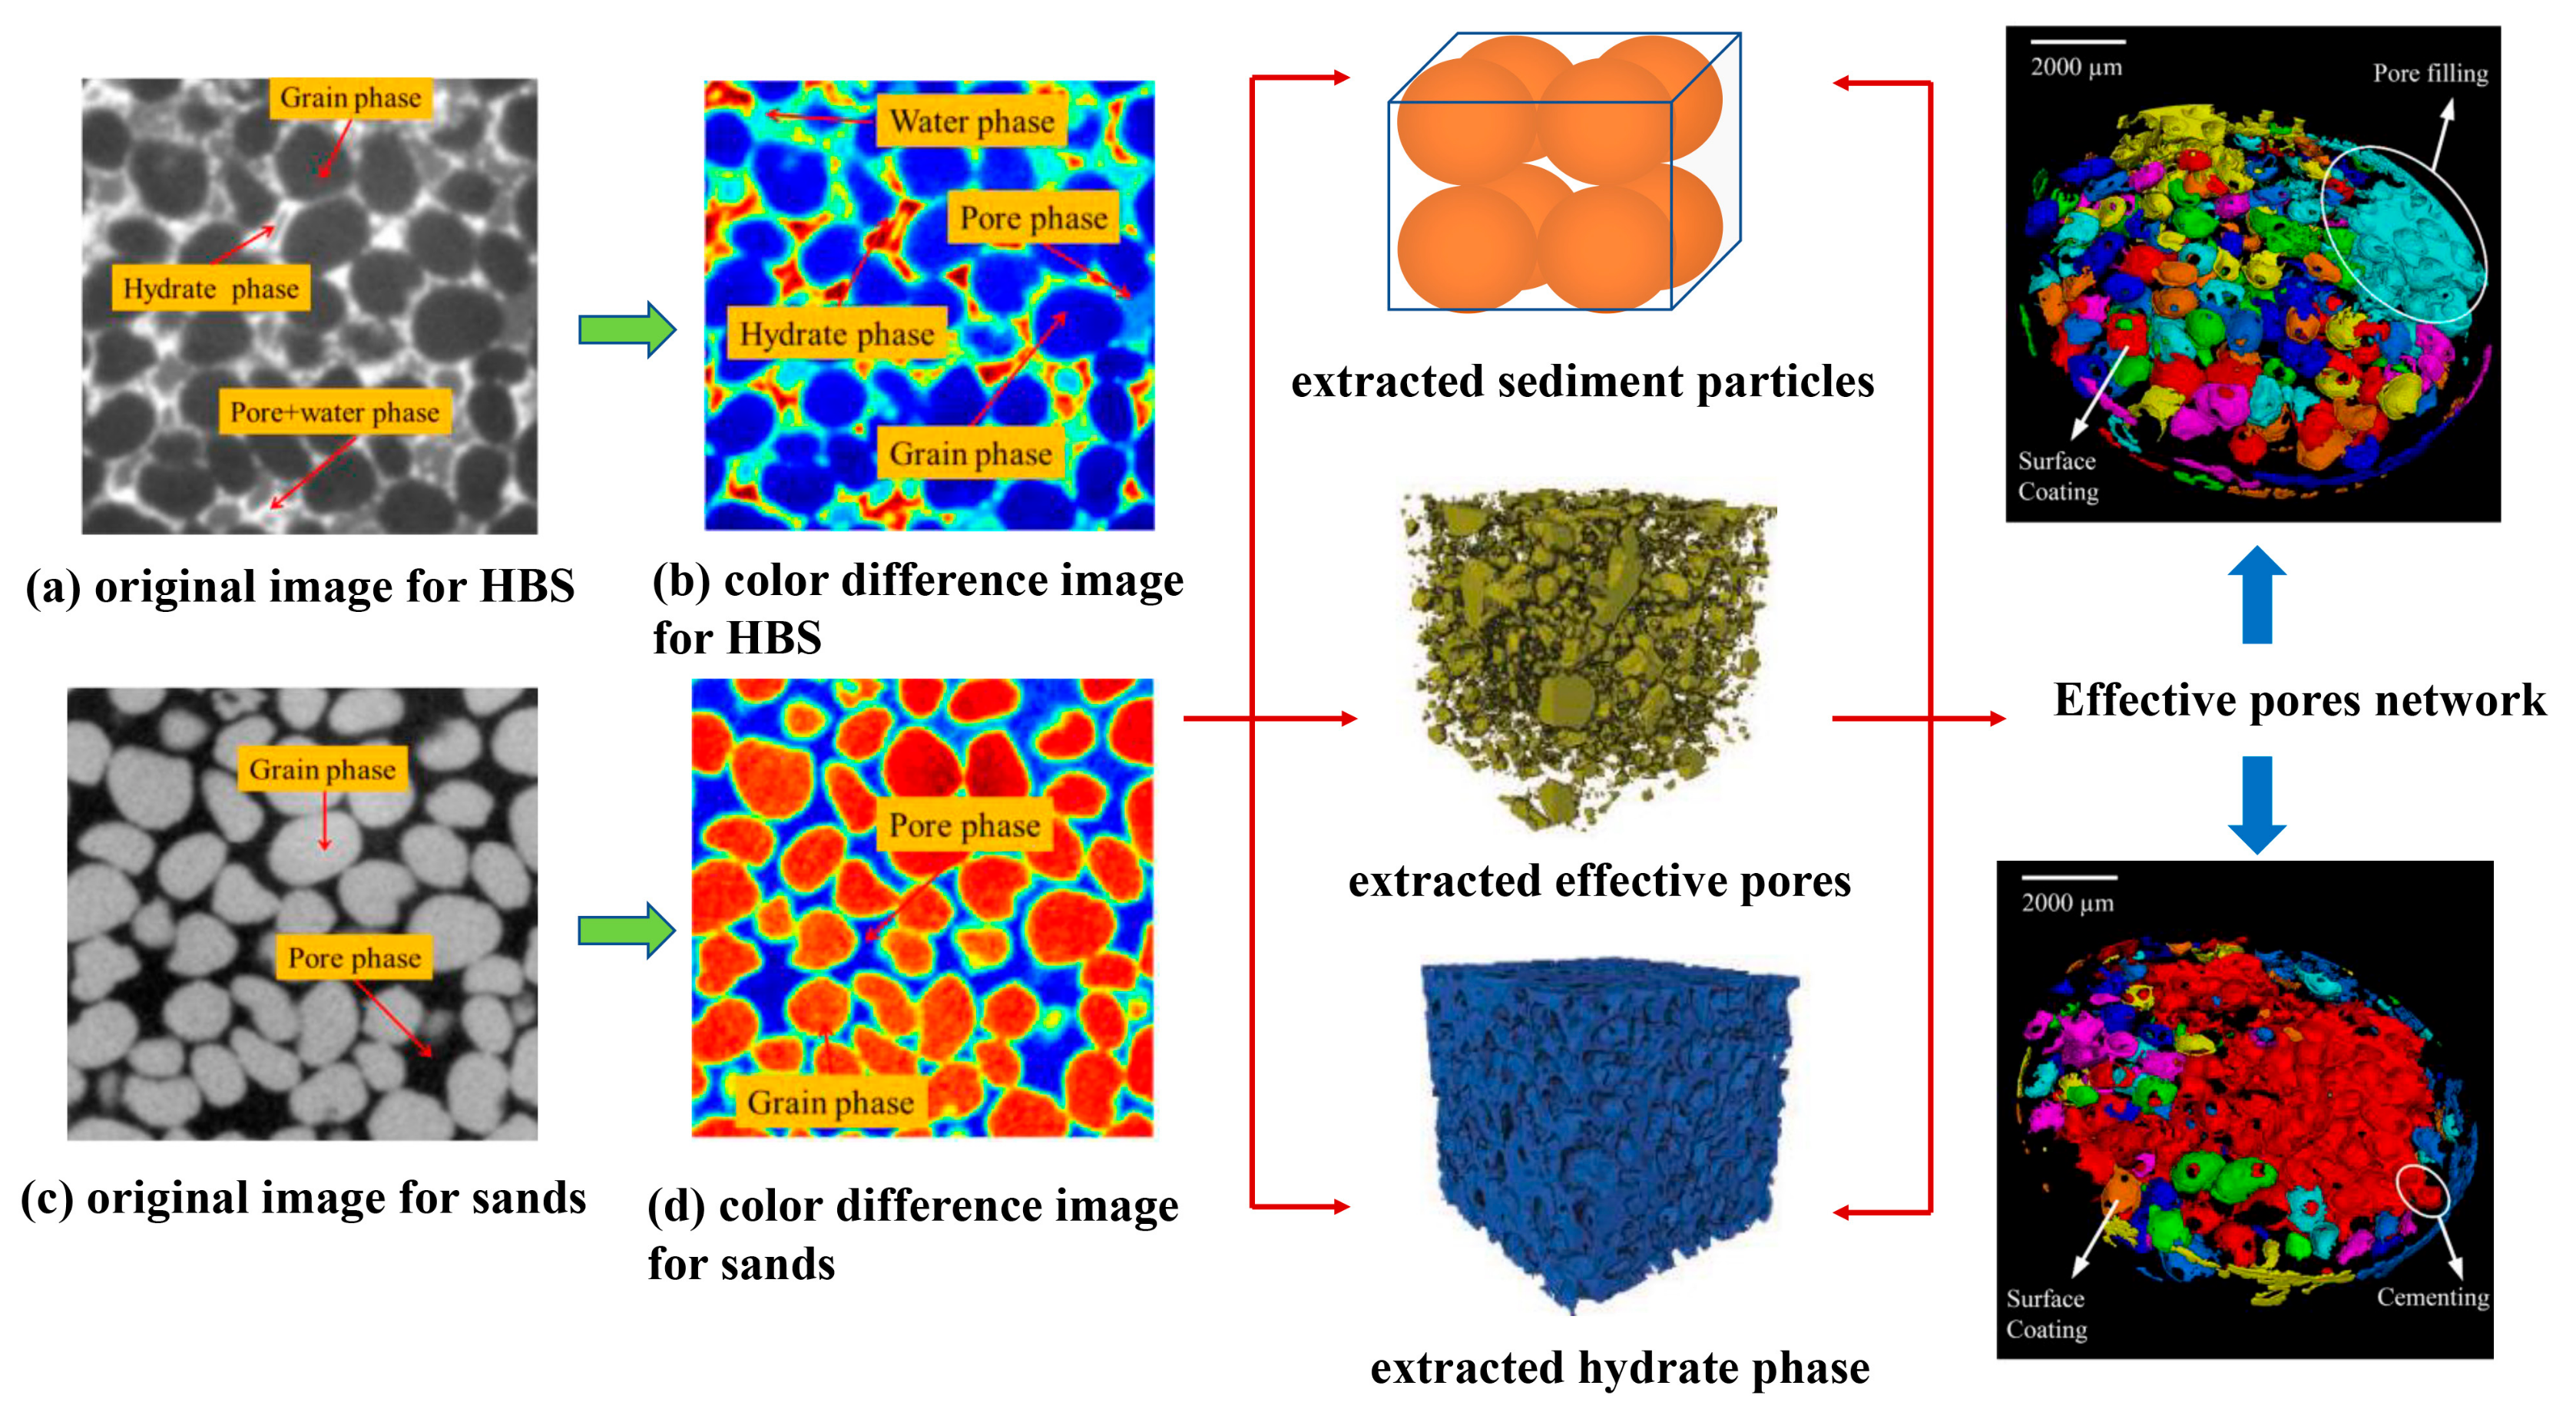
4.1.1. Grey Image Acquisition
4.1.2. Image Preprocessing
4.1.3. Core Component Extraction
4.1.4. Pore Parameter Analysis

| Year | Method | Direction | Results | Reference |
|---|---|---|---|---|
| 2013 | CT + Experiment | Calculated the absolute permeability of each phase and detected the movement of the displacement front. | With the increase of saturation, the growth mode from GC to PF. | [94] |
| 2014 | CT + PNM | Simulated gas invasion, hydrate decomposition, gas expansion. | Confirmed the fitting parameters in permeability models. | [45] |
| 2016 | CT + PNM | Simulated the influence mechanism of particles size and porosity on permeability. | Porosity increases with the increase of particles size. | [95] |
| 2019 | CT + Experiment | Seepage experiments on the clayey-silt sediments in the Shenhu area of the South China Sea. | Power-law relation between effective permeability and porosity. | [96] |
| 2019 | CT + Simulation | Simulated different existence modes of fractal parameter of pores in sediments and the influence law of pores radius. | Equation (52) | [91] |
| 2020 | CT + Experiment | Pore-scale distribution and reformation characteristics of gas hydrate in HBS, during dissociation. | Mass and heat transfer can lead to GC to PF. | [97] |
| 2021 | CT + Experiment | Detected pore structure characteristics of NGHS in HBS. | Equations (53)–(55) | [92] |
| 2021 | CT + Experiment | The differences in distribution and morphology properties of NGHs under two gas occurrence patterns have been analyzed | During formation, gas diffusion is the crucial factor that influences the growth habit and morphology. | [98] |
| 2021 | CT + Experiment | To define the hydrate phase heterogeneity degree of HBS | Equations (56)–(58) | [93] |
| 2022 | CT + Experiment | To understand the memory effect of HBS. | Memory effect can not only shorten the induction time of hydrate nucleation but also reduce the formation rate. | [99] |
| 2022 | CT + Experiment | To understand the interactions between NGHs decomposition and heat/mass transfer. | The mass transfer of gas shows significant effects on hydrate morphology evolution. | [100] |
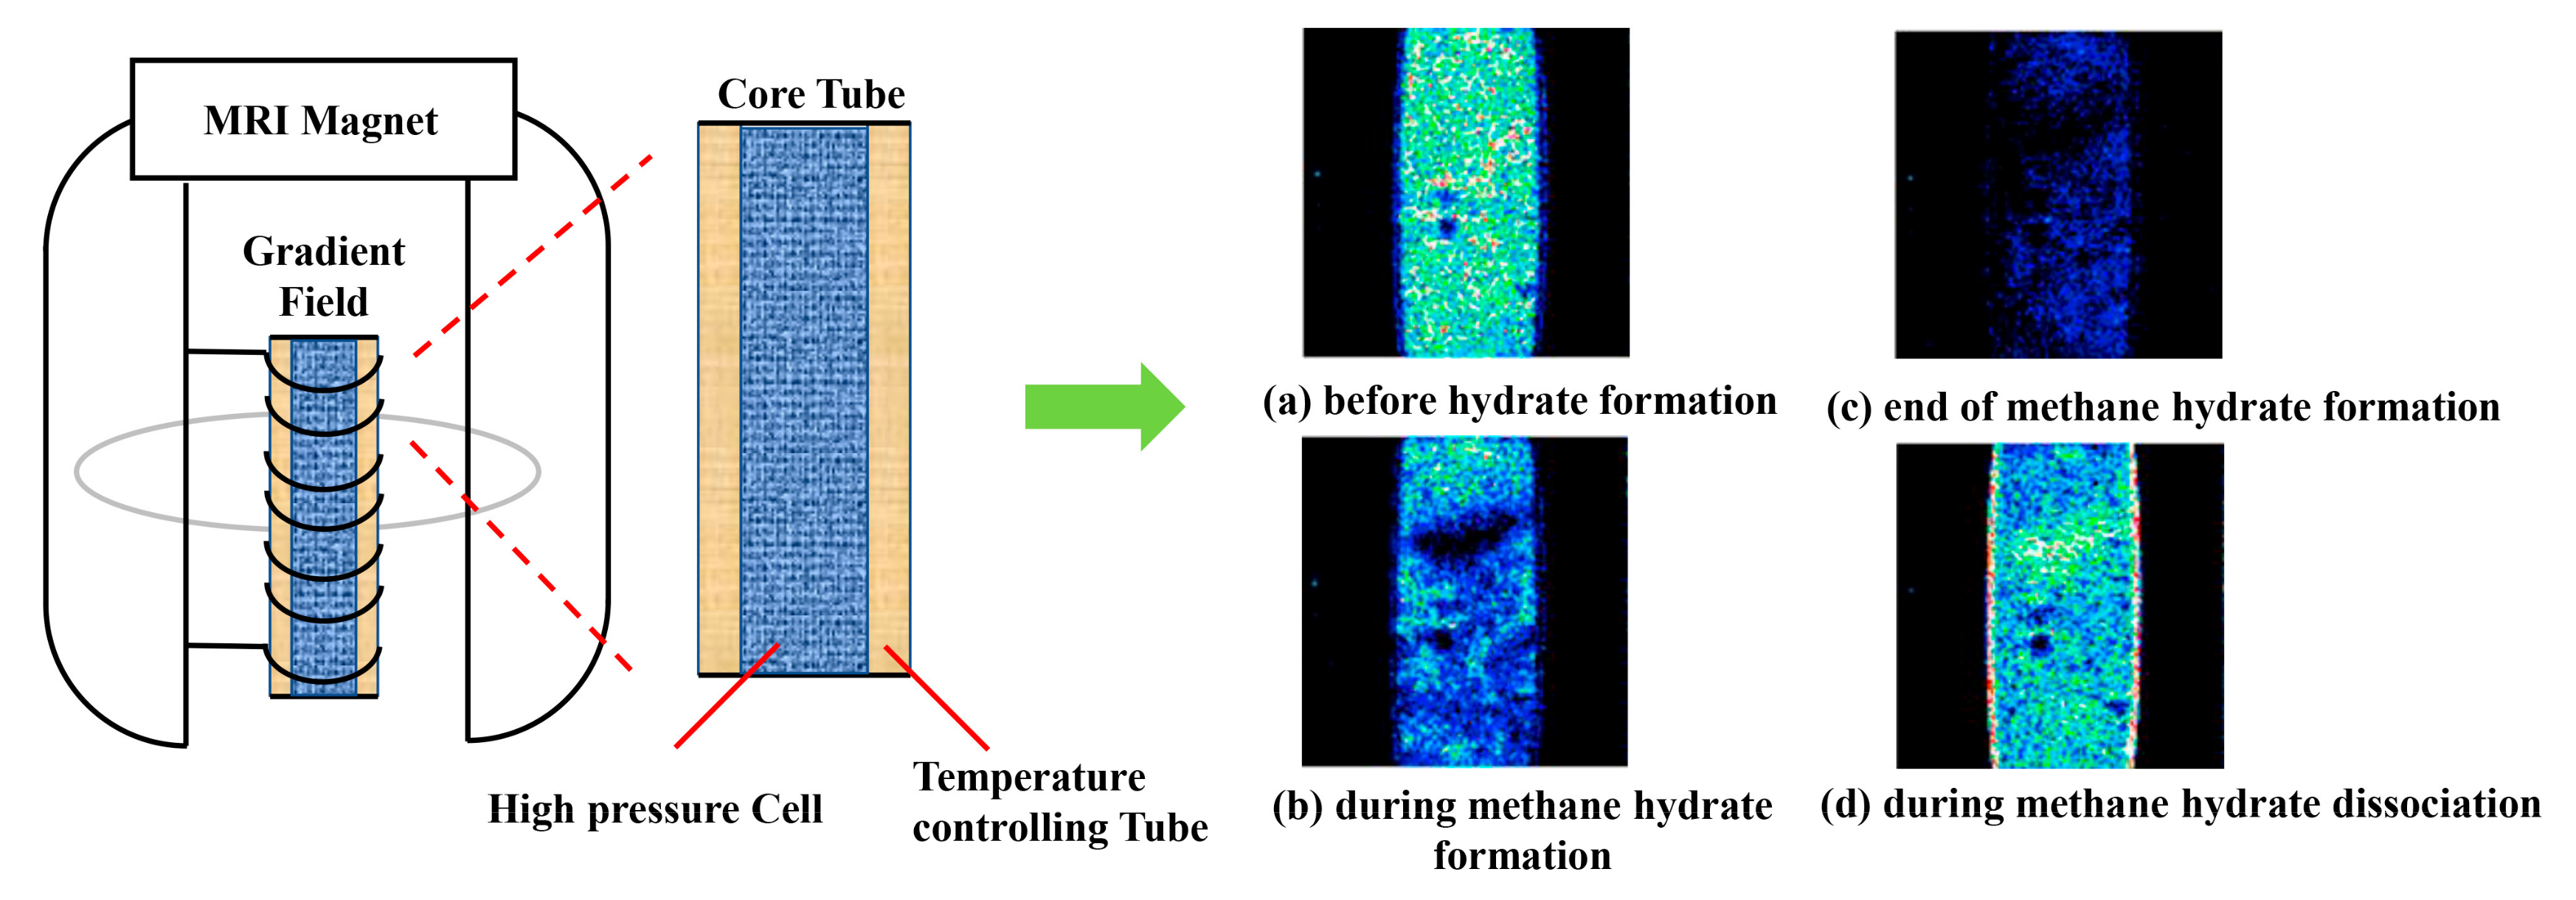
4.2. Seepage Theories in NGHs by NMR and MRI
4.3. Predicting Permeability of HBS by Electrical Resistivity
4.4. Simulation of Hydrate Seepage under Pore Network
4.4.1. Pore Network Model
4.4.2. Lattice Boltzmann Method
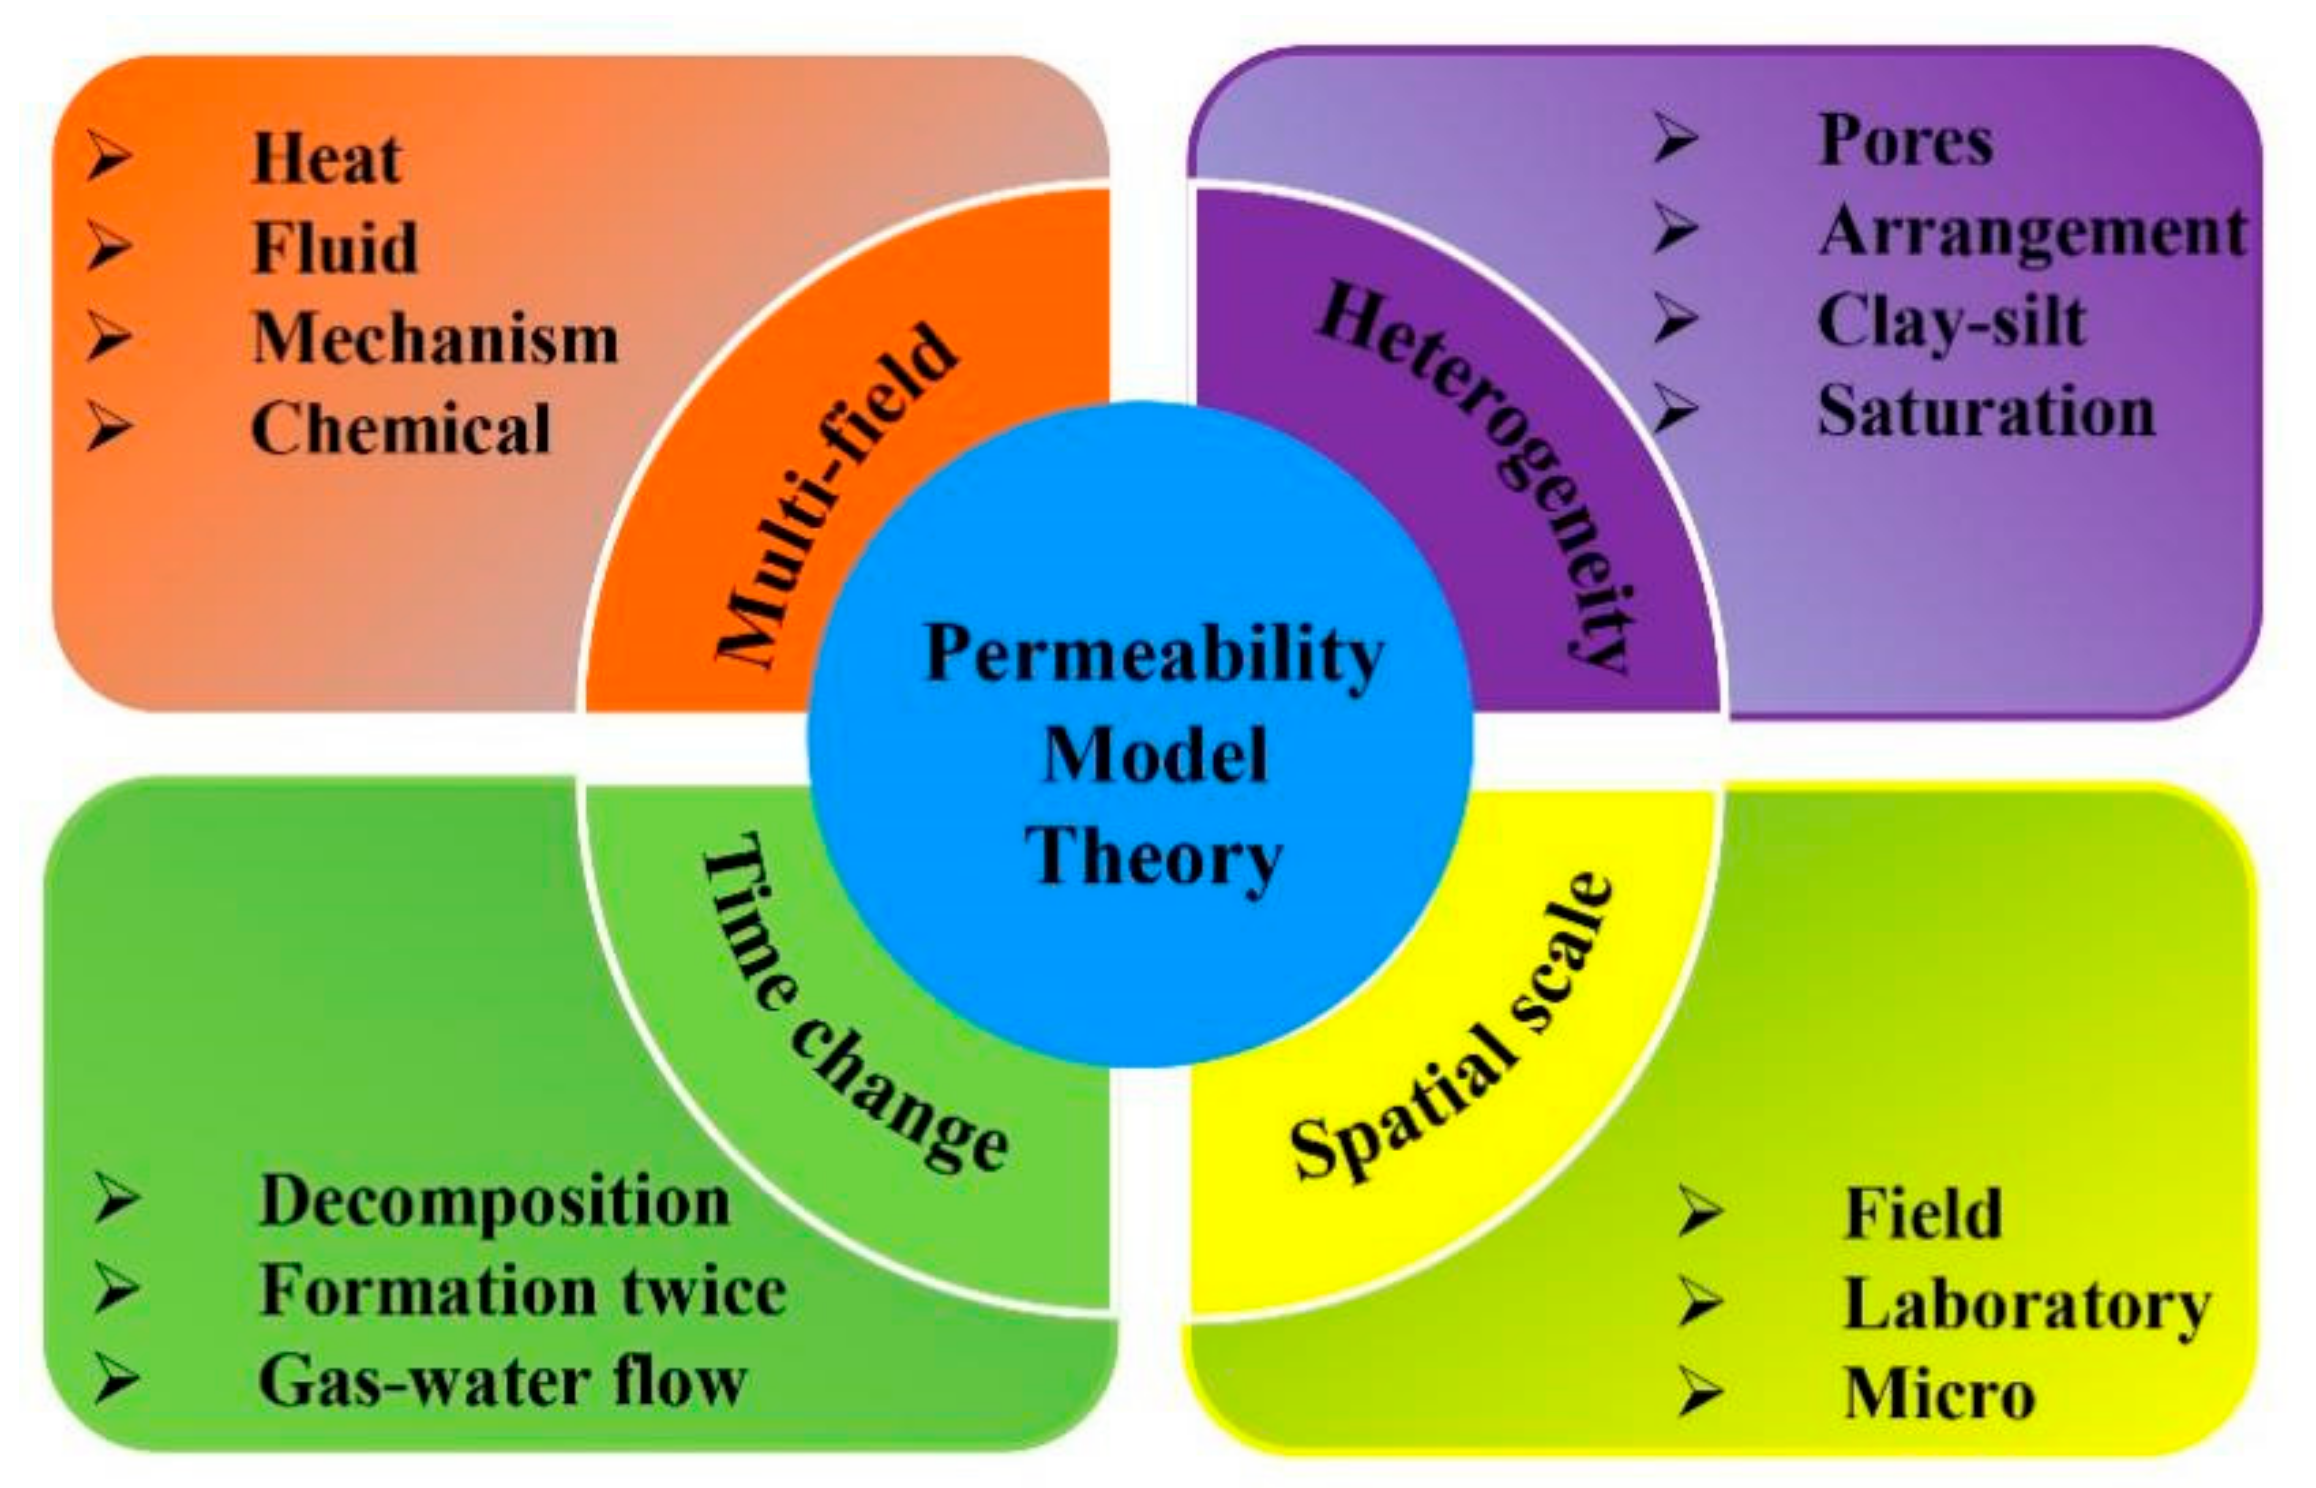
5. Challenges and Prospects
5.1. Influence of Reservoir Heterogeneity on Permeability
5.2. Influence of Spatial Scale on Permeability
5.3. Effect of Time Change on Permeability
5.4. Effect of Gas–Liquid Phase Change on Permeability
6. Conclusions and Suggestions
- (1)
- Comprehensive studies should be conducted on heterogeneous physical properties of sediments, such as particle arrangement, diameter, pore-throat size, and clay.
- (2)
- New technologies should be applied to improve the modelling of skeletal structure and hydrate occurrence patterns in HBS.
- (3)
- More research involving phase state change, heat and mass transfer, mechanical properties, and the combination of multiple fluids during the formation/decomposition of HBS should be carried out.
Author Contributions
Funding
Institutional Review Board Statement
Informed Consent Statement
Data Availability Statement
Acknowledgments
Conflicts of Interest
Nomenclature
| r | radius of capillary (m) |
| L | length of capillary (m) |
| ΔP | pressure difference (MPa) |
| μ | viscosity of fluid (mPa·s) |
| q | flow rate of single capillary on per unit cross-sectional area (m3/s) |
| Q | cumulative flow rate on per unit cross-sectional area (m3/s) |
| d | thickness of hydrate (m) |
| φ | porosity |
| K | permeability (D) |
| k | normalized permeability |
| S | phase saturation |
| τ | tortuosity |
| ν | shape factor |
| σ | specific surface (cm2/ cm3) |
| F | formation factor, constant |
| R | resistivity (Ω·m) |
| α | fractal parameter |
| D | fractal dimension |
| X | number of capillaries |
| CP | ratio of sediment particle radius to hydrate particle radius |
| π | 3.14159265 |
| a, b, β, η, Z | empirical parameter, variable |
| ψ | viscosity ratio of gas to liquid |
| A | total area |
| l | clay parameter, variable |
| λ | pore diameter |
| C | constant |
| La | actual flow length (m) |
| ε | pores ratio |
| e | 2.718281828459 |
| γ | interfacial tension (dyn/cm) |
| ɵ | angle, ° |
| ρ | percentage of the entire pore occupied by fluid |
| B | linear regression coefficient |
| Ω | intercept |
| I | intensity |
| Δ | CT number |
| Γ | linear absorption coefficient |
| M | transverse magnetization vector intensity |
| t | at any time |
| T | Time (s) |
| G | value of MI |
| Superscript | |
| PF | pore filling |
| GC | grain coating |
| N, M | weight index |
| n | saturation index |
| Subscript | |
| 0 | initial condition without hydrate |
| H | hydrate phase |
| W | water phase |
| wr | irreducible water phase |
| g | gas phase |
| c | capillary |
| t | normalized parameter |
| f | pore-size |
| r | relative amount |
| min | Minimal state |
| max | maximum state |
| i | gas/liquid phase |
| 1,2 | parameter |
| Abbreviation | |
| NGH | Natural gas hydrates |
| HBS | Hydrate-Bearing sediments |
| NMR | nuclear magnetic resonance |
| MRI | magnetic resonance imaging |
| CT | computed tomography |
References
- Reagan, M.T.; Moridis, G.J.; Johnson, J.N.; Pan, L.; Freeman, C.M.; Boyle, K.L.; Keen, N.D.; Husebo, J. Field-Scale Simulation of Production from Oceanic Gas Hydrate Deposits. Transp. Porous Media 2015, 108, 151–169. [Google Scholar] [CrossRef]
- Sloan, E.D. Fundamental principles and applications of natural gas hydrates. Nature 2003, 426, 353–359. [Google Scholar] [CrossRef] [PubMed]
- Veluswamy, H.P.; Kumar, R.; Linga, P. Hydrogen storage in clathrate hydrates: Current state of the art and future directions. Appl. Energy 2014, 122, 112–132. [Google Scholar] [CrossRef]
- Changyu, S.; Wenzhi, L.; Xin, Y.; Fengguang, L.; Qing, Y.; Liang, M.; Jun, C.; Bei, L.; Guangjin, C. Progress in research of gas hydrate. Chin. J. Chem. Eng. 2011, 19, 151–162. [Google Scholar]
- Reagan, M.T.; Moridis, G.J.; Collett, T.S.; Boswell, R.; Sloan, E.D. Toward Production From Gas Hydrates: Current Status, Assessment of Resources, and Simulation-Based Evaluation of Technology and Potential. SPE Reserv. Eval. Eng. 2009, 12, 745–771. [Google Scholar]
- Chong, S.-H.; Santamarina, J.C. Soil compressibility models for a wide stress range. J. Geotech. Geoenviron. Eng. 2016, 142, 06016003. [Google Scholar] [CrossRef]
- Collett, T.; Bahk, J.J.; Baker, R.; Boswell, R.; Divins, D.; Frye, M.; Goldberg, D.; Husebø, J.; Koh, C.; Malone, M. Methane Hydrates in Nature—Current Knowledge and Challenges. J. Chem. Eng. Data 2015, 60, 319–329. [Google Scholar] [CrossRef]
- Makogon, Y.F. Natural gas hydrates–A promising source of energy. J. Nat. Gas Sci. Eng. 2010, 2, 49–59. [Google Scholar] [CrossRef]
- Kim, J.; Moridis, G.J.; Rutqvist, J. Coupled flow and geomechanical analysis for gas production in the Prudhoe Bay Unit L-106 well Unit C gas hydrate deposit in Alaska. J. Pet. Sci. Eng. 2012, 92, 143–157. [Google Scholar] [CrossRef] [Green Version]
- Zhang, Z.G.; Yu, W.; Gao, L.F.; Zhang, Y.; Liu, C.S. Marine Gas Hydrates: Future Energy or Environmental Killer? Energy Procedia 2012, 16, 933–938. [Google Scholar] [CrossRef] [Green Version]
- Boswell, R.; Yoneda, J.; Waite, W.F. India National Gas Hydrate Program Expedition 02 summary of scientific results: Evaluation of natural gas-hydrate-bearing pressure cores. Mar. Pet. Geol. 2019, 108, 143–153. [Google Scholar] [CrossRef]
- Yoo, D.G.; Kang, N.K.; Yi, B.Y.; Kim, G.Y.; Ryu, B.J.; Lee, K.; Lee, G.H.; Riedel, M. Occurrence and seismic characteristics of gas hydrate in the Ulleung Basin, East Sea. Mar. Pet. Geol. 2013, 47, 236–247. [Google Scholar] [CrossRef]
- Yoneda, J.; Masui, A.; Konno, Y.; Jin, Y.; Egawa, K.; Kida, M.; Ito, T.; Nagao, J.; Tenma, N. Mechanical properties of hydrate-bearing turbidite reservoir in the first gas production test site of the Eastern Nankai Trough. Mar. Pet. Geol. 2015, 66, 471–486. [Google Scholar] [CrossRef]
- Song, Y.; Yang, L.; Zhao, J.; Liu, W.; Yang, M.; Li, Y.; Liu, Y.; Li, Q. The status of natural gas hydrate research in China: A review. Renew. Sustain. Energy Rev. 2014, 31, 778–791. [Google Scholar] [CrossRef]
- Li, J.F.; Ye, J.L.; Qin, X.W.; Qiu, H.J.; Wu, N.Y.; Lu, H.L.; Xie, W.W.; Lu, J.A.; Peng, F.; Xu, Z.Q. The first offshore natural gas hydrate production test in South China Sea. China Geol. 2018, 1, 5–16. [Google Scholar] [CrossRef]
- Ye, J.; Qin, X.; Xie, W.; Lu, H.; Ma, B.; Qiu, H.; Liang, J.; Lu, J.A.; Kuang, Z.; Lu, C. Main progress of the second gas hydrate trial production in the South China Sea. Geol. China 2020, 47, 557–568. [Google Scholar]
- Davy, H. On some of the combinations of oxymuriatic acid gas and oxygen and on the chemical relations of the properties. Phil. Trans. Roy. Soc. 1811, 101, 30–55. [Google Scholar]
- Hammerschmidt, E. Formation of gas hydrates in natural gas transmission lines. Ind. Eng. Chem. 1934, 26, 851–855. [Google Scholar] [CrossRef]
- Yi, W.; Li, X.S.; Gang, L.; Huang, N.S.; Feng, J.C. Experimental study on the hydrate dissociation in porous media by five-spot thermal huff and puff method. Fuel 2014, 117, 688–696. [Google Scholar]
- Moridis, G.J.; Kowalsky, M.B.; Pruess, K. Depressurization-Induced Gas Production From Class-1 Hydrate Deposits. SPE Reserv. Eval. Eng. 2007, 10, 458–481. [Google Scholar] [CrossRef]
- Eslamimanesh, A.; Mohammadi, A.H.; Richon, D.; Naidoo, P.; Ramjugernath, D. Application of gas hydrate formation in separation processes: A review of experimental studies. J. Chem. Thermodyn. 2012, 46, 62–71. [Google Scholar] [CrossRef]
- Ohgaki, K.; Takano, K.; Sangawa, H.; Matsubara, T.; Nakano, S. Methane Exploitation by Carbon Dioxide from Gas Hydrates—Phase Equilibria for CO2-CH4 Mixed Hydrate System. J. Chem. Eng. Jpn. 1996, 29, 478–483. [Google Scholar] [CrossRef] [Green Version]
- Xu, C.; Li, X.; Cai, J.; Chen, Z.; Chen, C. Advance on simulation exploitation of natural gas hydrate by replacement with CO2. CIESC J. 2013, 64, 2309–2315. [Google Scholar]
- Cui, Y.; Cheng, L.; Wu, M.; Yue, P.; Luo, W. Review of exploration and production technology of natural gas hydrate. Adv. Geo-Energy Res. 2018, 2, 53–62. [Google Scholar] [CrossRef] [Green Version]
- Li, B.; Wei, W.N.; Wan, Q.C.; Peng, K.; Chen, L.L. Numerical Investigation into the Development Performance of Gas Hydrate by Depressurization Based on Heat Transfer and Entropy Generation Analyses. Entropy 2020, 22, 1212. [Google Scholar] [CrossRef]
- Jingchun, F.; Xiaosen, L.; Yi, W.; Yu, Z.; Gang, L. Three-dimension Experimental Investigation of Hydrate Dissociation by the Combined Method with Dual Horizontal Wells. Geoscience 2016, 30, 929–936. [Google Scholar]
- Jin, L.; Wang, G.; Wang, Z.; Jing, C.; Fan, X. A review on pore structure characterization in tight sandstones. Earth Sci. Rev. 2018, 177, 436–457. [Google Scholar]
- Ren, X.; Zhao, Y.; Deng, Q.; Li, D.; Wang, D. A relation of hydraulic conductivity–Void ratio for soils based on Kozeny-carman equation. Eng. Geol. 2016, 213, 89–97. [Google Scholar] [CrossRef]
- Ren, X.W.; Santamarina, J.C. The hydraulic conductivity of sediments: A pore size perspective. Eng. Geol. 2018, 233, 48–54. [Google Scholar] [CrossRef] [Green Version]
- Priest, J.A.; Druce, M.; Roberts, J.; Schultheiss, P.; Nakatsuka, Y.; Suzuki, K. PCATS Triaxial: A new geotechnical apparatus for characterizing pressure cores from the Nankai Trough, Japan. Mar. Pet. Geol. 2015, 66, 460–470. [Google Scholar] [CrossRef]
- Nimblett, J.; Ruppel, C. Permeability evolution during the formation of gas hydrates in marine sediments. J. Geophys. Res. B Solid Earth 2003, 108, 2420. [Google Scholar] [CrossRef]
- Kleinberg, R.L.; Flaum, C.; Griffin, D.D.; Brewer, P.G.; Malby, G.E.; Peltzer, E.T.; Yesinowski, J.P. Deep sea NMR: Methane hydrate growth habit in porous media and its relationship to hydraulic permeability, deposit accumulation, and submarine slope stability. J. Geophys. Res. B Solid Earth 2003, 108, 2508. [Google Scholar] [CrossRef]
- Masuda, Y.; Naganawa, S.; Ando, S.; Sato, K. Numerical Calculation of Gas Production Performance from Reservoirs Containing Natural Gas Hydrates; Society of Petroleum Engineers: Long Beach, CA, USA, 1997. [Google Scholar]
- Katagiri, J.; Konno, Y.; Yoneda, J.; Tenma, N. Pore-scale modeling of flow in particle packs containing grain-coating and pore-filling hydrates: Verification of a Kozeny–Carman-based permeability reduction model. J. Nat. Gas Sci. Eng. 2017, 45, 537–551. [Google Scholar] [CrossRef]
- Moridis, G.; Apps, J.; Pruess, K.; Myer, L. EOSHYDR: A TOUGH2 Module for CH4-Hydrate Release and Flow in the Subsurface. In Ernest Orlando; Lawrence Berkeley NationalLaboratory: Berkeley, CA, USA, 1998. [Google Scholar]
- Stone, H.L. Probability Model for Estimating Three-Phase Relative Permeability. J. Pet. Technol. 1970, 22, 214–218. [Google Scholar] [CrossRef]
- Delli, M.L.; Grozic, J.L. Prediction performance of permeability models in gas-hydrate-bearing sands. SPE J. 2013, 18, 274–284. [Google Scholar] [CrossRef]
- Delli, M.L.; Grozic, J. Experimental determination of permeability of porous media in the presence of gas hydrates. J. Pet. Sci. Eng. 2014, 120, 1–9. [Google Scholar] [CrossRef]
- Dai, S.; Seol, Y. Water permeability in hydrate-bearing sediments: A pore-scale study. Geophys. Res. Lett. 2014, 41, 4176–4184. [Google Scholar] [CrossRef]
- Kang, D.H.; Yun, T.S.; Kim, K.Y.; Jang, J. Effect of hydrate nucleation mechanisms and capillarity on permeability reduction in granular media. Geophys. Res. Lett. 2016, 43, 9018–9025. [Google Scholar] [CrossRef]
- Lv, J.; Zhao, J.; Jiang, L.; Liu, Y.; Mu, H. A review of micro computed tomography studies on the gas hydrate pore habits and seepage properties in hydrate bearing sediments. J. Nat. Gas Sci. Eng. 2020, 83, 103555. [Google Scholar] [CrossRef]
- Yang, M.; Chong, Z.R.; Zheng, J.; Song, Y.; Linga, P. Advances in nuclear magnetic resonance (NMR) techniques for the investigation of clathrate hydrates. Renew. Sustain. Energy Rev. 2016, 74, 1346–1360. [Google Scholar] [CrossRef]
- Ren, X.; Guo, Z.; Ning, F.; Ma, S. Permeability of hydrate-bearing sediments. Earth Sci. Rev. 2020, 220, 103100. [Google Scholar] [CrossRef]
- Jang, J.; Santamarina, J.C. Hydrate bearing clayey sediments: Formation and gas production concepts. Mar. Pet. Geol. 2016, 77, 235–246. [Google Scholar] [CrossRef] [Green Version]
- Mahabadi, N.; Jang, J. Relative water and gas permeability for gas production from hydrate-bearing sediments. Geochem. Geophys. Geosyst. 2014, 15, 2346–2353. [Google Scholar] [CrossRef]
- Mahabadi, N.; Dai, S.; Seol, Y.; Sup Yun, T.; Jang, J. The water retention curve and relative permeability for gas production from hydrate-bearing sediments: Pore-network model simulation. Geochem. Geophys. Geosyst. 2016, 17, 3099–3110. [Google Scholar] [CrossRef]
- Dai, S.; Santamarina, J.C.; Waite, W.F.; Kneafsey, T.J. Hydrate morphology: Physical properties of sands with patchy hydrate saturation. J. Geophys. Res. B Solid Earth 2012, 117, B11205. [Google Scholar] [CrossRef] [Green Version]
- Waite, W.F.; Santamarina, J.C.; Cortes, D.; Dugan, B.; Yun, T.S. Physical properties of hydrate-bearing sediments. Rev. Geophys. 2009, 47, 465–484. [Google Scholar] [CrossRef]
- Collett, T.S.; Riedel, M.; Cochran, J.; Boswell, R.; Kumar, P.; Sathe, A.; Expedition, N. Geologic Controls on the Occurrence of Gas Hydrates in the Indian Continental Margin: Results of the Indian National Gas Hydrate Program (NGHP) Expediton 01 Initial Reports; AAPG Annual Convention: San Antonio, TX, USA, 2008. [Google Scholar]
- Opening a New Era of “Combustible Ice” Exploration-an Overview of the Results of Natural Gas Hydrate Resource Exploration. Available online: https://www.cgs.gov.cn/xwl/cgkx/201603/t20160309_285790.html (accessed on 31 July 2014).
- Murray, D.R.; Fukuhara, M.R.; Osawa, O.R.; Endo, T.R.; Namikawa, T.R. Saturation, Acoustic Properties, Growth Habit, and State of Stress of a Gas Hydrate Reservoir from Well Logs. Petrophys 2006, 47, 129–137. [Google Scholar]
- Singh, H.; Myshakin, E.M.; Seol, Y. A nonempirical relative permeability model for hydrate-bearing sediments. SPE J. 2019, 24, 547–562. [Google Scholar] [CrossRef]
- Tohidi, B.; Anderson, R.; Clennell, M.B.; Burgass, R.W.; Biderkab, A.B. Visual observation of gas-hydrate formation and dissociation in synthetic porous media by means of glass micromodels. Geology 2001, 29, 867–870. [Google Scholar] [CrossRef]
- Mahabadi, N.; Dai, S.; Seol, Y.; Jang, J. Impact of hydrate saturation on water permeability in hydrate-bearing sediments. J. Pet. Sci. Eng. 2019, 174, 696–703. [Google Scholar] [CrossRef]
- Scheidegger, A.E. The Physics of Flow Through Porous Media. Soil Sci. 1958, 86, 355. [Google Scholar] [CrossRef]
- Yasuhide, S.; Takeshi, K.; Kuniyuki, M.; Norio, T.; Tsutomu, Y.; George, Z. Laboratory-Scale Experiments of the Methane Hydrate Dissociation Process in a Porous Media and Numerical Study for the Estimation of Permeability in Methane Hydrate Reservoir. J. Thermodyn. 2010, 2010, 9879–9884. [Google Scholar]
- Pape, H.; Clauser, C.; Iffland, J. Permeability prediction based on fractal pore-space geometry. Geophysics 1999, 64, 1447–1460. [Google Scholar] [CrossRef]
- Pape, H.; Clauser, C.; Iffland, J. Variation of Permeability with Porosity in Sandstone Diagenesis Interpreted with a Fractal Pore Space Model. Pure Appl. Geophys. 2000, 157, 603–619. [Google Scholar] [CrossRef]
- Daigle, H. Relative permeability to water or gas in the presence of hydrates in porous media from critical path analysis. J. Pet. Sci. Eng. 2016, 146, 526–535. [Google Scholar] [CrossRef]
- Peng, X.; Yu, B. Developing a new form of permeability and Kozeny–Carman constant for homogeneous porous media by means of fractal geometry-ScienceDirect. Adv. Water Resour. 2008, 31, 74–81. [Google Scholar]
- Bo-Ming, Y.; Jian-Hua, L. A geometry model for tortuosity of flow path in porous media. Chin. Phys. Lett. 2004, 21, 1569–1571. [Google Scholar] [CrossRef]
- Boudreau, B.P. The diffusive tortuosity of fine-grained unlithified sediments. Geochim. Cosmochim. Acta 1996, 60, 3139–3142. [Google Scholar] [CrossRef]
- Sen, P.N.; Scala, C.; Cohen, M.H. A self-similar model for sedimentary rocks with application to the dielectric constant of fused glass beads. Geophysics 1981, 46, 781–795. [Google Scholar] [CrossRef]
- Iversen, N.; Bo, B.J. Diffusion coefficients of sulfate and methane in marine sediments: Influence of porosity. Geochim. Cosmochim. Acta 1993, 57, 571–578. [Google Scholar] [CrossRef]
- Liu, L.; Zhang, Z.; Ning, F.; Li, C.; Cai, J.; Wang, D.; Liu, C.; Wu, N. A fractal model for the relative permeability prediction of hydrate-bearing sediments. SCIENTIA SINICA Phys. Mech. Astron. 2019, 49, 034614. [Google Scholar] [CrossRef]
- Zhang, Z.; Li, C.; Ning, F.; Liu, L.; Cai, J.; Liu, C.; Wu, N.; Wang, D. Pore fractal characteristics of hydrate-bearing sands and implications to the saturated water permeability. J. Geophys. Res. B Solid Earth 2020, 125, e2019JB018721. [Google Scholar] [CrossRef]
- Luo, N. Numerical analysis of Archie formulae and its meanings. Acta Pet. Sin. 2007, 28, 111–114. [Google Scholar]
- Kozeny, J. Uber kapillare leitung der wasser in boden. R. Acad. Sci. Vienna Proc. Cl. I 1927, 136, 271–306. [Google Scholar]
- Carman, P.C. Fluid flow through granular beds. Trans. Inst. Chem. Eng. 1937, 15, 150–166. [Google Scholar] [CrossRef]
- Carman, P.C. Permeability of saturated sands, soils and clays. J. Agric. Sci. 1939, 29, 262–273. [Google Scholar] [CrossRef]
- Carman, P.C. Flow of Gases through Porous Media; ButterWorths Scientific Publications: London, UK, 1956. [Google Scholar]
- Zhang, J.; Luo, J.; Xia, Y.; Wenliang, H.U.; Zhang, G.D.; Yuchun, H.E.; Yang, K.B. Limitation analysis and modification of the Archie equation. Chin. J. Geophys. 2018, 61, 311–322. [Google Scholar]
- Zhisong, Z. Theoretical roots of Archie formulas. Prog. Geophys. 2020, 35, 1514–1522. [Google Scholar]
- Spangenberg, E. Modeling of the influence of gas hydrate content on the electrical properties of porous sediments. J. Geophys. Res. B Solid Earth 2001, 106, 6535–6548. [Google Scholar] [CrossRef]
- Li, G.; Wu, D.M.; Li, X.S.; Lv, Q.N.; Li, C.; Zhang, Y. Experimental measurement and mathematical model of permeability with methane hydrate in quartz sands. Appl. Energy 2017, 202, 282–292. [Google Scholar] [CrossRef]
- Genuchten, V.; Th, M. A closed-form equation for predicting the hydraulic conductivity of unsaturated soils. Soil Sci. Soc. Am. J. 1980, 44, 892–898. [Google Scholar] [CrossRef] [Green Version]
- Parker, J.C.; Lenhard, R.J.; Kuppusamy, T. A parametric model for constitutive properties governing multiphase flow in porous media. Water Resour. Res. 1987, 23, 618–624. [Google Scholar] [CrossRef]
- Singh, H.; Mahabadi, N.; Myshakin, E.M.; Seol, Y. A Mechanistic Model for Relative Permeability of Gas and Water Flow in Hydrate-Bearing Porous Media With Capillarity. Water Resour. Res. 2019, 55, 3414–3432. [Google Scholar] [CrossRef]
- Timur, A. An investigation of permeability, porosity, and residual water saturation relationships. Log. Anal. 1968, 9, 8–17. [Google Scholar]
- Purcell, W.R. Capillary Pressures-Their Measurement Using Mercury and the Calculation of Permeability Therefrom. J. Pet. Technol. 1949, 186, 39–48. [Google Scholar] [CrossRef]
- Kolodzie, S. Analysis of Pore Throat Size And Use of the Waxman-Smits Equation To Determine Ooip in Spindle Field, Colorado. In Proceedings of the SPE 55th Annual Technical Conference and Exhibition, Dallas, TX, USA, 21 September 1980. [Google Scholar]
- Swanson, B. A Simple Correlation Between Permeabilities and Mercury Capillary Pressures. J. Pet. Technol. 1981, 33, 2498–2504. [Google Scholar] [CrossRef]
- Pittman, E.D. Relationship of porosity and permeability to various parameters derived from mercury injection-capillary pressure curves for sandstone. AAPG Bull. 1992, 76, 191–198. [Google Scholar]
- Bryant, W.R.; Hottman, W.; Trabant, P. Permeability of unconsolidated and consolidated marine sediments, Gulf of Mexico. Mar. Georesour. Geotechnol. 1975, 1, 1–14. [Google Scholar] [CrossRef]
- Cnudde, V.; Boone, M.N. High-resolution X-ray computed tomography in geosciences: A review of the current technology and applications. Earth Sci. Rev. 2013, 123, 1–17. [Google Scholar] [CrossRef] [Green Version]
- Li, S.; Liu, L.; Chai, P.; Li, X.; Wei, L. Imaging hydraulic fractures of shale cores using combined positron emission tomography and computed tomography (PET-CT) imaging technique. J. Pet. Sci. Eng. 2019, 182, 106283. [Google Scholar] [CrossRef]
- Yongchao, Z.; Changling, L.; Nengyou, W. Advances in the pore-structrue characteristics and microscopic seepage numerical simulation of the hydrate-bearing sediments. Mar. Geol. Front. 2020, 36, 23–33. [Google Scholar]
- Zhao, Z.; Zhou, X.-P. Pore-scale effect on the hydrate variation and flow behaviors in microstructures using X-ray CT imaging. J. Hydrol. 2020, 584, 124678. [Google Scholar] [CrossRef]
- Jarrar, Z.A.; Alshibli, K.A.; Al-Raoush, R.I.; Jung, J. 3D measurements of hydrate surface area during hydrate dissociation in porous media using dynamic 3D imaging. Fuel 2020, 265, 116978. [Google Scholar] [CrossRef]
- Vesselli, E. X-rays and Extreme Ultraviolet Radiation: Principles and Applications. Nucl. Instrum. Methods Phys. Res. A 2019, 940, 497. [Google Scholar] [CrossRef]
- Liu, L.; Zhang, Z.; Li, C.; Ning, F.; Cai, J. Hydrate growth in quartzitic sands and implication of pore fractal characteristics to hydraulic, mechanical, and electrical properties of hydrate-bearing sediments. J. Nat. Gas Sci. Eng. 2019, 75, 103–109. [Google Scholar] [CrossRef]
- Kou, X.; Li, X.-S.; Wang, Y.; Wan, K.; Chen, Z.-Y. Pore-scale analysis of relations between seepage characteristics and gas hydrate growth habit in porous sediments. Energy 2021, 218, 119503. [Google Scholar] [CrossRef]
- Kou, X.; Li, X.-S.; Wang, Y.; Liu, J.-W.; Chen, Z.-Y. Heterogeneity of hydrate-bearing sediments: Definition and effects on fluid flow properties. Energy 2021, 229, 120736. [Google Scholar] [CrossRef]
- Konno, Y.; Jin, Y.; Uchiumi, T.; Nagao, J. Multiple-pressure-tapped core holder combined with X-ray computed tomography scanning for gas–water permeability measurements of methane-hydrate-bearing sediments. Rev. Sci. Instrum. 2013, 84, 064501. [Google Scholar] [CrossRef]
- Wang, J.; Zhao, J.; Zhang, Y.; Wang, D.; Li, Y.; Song, Y. Analysis of the effect of particle size on permeability in hydrate-bearing porous media using pore network models combined with CT. Fuel 2016, 163, 34–40. [Google Scholar] [CrossRef]
- Lu, C.; Xia, Y.; Sun, X.; Bian, H.; Qiu, H.; Lu, H.; Luo, W.; Cai, J. Permeability Evolution at Various Pressure Gradients in Natural Gas Hydrate Reservoir at the Shenhu Area in the South China Sea. Energies 2019, 12, 3688. [Google Scholar] [CrossRef] [Green Version]
- Kou, X.; Li, X.-S.; Wang, Y.; Zhang, Y.; Chen, Z.-Y. Distribution and reformation characteristics of gas hydrate during hydrate dissociation by thermal stimulation and depressurization methods. Appl. Energy 2020, 277, 115575. [Google Scholar] [CrossRef]
- Kou, X.; Li, X.-S.; Wang, Y.; Liu, J.-W.; Chen, Z.-Y. Effects of gas occurrence pattern on distribution and morphology characteristics of gas hydrates in porous media. Energy 2021, 226, 120401. [Google Scholar] [CrossRef]
- Kou, X.; Feng, J.-C.; Li, X.-S.; Wang, Y.; Chen, Z.-Y. Memory effect of gas hydrate: Influencing factors of hydrate reformation and dissociation behaviors. Appl. Energy 2022, 306, 118015. [Google Scholar] [CrossRef]
- Kou, X.; Feng, J.-C.; Li, X.-S.; Wang, Y.; Chen, Z.-Y. Visualization of interactions between depressurization-induced hydrate decomposition and heat/mass transfer. Energy 2022, 239, 122230. [Google Scholar] [CrossRef]
- Chen, B.; Sun, H.; Zheng, J.; Yang, M. New insights on water-gas flow and hydrate decomposition behaviors in natural gas hydrates deposits with various saturations. Appl. Energy 2020, 259, 114185. [Google Scholar] [CrossRef]
- Zhao, J.; Lv, Q.; Li, Y.; Yang, M.; Liu, W.; Yao, L.; Wang, S.; Zhang, Y.; Song, Y. In-situ visual observation for the formation and dissociation of methane hydrates in porous media by magnetic resonance imaging. Magn. Reson. Imaging 2015, 33, 485–490. [Google Scholar] [CrossRef]
- Chen, B.; Sun, H.; Zhao, G.; Wang, B.; Yang, M. Experimental observation of methane hydrate dissociation via different depressurization modes under water phase flow. Fuel 2021, 283, 118908. [Google Scholar] [CrossRef]
- Gao, S.; House, W.; Chapman, W.G. NMR/MRI Study of Clathrate Hydrate Mechanisms. J. Phys. Chem. B 2005, 109, 19090–19093. [Google Scholar] [CrossRef]
- Xue, K.; Zhao, J.; Song, Y.; Liu, W.; Lam, W.; Zhu, Y.; Liu, Y.; Cheng, C.; Liu, D. Direct observation of THF hydrate formation in porous microstructure using magnetic resonance imaging. Energies 2012, 5, 898–910. [Google Scholar] [CrossRef] [Green Version]
- Li, C.; Zhao, Q.; Xu, H.; Feng, K.; Liu, X. Relation between relative permeability and hydrate saturation in Shenhu area, South China Sea. Appl. Geophys. 2014, 11, 207–214. [Google Scholar] [CrossRef]
- Lee, M.W.; Collett, T.S. A method of Shaly sand correction for estimating gas hydrate saturations using downhole electrical resistivity log data. U.S. Geol. Surv. Sci. Investig. Rep. 2006, 5121. [Google Scholar]
- Li, N.; Sun, Z.F.; Sun, C.Y.; Li, P.; Chen, G.J.; Ma, Q.L.; Liu, B. Simulating natural hydrate formation and accumulation in sediments from dissolved methane using a large three-dimensional simulator. Fuel 2018, 216, 612–620. [Google Scholar] [CrossRef]
- Li, F.G.; Sun, C.Y.; Li, S.L.; Chen, G.J.; Zhang, K. Experimental Studies on the Evolvement of Electrical Resistivity during Methane Hydrate Formation in Sediments. Energy Fuels 2012, 26, 6210–6217. [Google Scholar] [CrossRef]
- Dong, H.; Sun, J.; Zhu, J.; Liu, L.; Lin, Z.; Golsanami, N.; Cui, L.; Yan, W. Developing a new hydrate saturation calculation model for hydrate-bearing sediments. Fuel 2019, 248, 27–37. [Google Scholar] [CrossRef]
- Jin, Y.; Li, S.; Yang, D. Experimental and theoretical quantification of the relationship between electrical resistivity and hydrate saturation in porous media. Fuel 2020, 269, 117378. [Google Scholar] [CrossRef]
- Fatt, I. The network model of porous media. Trans. AIME 1956, 207, 144–181. [Google Scholar] [CrossRef]
- Yang, L.; Ai, L.; Xue, K.; Ling, Z.; Li, Y. Analyzing the effects of inhomogeneity on the permeability of porous media containing methane hydrates through pore network models combined with CT observation. Energy 2018, 163, 27–37. [Google Scholar] [CrossRef]
- Sun, J.; Zhang, Z.; Wang, D.; Liu, C.; Lu, H.; Song, K. Permeability change induced by dissociation of gas hydrate in sediments with different particle size distribution and initial brine saturation. Mar. Pet. Geol. 2021, 123, 104749. [Google Scholar] [CrossRef]
- He, X.; Shan, X.; Doolen, G.D. Discrete Boltzmann equation model for nonideal gases. Phys. Rev. E Stat. Phys. Plasmas Fluids Relat. Interdiscip. Top. 1998, 57, R13–R16. [Google Scholar] [CrossRef]
- Xi-Chong, Y.U.; Liu, Y.; Song, Y.C.; Qing-Ping, L.I.; Pang, W.X.; Bai, Y.H. Study of multiphase flow laws in sediment with gas hydrate based on LBM method. J. China Univ. Pet. 2011, 35, 99–103. [Google Scholar]
- Keehm, Y.; Yoon, P. Pore-scale Modeling of Gas Hydrate Formation And Comparison to Lab Experiments. In Proceedings of the 2008 SEG Annual Meeting, Las Vegas, NV, USA, 9–14 November 2008. [Google Scholar]
- Chen, X.; Verma, R.; Espinoza, D.N.; Prodanovic, M. Pore-Scale Determination of Gas Relative Permeability in Hydrate-Bearing Sediments Using X-ray Computed Micro-Tomography and Lattice Boltzmann Method. Water Resour. Res. 2018, 54, 600–608. [Google Scholar] [CrossRef]
- Wu, N.; Li, Y.; Wan, Y.; Sun, J.; Huang, L.; Mao, P. Prospect of marine natural gas hydrate stimulation theory and technology system. Nat. Gas Ind. B 2021, 8, 173–187. [Google Scholar] [CrossRef]
- Yin, Z.; George, M.; Rong, C.Z.; Tan, H.K.; Praveen, L. Numerical analysis of experimental studies of methane hydrate dissociation induced by depressurization in a sandy porous medium. Appl. Energy 2018, 230, 444–459. [Google Scholar] [CrossRef] [Green Version]
- Yin, Z.; Moridis, G.; Tan, H.K.; Linga, P. Numerical analysis of experimental studies of methane hydrate formation in a sandy porous medium. Appl. Energy 2018, 220, 681–704. [Google Scholar] [CrossRef] [Green Version]
- Yin, Z.; Moridis, G.; Linga, P. On the importance of phase saturation heterogeneity in the analysis of laboratory studies of hydrate dissociation. Appl. Energy 2019, 255, 113861. [Google Scholar] [CrossRef] [Green Version]


| Type | Model | Literature | |
|---|---|---|---|
| Without hydrates | Cube & Sphericity | (ν is shape factor) | Yu [61] |
| Fine Particles | Boundreau [62] | ||
| Sphericity | Sen [63] | ||
| Square | Yu [61] | ||
| Contain hydrates | Sphericity | Iversen [64] | |
| Liu [65] | |||
| (A/V is specific surface) | Dai [39] |
| Schematic Diagram | Single Phase Flow | Equation | Highlights | Advantages | Disadvantages | Recommendations | Reference |
|---|---|---|---|---|---|---|---|
 | Parallel capillary | (4) | Equal-diameter capillaries | Easy to simulate and compare | Suitable for homogeneous system | Suitable as a basic model compared to other models due to its simple form | [32,56,57,58,59] |
| (7) | Simple form Easy to calculation | ||||||
| (9) | |||||||
| (8) | Tokyo model | [33] | |||||
 | KC model Fractal theory | (17) | Formation factor replaces tortuosity | The solution of tortuosity is avoided and the value can be fitted flexibly by saturation index | The value range of saturation index varies greatly and has no physical sense | The influence of capillary diameter and microcosmic parameters on permeability is considered | [60,66,67,68,69,70,71,72,73,74] |
| (18) | |||||||
| (22) | |||||||
| (23) | |||||||
| (15) | Introducing microscopic parameters | ||||||
 | Hybrid model | (24) | Combining PF and GC | The influence of two hydrate occurrence forms on permeability is considered | Too many empirical parameters for application | Reduce empirical parameters and consider how PF and GC interact to make effect on normalized permeability | [37] |
 | Cylindrical accumulation | (30) | Extending to 3D space | Compared with the two-dimensional capillary model, it is more accurate | Homogeneous configuration with equal diameter | The unequal inner diameter of the capillary is not considered and empirical parameters are included. | [34] |
| (32) | |||||||
 | Spherical accumulation | (34) | Regarding particles as spheres | The spherical appearance of sediment particles is simulated | The unequal dimeter of particles and inhomogeneity of distribution are not considered | It can 1be used as a basic model of clay mineral system | [34] |
| (35) | |||||||
| (36) | Modification in fluid area of pores at PF mode. | [75] | |||||
 | Random accumulation | (37) | Representing random as arrangement as heterogeneity | The heterogeneity of formation is simulated by particle random distribution | The unequal diameter of sediment particles in the actual formation is not taken into account | The model has potential for further research in the future | [34] |
| (38) | |||||||
 | Gas water | (25) | In line with the actual flow characteristics, and no parameters | The gas–liquid two phase flow is considered, which accords with the objective flow law | It is still a two-dimensional structure, and there are many solving parameters. The model is not conducive to direct application in the field. | The model should be generalized from two dimensions to three dimensions | [52] |
| (26) | |||||||
| (27) | |||||||
| (28) | |||||||
| TOUGH2 simulator | (39) | Widely applicable and without considering the occurrence form of hydrate | It is suitable for numerical simulation and has wide extension | Containing empirical parameters | Based on numerical results, it is hard to apply in the field | [35,76] | |
| Empirical model | (40) | The effect of capillary on gas–liquid flow is considered | Combining capillary force with two phase flow | Difficult to apply due to empirical parameters | Simplifying form and reducing empirical parameters to improve applicability | [78] |
| Sediment Group | Equation | Sediment Type |
|---|---|---|
| 1 | 80% clay | |
| 2 | 60–80% clay | |
| 3 | Silty clays and clayey silts | |
| 4 | Sandy clays and silts | |
| All data |
| Year | Method | Subject | Highlights | Reference |
|---|---|---|---|---|
| 2003 | NMR + Experiments | Natural samples in Monterey Bay | Measuring relaxation time to reveal hydrates tended to replace water in the largest pore spaces. | [32] |
| 2005 | NMR + MRI + Experiments | THF hydrates in the Laboratory | Measuring and monitoring the lattice relaxation times of THF hydrate formation/dissociation and patterns. | [104] |
| 2012 | MRI + Experiments | THF hydrates in Laboratory | To investigate the growth law and microstructure of hydrates in porous media, the growth process of THF hydrates under different concentrations. | [105] |
| 2014 | NMR + Experiments | Natural samples in shenhu | Pore-filling hydrates significantly affect the permeability of HBS. | [106] |
| 2015 | MRI + Experiments | Methane hydrates in Laboratory | Calculation by Equation (60) | [102] |
| 2021 | MRI + Experiments | Methane hydrates in Laboratory | Calculation by Equation (61) | [103] |
| Year | Modification Points | Highlights | Reference |
|---|---|---|---|
| 2006 | Added the muddy modification | Equation (62) | [107] |
| 2012 | Considering the effect of brine saturations. | Exists linear relationship between (Rt/RW) and 1-SH on log–log coordinates. | [109] |
| 2018 | Considering the effect of effective porosity and temperature on the fluid. | Equation (63) | [108] |
| <2019 | Considering the effect of saturation index. | The logarithmic relationship between saturation index and saturation is established. | [110] |
| 2020 | Considering the effect of gas, water, hydrate, and sediment on the overall resistance of HBS. | [111] |
| Stage | Period | Hotspots |
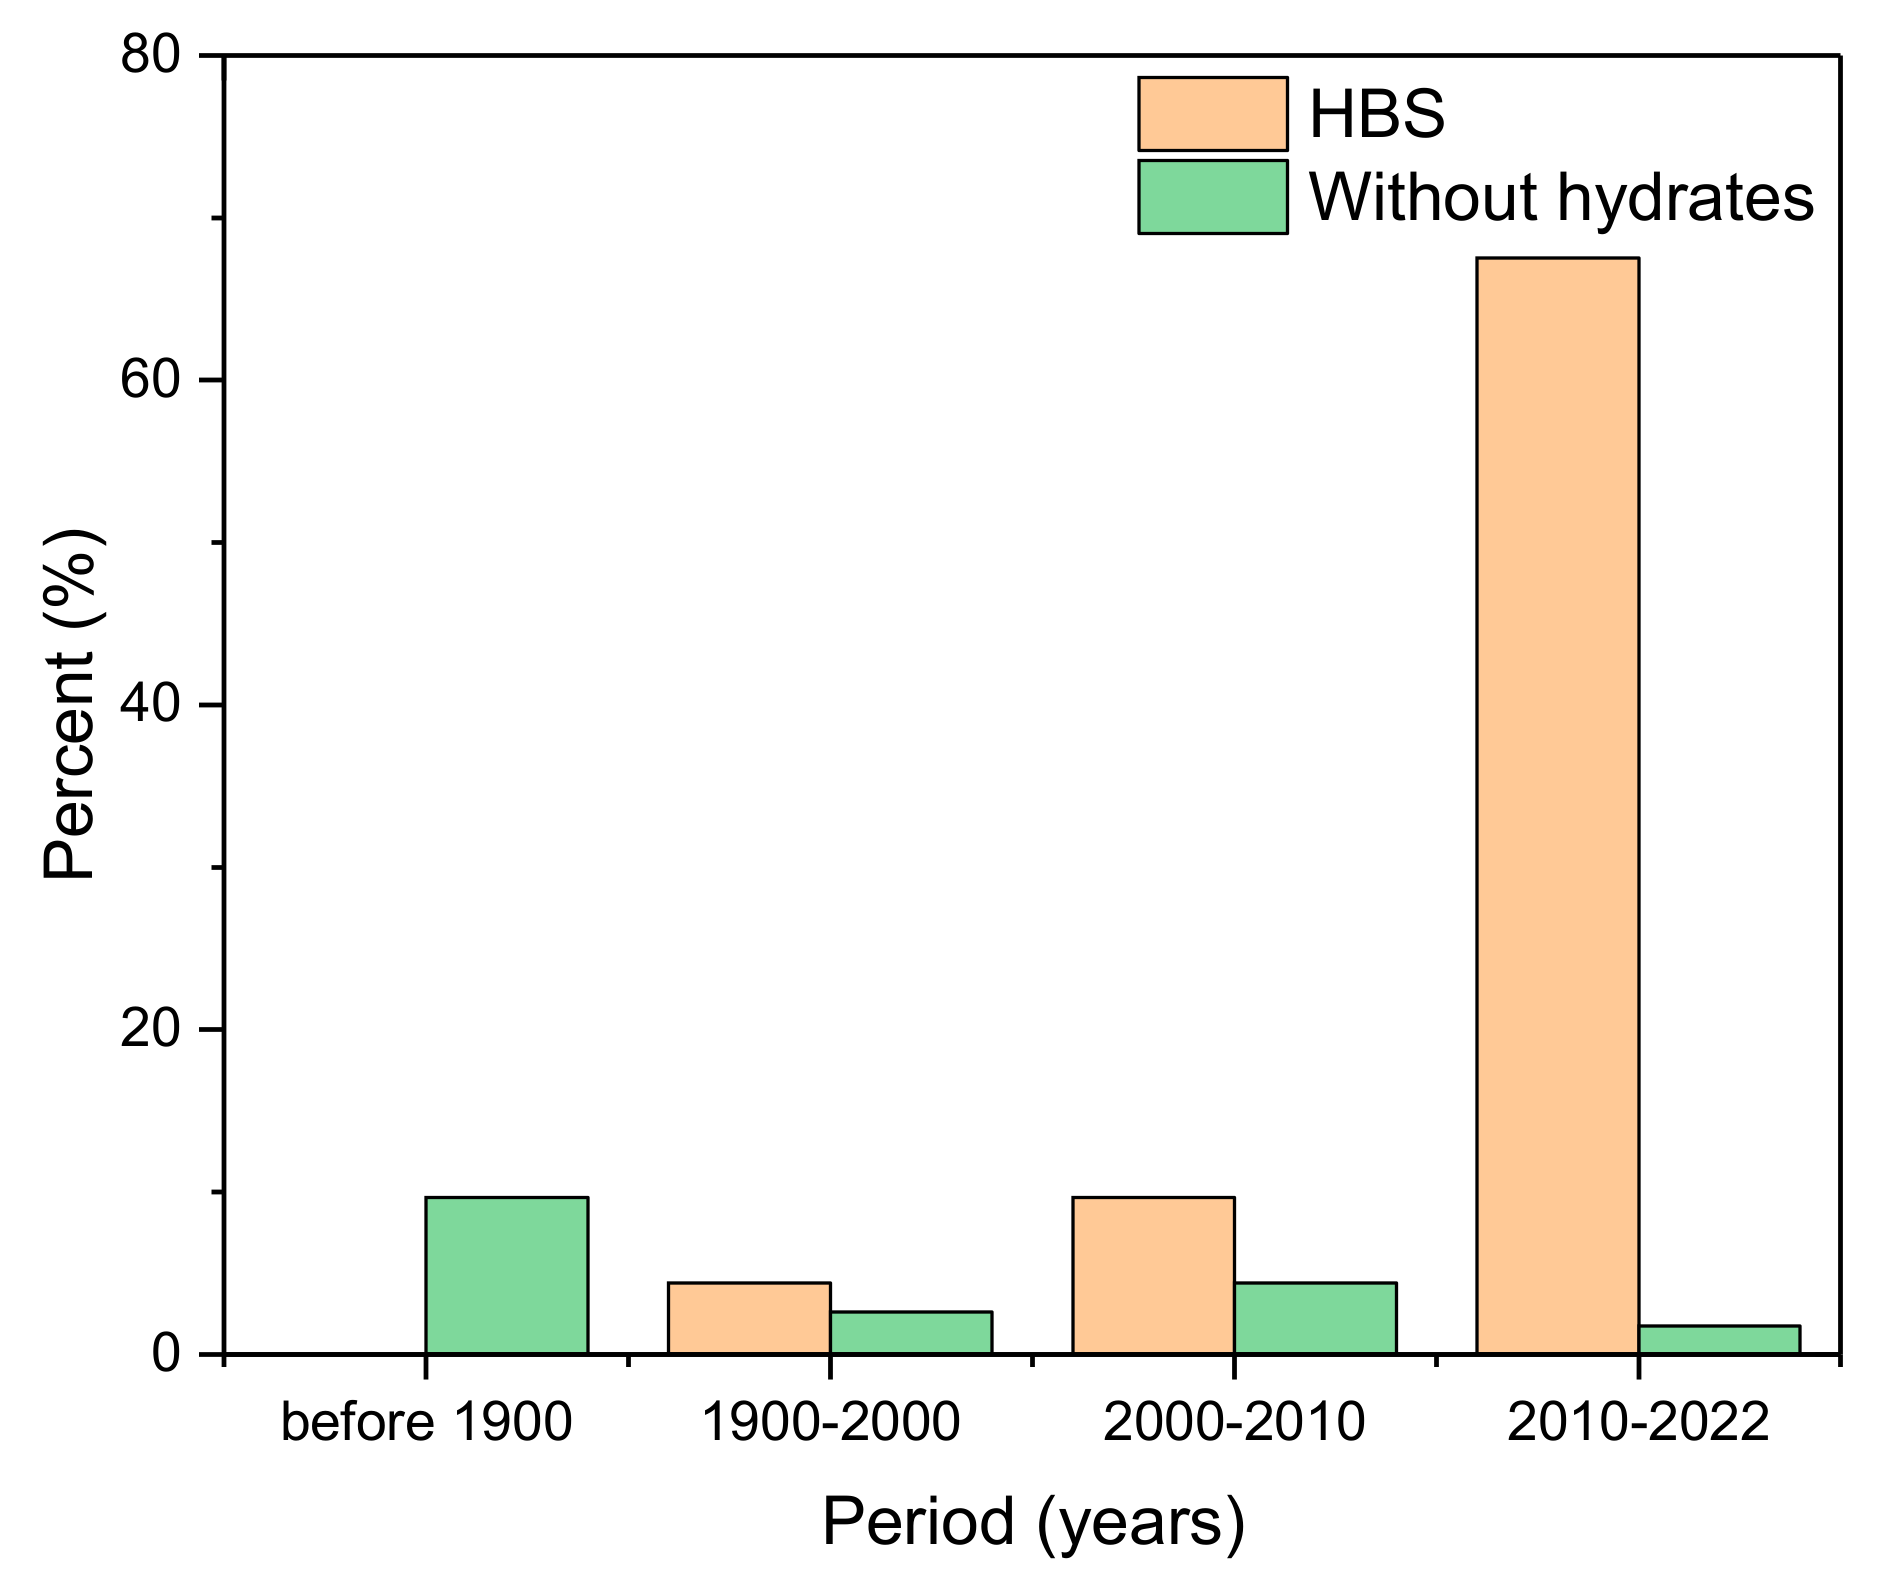
|---|---|---|
| 1 | Before 1990 | Build models and parameters measurements |
| 2 | 1990–2000 | Pore habits of porous media |
| 3 | 2000–2010 | Permeability models modification |
| 4 | 2010–2020s | Microscopic mechanism |
Publisher’s Note: MDPI stays neutral with regard to jurisdictional claims in published maps and institutional affiliations. |
© 2022 by the authors. Licensee MDPI, Basel, Switzerland. This article is an open access article distributed under the terms and conditions of the Creative Commons Attribution (CC BY) license (https://creativecommons.org/licenses/by/4.0/).
Share and Cite
Peng, H.; Li, X.; Chen, Z.; Zhang, Y.; You, C. Key Points and Current Studies on Seepage Theories of Marine Natural Gas Hydrate-Bearing Sediments: A Narrative Review. Energies 2022, 15, 4952. https://doi.org/10.3390/en15144952
Peng H, Li X, Chen Z, Zhang Y, You C. Key Points and Current Studies on Seepage Theories of Marine Natural Gas Hydrate-Bearing Sediments: A Narrative Review. Energies. 2022; 15(14):4952. https://doi.org/10.3390/en15144952
Chicago/Turabian StylePeng, Hao, Xiaosen Li, Zhaoyang Chen, Yu Zhang, and Changyu You. 2022. "Key Points and Current Studies on Seepage Theories of Marine Natural Gas Hydrate-Bearing Sediments: A Narrative Review" Energies 15, no. 14: 4952. https://doi.org/10.3390/en15144952
APA StylePeng, H., Li, X., Chen, Z., Zhang, Y., & You, C. (2022). Key Points and Current Studies on Seepage Theories of Marine Natural Gas Hydrate-Bearing Sediments: A Narrative Review. Energies, 15(14), 4952. https://doi.org/10.3390/en15144952