Article

A Theoretical Evaluation of the Efficiencies of Metal-Free 1,3,4-Oxadiazole Dye-Sensitized Solar Cells: Insights from Electron–Hole Separation Distance Analysis

by
Louis-Charl Cloete Coetzee
1,
Adedapo Sunday Adeyinka
2 and
Nomampondo Magwa
1,*
1
Department of Chemistry, University of South Africa, Private Bag X6, Florida, Roodepoort, Johannesburg 1710, Gauteng, South Africa
2
Research Centre for Synthesis and Catalysis, Department of Chemical Sciences, University of Johannesburg, Auckland Park, Johannesburg 2006, Gauteng, South Africa
*
Author to whom correspondence should be addressed.
Energies 2022, 15(13), 4913; https://doi.org/10.3390/en15134913
Submission received: 23 April 2022 / Revised: 23 May 2022 / Accepted: 28 May 2022 / Published: 5 July 2022
(This article belongs to the Special Issue Advances in Tandem Architectures toward High-Efficiency Solar Cells)

Abstract

:
Herein, some novel metal-free 1,3,4-oxadiazole compounds O1O7 were evaluated for their photovoltaic properties using density functional theory (DFT) and time-dependent density functional theory (TD-DFT) calculations to determine if they can serve as metal-free organic dyes in the use of dye-sensitized solar cells (DSSCs). To understand the trends in the relative efficiencies of the investigated compounds as dyes in DSSCs, their electron contributions, hole contributions, and electron–hole overlaps for each respective atom and fragment within the molecule were analyzed with a particular focus on the electron densities on the anchoring segments. As transition density matrices (TDM) provide details about the departure of each electron from its corresponding hole during excitations, which results in charge transfer (CT), the charge separation distance (Δr) between the electron and its corresponding hole was studied, in addition to the degree of electron–hole overlap (Λ). The latter, single-point excitation energy of each electron, the percentage electron contribution to the anchoring segments of each compound, the incident-photon-conversion-efficiency (IPCE), charge recombination, light harvesting efficiency (LHE), electron injection (Φinj), and charge collection efficiency (ncollect) were then compared to Δr to determine whether the expected relationships hold. Moreover, parameters such as diffusion constant (Dπ) and electron lifetime (t), amongst others, were also used to describe electron excitation processes. Since IPCE is the key parameter in determining the efficiency, O3 was found to be the best dye due to its highest value.

1. Introduction

Although fossil fuels are still the most widely used energy source globally, concerns have been expressed about whether reserves will soon run out, given that they are limited [1]. Additionally, widespread concerns have also been raised about the pervasiveness of global warming caused by energy consumption [2]. Unlike fossil fuels, renewable energy sources have several advantages: they replenish themselves naturally, produce little secondary waste, and reduce greenhouse gas emissions and promote sustainability [3,4]. These sources include bioenergy, direct solar energy, geothermal energy, hydropower, wind, and ocean energy (tide and wave) [4]. Photovoltaic (PV) systems and solar collectors are two direct solar energy sources. Both systems generate power through the photoelectric effect. The first-generation PV systems contained silicon and are still mostly used due to their hole transportation and charge carrier mobility [5]. However, the challenge in fabricating silicon solar cells and their high fabrication cost make it difficult to distribute PV systems that contain silicon. In response to these challenges, extensive research has recently been conducted to find more cost-effective materials to replace silicon in PV systems. One of these materials is dye-sensitized solar cells (DSSCs) due to their low cost, facile fabrication, low toxicity, and high-power conversion efficiencies. Moreover, these cells have also been proven to work under low light conditions [6]. A DSSC consists of a dye molecule with a coated wide bandgap semiconducting layer, electrolyte (usually   I / I 3 redox couple), and transparent conducting oxide (TCO) film. The TCO is usually coated with mesoporous semiconductor TiO2 [7]. The dye molecule can include metal complexes and metal-free organic dyes. Research has recently focused on metal–organic frameworks (MOFs) as dye molecules due to their robustness, porosity, light-harvesting properties, thermal stability, and structural versatility. However, their insulating properties limit their usage [8,9,10,11,12,13,14]. In the past, Ru-based complexes held the top place for the highest efficiency in DSSCs, of over 11%, but were overtaken first in 2014 by zinc porphyrin compounds, with an efficiency of 13%, and soon afterwards in 2015, by two co-sensitized metal-free organic dyes with an efficiency of 14.30% [15]. It was not just the efficiency of metal-free organic dyes that spurred researchers to focus more on them, but their low cost, simple synthetic procedures, high molar absorption coefficients, and variable structure adjustability [16,17]. An organic dye usually consists of three fragments, namely, a donor, π-spacer, and an acceptor (D-π-A), where a push–pull system induces intramolecular charge transfer (ICT) from D to A via the π-spacer (Figure 1) [18,19,20,21,22]. Commonly used donor groups include triarylamine, starburst, carbazoles, indoles, phenoxides, phenothiazine, and coumarins [21,23,24,25,26,27,28,29], while commonly used π-spacer units include vinylene and thiophene groups [27,29], and commonly used acceptor groups include cyanoacetic acid, rhodamine-3-acetic acid, barbituric acid, hydroxyl, phosphoric acid, cyanoacrylic acid, and carboxylic acid [22,27,30]. ICT occurs due to sunlight hitting the compound and following a process that mimics photosynthesis [31]. Photophysicochemical properties of the dye determine the efficiency of electron injection into the conduction band of TiO2. It is highly recommended that an ideal dye has a high diffusion constant (Dπ) to ensure minimal charge recombination. Successively, this leads to a large charge accumulation with a high charge collection efficiency (ncollect) at the interface between the dye and the conduction band of TiO2. To achieve this, the dye should absorb in the near-infrared region (NIR), and have a high fluorescence emission factor (Φf), high ground state molar absorption coefficient (εg), large oscillator strength (f), and a high dipole moment [32]. The performance of a DSSC is dependent on a good light-harvesting efficiency (LHE) from the dye and near quantitative collection (at the short circuit) [33]. As the ground state reduction potential of the conduction band (ECB) has a literature value of −4.21 eV, it should be noted that for efficient transfer of photoelectrons from the dye into the conduction band of the TiO2 semiconductor, the latter should have a higher reduction potential than the former. The electron injection rate depends on the difference between the LUMO of the dye and the conduction band edge (δp) of the semiconductor (the smaller the difference, the faster the transfer). For a highly efficient transfer, the ideal difference should be ≤0.40 eV. This will subsequently lead to a faster photocurrent density in the cell. The energy level of the I / I 3 redox couple should also lie above the HOMO level of the dye for electrons to be successfully regenerated back into the dye. The fact that the incident-photon-conversion-efficiency (IPCE) is a function of the LHE, electron injection, and charge collection efficiency prior to the injection makes it the key parameter to determine the efficiency of a dye [32]. Our study analyzed the photophysicochemical properties of compounds containing 1,3,4-oxadiazole π-spacer units (Figure 2). There have been some reports of compounds that contain this moiety as a π-spacer unit of a dye in DSSCs [34,35,36]. These are efficient electron transporters with high thermal stabilities and high photoluminescent quantum yields [37]. It is expected that highly energetic electrons will create large electron–hole separation distances, subsequently inducing small electron–hole overlaps. This will then cause them to diffuse more rapidly towards the anchoring segments, resulting in a high accumulation of charge that is more readily available for injection into the semiconductor’s conduction band. Rapidly diffusing electrons will also be expected to regenerate more easily. As part of our ongoing research to theoretically assess the efficiencies of DSSCs containing novel metal-free organic dyes and provide plausible explanations for the observed trends, this study investigated the influence of selected moieties on the electron–hole charge separation distances in selected dye molecules. Furthermore, we explored correlations between the charge separation distance and other parameters, such as the electron–hole overlap, single-point excitation energies, electron densities across the anchoring segments, IPCE, dye regeneration, LHE, electron injection (Φinj), and ncollect. To the best of our knowledge, this is the first study that explores how electron–hole excitation processes determine the efficiencies of DSSCs. Herein, we provide the results from these analyses and their implications.

2. Methodology

Computational Details

All calculations were carried out using Gaussian 09 rev E01 software [38]. The geometries of all molecules were optimized in the gas phase for both DFT and TD-DFT calculations. All structures were optimized at the M06-2X/6-31G(d,p) level of theory. Previous studies have shown that the M06-2X functional obtained highly accurate electronic excitation energies with minimal errors in the main-group thermochemistry [39,40]. The optimization process was carried out in conjunction with frequency calculations to verify that minimum energies were obtained for the structures. Using their optimized structures as input, we carried out TD-DFT calculations on the organic dyes labelled O1O7 (Figure 2) in the gas phase, and their frontier molecular orbital natures (FMO) were analyzed with multiwfn software [41] by dividing their structures into D-π-A fragments to study their ICT at the same level of theory. In addition, molecular orbital structures, and energies of their HOMO and LUMO, were also obtained from an analysis of the optimized structures, together with single point calculations through conceptual density functional theory (CDFT) and molecular electrostatic potentials (MEPs).

3. Results and Discussion

3.1. Optimized Geometry

The predicted property of a molecule depends heavily on the accuracy of its optimized structure. A series of optimization steps are required for each structure before reaching its minimum energy configuration (Figure S1)—conventionally known as the optimized structure. The optimized structures were validated as minima or transition state structures by performing frequency calculations. As any structure with one imaginary frequency (i.e., negative vibrational frequency) is denoted by a transition state, higher-order saddle points are assigned to structures with two or more imaginary frequencies. Hence, it is generally accepted that a structure that has reached its minimum energy should not have a negative frequency, and hence, is fully optimized. However, in the case of very large floppy molecules, negative vibrational frequencies from 10 to 100 cm−1 can be ignored [42].

3.2. Coulomb Attractive Energy and Electron Excitation Analyses

The efficiency of a DSSC depends on the electro-optical properties and electron–hole pair dissociation potential of the metal-free organic dye. As Coulombic forces exist between electron–hole pairs, binding (Coulomb attractive) energy holds the electron to its hole. The low dielectric constant of organic molecules causes a strong Coulombic force between the electron–hole pair, resulting in a high binding energy, which is inversely proportional to the dissociation energy. The latter causes the electron to depart from its hole. Equation (1) gives the relation between binding energy, band gap energy, and single point excitation energy:
Eb = E(LUMO-HOMO)E(S1-S0)
where Eb is the binding energy, which can also be classified as the estimation of dissociation energy of excitation; E(LUMO-HOMO) is the band gap energy; and E(S1-S0) is the single point excitation energy between the ground and the excited state. For an electron to become successfully excited to the LUMO level, it must possess positive single point energy. This also separates it from its hole [43]. The ionization potential (IP) and electron affinity (EA) can predict the electron–hole transport barrier. The former can be calculated using Equation (2):
IP = −E(N−1)EN
The latter can be calculated through Equation (3):
EA = −ENE(N+1)
where N refers to the electron’s state. Previously, it was believed that a narrow E(LUMO)-(HOMO) energy gap means higher IP [44]. However, a recent study by Bulat et al. revealed that the energies of electrons in specific atomic or molecular orbitals play significant roles in excitation processes. Electrons occupy specific sites within the space of a molecule irrespective of the molecular orbitals that they may occupy. If an orbital φi has an electron density ρi(r) and energy εi, then the total electronic density is ρ(r), and the average orbital energy is:
ε ¯ ( r ) = ρ i ( r ) ε i ρ ( r )
The summation of Equation (4) over all the occupied orbitals is:
I ( r ) ¯ = ρ i ( r ) | ε i | ρ ( r )
where I ( r ) ¯ is the average local ionization energy at r. I ( r ) ¯ is the average energy required to remove an electron at point r in the space of an atom or molecule. The least tightly held electrons within atomic or molecular space are also the most energetic and correspond to the lowest I ( r ) ¯ values. Like Fukui’s reasoning, these are the likely sites for electrophilic substitution, protonation, and free radical attack. I ( r ) ¯ were shown to be related to other critical molecular properties such as kinetic energy density and local temperature, local polarizability/hardness, electronegativity, atomic shell structure, and the electrostatic potential. When Bulat et al. studied the I ( r ) ¯ of twelve molecules, they observed that only five of the twelve contained electrons that occupied the HOMO [45].
As electrons become excited, they are distributed unsymmetrically, causing an increase in the polarity in the excited state. The polarity of the molecule influences its geometry, which can be measured by the dipole moment. Thus, the symmetry of the molecule is inversely proportional to the dipole moment. For an electron to become excited, it must absorb a photon. The probability for a photon to be absorbed is proportional to its oscillator strength (f) [43]. Since the excited state is less stable than the ground state, electrons will return to the latter. Other than O7, all the compounds in Table 1 yield positive single point excitation energies. Thus, in most compounds, electrons will become excited. The highest single point energy in O5 indicates that an electron will become excited more easily than the other compounds under study. However, its f is less than that of O2. The low dipole moment in O4 means that it is highly symmetrical, and upon excitation, an electron will more easily relax to the ground state than the other compounds.
As the dipole moment indicates the solubility of a molecule in polar solvents [43], it is expected that O4 will be the least soluble, whereas O1 will be the most soluble. Upon dissolution, an increase in the wavelengths of these compounds is expected due to interaction with solvent molecules [43]. Figure 3 shows a correlation between IP and EA, where the latter decreases as the former increases. This can be expected since IP requires energy to remove an electron from its energy state, whereas EA releases energy when an atom gains an electron. Observing EA in Table 1, it should be noted that EA lies in the order O7 > O6 > O5 > O1 > O2 > O4 > O3. As all the LUMO energies lie above the literature value of the conduction band edge of TiO2 (−4.21 eV) [32], each compound has the potential to successfully transfer electrons into the conduction band edge once excited. As their HOMO energies lie below the literature value of the HOMO energy (−4.6 eV) of I / I 3 [32], their electrons can also be successfully regenerated back into the dye. Other than O6 and O7, none of the compounds absorb in the visible and near-infrared (NIR) regions.

Molecular Electrostatic Potential (MEP)

As molecular electrostatic potential (MEP) calculations have proven to be a reliable chemical descriptor for the measurement of electronegativities of atoms in a molecule that are comparable to experimental observations [46], it was deemed worthwhile to perform these measurements to obtain the electronegativities on selected atoms (Table 2). When MEP measures the electronegativities, positive values indicate nucleophilic attacks and negative values indicate electrophilic attacks. In our case, we will only consider the electronegativities on the anchoring segments CN and COOH, since they play a significant role in electron injections into the conduction band edge of the semiconductor. We observe in Table 2 that the combination of the nitrogen atom (N15) of the cyano anchoring segment and the oxygen atoms (O17 and O18) of the carboxylic acid anchoring segment in O1 contains the highest concentration of electrons, whereas the nitrogen atom (N53) of the cyano anchoring segment in O7 clearly contains the lowest concentration of electrons. The MEP trend lies in the order O1 > O5 > O2 > O3 > O4 > O6 > O7. It was expected that O7 would have the lowest electronegativity value due to its very low EA value.

3.3. Photovoltaic Parameters

As MEP measures the electron densities on atoms in a molecule, it is a good chemical indicator that can distinguish between donor, π-spacer, and acceptor fragments, where the latter contains the highest concentration of electrons amongst the three fragments. [44,47]. (For a detailed discussion of the atom-based electron–hole analysis, see ESI). From the anchoring groups of the acceptor fragment, electrons diffuse into the TiO2 conduction band via a diffusion constant Dπ, which can be calculated using Stoke’s Equation (6):
D π = K B T 6 π η r d y e
where KB is Boltzman’s constant; η = the viscosity of the medium, which can be assumed to be He at 300 K (20.0 × 10⁻⁶ Pas) in this case since the investigations were performed in the gas phase; NA = Avogadro’s number; and rdye = the molecular radii of the dye. The latter can be obtained from Equation (7):
r d y e = a = 3 M 4 π ρ N A 3
where a = Onsager cavity radii, M = the molecular weight of the dye, ρ = the density of He gas (9.00 × 10⁻² kg·m−3) at STP, and NA = Avogadro’s number. As stated earlier, the diffusion constant plays a key role in minimizing charge recombination during excitations (electrons that diffuse more rapidly will have a lower probability for charge recombination) [22]. The low molecular weights of O2 and O4 cause them to display the highest Dπ (Table 3). Thus, due to their small sizes compared to the other compounds, their photoelectrons will diffuse more rapidly into the conduction band of TiO2. As electrons diffuse towards the conduction band of TiO2, a charge builds up and is collected. The efficiency of this collection is called the charge collection efficiency (ncollect), which can be obtained through Equation (8):
n collect = D π ( δ p ) ²
where δp is the potential difference between the LUMO of the dye and the conduction band of TiO2. ncollect measures the availability of electrons before injection [22]. The high LUMO excited-state energy in O3 causes it to accumulate more charge across its ncollect value than the other compounds. As a low potential difference between the LUMO excited state energy and the conduction band of TiO2 exists due to the low excited state energy of the former, low charge build-up occurs in O6.
Light harvesting efficiency (LHE), which measures the spectral distribution of sunlight that is being absorbed onto the molecule, can be expressed as:
LHE = 1 − 10f
where f is the oscillator strength of the dye molecules. From Equation (9), we can deduce that a large oscillator strength will yield a high LHE. Thus, the large f value in O2 causes it to display a large LHE. If the excited electron injection efficiency (Φinj) of the dye is assumed to be equal to the fluorescence emission factor (Φf), then we can define the latter as in Equation (10):
Φ f = I ε e m I ε a b s
where em and abs are the integrated emission and absorption coefficients, respectively, and correspond to the areas under the emission and absorption spectra. The former can be obtained through the extrapolation of the absorption spectra [22]. Due to a small difference between the absorption and emission spectrum in O3, a large Φinj is displayed in this compound. Thus, more photoelectrons can be transferred from the LUMO of this compound into the conduction band of TiO2 than the other compounds. Conversely, a small Φinj is observed in O6 due to large differences between absorption and emission spectra in this compound, which arise from possible photo collisions [45]. The IPCE can then be obtained through Equation (11):
IPCE = LHE × Φinj × ηcollect
As mentioned earlier, IPCE is the key factor determining the efficiency at which the dye can inject photoelectrons into the conduction band of TiO2 [22]. The large Φinj in O3 causes a large IPCE, whereas the small Φinj in O6 causes a very small IPCE. An electron can be efficiently transferred to the first excited state if it has a long lifetime (t), which is denoted by the equation:
t = 1.499 f × E 2
where f is the oscillator strength, and E (cm−1) is the excitation energy of the different electronic states [47]. The long t for the excited state in O6 means that electrons can be more efficiently transferred to a higher energy level within this compound than the other compounds.
The free energy obtained from the electron injection (ΔGinject) can be expressed as:
Δ G inject = E O x d y e * = E O x d y e E 00
where E O x d y e is the oxidation potential energy of the dye in the ground state, and E00 is the electronic vertical transition energy corresponding to λmax [47].
The regeneration of free energy ( Δ G d y e r e g e n ) is a significant factor that can affect the photoelectric conversion efficiency and can be expressed as:
Δ G d y e r e g e n = E r e d o x e l e c t r o l y t e     E o x d y e
where a large Δ G d y e r e g e n can promote dye regeneration and increase the JSC [22,48]. As O4 displayed the highest Δ G d y e r e g e n , its photoelectrons will be more easily regenerated.

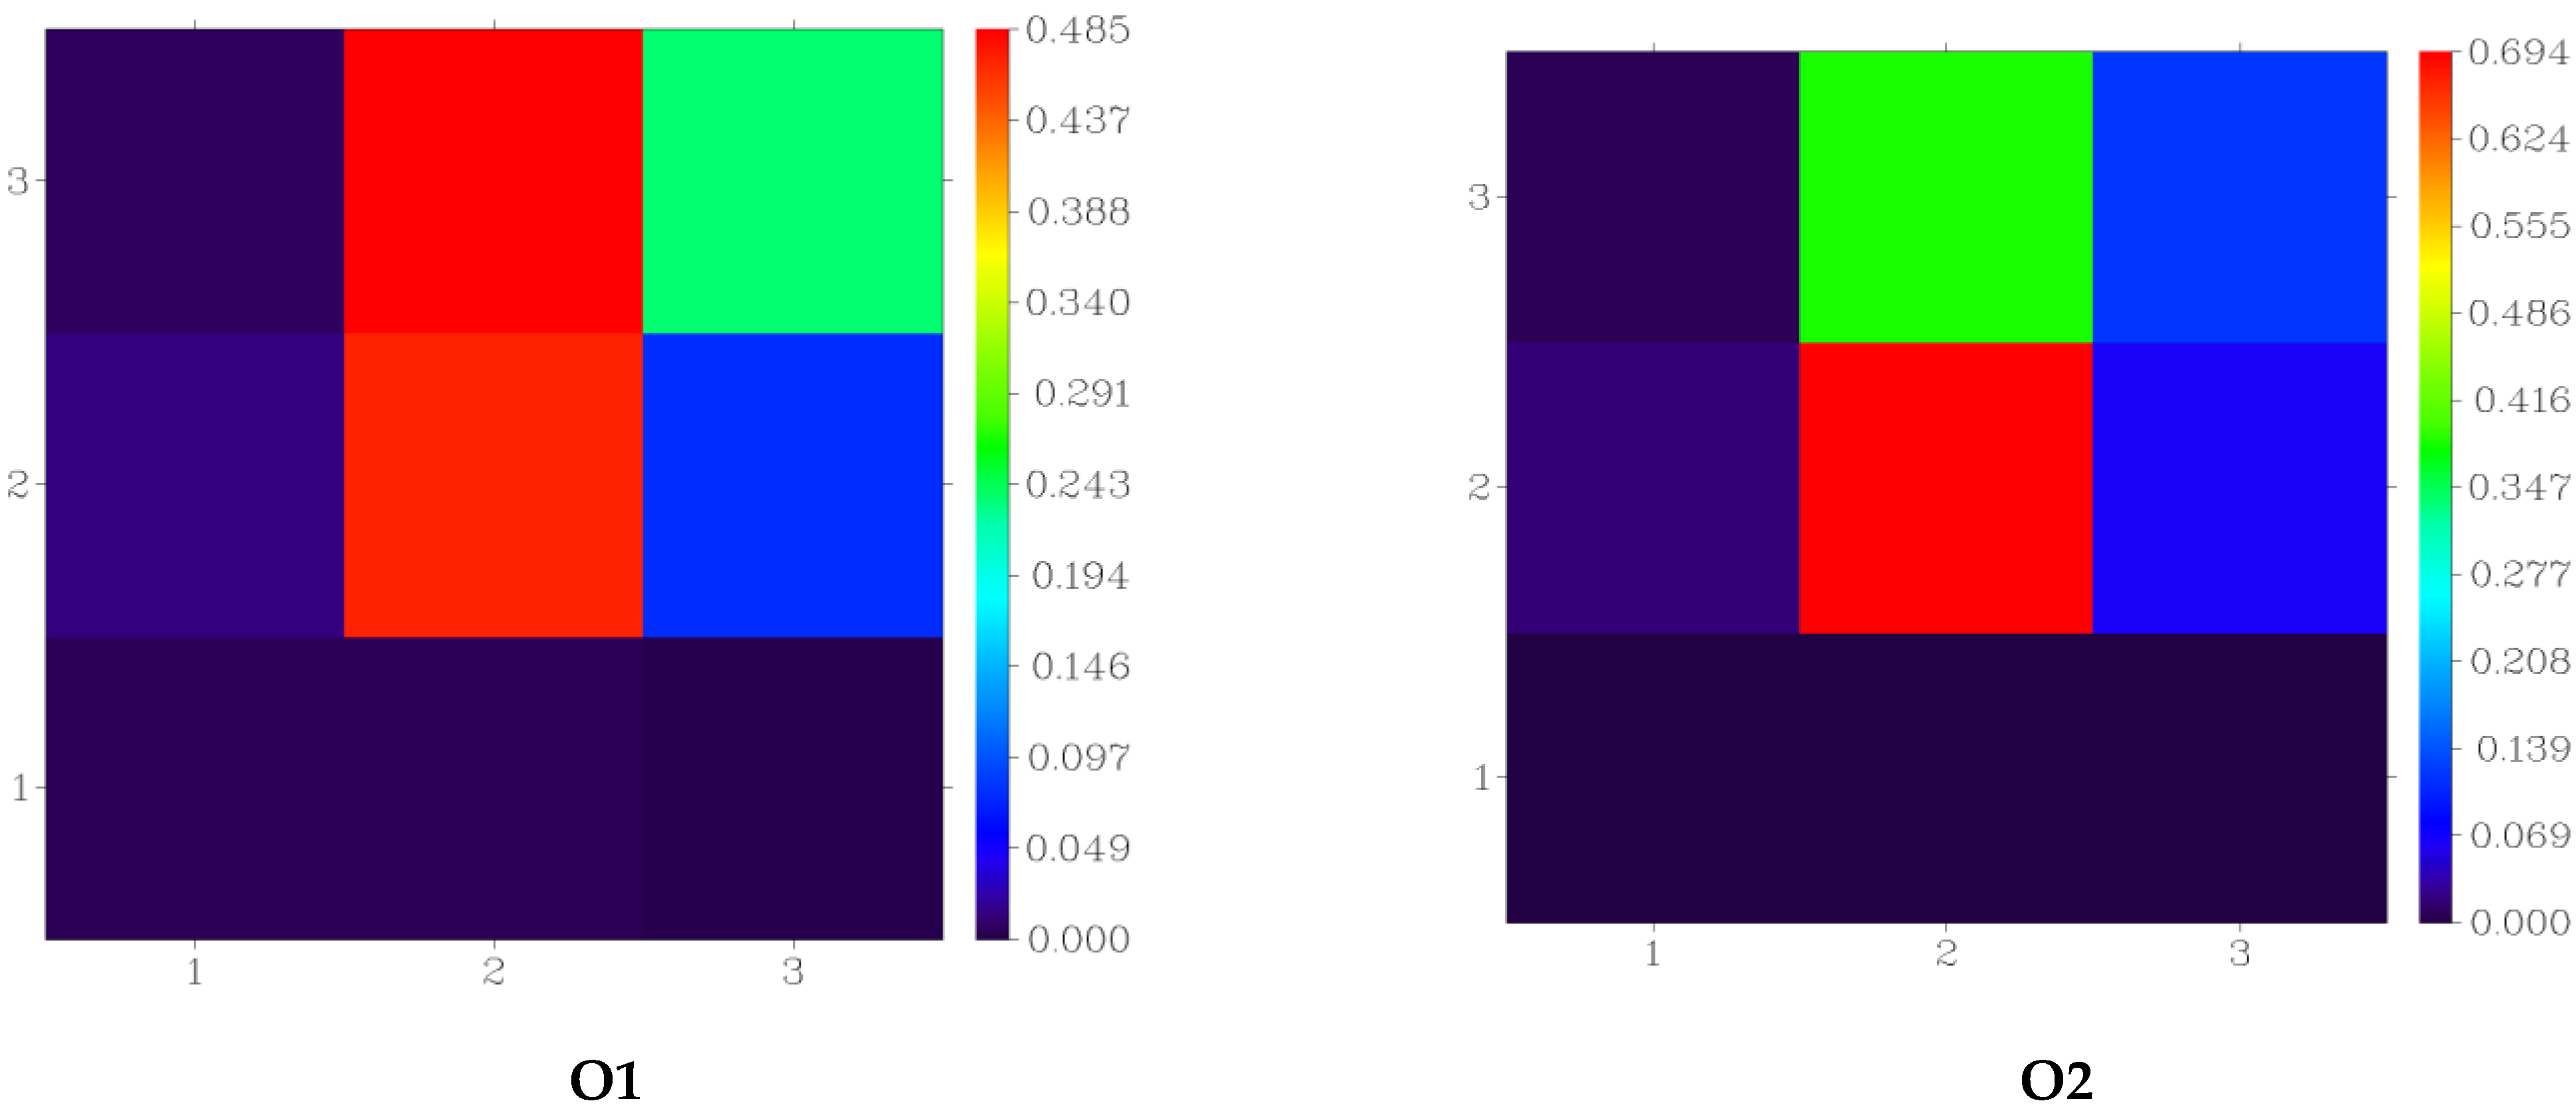
3.4. Fragment-Based Electron–Hole Analysis

After dissecting each molecule into atoms to establish the concentration of electrons excited to the anchoring groups (see ESI), an evaluation was performed on the fragment contribution to electron–hole analysis (Figure 4 and Figure 5). In Figure 4, the values on the right-hand side of the y-axis represent the hole, electron, and overlap contributions, where purple indicates the least contribution and red indicates the highest contribution. The numbers 1, 2, and 3 in the x-axis represents the donor, π-spacer, and acceptor fragments, respectively. These analyses were also performed for the first excited state. The darkest purple color in fragment 1 for the electron contribution shows that it made lower contributions than the hole and electron–hole overlap contributions in O1. A similar scenario is observed in the π-spacer fragment, although the hole contribution is significantly more than the electron–hole overlap contribution. At the acceptor fragment, it is clearly observed that the electron contributions are the most. The rest of the compounds display similar scenarios as those observed in O1. A loss of 1.12% in O1 is observed for the donor fragment during excitations as the charge is transferred to the second fragment (Table 4). At the second fragment, 35.68% of electrons are lost during excitations, which are then transferred to the third fragment. About 36.52% of electrons are then delocalized to the third fragment due to these excitations. This represents quantitative measurements of our observation in Figure 4. Larger hole than electron contributions for the donor and π-spacer groups, in addition to smaller overlap analyses for the acceptor group than its electron contributions, confirm this (Figure 5). This also agrees with the atom-based electron–hole analyses, in addition to our observations in Figure 4 and Table 4. Although to a lesser degree, a similar scenario is observed in O2, which also agrees with the atom-based electron–hole analyses (Table 5). The same trend holds for the rest of the compounds as for O1 and O2 (Table 6, Table 7, Table 8, Table 9 and Table 10), and also agrees with our atom-based electron–hole analyses. As Figure 6 shows the electron distribution across the different fragments in each compound for both HOMO and LUMO analyses; it is observed that electrons are localized across the donor and π-spacer fragments and then delocalized to the acceptor fragments in all the compounds other than O7, where electrons are localized across the acceptor fragment for both HOMO and LUMO analyses. This also confirms the findings of Bulat et al. [45].

3.5. Transition Density Matrix (TDM)

The transition density matrix (TDM) provides a spatial map that contains information about charge-transfer lengths (Δr) (Table 11) and the degree of electron–hole overlap (Λ) (Table 12) analysis during excitations. The former is the measurement of the separation distance between the electron and its corresponding hole. This chemical index can be used to distinguish between local excitations (LE) and CT. The former occurs if Δr ≤ 2 Å, and the latter if Δr ≥ 2 Å [49]. Table 11 shows the corresponding orbital pairs in which electron–hole separation distance is measured. From Table 11, the degree of electron–hole separation distance lies in the order O4 > O3 > O2 > O5 > O1 > O7 > O6. The corresponding orbital pairs also agree with the localization and delocalization of π-electrons for HOMO and LUMO orbitals in Figure 6. Other than O6, CT is displayed for the orbital pairs in all the compounds. The observation in O6 does not agree with the fragment-based electron–hole analysis described earlier for this compound. A possible reason may be the level of theory and basis set selected when performing DFT calculations [38]. It is believed that a greater separation distance between an electron and its corresponding hole leads to lesser electron–hole overlap, resulting in lower charge recombination [49]. However, Figure 7 clearly shows that such a trend was not observed within our study. When comparing the data for Δr to Λ, only O1, O2, and O6 followed the expected trend. Previous studies that involve the chemical index Λ have shown inaccurate measurements, irrespective of the level of theory used [49,50]. It is also expected that a high single point excitation energy of an electron would induce a large Δr. Although Figure 8 does not show this trend, only O5 and O7 spoil this relationship. It is also expected that each compound’s anchoring group with the largest concentration of electrons should have the largest Δr. However, as Figure 9 shows, the selected model failed to verify this relationship, as only O1, O2, and O7 follow this trend. This significant deviation can be attributed to the direct relationship between Λ and electron contributions.
When acceptor moieties draw electron density from the donor core via the π-spacer, the transition between different energy states does not change, as only the vibrational energy levels change. This allows us to analyze and visualize the dynamics of shifting electron density in terms of Δr [43]. Observing the influence of the moiety on the photophysical properties of each molecule will allow us to tune their light-harvesting efficiencies (LHEs) and predict the outcome of charge recombination (i.e., the longer the Δr, the lower the charge recombination) [51]. A detailed discussion on the atom-based transition density matrix is given in the ESI.
Figure 10 can be interpreted in the same way as Figure S6. At first glance, the light green color in the right-hand corner of O1 seems to display the largest electron–hole overlap for the acceptor fragment in this compound, which results in large charge recombination. However, the value in the y-axis indicates that O6 holds the largest charge recombination in the acceptor fragment. This agrees with the measurement for Δr, which showed LE. It is also observed that O2 holds the least charge recombination across the acceptor fragment, although it does not have the largest Δr value. This is also verified in Table 4, Table 5, Table 6, Table 7, Table 8, Table 9 and Table 10.

3.6. Intra-Fragment-Charge Transfer (IFCT) and Dihedral Angles

The positive IFCT values in Table 13 indicate a higher concentration of electrons on the acceptor fragment than the donor and π-spacer fragments. A large IFCT value is achieved for smooth electron movements between D and the π-spacer, and the π-spacer and A fragments. Smooth electron movements typically occur for small dihedral angles between D-π and π-A fragments [22]. This is verified in O4. However, a large IFCT is also observed in O5, although large D-π and π-A dihedral angles are observed. A possible reason for this may be the large concentration of electrons supplied by the arylamine donor group and other factors such as atomic shell structure and local polarizability/hardness [45]. Although a large IFCT is observed in O4, it is highly likely that dye aggregation from intermolecular interactions between molecules can occur due to its small D-A dihedral angle, resulting in low electron injection into the conduction band of TiO2 [32]. The largest IFCT value was also observed for O6. This is a bit unexpected due to its small Δr value, which indicates LE and its large D-π and π-A dihedral angles. Its D-A dihedral angle shows that it is not very prone to intermolecular interactions that lead to charge aggregations. A positive IFCT in O7 also indicates a possibility for electron injection into the conduction band of TiO2, although large D-π and π-A dihedral angles were also observed. Furthermore, a reasonable D-A dihedral angle was observed that might be large enough to prevent dye aggregation.

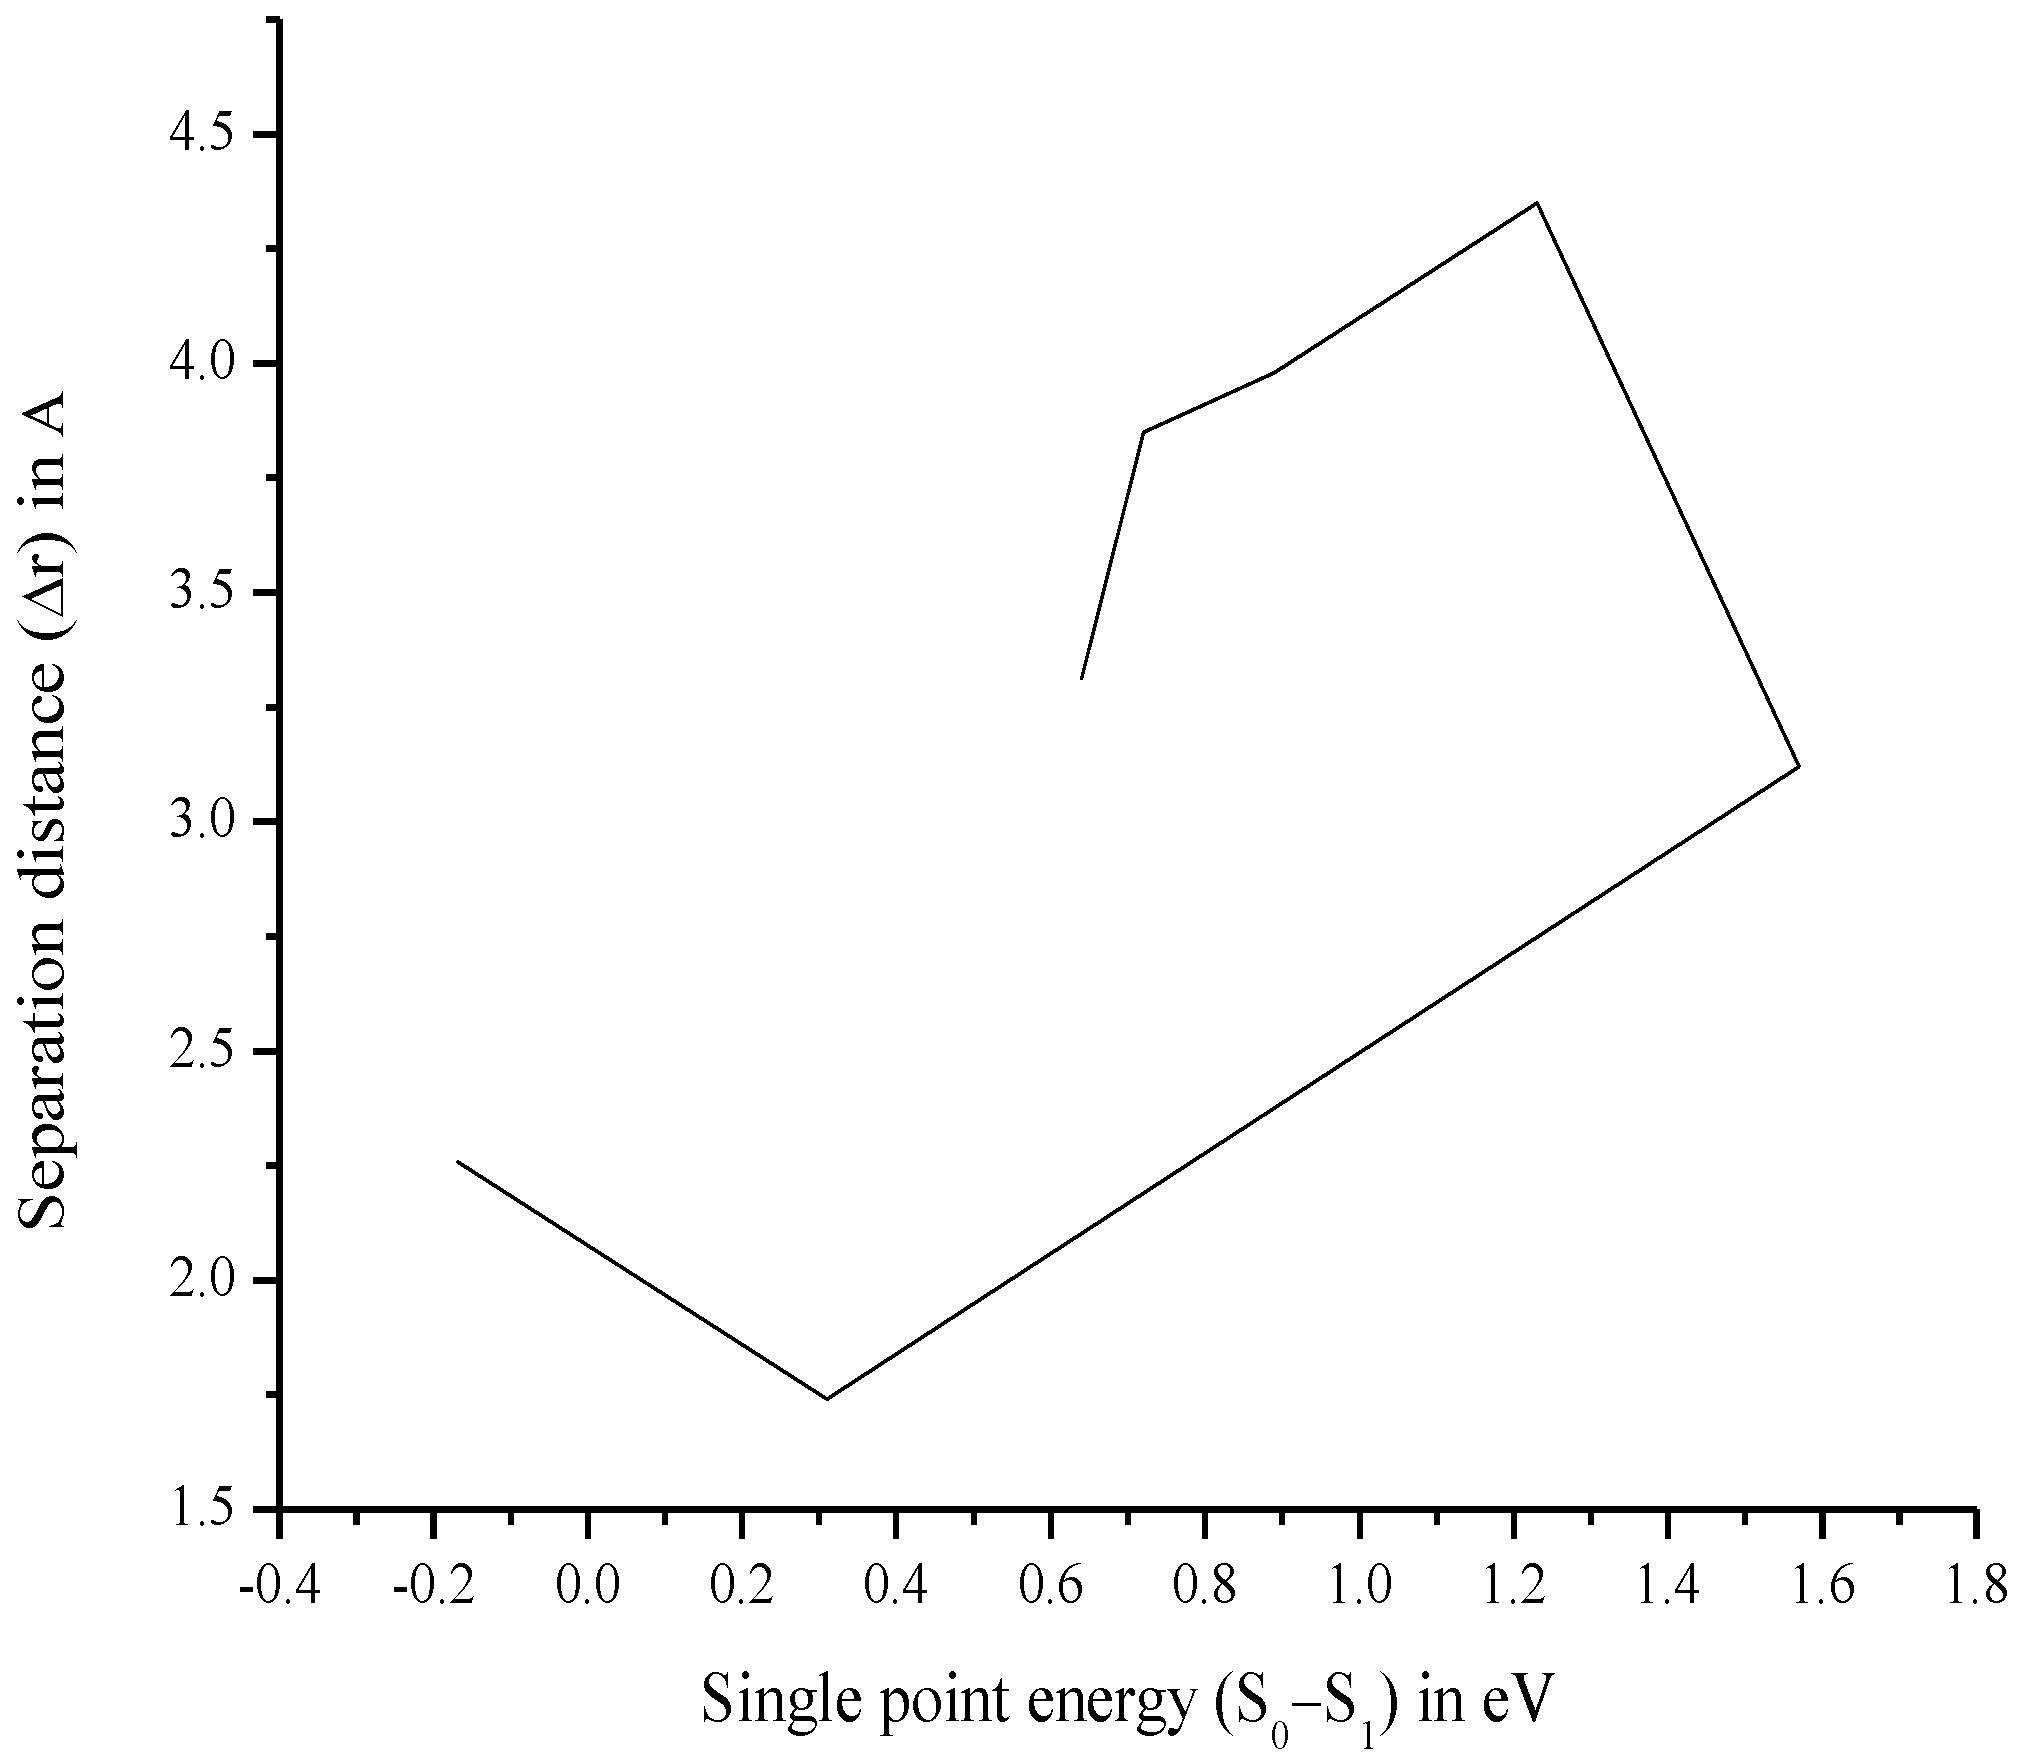
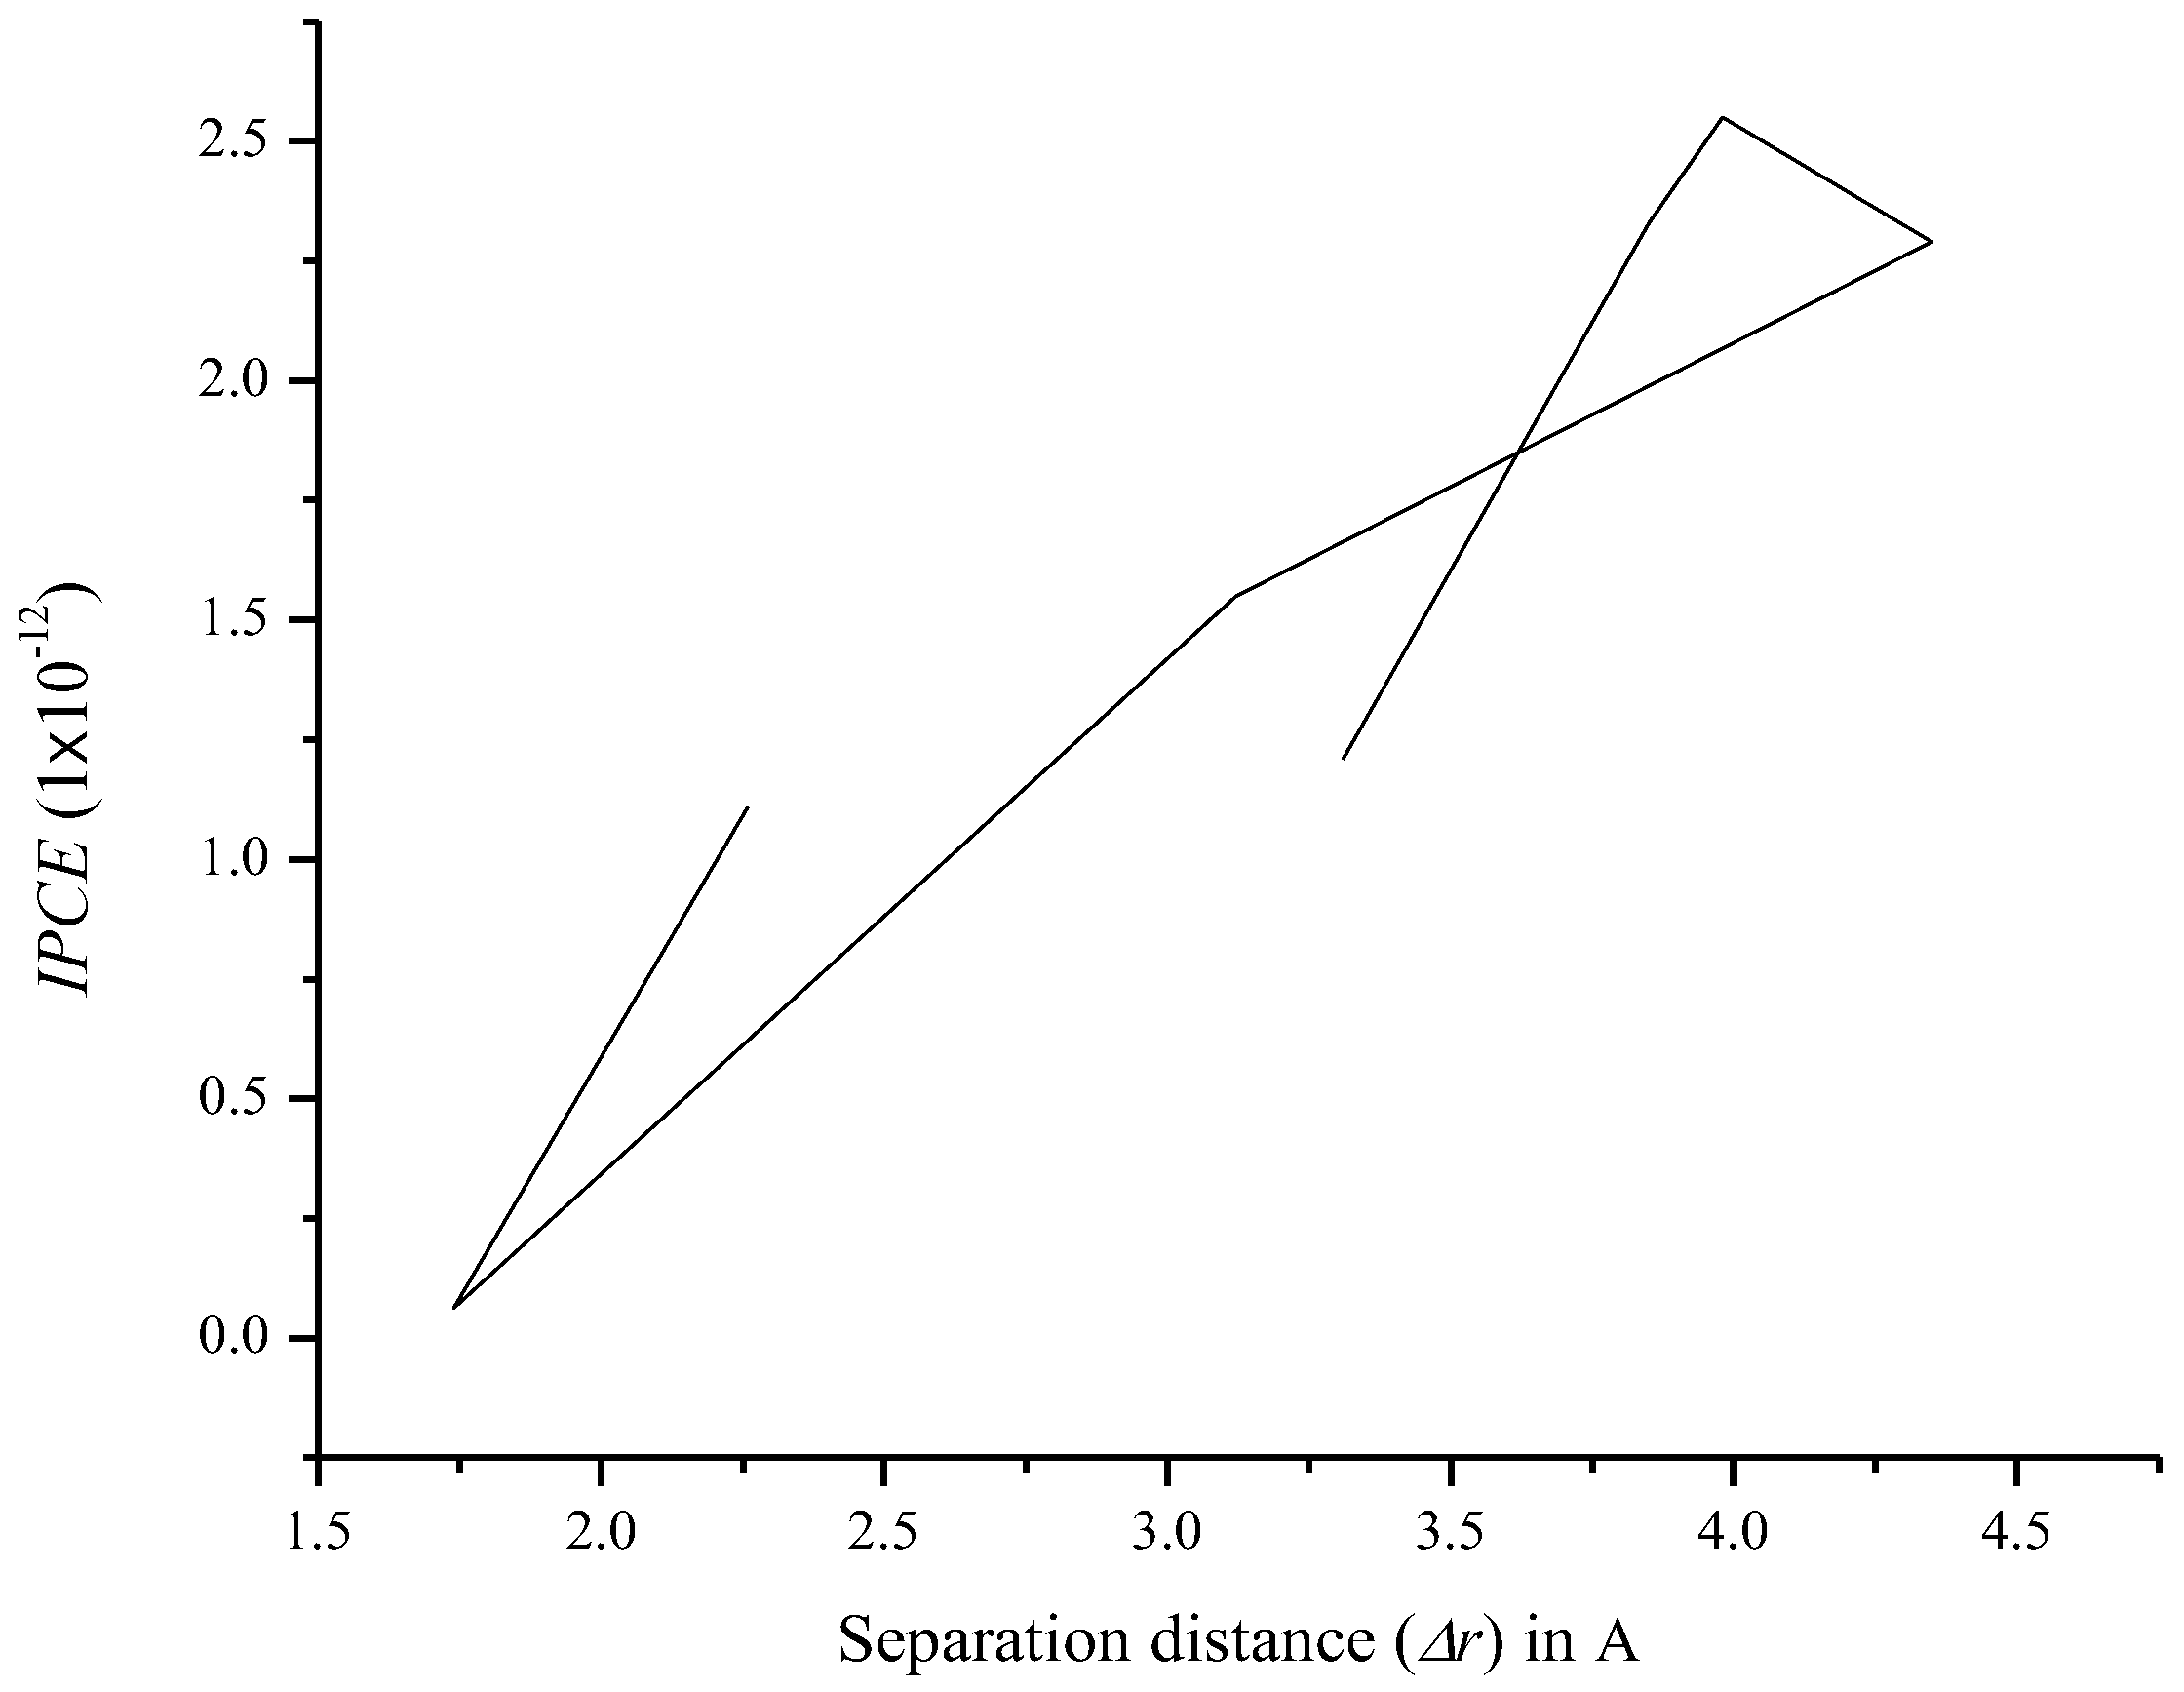
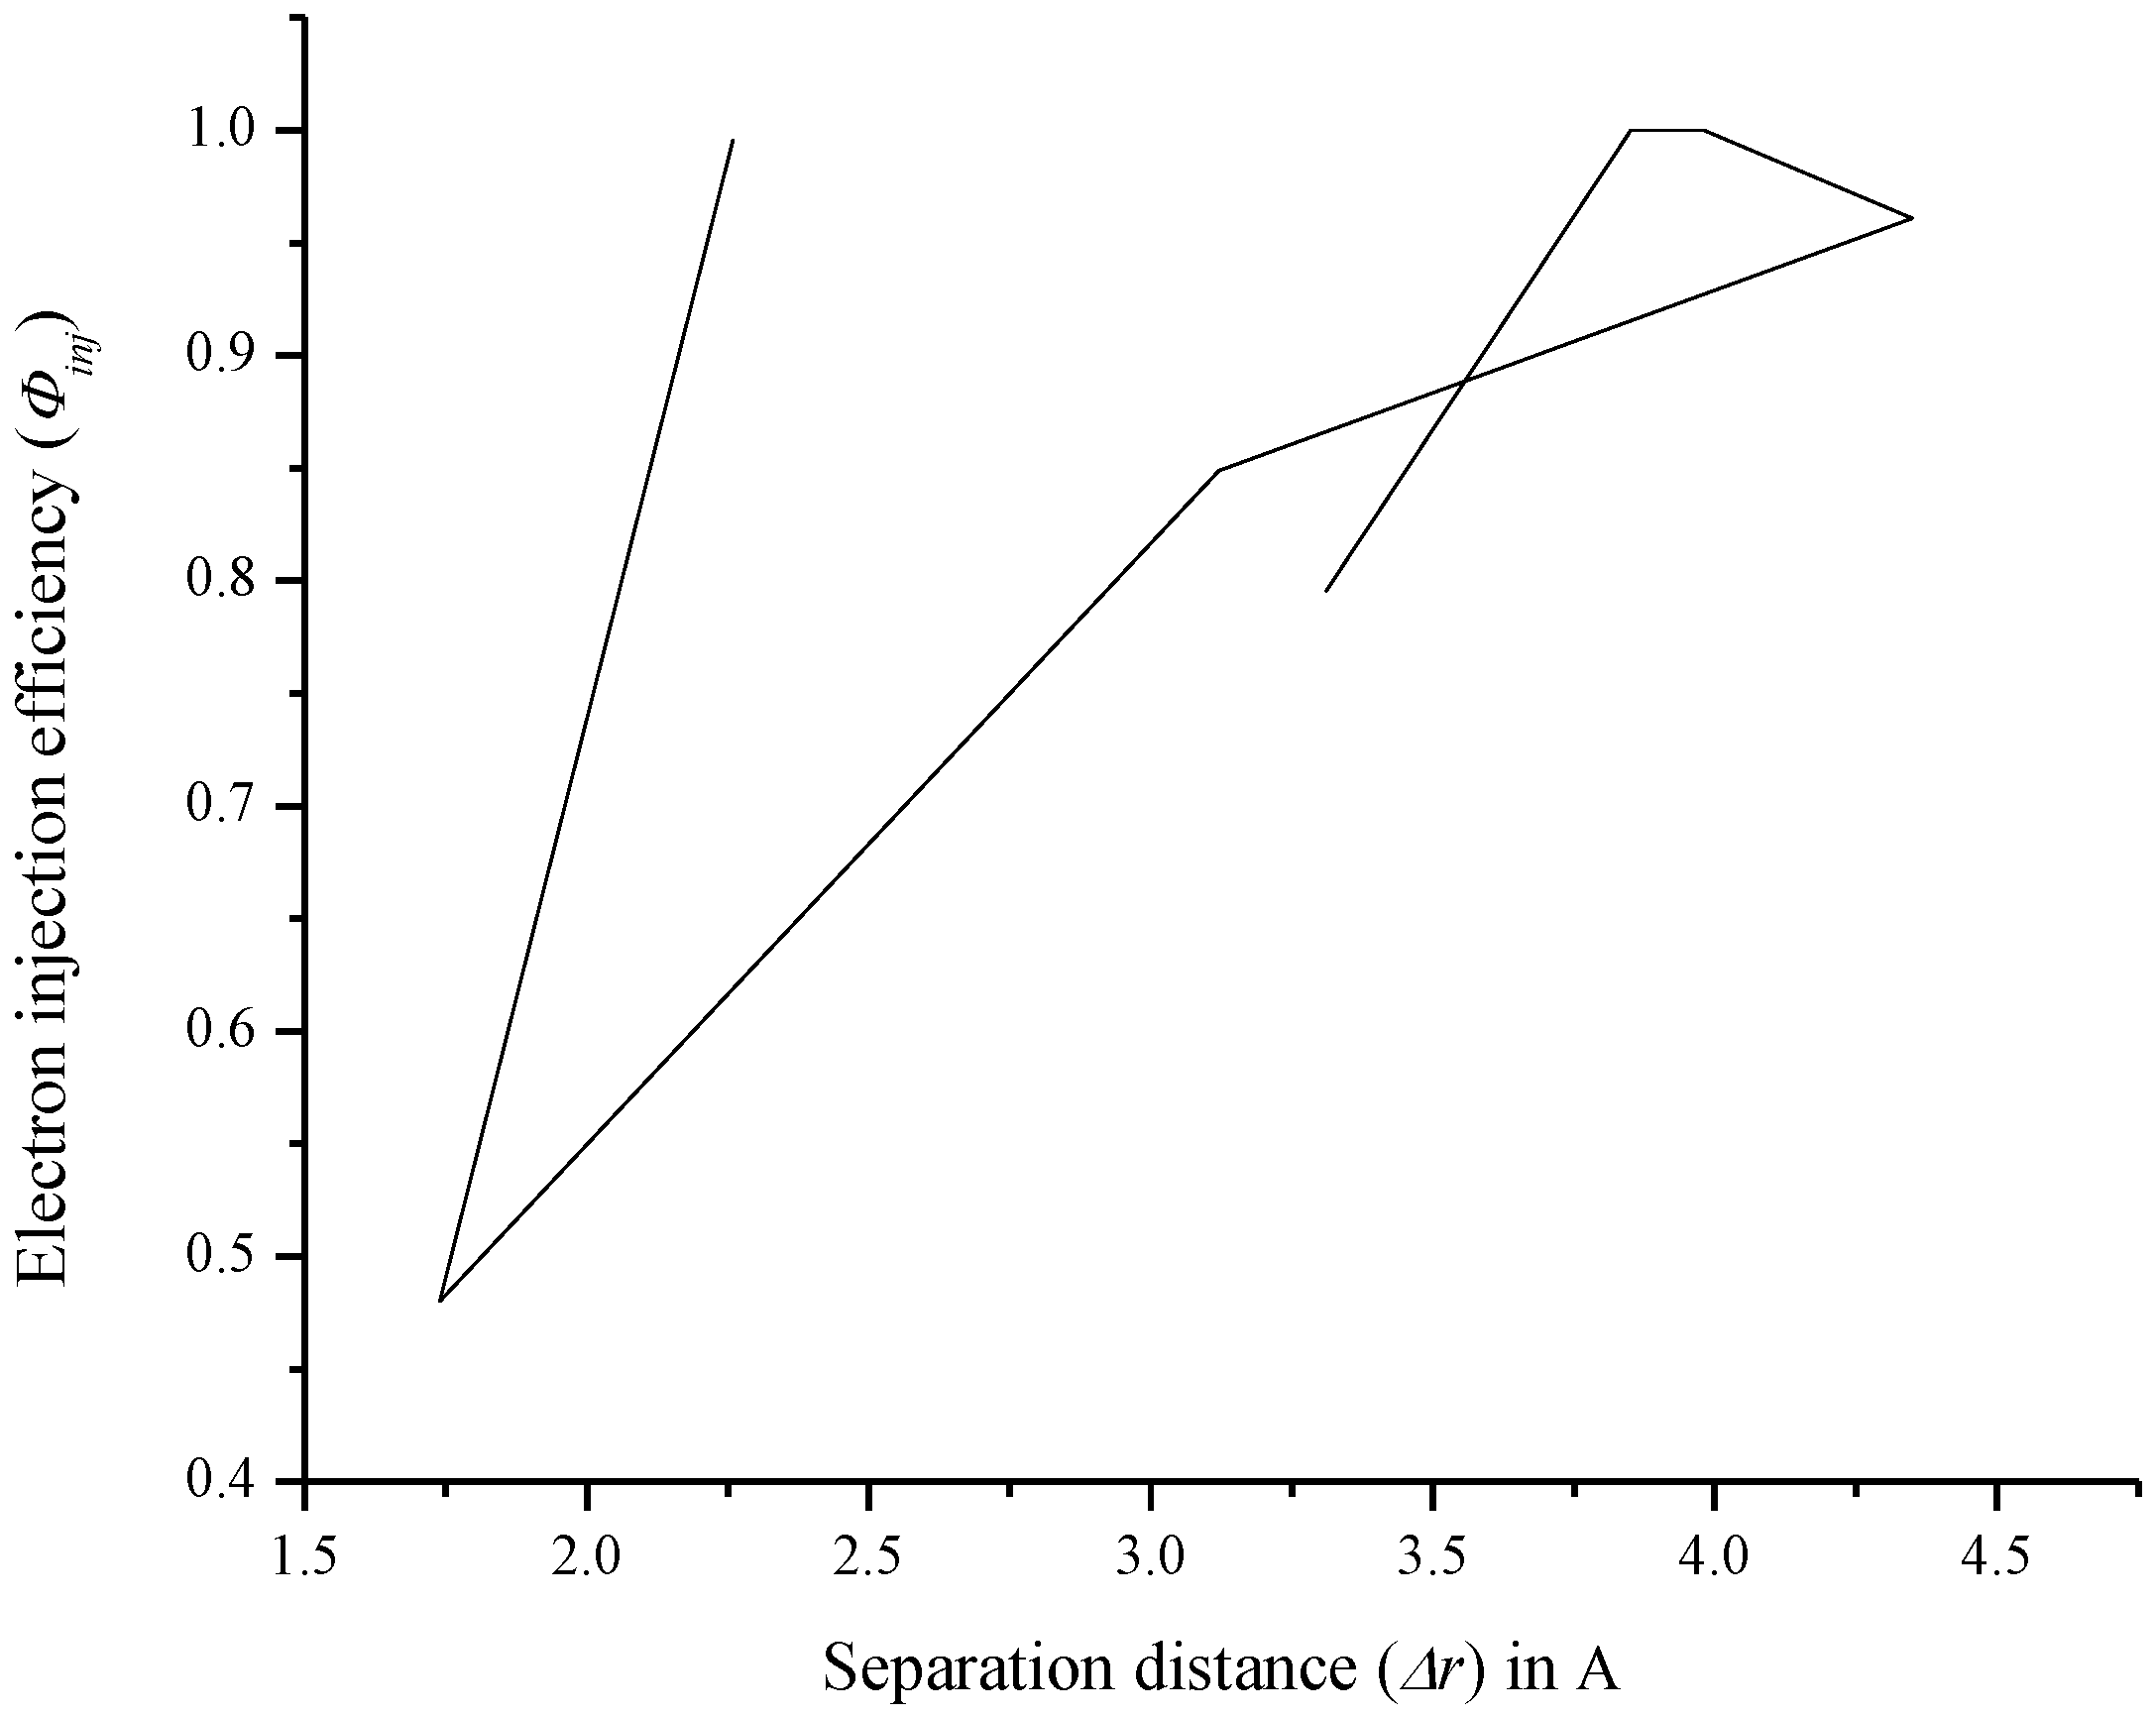
3.7. Relationship between Charge Separation Distance and Parameters Such as IPCE, Charge Regeneration, LHE, Electron Injection, and Charge Collection

We then tested whether there is a correlation between Δr and IPCE. It is expected that a large Δr will yield a high IPCE value. However, this relationship was spoiled by the outliers O2 and O4, which caused the graph to display the pattern in Figure 11.
As we expected a large Δr to regenerate the dye more easily, we also tested its relationship against Δ G d y e r e g e n . In this case, O3, O5, and O7 were the outliers, causing the graph to display the pattern in Figure 12.
Since the IPCE comprises LHE, Φinj, and ncollect, we also tested Δr against the latter three parameters. When we tested Δr against LHE, we observed that O3 and O4 were the outliers that caused the pattern that is displayed in Figure 13.
It is also expected that a larger Δr will inject more electrons into the semiconductor’s conduction band. The outliers O4 and O7 spoil this relationship, causing the pattern that is displayed in Figure 14.
The same correlation between Δr and ncollect was expected, but the outliers O3 and O7 spoiled this relationship and yielded the graph in Figure 15.

4. Conclusions

This study described the metal-free organic dye characteristics of compounds that contained 1,3,4-oxadiazole moieties. The compounds were constructed and optimized using DFT and TD-DFT methods. These moieties served as π-spacer units in each dye of dye-sensitized solar cells (DSSCs). Starburst, hydroxide, methoxy, amino, and triarylamine served as the donor groups, while cyano acrylic acid served as the acceptor group in all the compounds other than O7, where a cyano group served as the acceptor group. Comparison between IP and EA analyses showed consistent results throughout. When comparing EA to MEP analysis across the anchoring segments of the compounds, reasonable results were also observed. The probability of charge recombination was studied by analyzing electron–hole overlaps for specific atoms and fragments. In doing so, the charge-transfer lengths (Δr) were used as a chemical index that measures the separation distance between the electron and its corresponding hole. It was assumed that the largest Δr will cause the smallest degree of electron–hole overlap (Λ), leading to the lowest charge recombination. As Λ has shown to be an unreliable chemical index, this correlation was not observed. It was also expected that a large single point excitation energy would cause a large Δr. Other than a few outliers, this relationship was observed. It was then assumed that an increase in Δr will induce a high electron density around the anchoring groups. However, due to the relationship between electron contributions and Λ, this correlation did not hold well. Other than O6, all the compounds showed Δr values above the minimum value for charge transfer (CT) between their fragments, with O4 showing the largest Δr value. However, its anchoring groups contained lower electron densities than O6. The large Δr value in O4 also supports its large Δ G d y e r e g e n value, as the latter play a role in charge recombination. However, the small D-A dihedral angle within this compound may render it inefficient as a dye because intermolecular interactions can occur, leading to aggregation that results in less electrons being injected into the semiconductor’s conduction band. The bulky sizes of O6 and O7 cause slow diffusion constants (Dπ) for the movement of π-electrons, inducing low charge collection efficiencies (ncollect). As IPCE is the key determinant for any compound to be used as a dye, the large IPCE value observed in O3 indicates that it may serve as the best dye. Since we expected a larger Δr to produce a higher IPCE, this was observed in all the compounds except O2 and O4. Similar relationships between Δr and the parameters LHE, Φinj, and ncollect, which comprise the IPCE, were also observed in most of the compounds, apart from a few outliers. Although the M06-2X functional is highly reliable for investigating electronic excitation energies, this study has shown that it has some drawbacks. Nevertheless, this research shows the need for a comprehensive study of the effect of various DFT functionals and levels of theories on the trend between Δr and the selected parameters. This study serves as a valuable guide to select any compound from a range of compounds studied as a metal-free organic dye in dye-sensitized solar cells, from which the actual efficiencies can be obtained when studying the DSSC properties by performing TD-DFT calculations. However, when performing TD-DFT calculations on the compounds that form the DSSC, interactions between the dye, the semiconductor, and electrolyte will have to be considered.

Supplementary Materials

The following supporting information can be downloaded at: https://www.mdpi.com/article/10.3390/en15134913/s1, Figure S1: Optimization energies for the molecules obtained through DFT calculations. Figure S2: Computed IR spectra of 1,3,4-oxadiazoles. Figure S3: Electron excitation in each non-hydrogen atom of each molecule. Figure S4: Molecular structures of each molecule optimized through Gaussian analysis and obtained from Mercury 2020. Figure S5: Electron–hole contribution analyses of each non-hydrogen atom. Figure S6: Electron–hole overlap transition density matrix of each non-hydrogen atom within each compound. Table S1: Contribution of each selected non-hydrogen atom to holes and electrons within O1. Table S2: Contribution of each selected non-hydrogen atom to holes and electrons within O2. Table S3: Contribution of each selected non-hydrogen atom to holes and electrons within O3. Table S4: Contribution of each selected non-hydrogen atom to holes and electrons within O4. Table S5: Contribution of each selected non-hydrogen atom to holes and electrons within O5. Table S6: Contribution of each selected non-hydrogen atom to holes and electrons within O6. Table S7: Contribution of each selected non-hydrogen atom to holes and electrons within O7. Table S8: Cartesian coordinates of O1. Table S9: Cartesian coordinates of O2. Table S10: Cartesian coordinates of O3. Table S11: Cartesian coordinates of O4. Table S12: Cartesian coordinates of O5. Table S13: Cartesian coordinates of O6. Table S14: Cartesian coordinates of O7. References [52,53,54,55,56,57,58,59,60,61,62,63] are cited in the supplementary materials.

Author Contributions

L.-C.C.C.: writing original draft; A.S.A.: formal analysis, data curation; N.M.: formal analysis. All authors have read and agreed to the published version of the manuscript.

Funding

This research received no external funding.

Institutional Review Board Statement

Not applicable.

Informed Consent Statement

Not applicable.

Data Availability Statement

All data will be available if required.

Acknowledgments

The authors would like to acknowledge the Centre for High-Performance Computing (CHPC), South Africa for providing computational resources for this research project, University of South Africa (UNISA) and the University of Johannesburg (UJ) for their support, and the National Research Foundation (NRF) for funding.

Conflicts of Interest

The authors declare no competing interests.

References

  1. Abas, N.; Kalair, A.; Khan, N. Review of fossil fuels and future energy technologies. Futures 2015, 69, 31–49. [Google Scholar] [CrossRef]
  2. Robertson, N. Optimizing dyes for dye-sensitized solar cells. Angew. Chem. Int. Ed. 2006, 45, 2338–2345. [Google Scholar] [CrossRef] [PubMed]
  3. Tibebu, S.; Hailu, A. Design, Construction, and Evaluation of the Performance of Dual-Axis Sun Trucker Parabolic Solar Cooker and Comparison of Cooker. J. Renew. Energy 2021, 2021, 8944722. [Google Scholar] [CrossRef]
  4. Owusu, P.A.; Sarkodie, S.A. A review of renewable energy sources, sustainability issues and climate change mitigation. Cog. Eng. 2016, 3, 1167990. [Google Scholar] [CrossRef]
  5. Usman, Z.; Tah, J.; Abanda, H.; Nche, C. A critical appraisal of pv-systems’ performance. Buildings 2020, 10, 192. [Google Scholar] [CrossRef]
  6. Luceño-Sánchez, J.A.; Díez-Pascual, A.M.; Peña Capilla, R. Materials for photovoltaics: State of art and recent developments. Int. J. Mol. Sci. 2019, 20, 976. [Google Scholar] [CrossRef] [Green Version]
  7. Lee, J.K.; Yang, M. Progress in light harvesting and charge injection of dye-sensitized solar cells. Mat. Sci. Eng. B 2011, 176, 1142–1160. [Google Scholar] [CrossRef]
  8. Perera, I.R.; Hettiarachchi, C.V.; Ranatunga, R.J.K.U. Metal–organic frameworks in dye-sensitized solar cells. In Advances in Solar Energy Research; Springer: Singapore, 2019; pp. 175–219. [Google Scholar]
  9. Ahmad, S.; Liu, J.; Ji, W.; Sun, L. Metal–organic framework thin film-based dye sensitized solar cells with enhanced photocurrent. Materials 2018, 11, 1868. [Google Scholar] [CrossRef] [Green Version]
  10. Yildirim, O.; Bonomo, M.; Barbero, N.; Atzori, C.; Civalleri, B.; Bonino, F.; Viscardi, G.; Barolo, C. Application of metal-organic frameworks and covalent organic frameworks as (photo) active material in hybrid photovoltaic technologies. Energies 2020, 13, 5602. [Google Scholar] [CrossRef]
  11. He, Y.; Zhang, Z.; Wang, W.; Fu, L.J. Metal organic frameworks derived high performance photoanodes for DSSCs. J. Alloys Compd. 2020, 825, 154089. [Google Scholar] [CrossRef]
  12. Spoerke, E.D.; Small, L.J.; Foster, M.E.; Wheeler, J.; Ullman, A.M.; Stavila, V.; Rodriguez, M.; Allendorf, M.D. MOF-Sensitized Solar Cells Enabled by a Pillared Porphyrin Framework. J. Phys. Chem. C 2017, 121, 4816–4824. [Google Scholar] [CrossRef]
  13. Dou, J.; Li, Y.; Xie, F.; Ding, X.; Wei, M. Metal-Organic Framework Derived Hierarchical Porous Anatase TiO2 as a Photoanode for Dye-Sensitized Solar Cells. Cryst. Growth Des. 2016, 16, 121–125. [Google Scholar] [CrossRef]
  14. Khajavian, R.; Mirzaei, M.; Alizadeh, H. Current status and future prospects of metal–organic frameworks at the interface of dye-sensitized solar cells. Dalt. Trans. 2020, 49, 13936–13947. [Google Scholar] [CrossRef]
  15. Lee, C.P.; Li, C.T.; Ho, K.C. Use of organic materials in dye-sensitized solar cells. Mat. Tod. 2017, 20, 267–283. [Google Scholar] [CrossRef]
  16. Chauhan, R.; Kushwaha, R.; Bahadur, L. Study of Light Harvesting Properties of Different Classes of Metal-Free Organic Dyes in TiO2 Based Dye-Sensitized Solar Cells. J. Energy 2014, 2014, 517574. [Google Scholar] [CrossRef] [Green Version]
  17. Cao, D.; Peng, J.; Hong, Y.; Fang, X.; Wang, L.; Meier, H. Enhanced performance of the dye-sensitized solar cells with phenothiazine-based dyes containing double D−A branches. Org. Lett. 2011, 13, 1610–1613. [Google Scholar] [CrossRef] [PubMed]
  18. Manoharan, S.; Anandan, S. Cyanovinyl substituted benzimidazole based (D–π–A) organic dyes for fabrication of dye sensitized solar cells. Dyes Pigment. 2014, 105, 223–231. [Google Scholar] [CrossRef]
  19. Castillo-Vallés, M.; Andrés-Castán, J.M.; Garín, J.; Orduna, J.; Villacampa, B.; Franco, S.; Blesa, M.J. Dye-sensitized-solar-cells based on calix[4]arene scaffolds. RSC Adv. 2015, 5, 90667–90670. [Google Scholar] [CrossRef] [Green Version]
  20. Tan, L.L.; Liu, J.M.; Li, S.Y.; Xiao, L.M.; Kuang, D.B.; Su, C.Y. Dye-Sensitized Solar Cells with Improved Performance using Cone-Calix[4]Arene Based Dyes. ChemSusChem 2014, 8, 280–287. [Google Scholar] [CrossRef]
  21. Tan, L.L.; Huang, J.F.; Shen, Y.; Xiao, L.M.; Liu, J.M.; Kuang, D.B.; Su, C.Y. Highly efficient and stable organic sensitizers with duplex starburst triphenylamine and carbazole donors for liquid and quasi-solid-state dye-sensitized solar cells. J. Mat. Chem. A 2014, 2, 8988–8994. [Google Scholar] [CrossRef]
  22. Kungwan, N.; Khongpracha, P.; Namuangruk, S.; Meeprasert, J.; Chitpakdee, C.; Jungsuttiwong, S.; Promarak, V. Theoretical study of linker-type effect in carbazole–carbazole-based dyes on performances of dye-sensitized solar cells. Theor. Chem. Acc. 2014, 133, 1523. [Google Scholar] [CrossRef]
  23. Abdellah, I.M.; El-Shafei, A. Influence of carbonyl group on photocurrent density of novel fluorene based D-π-A photosensitizers: Synthesis, photophysical and photovoltaic studies. J. Photochem. Photobiol. A Chem. 2020, 387, 112133. [Google Scholar] [CrossRef]
  24. Gilbert, M.; Albinsson, B. Photoinduced charge and energy transfer in molecular wires. Chem. Soc. Rev. 2015, 44, 845–862. [Google Scholar] [CrossRef] [PubMed]
  25. Tang, J.; Hua, J.; Wu, W.; Li, J.; Jin, Z.; Long, Y.; Tian, H. New starburst sensitizer with carbazole antennas for efficient and stable dye-sensitized solar cells. Energy Environ. Sci. 2010, 3, 1736–1745. [Google Scholar] [CrossRef]
  26. Ning, Z.; Zhang, Q.; Wu, W.; Pei, H.; Liu, B.O.; Tian, H.E. Starburst triarylamine based dyes for efficient dye-sensitized solar cells. J. Org. Chem. 2008, 73, 3791–3797. [Google Scholar] [CrossRef]
  27. Naik, P.; Elmorsy, M.R.; Su, R.; Babu, D.D.; El-Shafei, A.; Adhikari, A.V. New carbazole based metal-free organic dyes with D-π-A-π-A architecture for DSSCs: Synthesis, theoretical and cell performance studies. Solar Energy 2017, 153, 600–610. [Google Scholar] [CrossRef]
  28. Naik, P.; Su, R.; Elmorsy, M.R.; El-Shafei, A.; Adhikari, A.V. New di-anchoring A-π-D-π-A configured organic chromophores for DSSC application: Sensitization and co-sensitization studies. Photochem. Photobiol. Sci. 2018, 17, 302–314. [Google Scholar] [CrossRef]
  29. Sharma, K.; Sharma, V.; Sharma, S.S. Dye-sensitized solar cells: Fundamentals and current status. Nanoscale Res. Lett. 2018, 13, 381. [Google Scholar] [CrossRef]
  30. Zarate, X.; Schott-Verdugo, S.; Rodriguez-Serrano, A.; Schott, E. The nature of the donor motif in acceptor-bridge-donor dyes as an influence in the electron photo-injection mechanism in DSSCs. J. Phys. Chem. A 2016, 120, 1613–1624. [Google Scholar] [CrossRef]
  31. Koyama, Y.; Miki, T.; Wang, X.F.; Nagae, H. Dye-sensitized solar cells based on the principles and materials of photosynthesis: Mechanisms of suppression and enhancement of photocurrent and conversion efficiency. Int. J. Mol. Sci. 2009, 10, 4575–4622. [Google Scholar] [CrossRef] [Green Version]
  32. Sanusi, K.; Fatomi, N.O.; Borisade, A.O.; Tilmaz, Y.; Ceylan, U.; Fashima, A. An approximate procedure for profiling dye molecules with potentials as sensitizers in solar cell application: A DFT/TD-DFT approach. Chem. Phys. Lett. 2019, 1–7. [Google Scholar] [CrossRef]
  33. Hamann, T.W.; Martinson, A.B.; Elam, J.W.; Pellin, M.J.; Hupp, J.T. Atomic layer deposition of TiO2 on aerogel templates: New photoanodes for dye-sensitized solar cells. J. Phys. Chem. C 2008, 112, 10303–10307. [Google Scholar] [CrossRef]
  34. Mehmood, U.; Hussein, I.A.; Daud, M. New 1,3,4-Oxadiazole Based Photosensitizers for Dye Sensitized Solar Cells. Int. J. Photoen. 2015, 2015, 637652. [Google Scholar] [CrossRef]
  35. Srinivas, K.; Sivakumar, G.; Chitumalla, R.K.; Reddy, M.A.; Bhanuprakash, K.; Vaidya, J.R.; Chen, C.W.; Hsu, Y.C.; Lin, J.T. Novel 1, 3, 4-oxadiazole derivatives as efficient sensitizers for dye-sensitized solar cells: A combined experimental and computational study. Synth. Met. 2011, 161, 1671–1681. [Google Scholar] [CrossRef]
  36. Singh, A.; Kociok-Köhn, G.; Trivedi, M.; Chauhan, R.; Kumar, A.; Gosavi, S.W.; Terashima, C.; Kujishima, A.N.J. Ferrocenylethenyl-substituted oxadiazoles with phenolic and nitro anchors as sensitizers in dye sensitized solar cells. New J. Chem. 2019, 43, 4745–4756. [Google Scholar] [CrossRef]
  37. Paun, A.; Hadade, N.D.; Paraschivescu, C.C.; Matache, M. 1,3,4-Oxadiazoles as luminescent materials for organic light emitting diodes via cross-coupling reactions. J. Mat. Chem. C 2016, 4, 8596–8610. [Google Scholar] [CrossRef]
  38. Friesh, M.J.; Truks, G.; Schlegel, H.; Scuseria, G.; Robb, M.; Cheeseman, J.; Scalmani, G.; Barone, V.; Mennucci, B.; Pettersson, G. Gaussian 09; Revision D.01; Gaussian Inc.: Wallingford, CT, USA, 2009. [Google Scholar]
  39. Zhao, Y.; Truhlar, D.G. The M06 suite of density functionals for main group thermochemistry, thermochemical kinetics, noncovalent interactions, excited states, and transition elements: Two new functionals and systematic testing of four M06-class functionals and 12 other functionals. Theor. Chem. Acc. 2008, 120, 215–241. [Google Scholar]
  40. Zhao, Y.; Truhlar, D.G. Density functionals with broad applicability in chemistry. Account. Chem. Res. 2008, 41, 157–167. [Google Scholar] [CrossRef]
  41. Lu, T.; Chen, F. Atomic dipole moment corrected Hirshfeld population method. J. Theor. Comput. Chem. 2012, 11, 163–183. [Google Scholar] [CrossRef]
  42. Ning, Z.; Zhang, Q.; Pei, H.; Luan, J.; Lu, C.; Cui, Y.; Tian, H. Photovoltage improvement for dye-sensitized solar cells via cone-shaped structural design. J. Phys. Chem. C 2009, 113, 10307–10313. [Google Scholar] [CrossRef]
  43. Mubashar, U.; Farhat, A.; Khera, R.A.; Iqbal, N.; Saleem, R.; Iqbal, J. Designing and theoretical study of fluorinated small molecule donor materials for organic solar cells. J. Mol. Model. 2021, 27, 216. [Google Scholar] [CrossRef] [PubMed]
  44. Mathiyalagan, A.; Manimaran, K.; Muhu, K.; Rajakantham, M. Density functional theory study on the electronic structures and spectral properties of 3,5-Dimethylanisole dye sensitizer for solar cell applications. Res. Chem. 2021, 3, 1–38. [Google Scholar] [CrossRef]
  45. Bulat, F.A.; Murray, J.S.; Politzer, P. Identifying the most energetic electrons in a molecule: The highest occupied molecular orbital and the average local ionization energy. Comp. Theory Chem. 2021, 1199, 1–6. [Google Scholar] [CrossRef]
  46. Coetzee, L.C.C.; Muller, A.J.; Adeyinka, A.S.; Sonopo, M.S.; Williams, D.B.G. Synthesis, characterisation and DFT studies of [3, 5-bis (2-hydroxyphenyl)-1H-1, 2, 4-triazol-1-yl](phenyl) methanone derivatives. Results Chem. 2021, 3, 100165. [Google Scholar] [CrossRef]
  47. Wang, H.; Liu, Q.; Liu, D.; Su, R.; Liu, J.; Li, Y. Computational Prediction of Electronic and Photovoltaic Properties of Anthracene-Based Organic Dyes for Dye-Sensitized Solar Cells. Int. J. Photoen. 2018, 2018, 4764830. [Google Scholar] [CrossRef] [Green Version]
  48. Sharmoukh, W.; Cong, J.; Ali, B.A.; Alam, N.K.; Kloo, L. Comparison between Benzothiadizole–Thiophene- and Benzothiadizole–Furan-Based D–A−π–A Dyes Applied in Dye-Sensitized Solar Cells: Experimental and Theoretical Insights. ACS Omega 2020, 5, 16856–16864. [Google Scholar] [CrossRef]
  49. Guido, C.A.; Cortona, P.; Mennucci, B.; Adamo, C. On the Metric of Charge Transfer Molecular Excitations: A Simple Chemical Descriptor. J. Chem. Theory Comput. 2013, 9, 3118–31141. [Google Scholar] [CrossRef]
  50. le Bahers, T.; Adamo, C.; Ciofini, I. A Qualitative Index of Spatial Extent in Charge-Transfer Excitations. J. Chem. Theory Comput. 2011, 7, 2498–2506. [Google Scholar] [CrossRef]
  51. Tretiak, S.; Mukamel, S. Density Matrix Analysis and Simulation of Electronic Excitations in Conjugated and Aggregated Molecules. Chem. Rev. 2002, 102, 3171–3212. [Google Scholar] [CrossRef]
  52. Preat, J.; Jacquemin, D.; Michaux, C.; Perpète, E.A. Improvement of the efficiency of thiophene-bridged compounds for dye-sensitized solar cells. Chem. Phys. 2010, 376, 56–68. [Google Scholar] [CrossRef]
  53. Kurumisawa, Y.; Higashino, T.; Nimura, S.; Tsuji, Y.; Liyama, H.; Imahori, H. Renaissance of fused porphyrins: Substituted methylene-bridged thiophene-fused strategy for high-performance dye-sensitized solar cells. J. Am. Chem. Soc. 2019, 141, 9910–9919. [Google Scholar] [CrossRef] [PubMed]
  54. Arrechea, S.; Clifford, J.N.; Pelleja, L.; Aljarilla, A.; de la Cruz, P.; Palomares, E.; Langa, F. Charge recombination losses in thiophene-substituted porphyrin dye-sensitized solar cells. Dye. Pigment. 2016, 126, 147–153. [Google Scholar] [CrossRef]
  55. Samae, R.; Surawatanawong, P.; Eiamprasert, U.; Pramjit, S.; Saengdee, L.; Tangboriboonrat, P.; Kiatisevi, S. Effect of Thiophene Spacer Position in Carbazole-Based Dye-Sensitized Solar Cells on Photophysical, Electrochemical and Photovoltaic Properties. Eur. J. Chem. 2016, 21, 3536–3549. [Google Scholar] [CrossRef]
  56. Gao, P.; Tsao, H.N.; Grätzel, M.; Nazeeruddin, M.K. Fine-tuning the electronic structure of organic dyes for dye-sensitized solar cells. Org. Lett. 2012, 14, 4330–4333. [Google Scholar] [CrossRef] [PubMed] [Green Version]
  57. Mu, Y.; Wu, H.; Dong, G.; Shen, Z.; Li, S.; Zhang, M. Benzothiadiazole–ethynylthiophenezoic acid as an acceptor of photosensitizer for efficient organic dye-sensitized solar cells. J. Mater. Chem. A 2018, 6, 21493–21500. [Google Scholar] [CrossRef]
  58. Wu, Z.; Li, X.; Agren, H.; Hua, J.; Tian, H. Pyrimidine-2-carboxylic acid as an electron-accepting and anchoring group for dye-sensitized solar cells. Appl. Mater. Interfac. 2015, 7, 26355–26359. [Google Scholar] [CrossRef]
  59. Zhang, L.; Cole, J.M.; Waddell, P.G.; Low, K.S.; Liu, X. Relating Electron Donor and Carboxylic Acid Anchoring Substitution Effects in Azo Dyes to Dye-Sensitized Solar Cell Performance. ACS Sustain. Chem. Eng. 2013, 1, 1440–1452. [Google Scholar] [CrossRef]
  60. Cecconi, B.; Mordini, A.; Reginato, G.; Zani, L.; Taddei, M.; de Biani, F.F.; de Angelis, F.; Marotta, G.; Salvatori, P.; Calamante, M. Pyridine-N-Oxide 2-Carboxylic Acid: An Acceptor Group for Organic Sensitizers with Enhanced Anchoring Stability in Dye-Sensitized Solar Cells. Asian J. Org. Chem. 2014, 3, 140–152. [Google Scholar] [CrossRef]
  61. Ganesan, P.; Chandiran, A.; Gao, P.; Rajalingam, R.; Grätzel, M.; Nazeeruddin, M.K. Molecular engineering of 2-quinolinone based anchoring groups for dye-sensitized solar cells. J. Phys. Chem. C 2014, 118, 16896–16903. [Google Scholar] [CrossRef]
  62. Ompang, D.; Singh, J. Diffusion length and Langevin recombination of singlet and triplet excitons in organic heterojunction solar cells. Chem. Phys. Chem. 2015, 16, 1281–1285. [Google Scholar] [CrossRef]
  63. Pivrikas, A.; Juška, G.; Österbacka, R.; Westerling, M.; Viliūnas, M.; Arlauskas, K.; Stubb, H. Langevin recombination and space-charge-perturbed current transients in regiorandom poly(3-hexylthiophene). Phys. Rev. B 2005, 71, 125205. [Google Scholar] [CrossRef]
Figure 1. Mechanism for the excitation of photoelectrons within a metal-free organic dye and the regeneration of these photoelectrons back into the dye within a DSSC.
Energies 15 04913 g001
Figure 2. 1,3,4-oxadiazoles containing compounds that were evaluated for metal-free organic dyes through TD-DFT calculations.
Energies 15 04913 g002aEnergies 15 04913 g002b
Figure 3. Relationship between ionization potential and electron affinity for the 1,3,4-oxadiazole compounds.
Energies 15 04913 g003
Figure 4. Electron–hole overlaps for each fragment within each molecule.
Energies 15 04913 g004
Figure 5. Electron–hole contribution to each fragment within each compound.
Energies 15 04913 g005aEnergies 15 04913 g005b
Figure 6. The highest occupied molecular orbitals of molecules in their respective ground states and lowest unoccupied molecular orbitals of molecules in their respective excited states.
Energies 15 04913 g006aEnergies 15 04913 g006bEnergies 15 04913 g006c
Figure 7. Graphical relationship between electron–hole separation distance and degree of electron–hole overlaps for the orbital pair within each compound.
Energies 15 04913 g007
Figure 8. Graphical relationship between single point energy and electron−hole separation distance for the orbital pair within each compound.
Energies 15 04913 g008
Figure 9. Electron–hole separation distance vs % electron contribution to anchoring groups within each compound.
Energies 15 04913 g009
Figure 10. Transition density matrix of molecules demonstrating electron distribution from donor core to acceptor moieties.
Energies 15 04913 g010aEnergies 15 04913 g010b
Figure 11. Graphical relationship between electron−hole separation distance and incident photon transfer efficiency.
Energies 15 04913 g011
Figure 12. Graphical relationship between electron–hole separation distance and dye regeneration.
Energies 15 04913 g012
Figure 13. Graphical relationship between electron−hole separation distance and light-harvesting efficiency.
Energies 15 04913 g013
Figure 14. Graphical relationship between electron–hole separation distance and electron injection efficiency.
Energies 15 04913 g014
Figure 15. Graphical relationship between electron−hole separation distance and charge collection efficiency.
Energies 15 04913 g015
Table 1. Electron excitation parameters of each molecule.
CompoundHOMO (eV)LUMO (eV)E(LUMO-HOMO) (eV)Eb (eV)E(S1-S0)
(eV)
μ (Debye)fεabs
(L·mol−1·cm−1)
λmax (nm)IP
(eV)
EA
(eV)
O1−6.95−2.594.363.720.647.480.54527,6923376.692.00
O2−7.37−2.155.224.500.722.811.03041,6493567.451.49
O3−7.23−2.175.064.170.895.730.85334,5053607.750.48
O4−7.59−2.125.474.231.230.910.67528,4043257.631.44
O5−7.39−2.454.943.371.576.660.78237,2783255.524.17
O6−6.69−2.953.743.430.313.180.04235224295.284.26
O7−7.06−2.584.484.65−0.175.120.38015,4704964.655.00
Table 2. Electronegativities on the anchoring segments obtained through molecular electrostatic potentials (−1 × 10³).
Atoms
CompoundN15O17O18N25N27N28O27O28O29O30O31N53N182O184O185
O1235349414
O2 246 364362
O3 251 308411
O4 229 327400
O5233341402
O6 206288412
O7 86.6
Table 3. Photovoltaic parameters of compounds that were tested as organic dyes.
Compoundrdye (m)
(1 × 10⁻⁷)
Dπ
(1 × 10⁻¹¹)
δpncollect
(1 × 10⁻¹²)
LHEt (s)
(1 × 10−38)
ΦinjIPCE
(1 × 10⁻¹²)
Δ G d y e r e g e n   ( eV )
O11.626.73−6.081.680.7150.2120.7951.212.35
O21.159.51−5.642.990.9070.1201.002.332.77
O31.169.47−5.662.960.8600.1481.002.552.63
O41.159.51−5.613.020.7890.1540.9612.292.99
O51.417.73−5.941.510.8350.1360.8491.552.79
O61.895.76−6.441.390.09224.560.4800.06152.09
O71.547.07−6.071.920.5830.6330.9961.112.46
Table 4. Fragment contribution to electron–hole overlap in O1.
FragmentHole (%)Electron (%)Overlap (%)Difference (%)
Donor1.380.260.60−1.12
π-spacer75.5239.8454.85−35.68
Acceptor23.3859.9037.4236.52
Table 5. Fragment contribution to electron–hole overlap in O2.
FragmentHole (%)Electron (%)Overlap (%)Difference (%)
Donor1.180.190.47−0.99
π-spacer86.0456.9169.98−29.12
Acceptor12.7942.9023.4230.12
Table 6. Fragment contribution to electron–hole overlap in O3.
FragmentHole (%)Electron (%)Overlap (%)Difference (%)
Donor2.580.230.77−2.36
π-spacer80.6658.7068.81−21.97
Acceptor16.3240.8925.8324.57
Table 7. Fragment contribution to electron–hole overlap in O4.
FragmentHole (%)Electron (%)Overlap (%)Difference (%)
Donor1.320.100.35−1.23
π-spacer85.2947.4163.59−37.88
Acceptor13.3952.5026.5139.11
Table 8. Fragment contribution to electron–hole overlap in O5.
FragmentHole (%)Electron (%)Overlap (%)Difference (%)
Donor3.440.871.74−2.57
π-spacer74.7748.7160.35−26.07
Acceptor21.7850.4233.1428.64
Table 9. Fragment contribution to electron–hole overlap in O6.
FragmentHole (%)Electron (%)Overlap (%)Difference (%)
Donor12.71−0.050.00−12.75
π-spacer60.429.3823.80−51.05
Acceptor26.8790.6749.3663.80
Table 10. Fragment contribution to electron–hole overlap in O7.
FragmentHole (%)Electron (%)Overlap (%)Difference (%)
Donor4.711.272.45−3.44
π-spacer71.8452.2461.26−19.60
Acceptor23.4546.4933.0223.04
Table 11. Charge-transfer lengths (Δr) for the first excited state within each compound.
CompoundΔr (Å)Orbital Pair
O13.31242 → 251
O23.8587 → 88
O33.9891 → 92
O44.3587 → 88
O53.12159 → 165
3.38161 → 165
O61.74402 → 404
O72.26213 → 217
2.89216 → 217
Table 12. Degree of electron–hole overlap (Λ) for the first excited state within each compound.
CompoundΛOrbital Pair
O10.324242 → 251
O20.50687 → 88
O30.47191 → 92
O40.28087 → 88
O50.150159 → 165
0.118161 → 165
O60.0476367 → 404
O70.271213 → 217
0.143216 → 217
Table 13. Intra-fragment charge transfer and dihedral angles between fragments within compounds.
IFCTDihedral Angles (°)
Compound(D-π-A)(D-π)(π-A)(D-A)
O10.3592386.0454.2581.91
O20.2963418.0610.0210.93
O30.2340189.97089.97
O40.3842614.6414.358.74
O50.2709188.3553.6886.59
O60.5226783.1186.0764.25
O70.2114565.7440.1037.49
Publisher’s Note: MDPI stays neutral with regard to jurisdictional claims in published maps and institutional affiliations.

