
Numerical Modeling of Horizontal Axis Wind Turbine: Aerodynamic Performances Improvement Using an Efficient Passive Flow Control System


Abstract
:1. Introduction
2. Methodology
2.1. Experimental Data
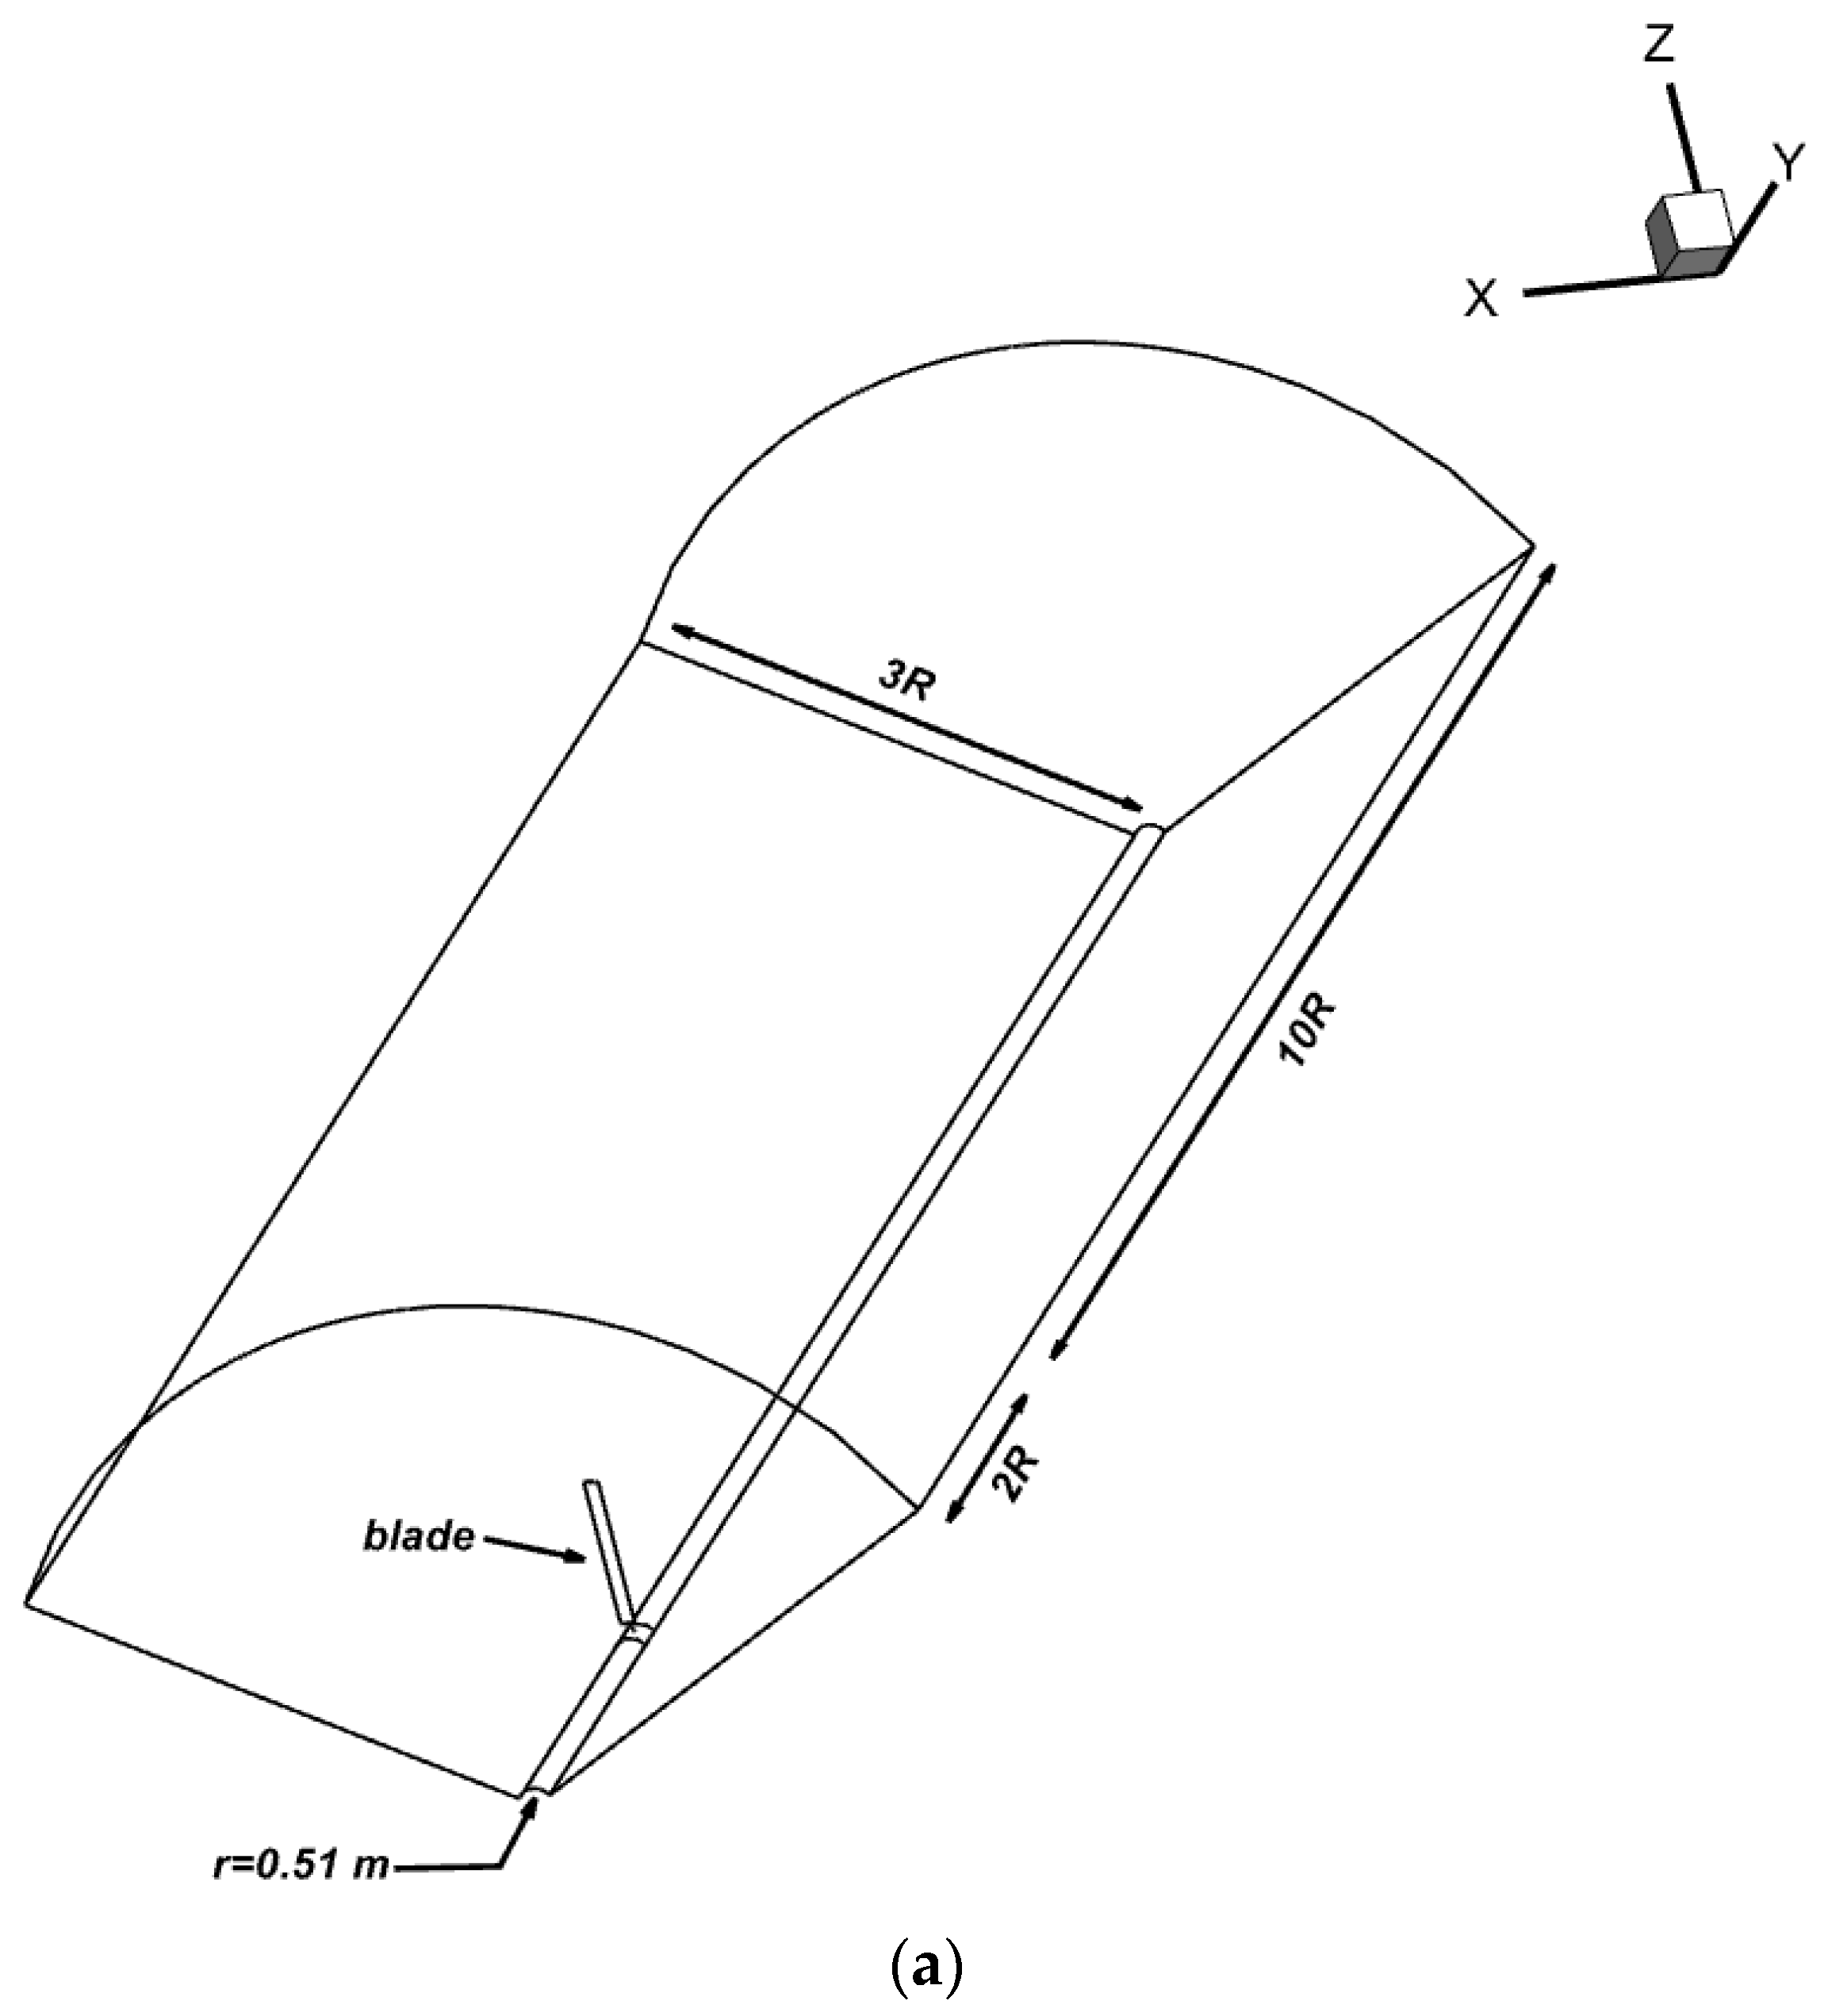
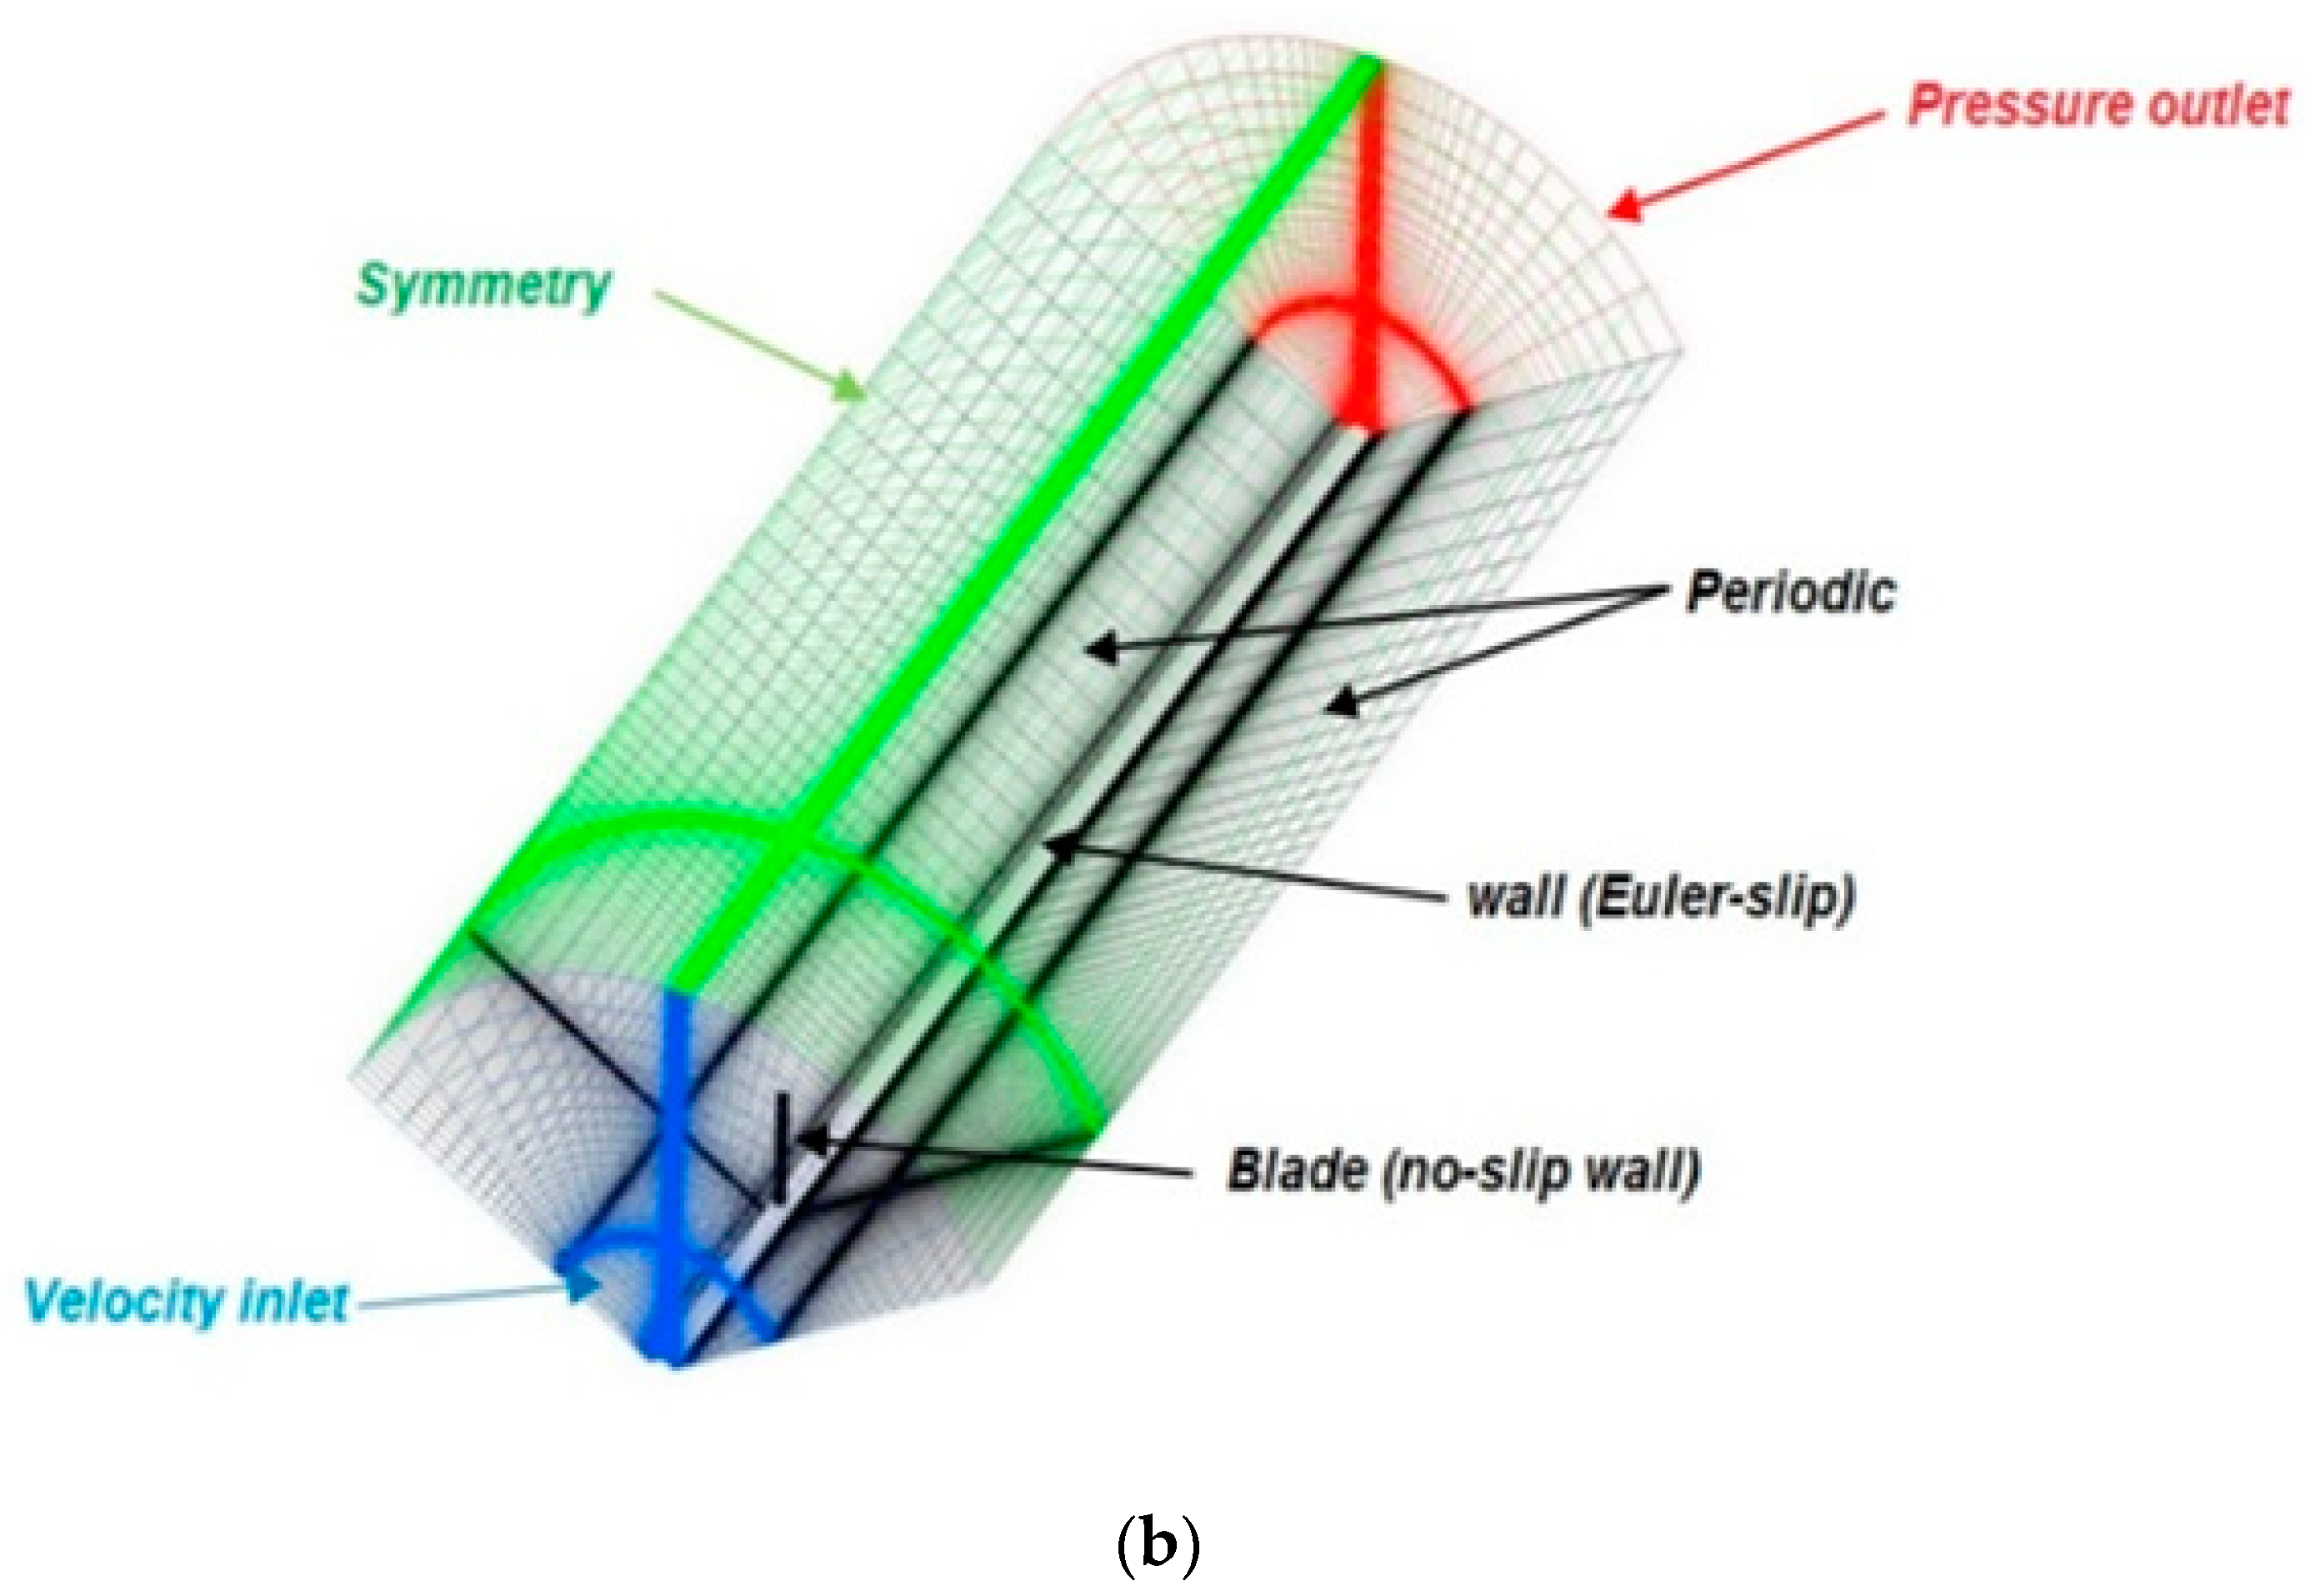
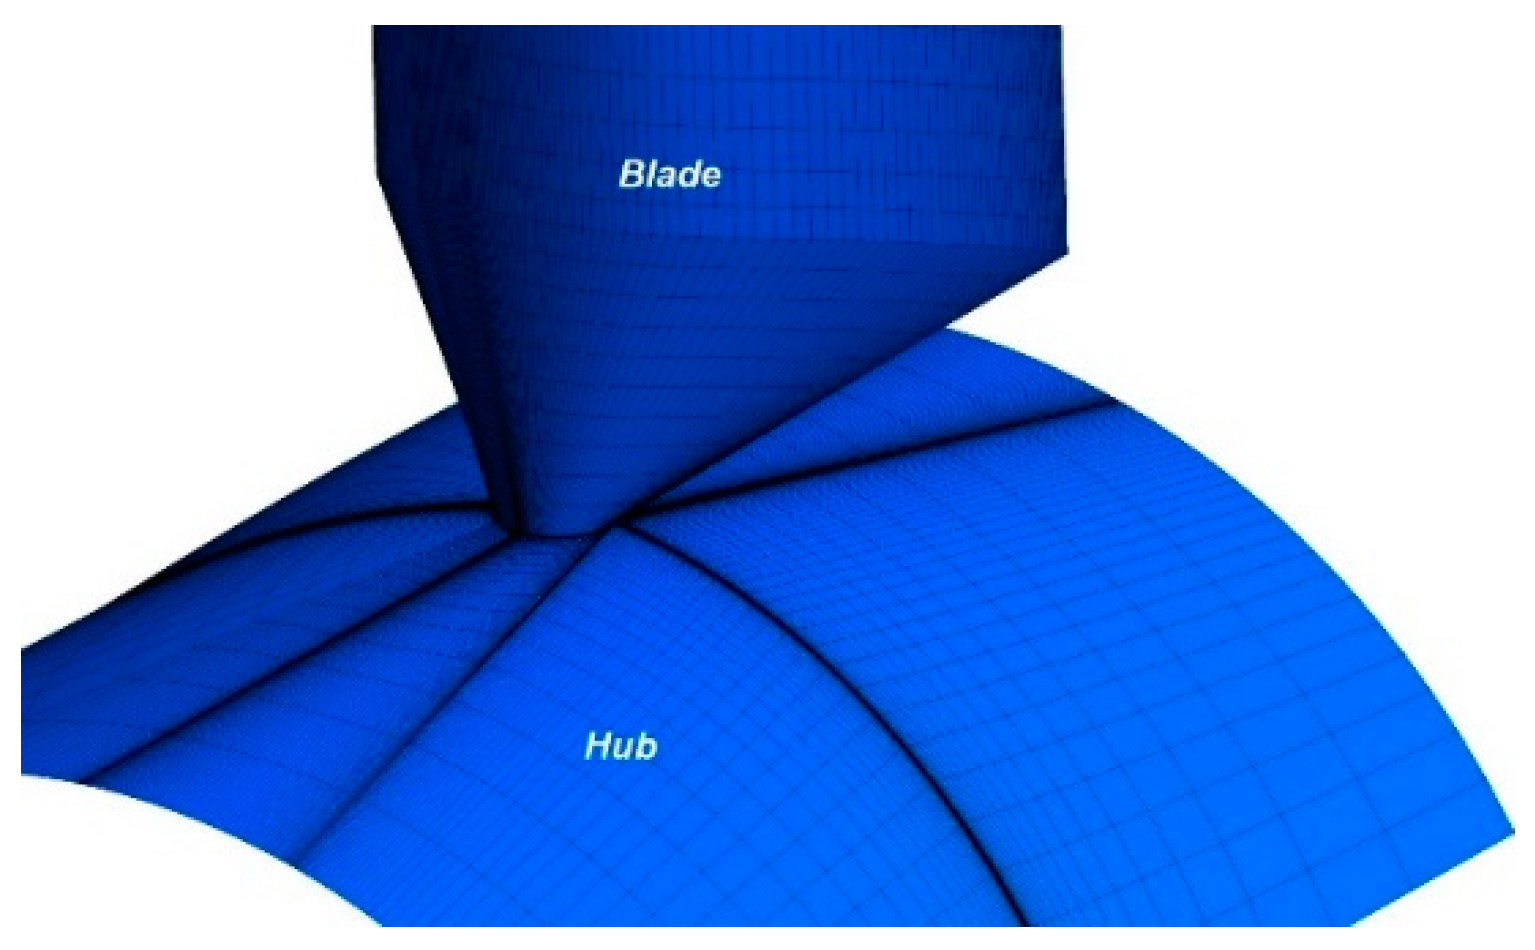
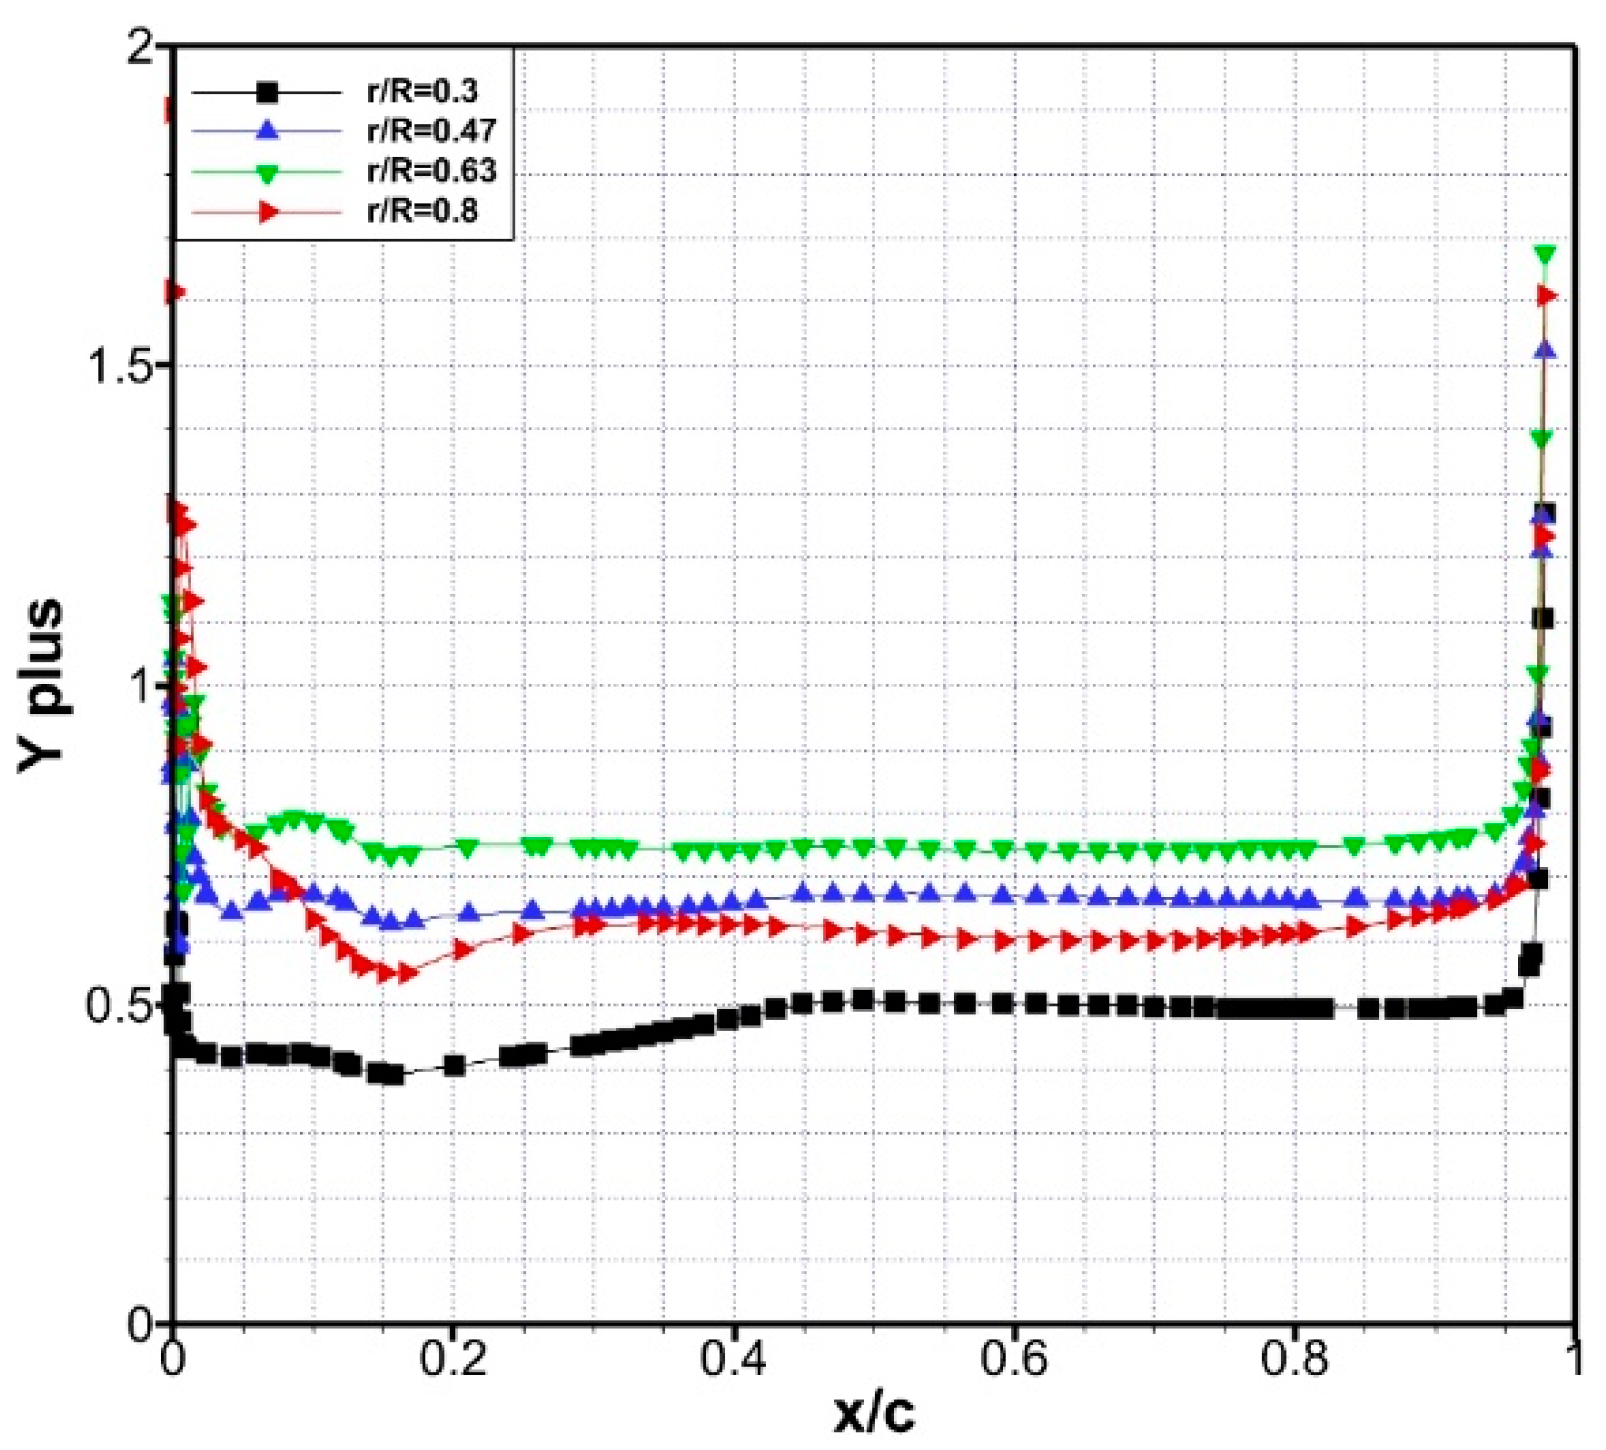
2.2. Boundary Conditions and Computational Mesh
2.3. Numerical Method
3. Results
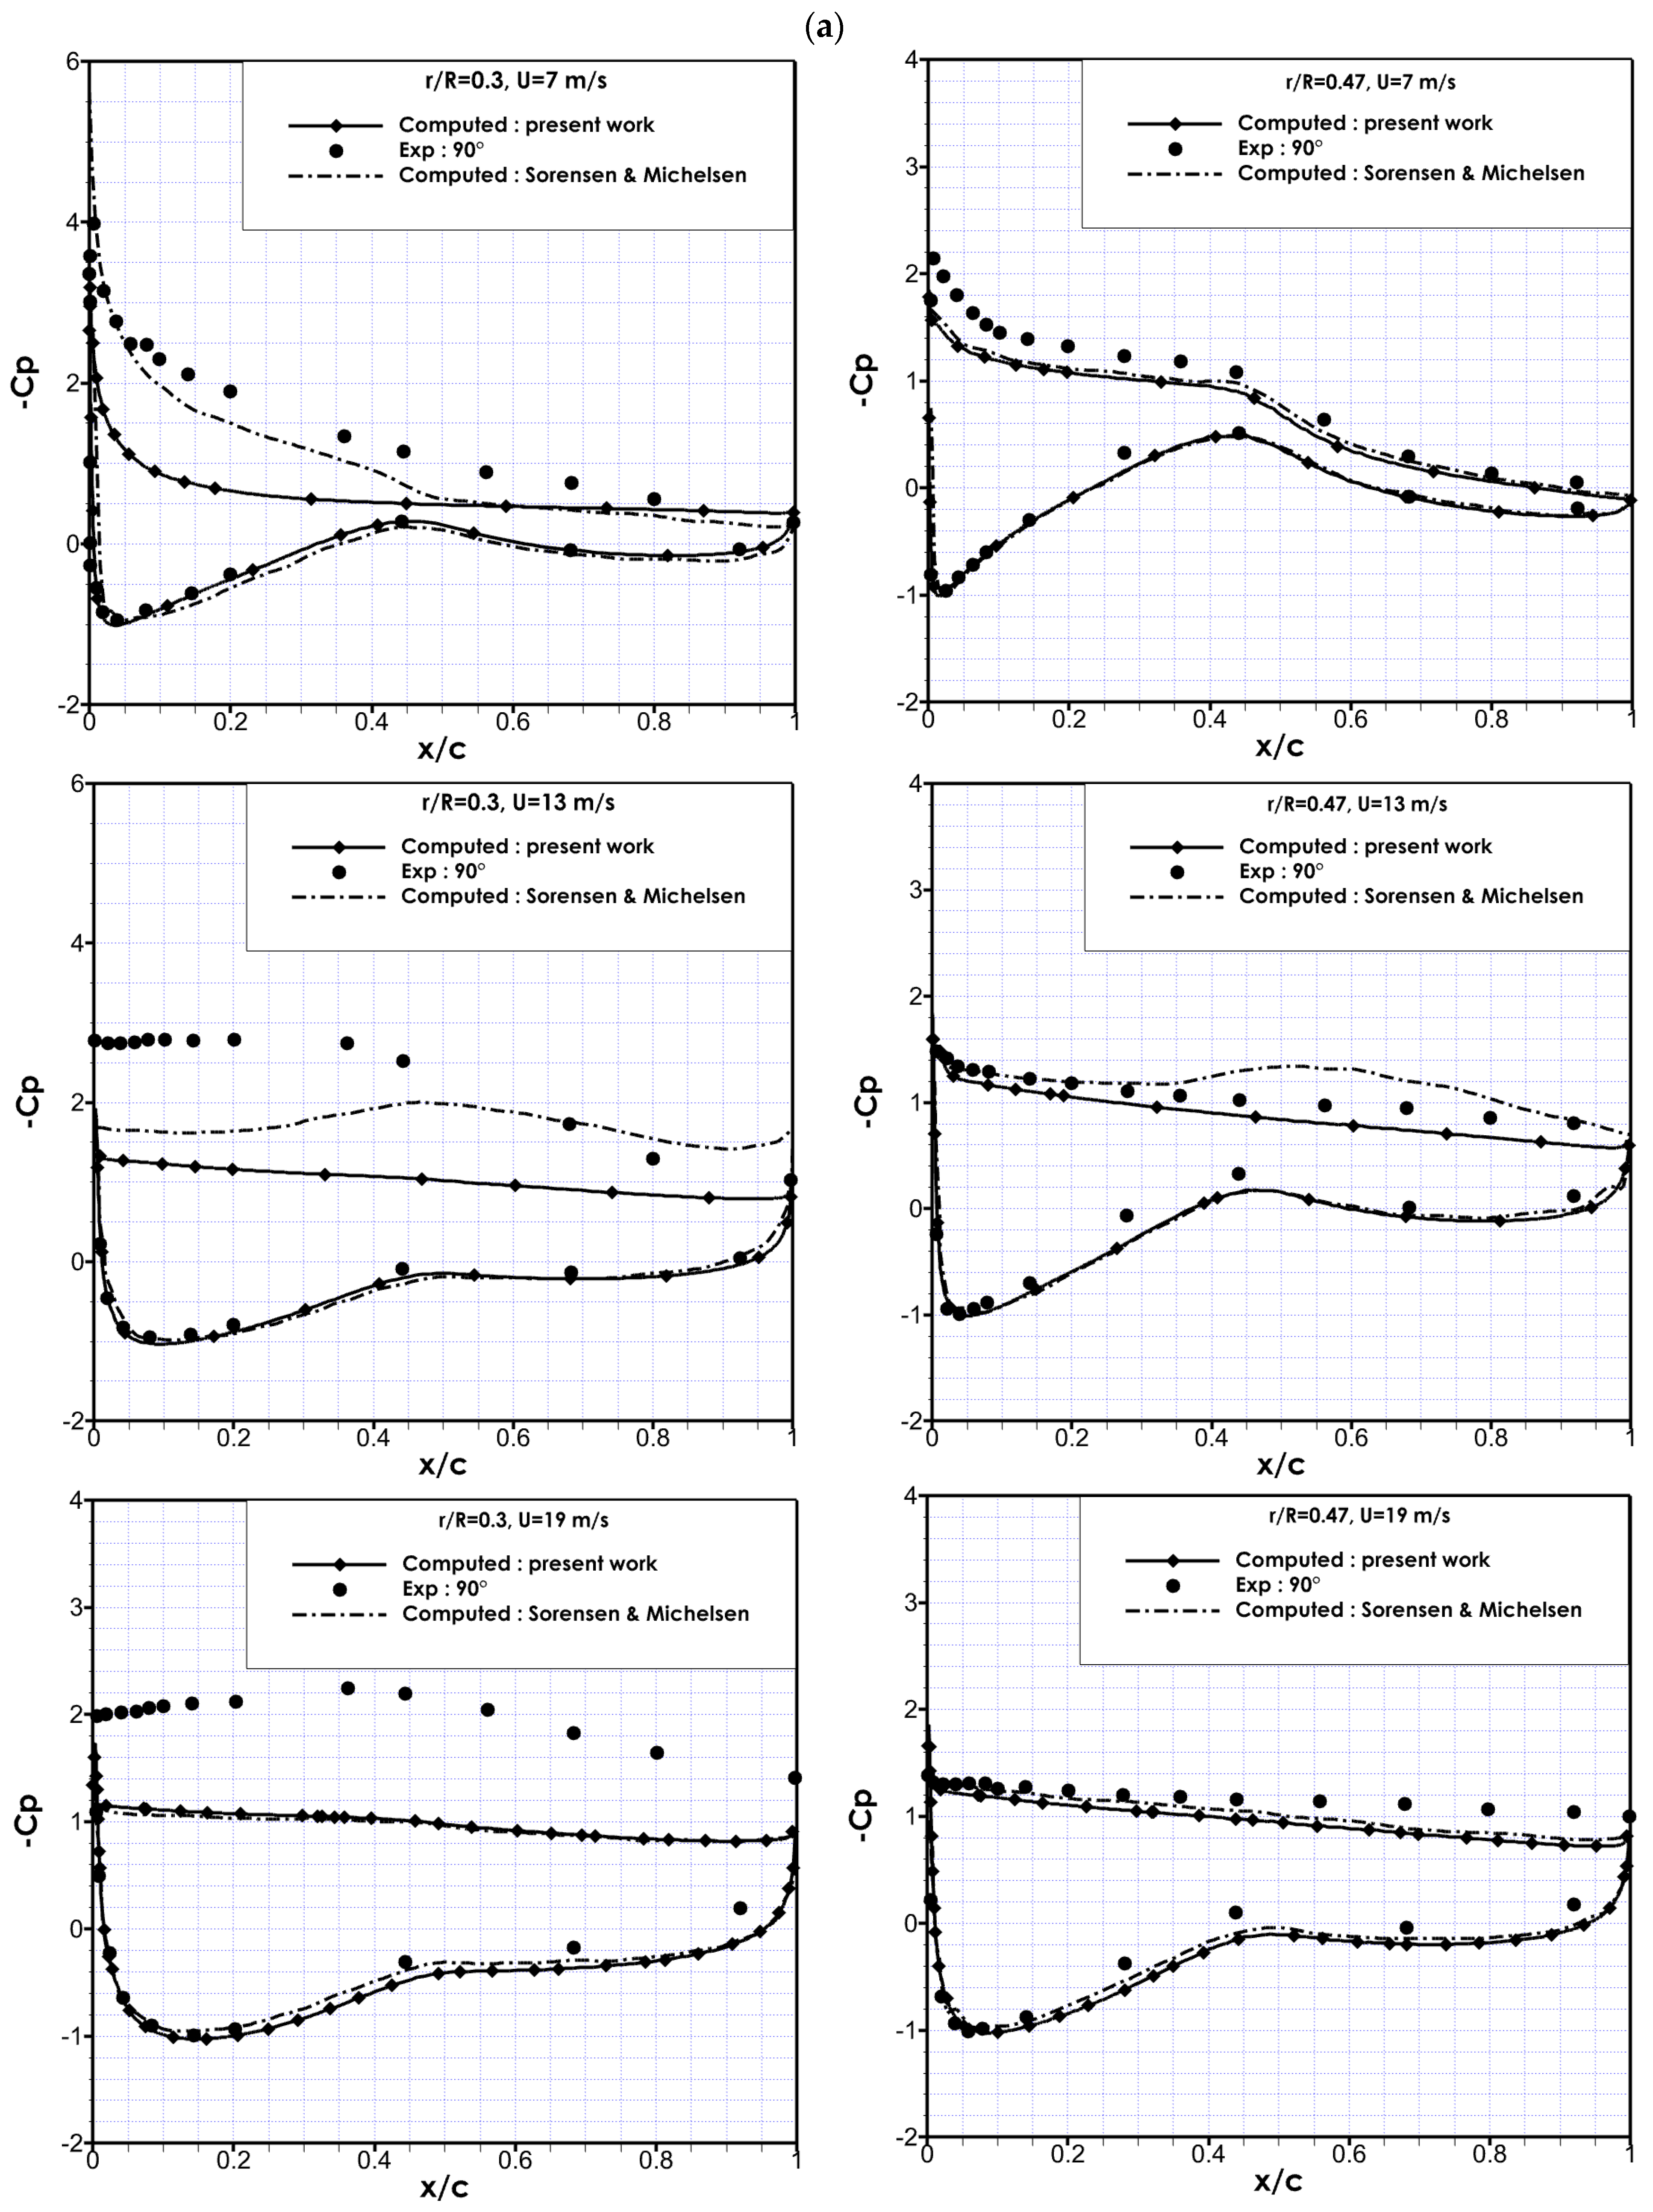
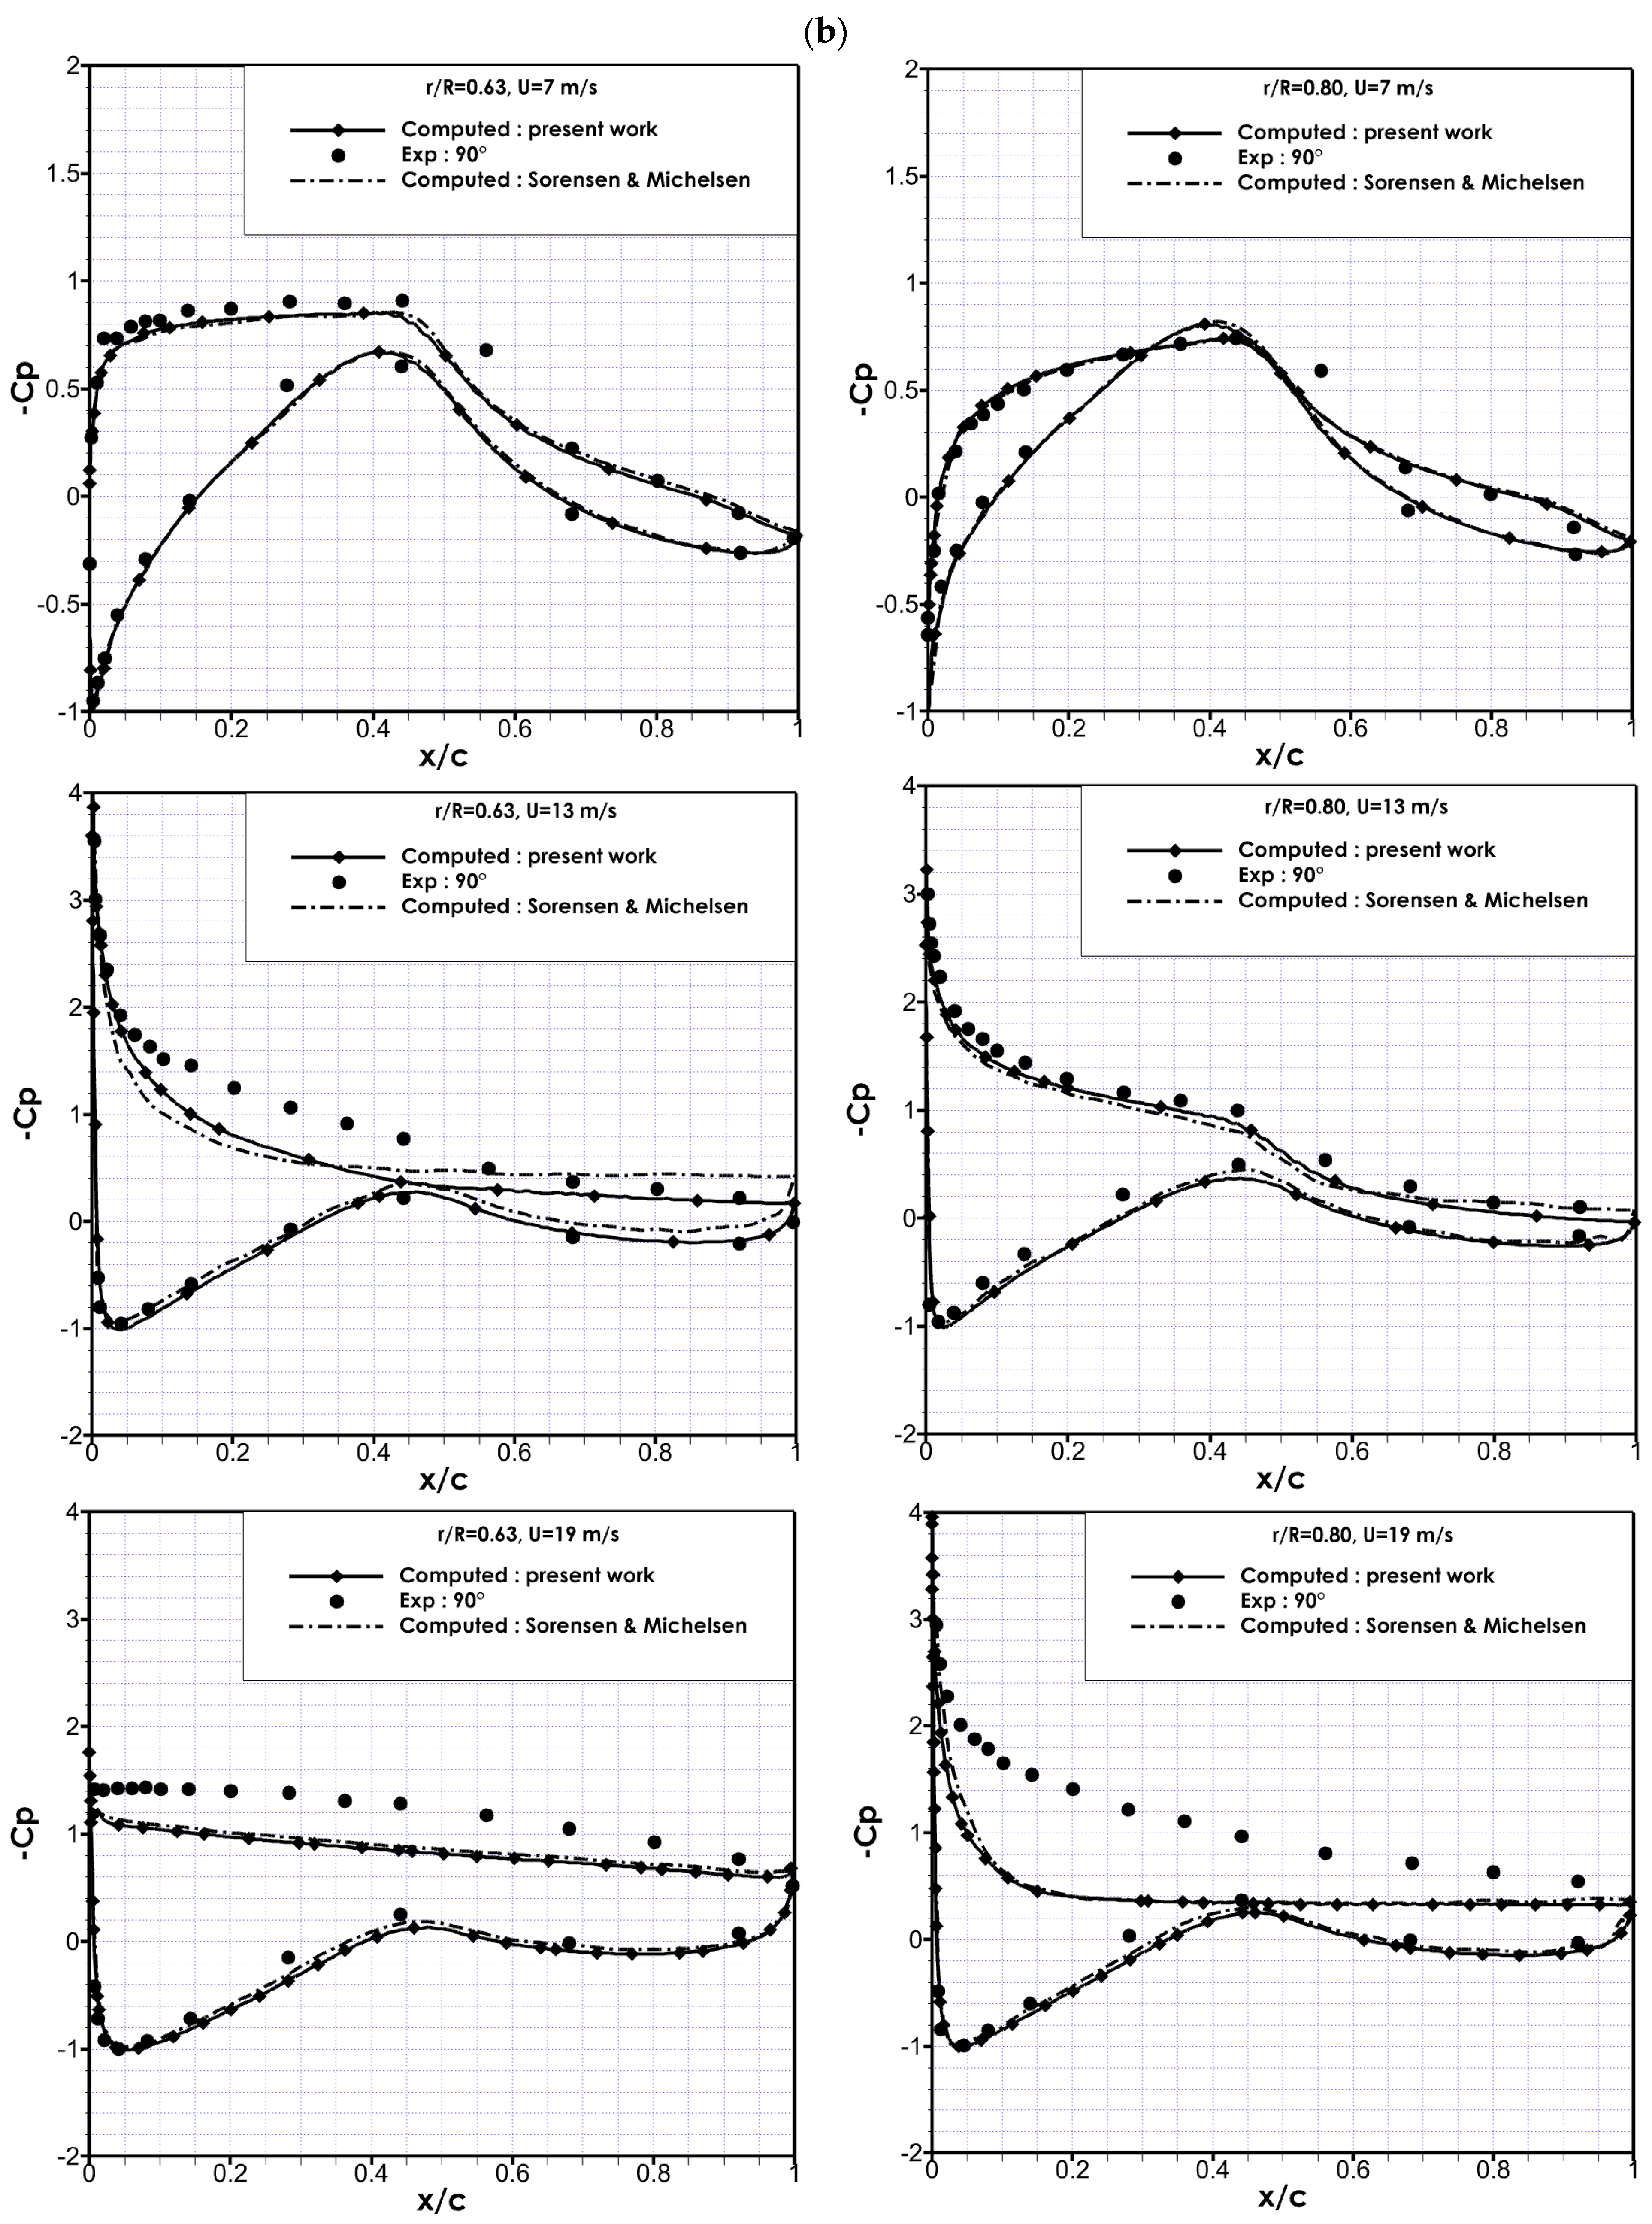
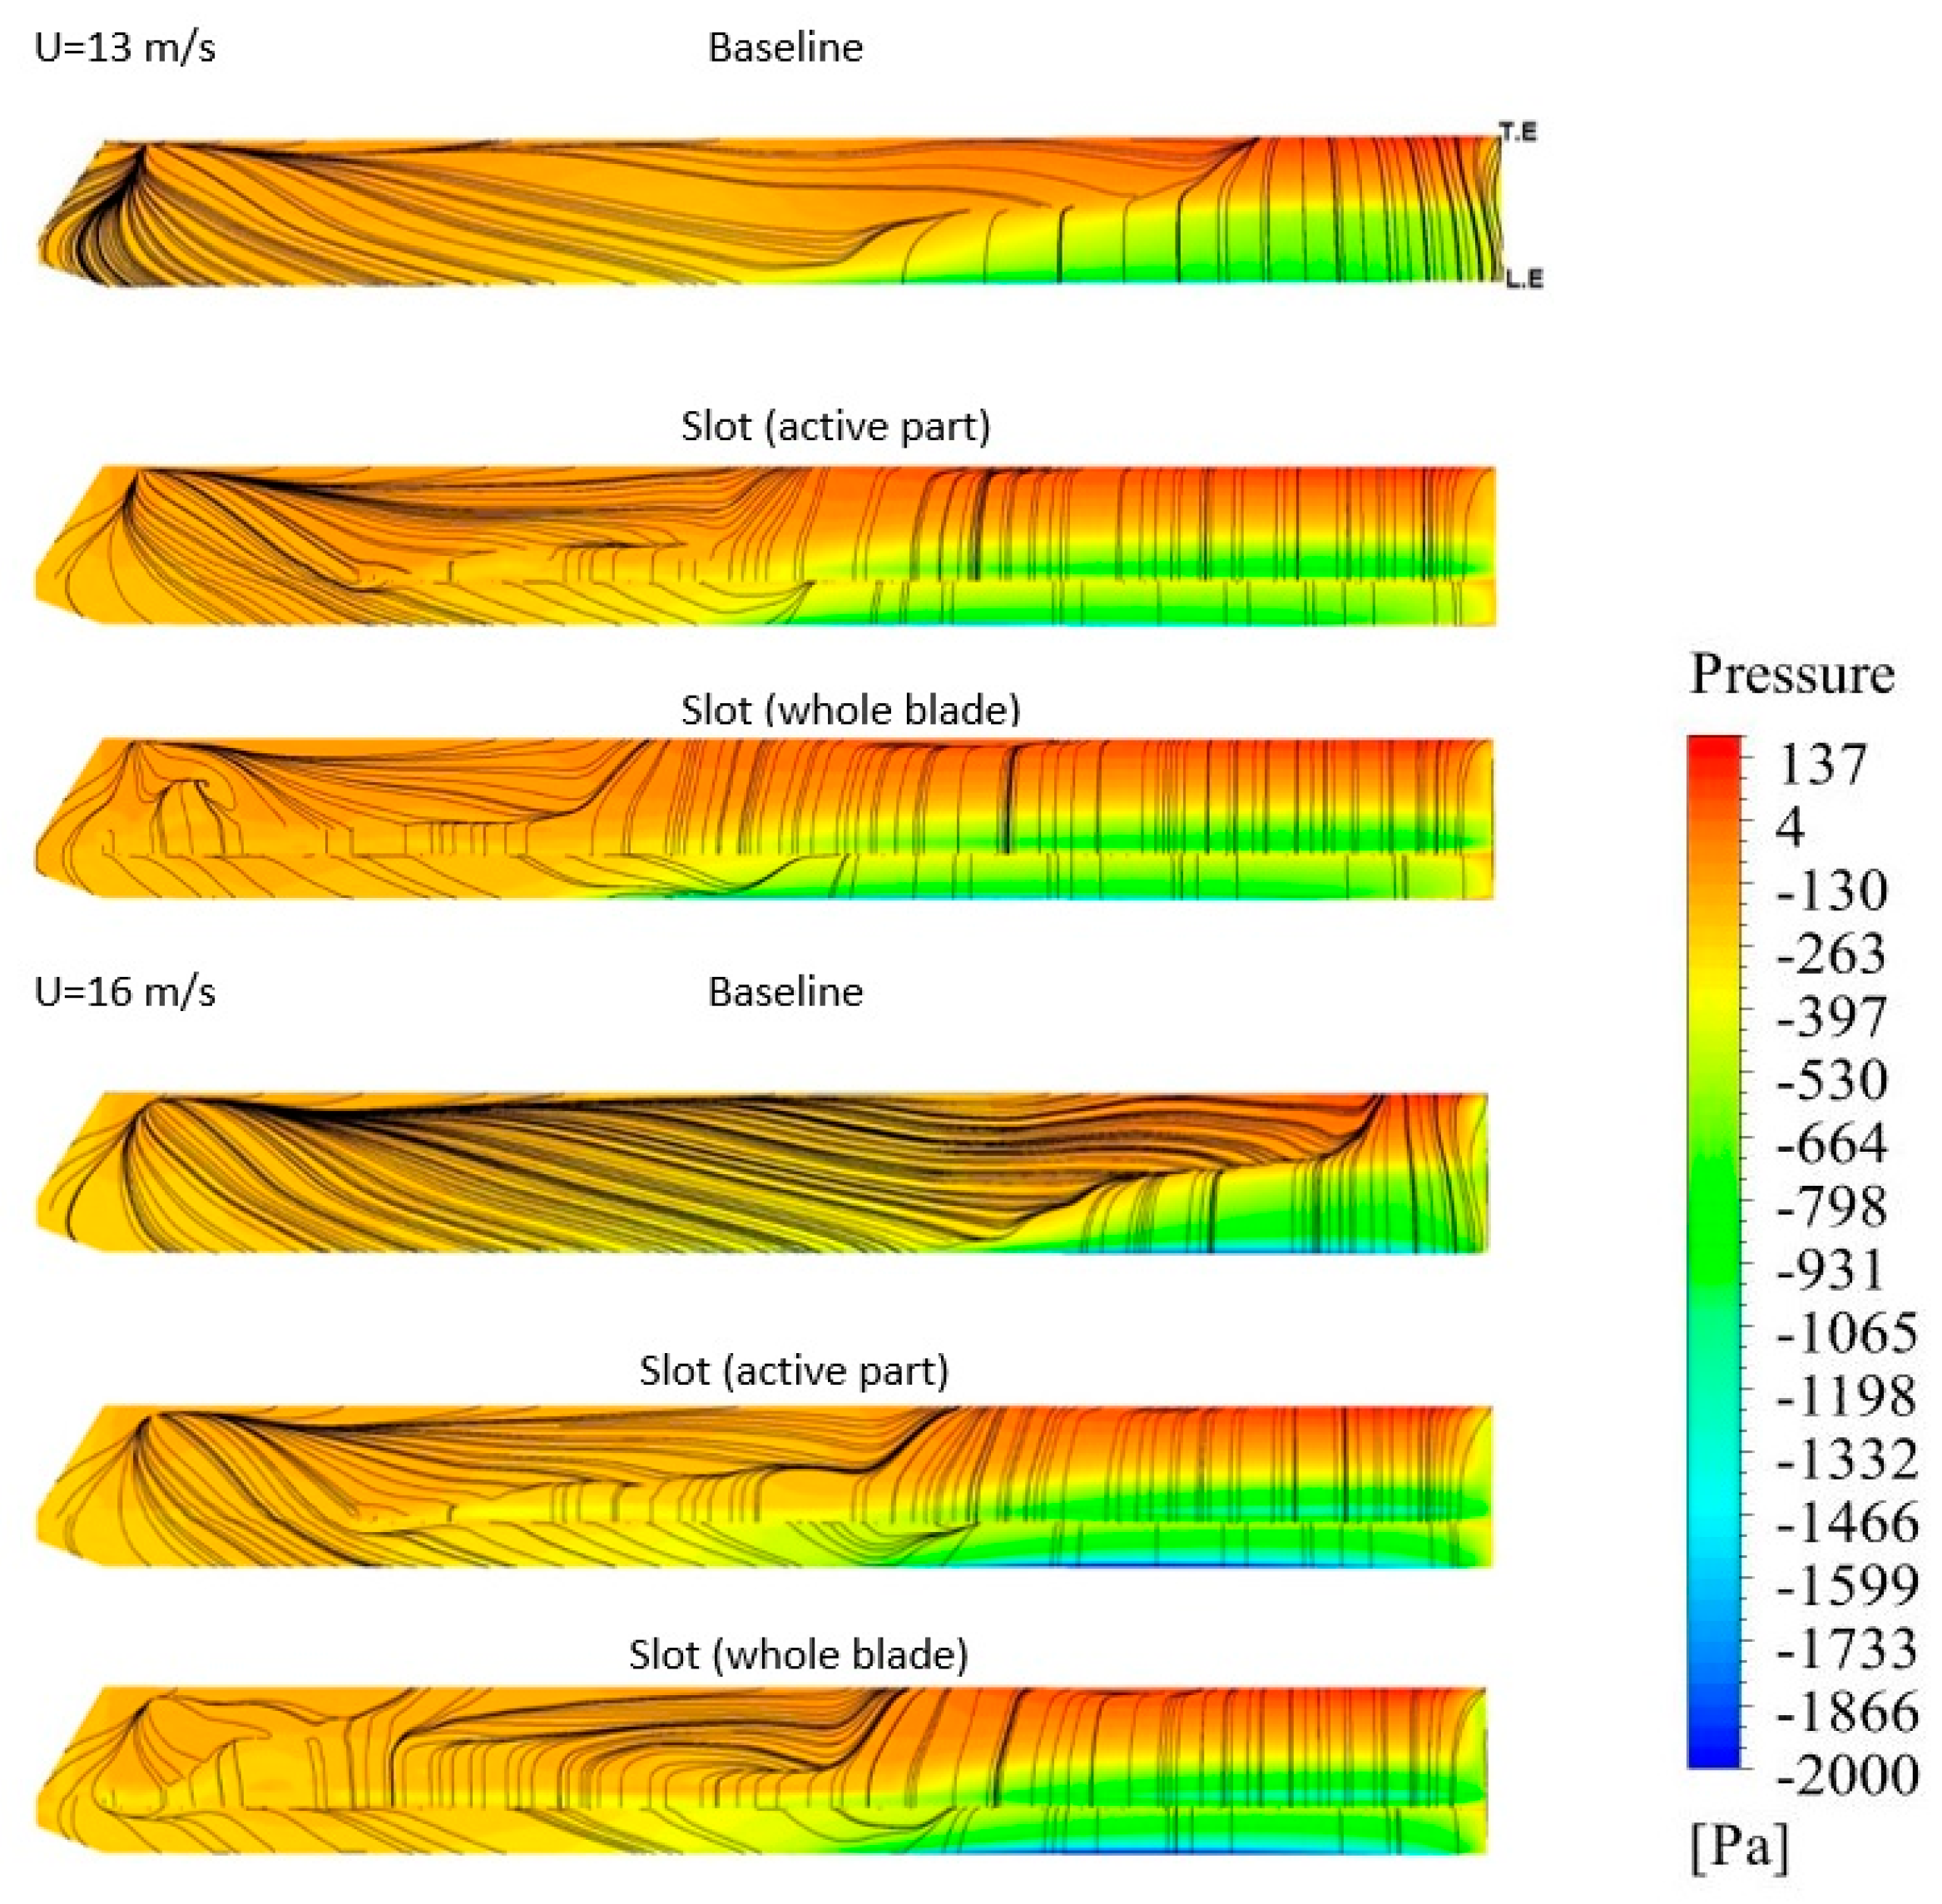
3.1. Pressure Distribution
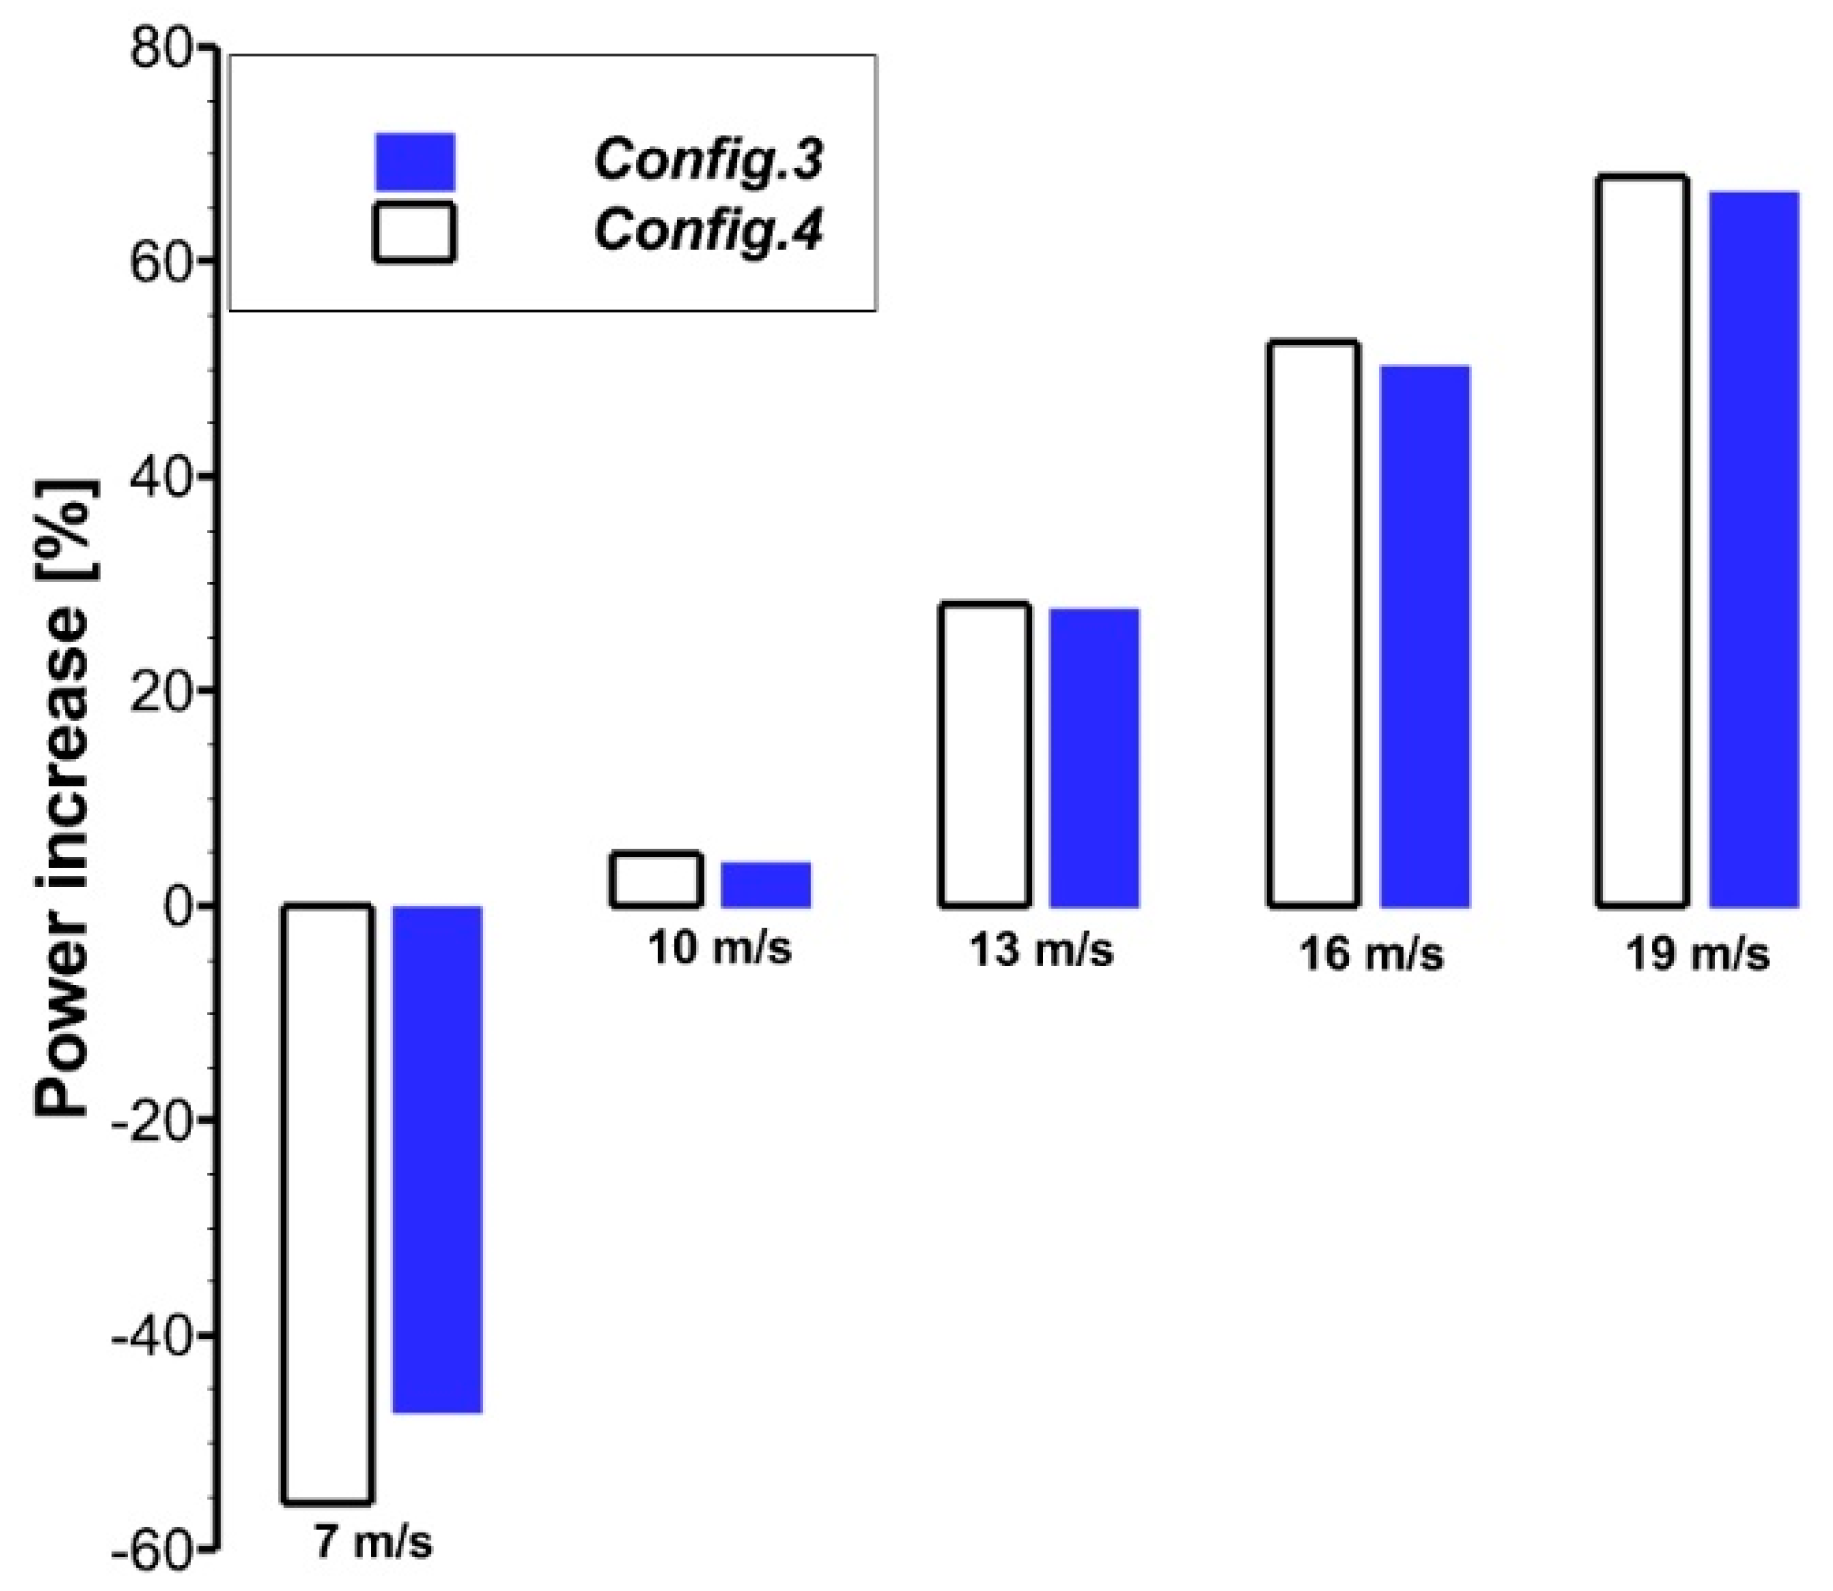
3.2. Power Production
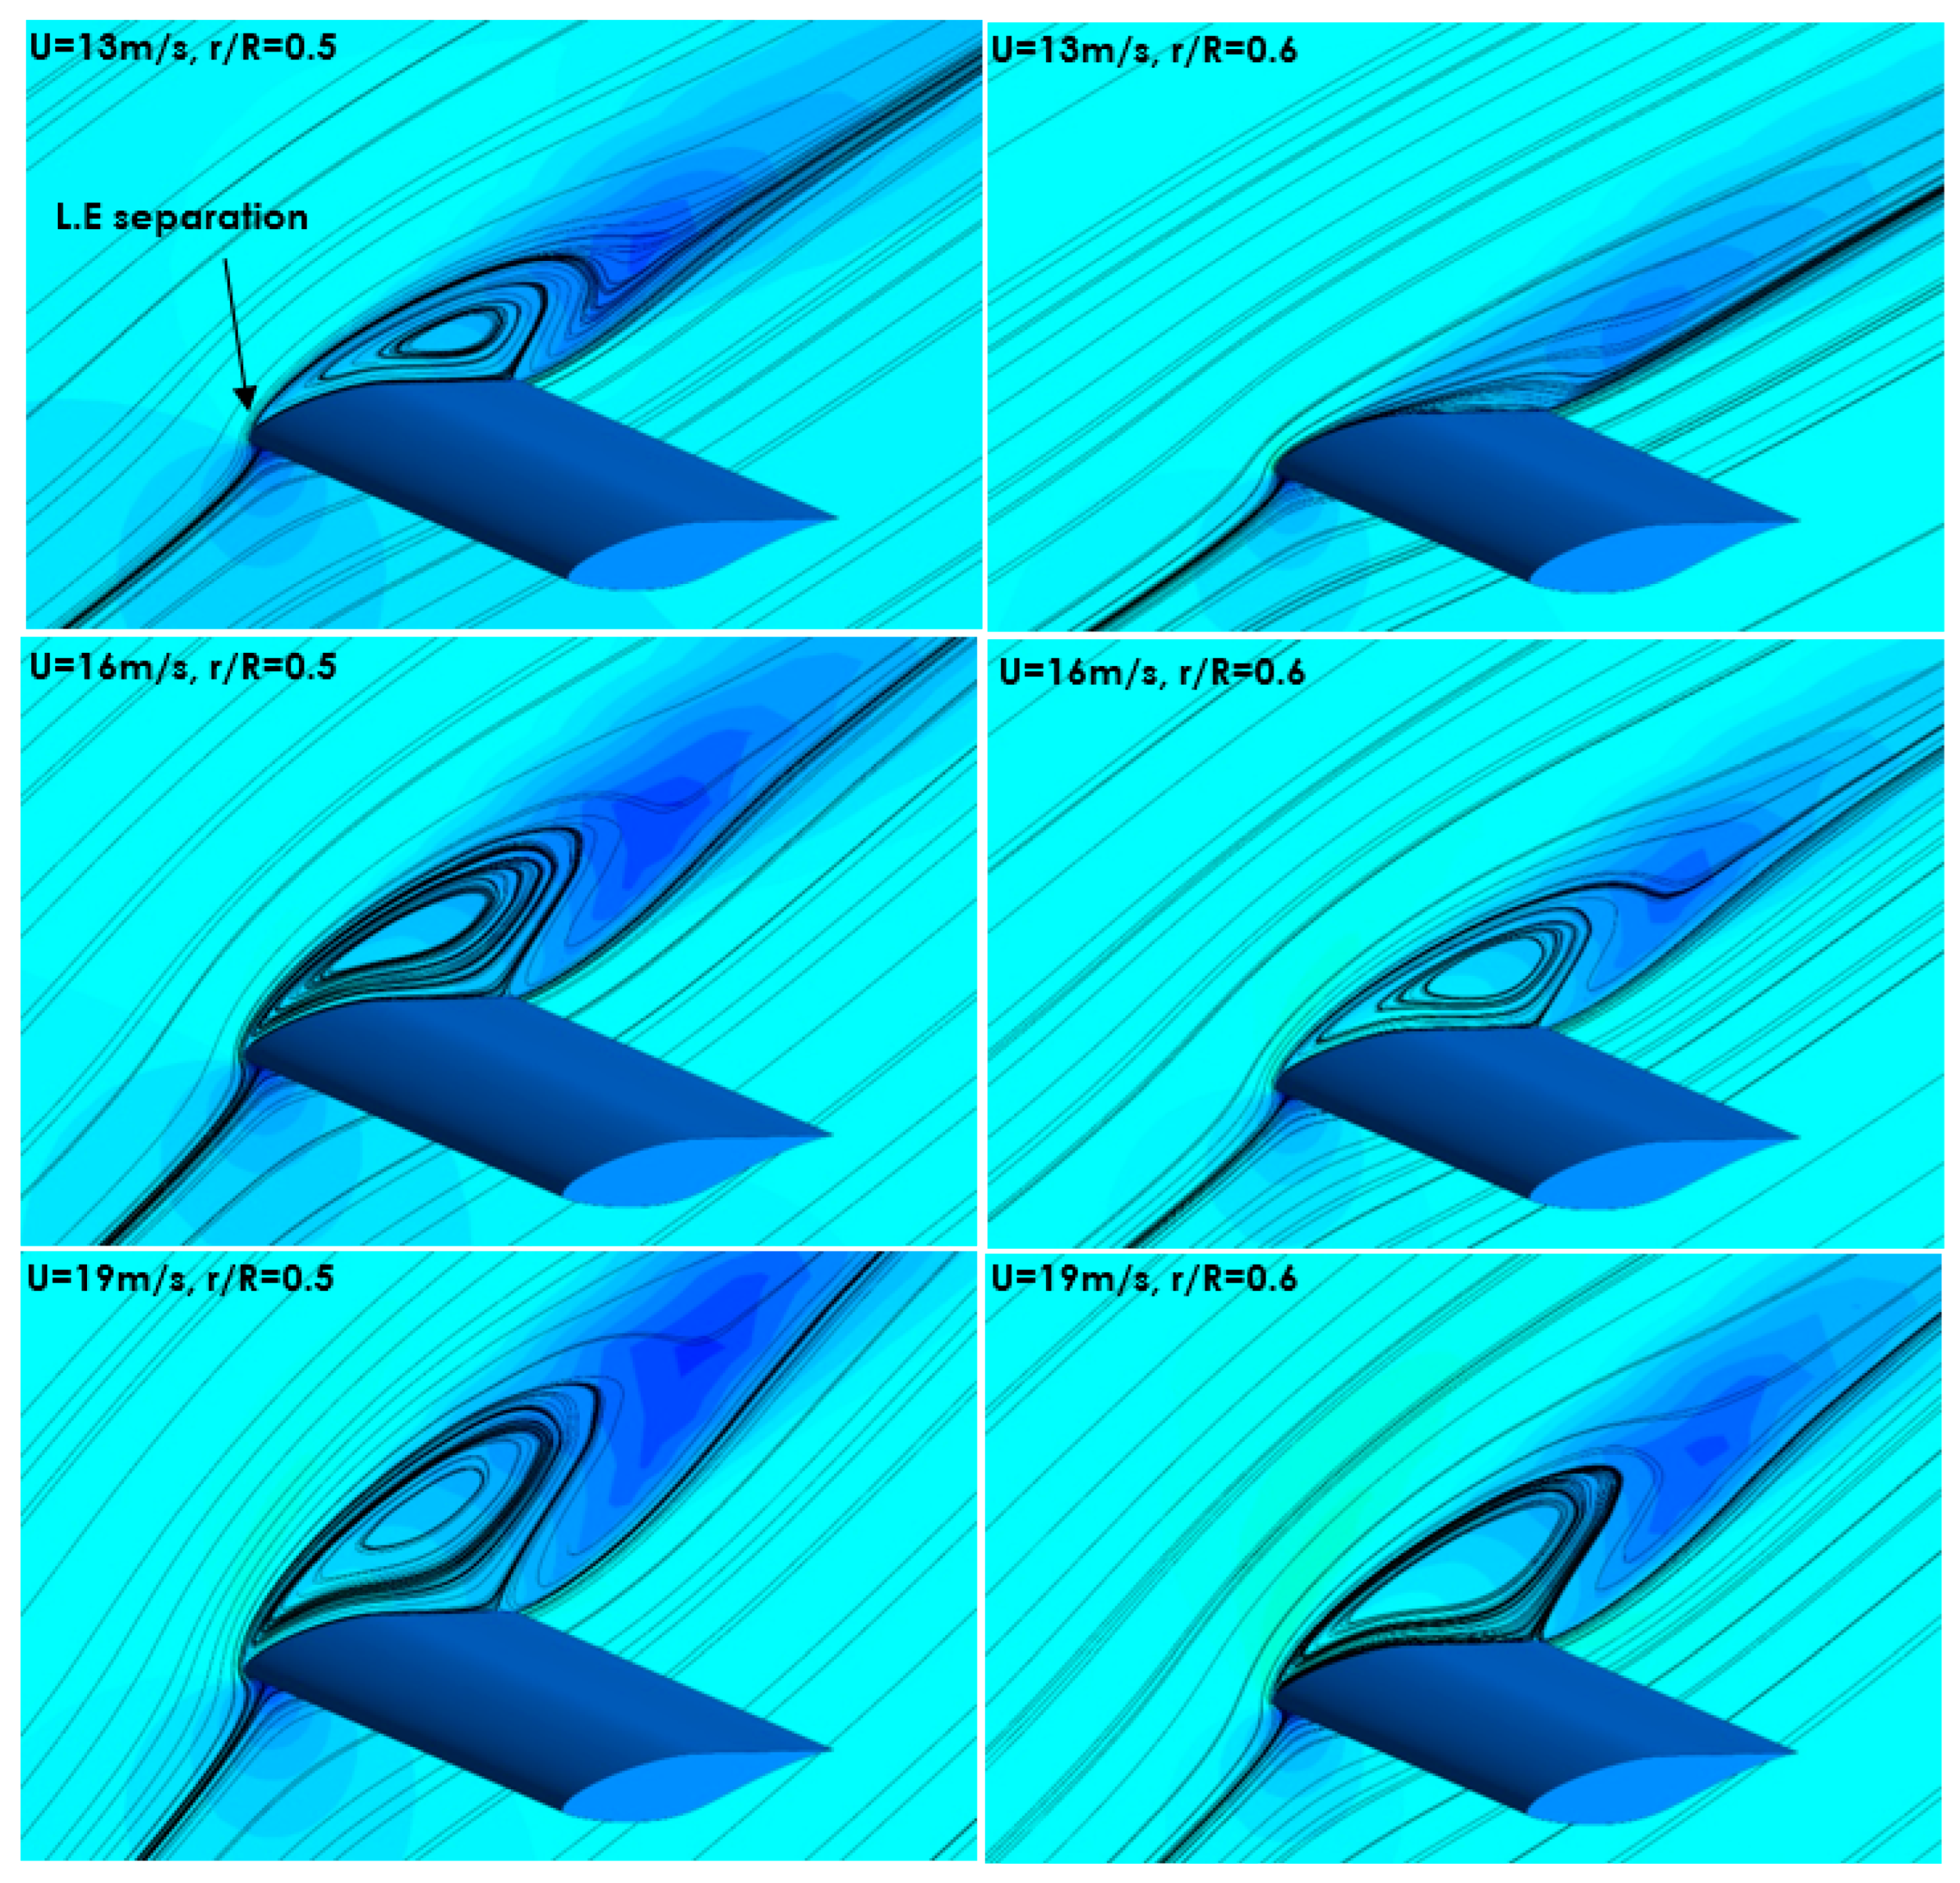
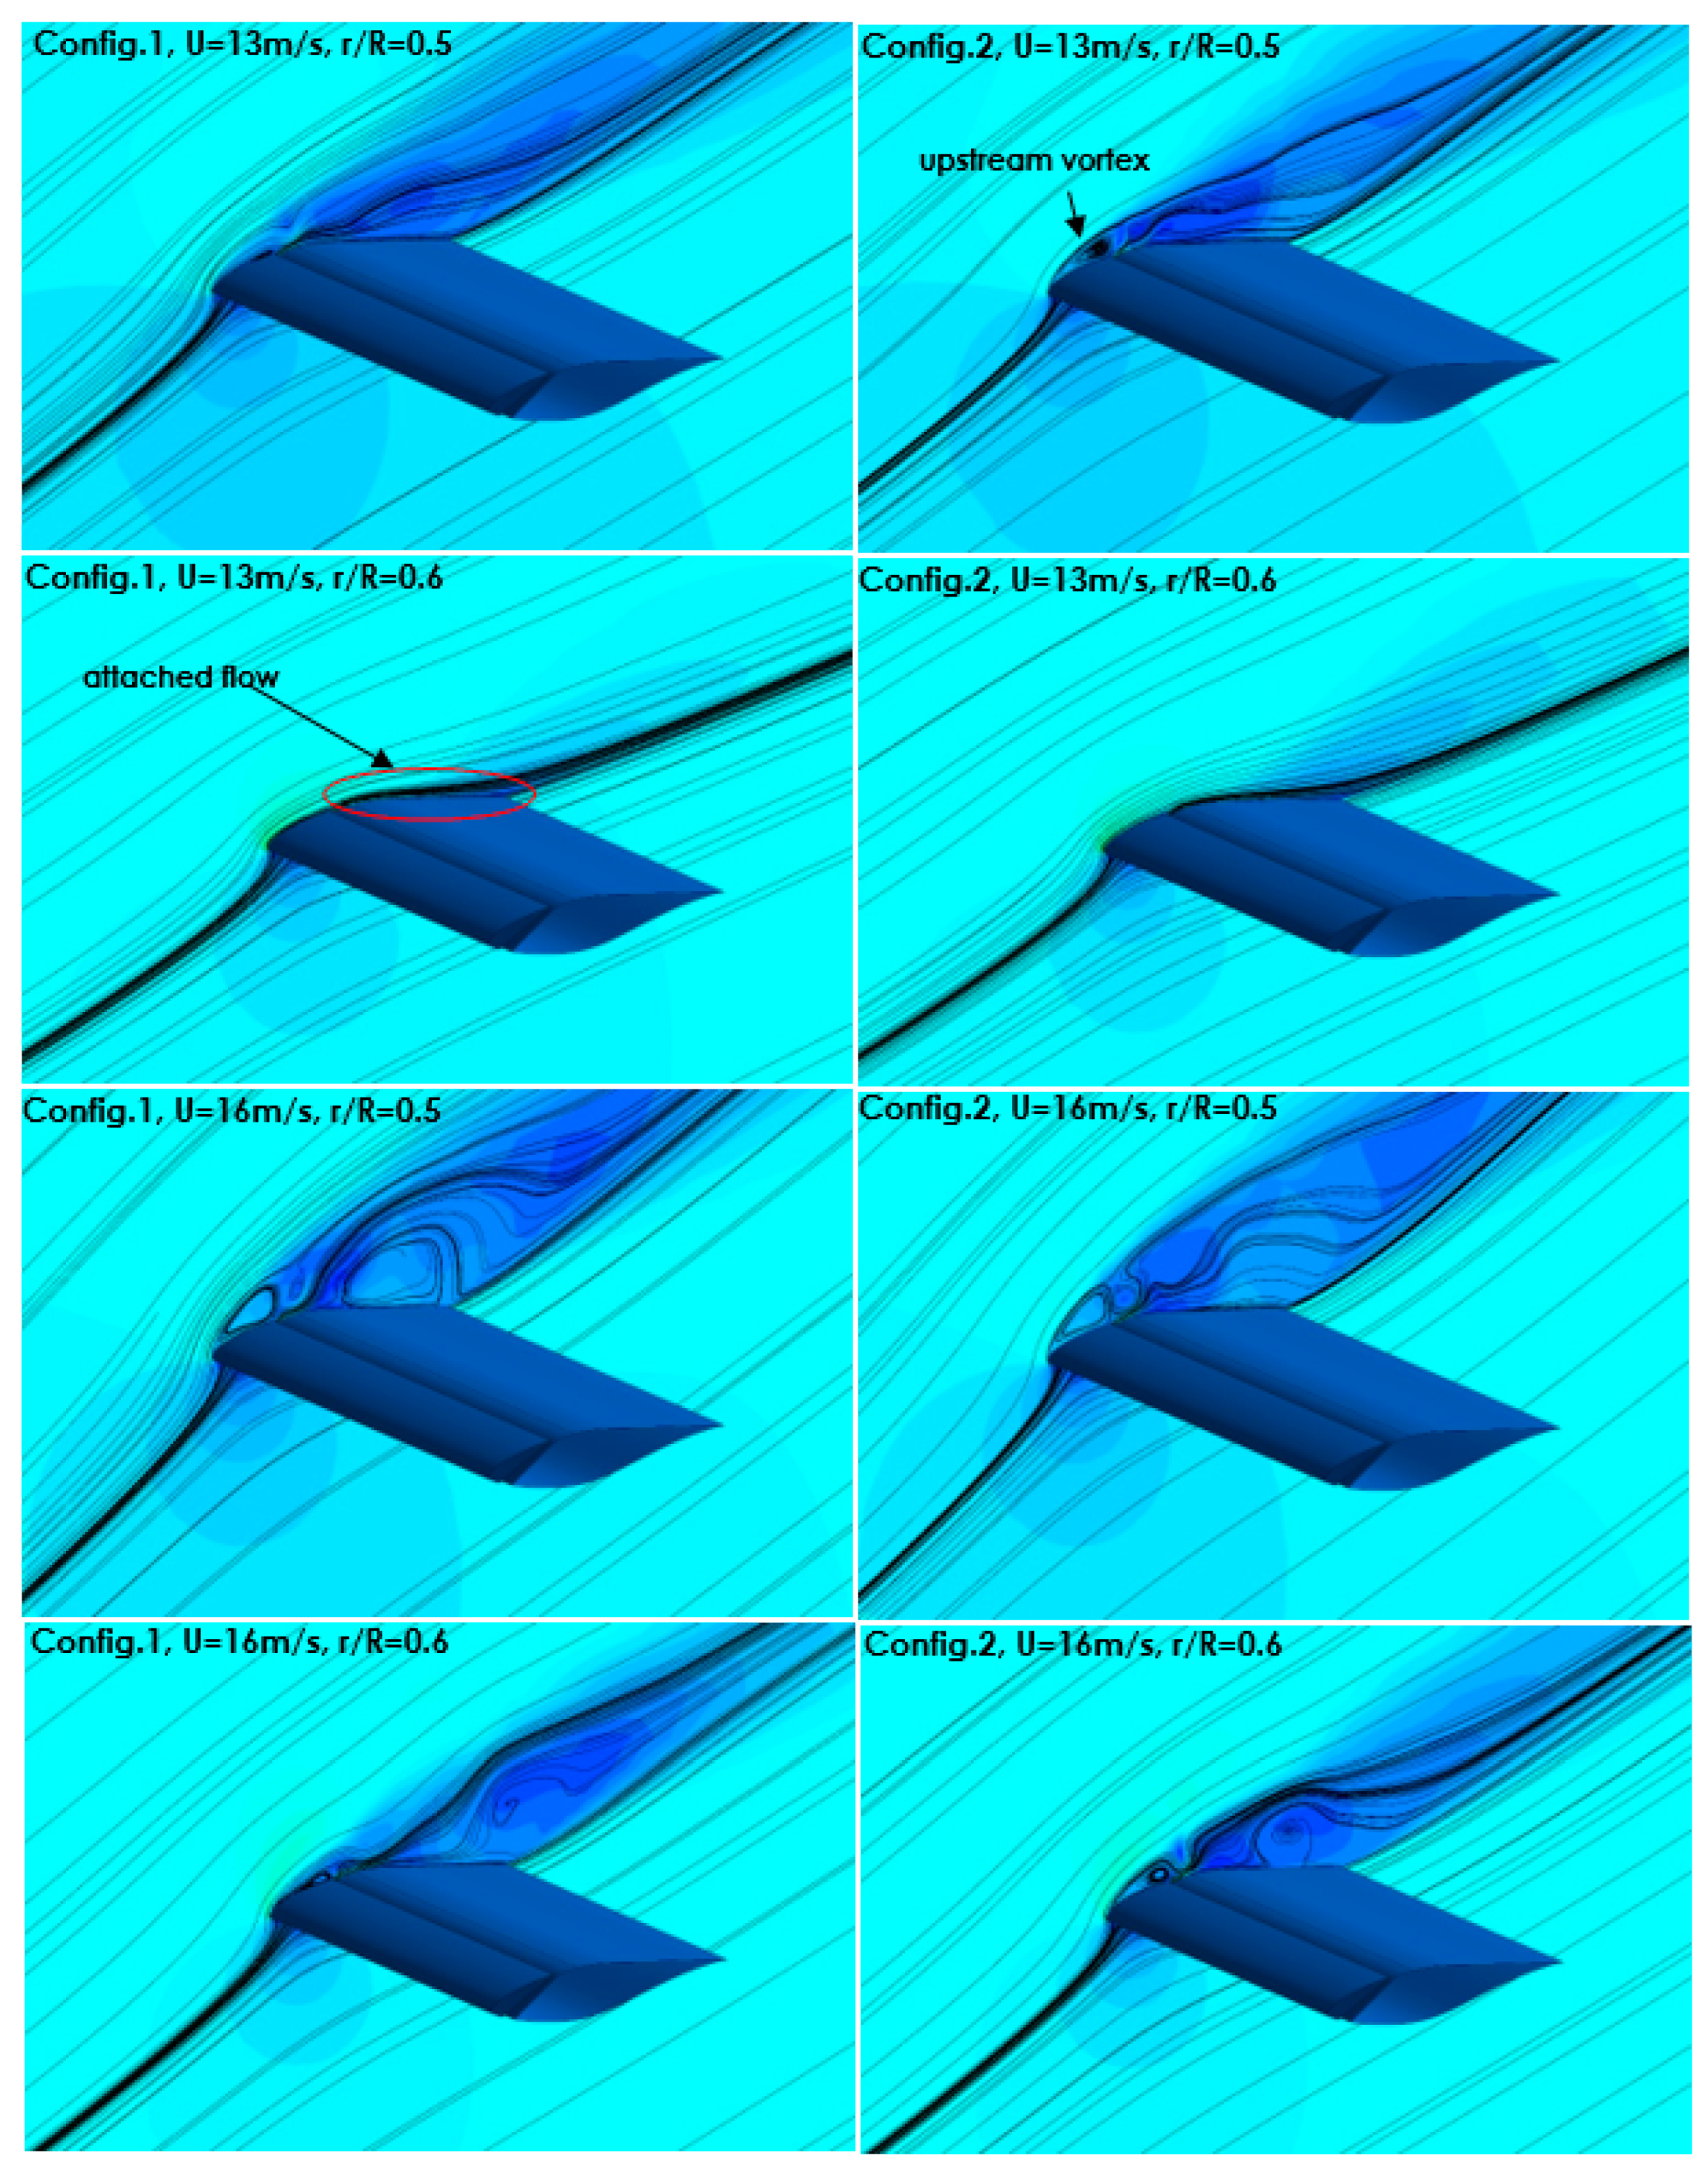
3.3. Effect of Rotation on the Control System
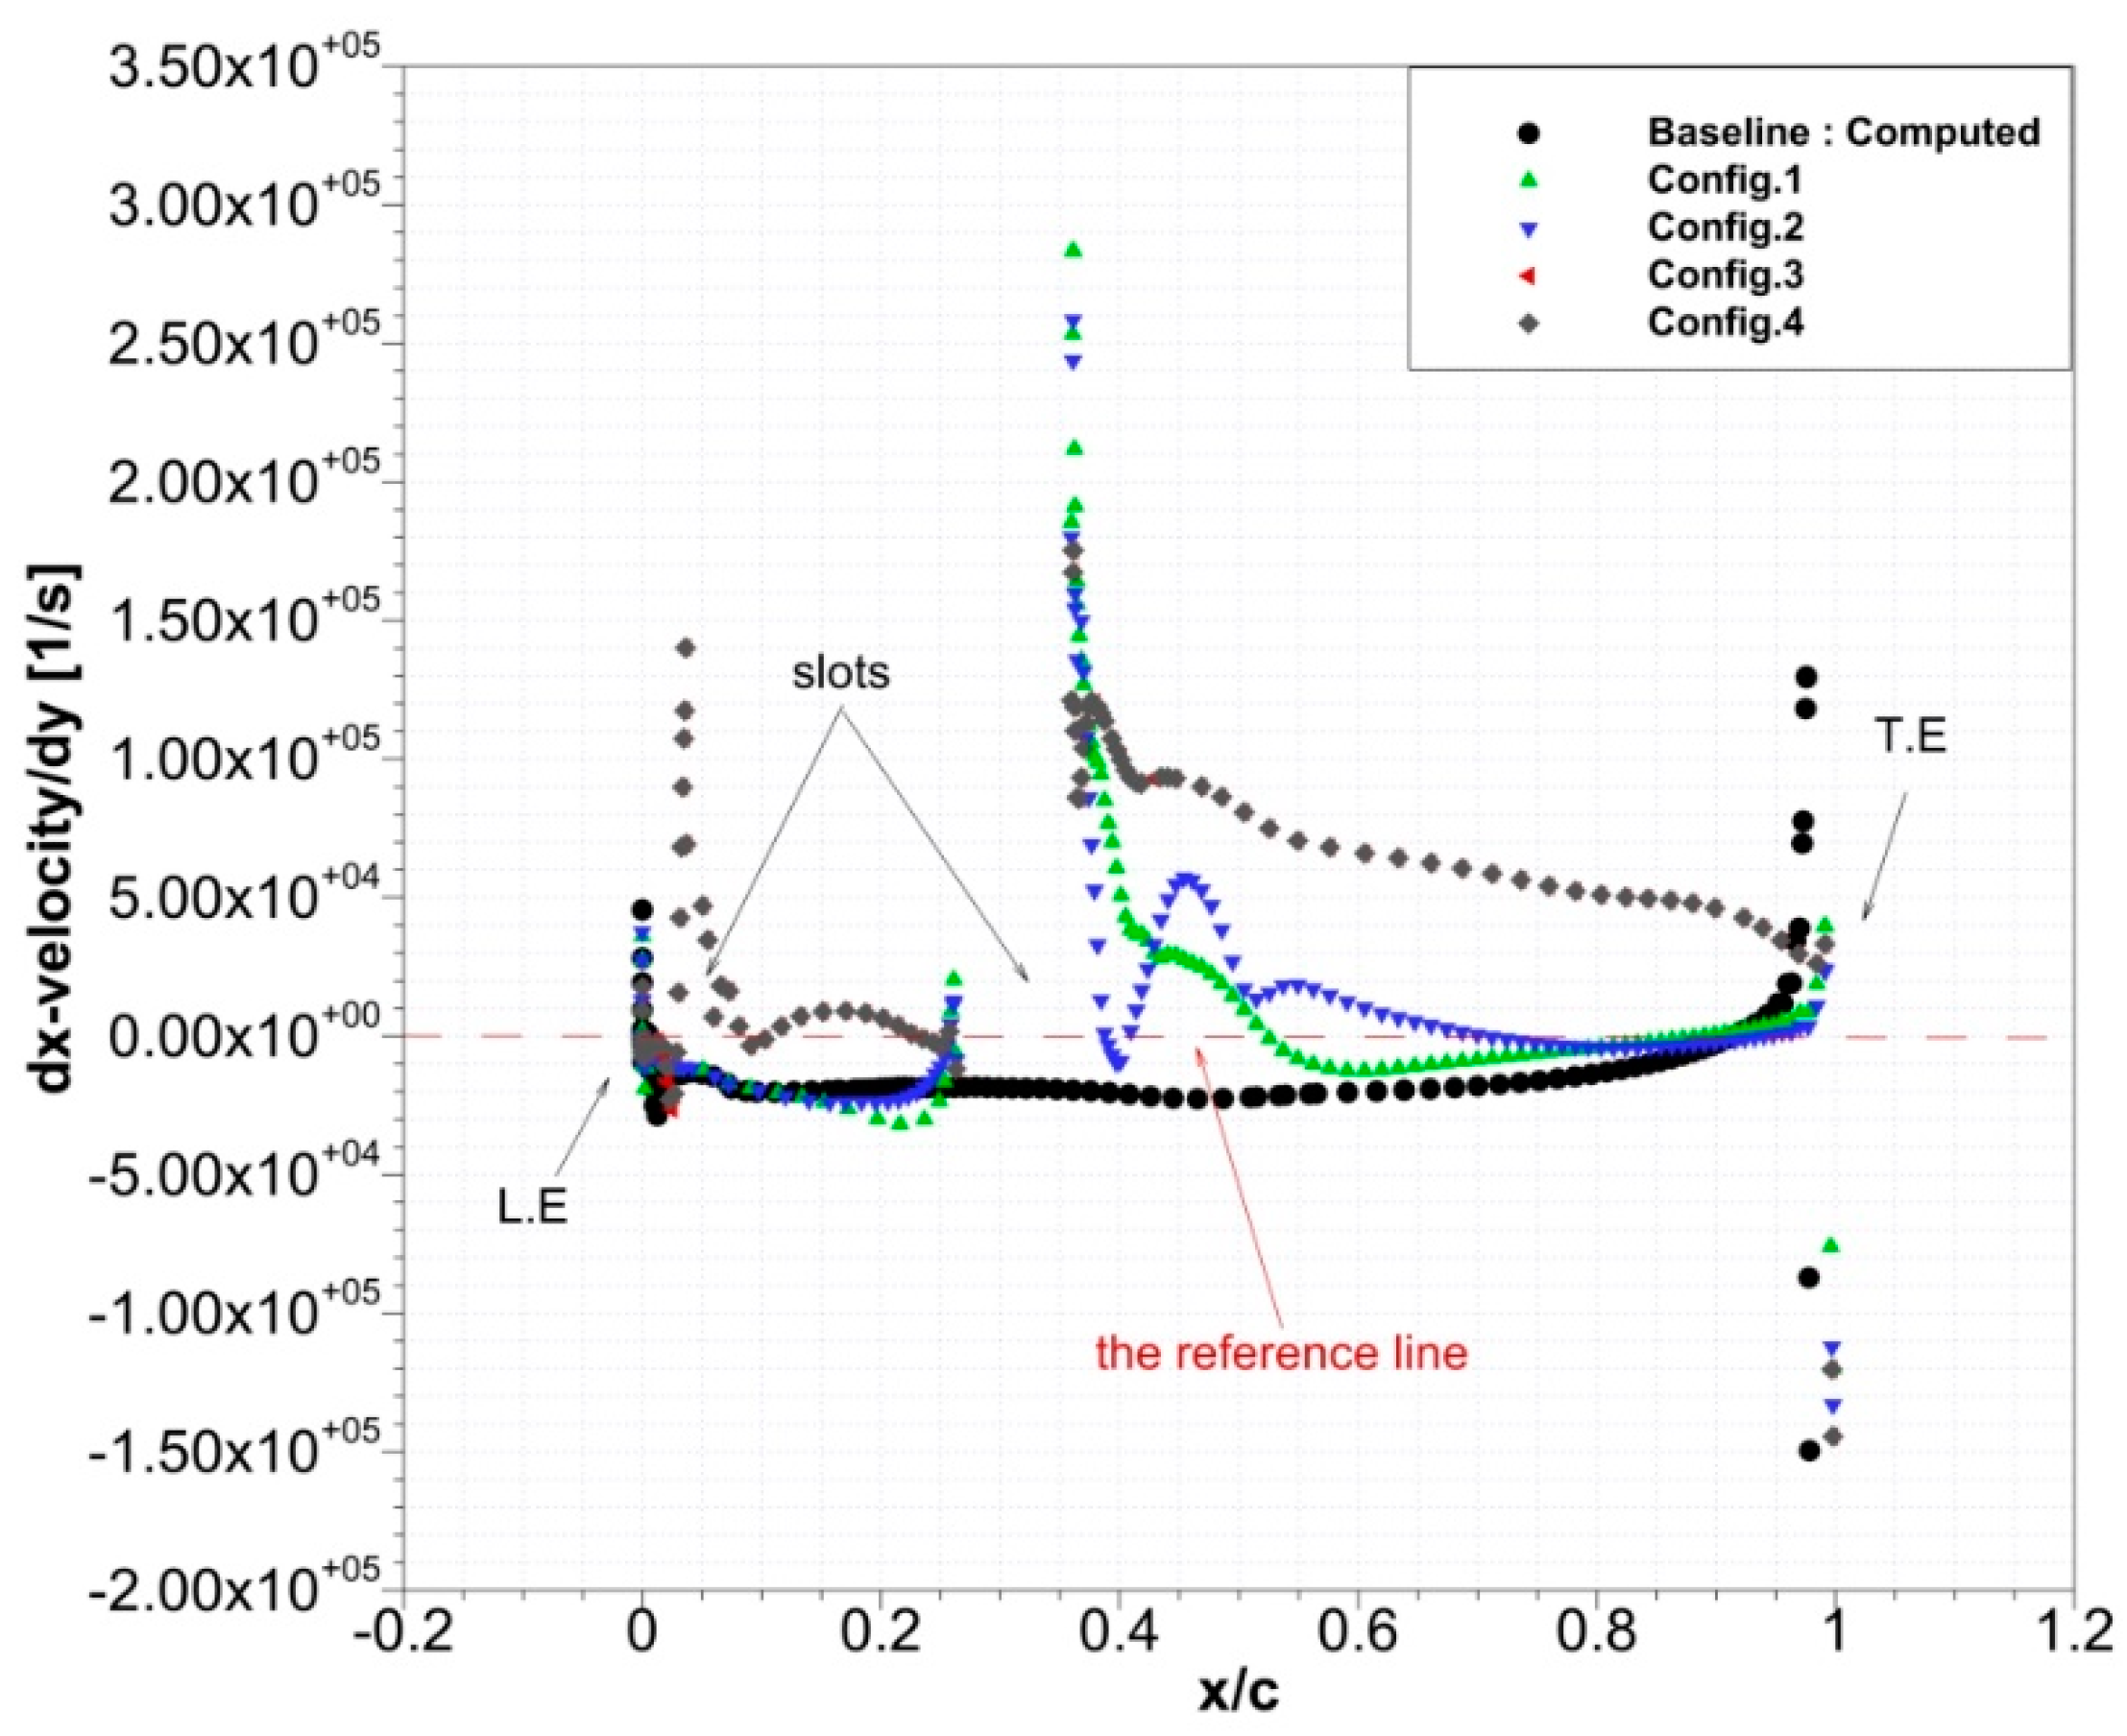
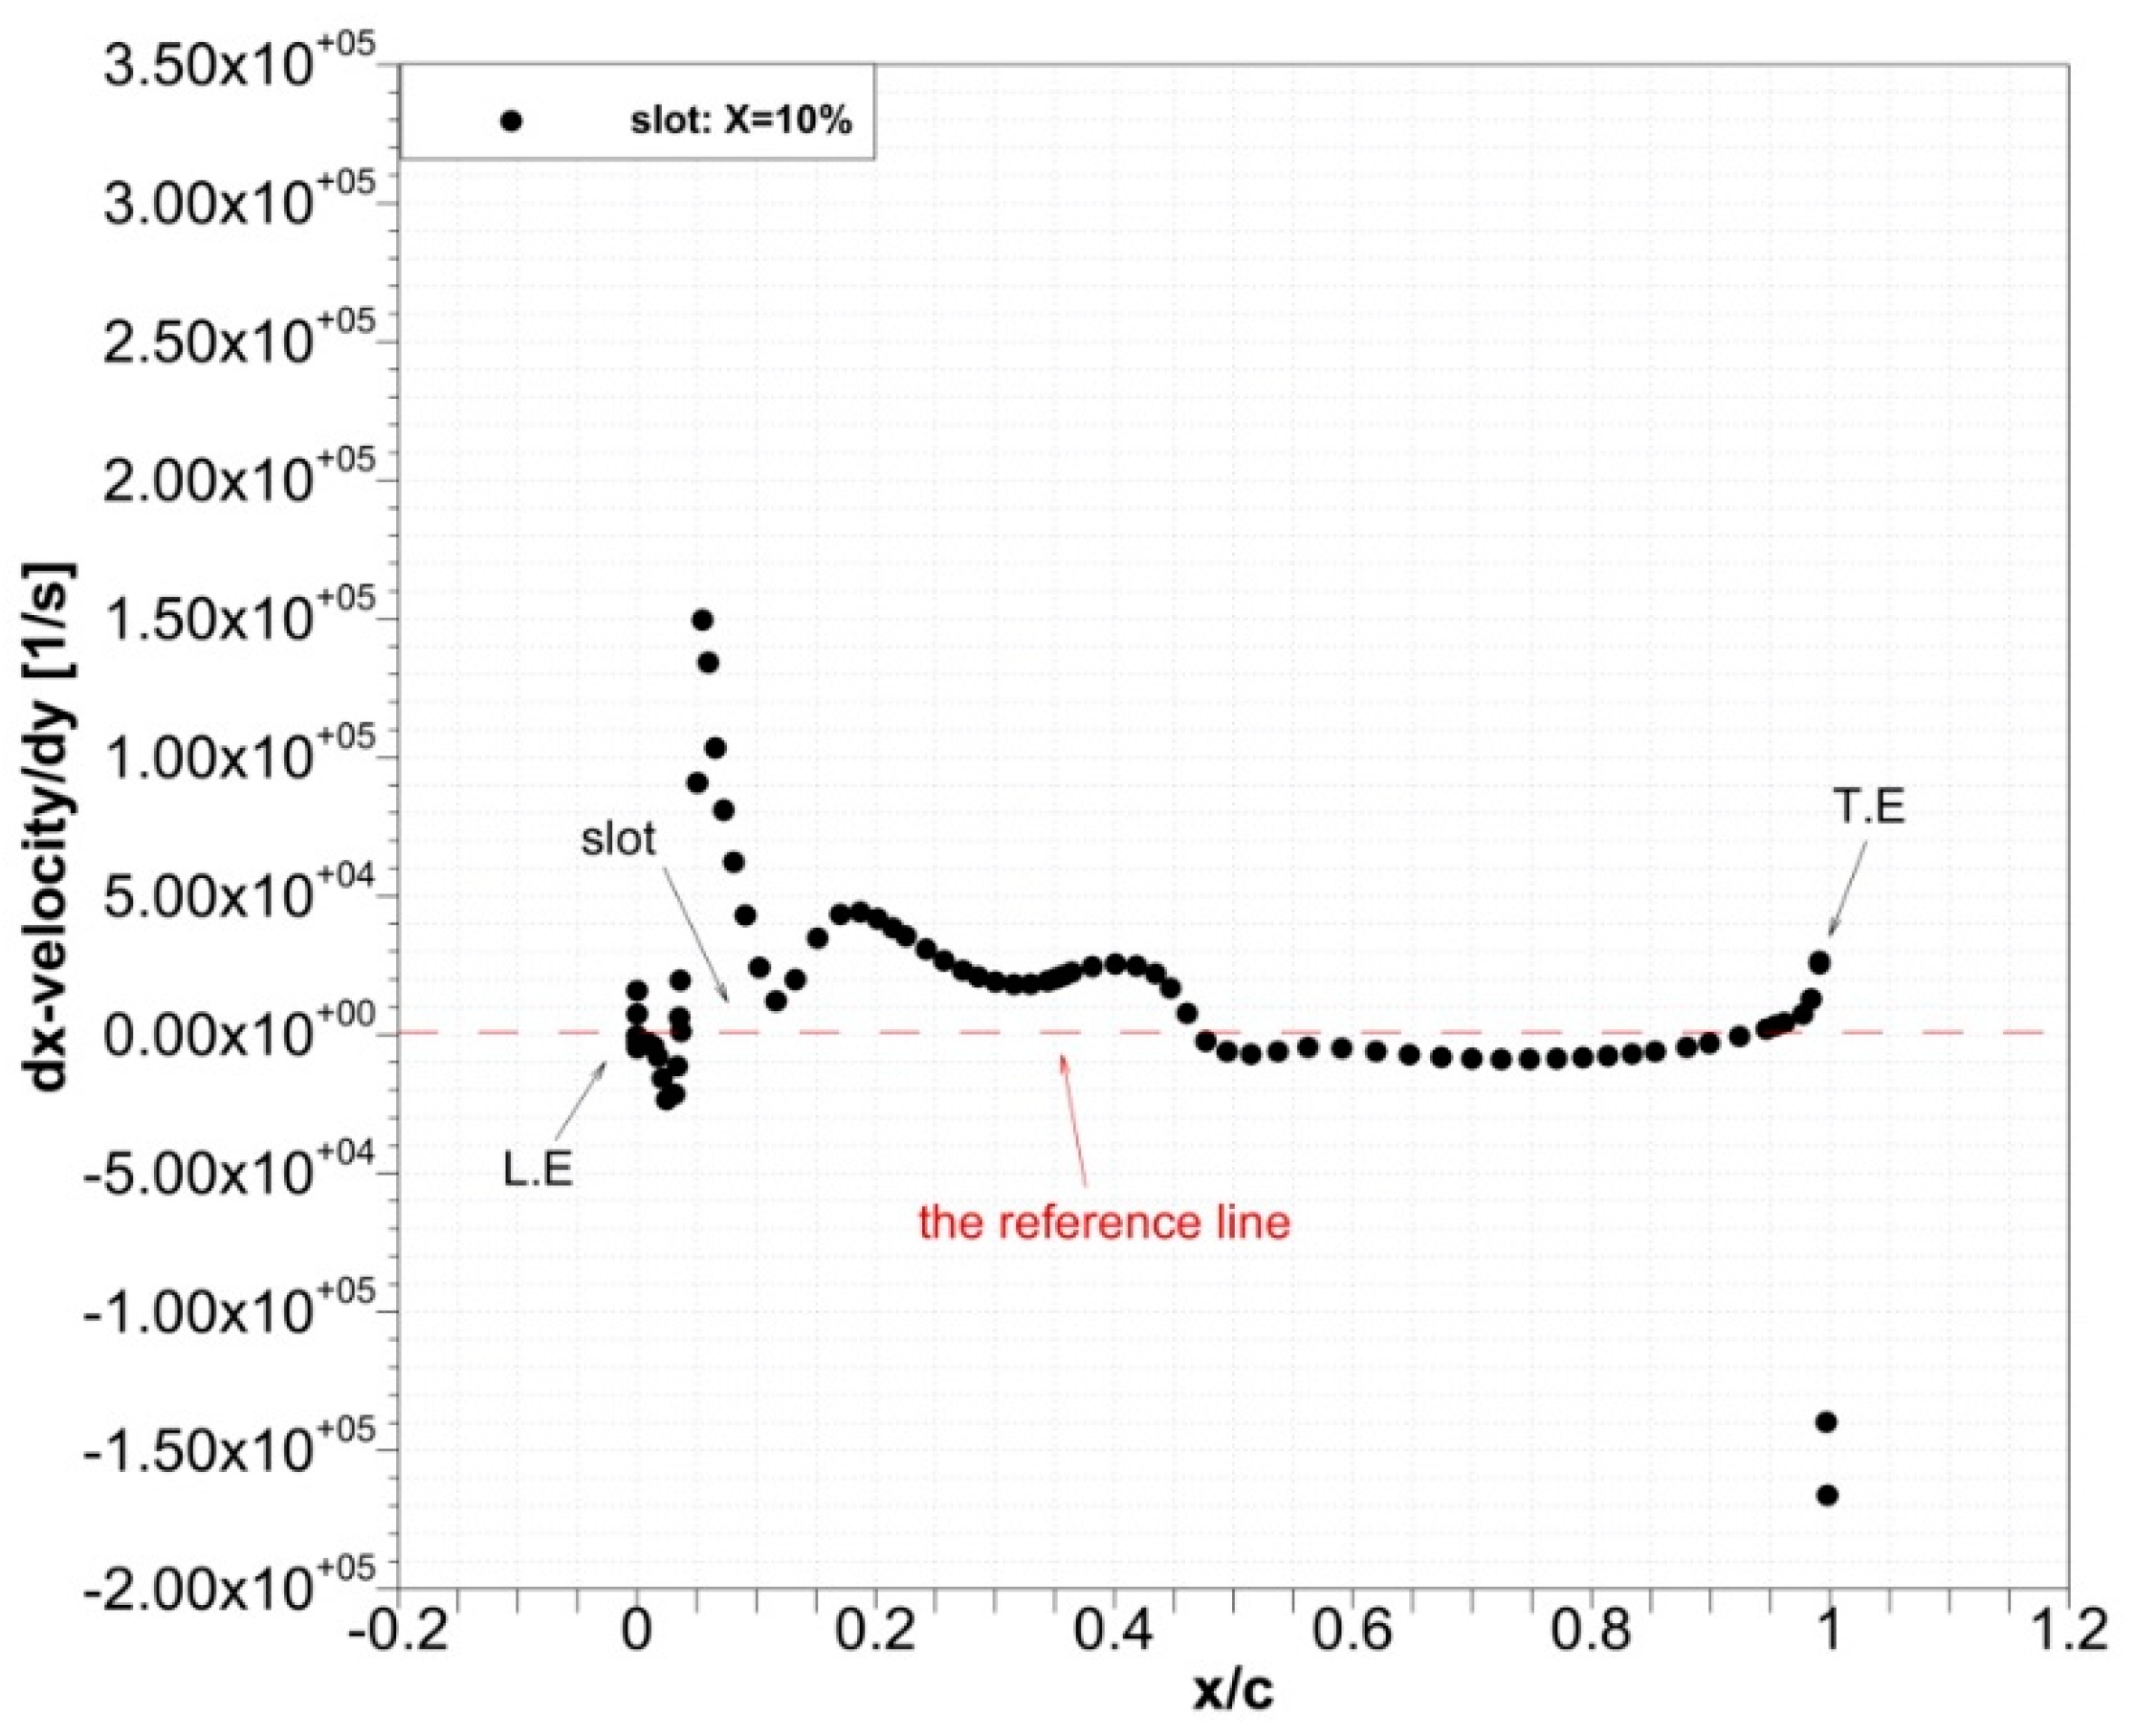
3.3.1. Applying a Single-Slot
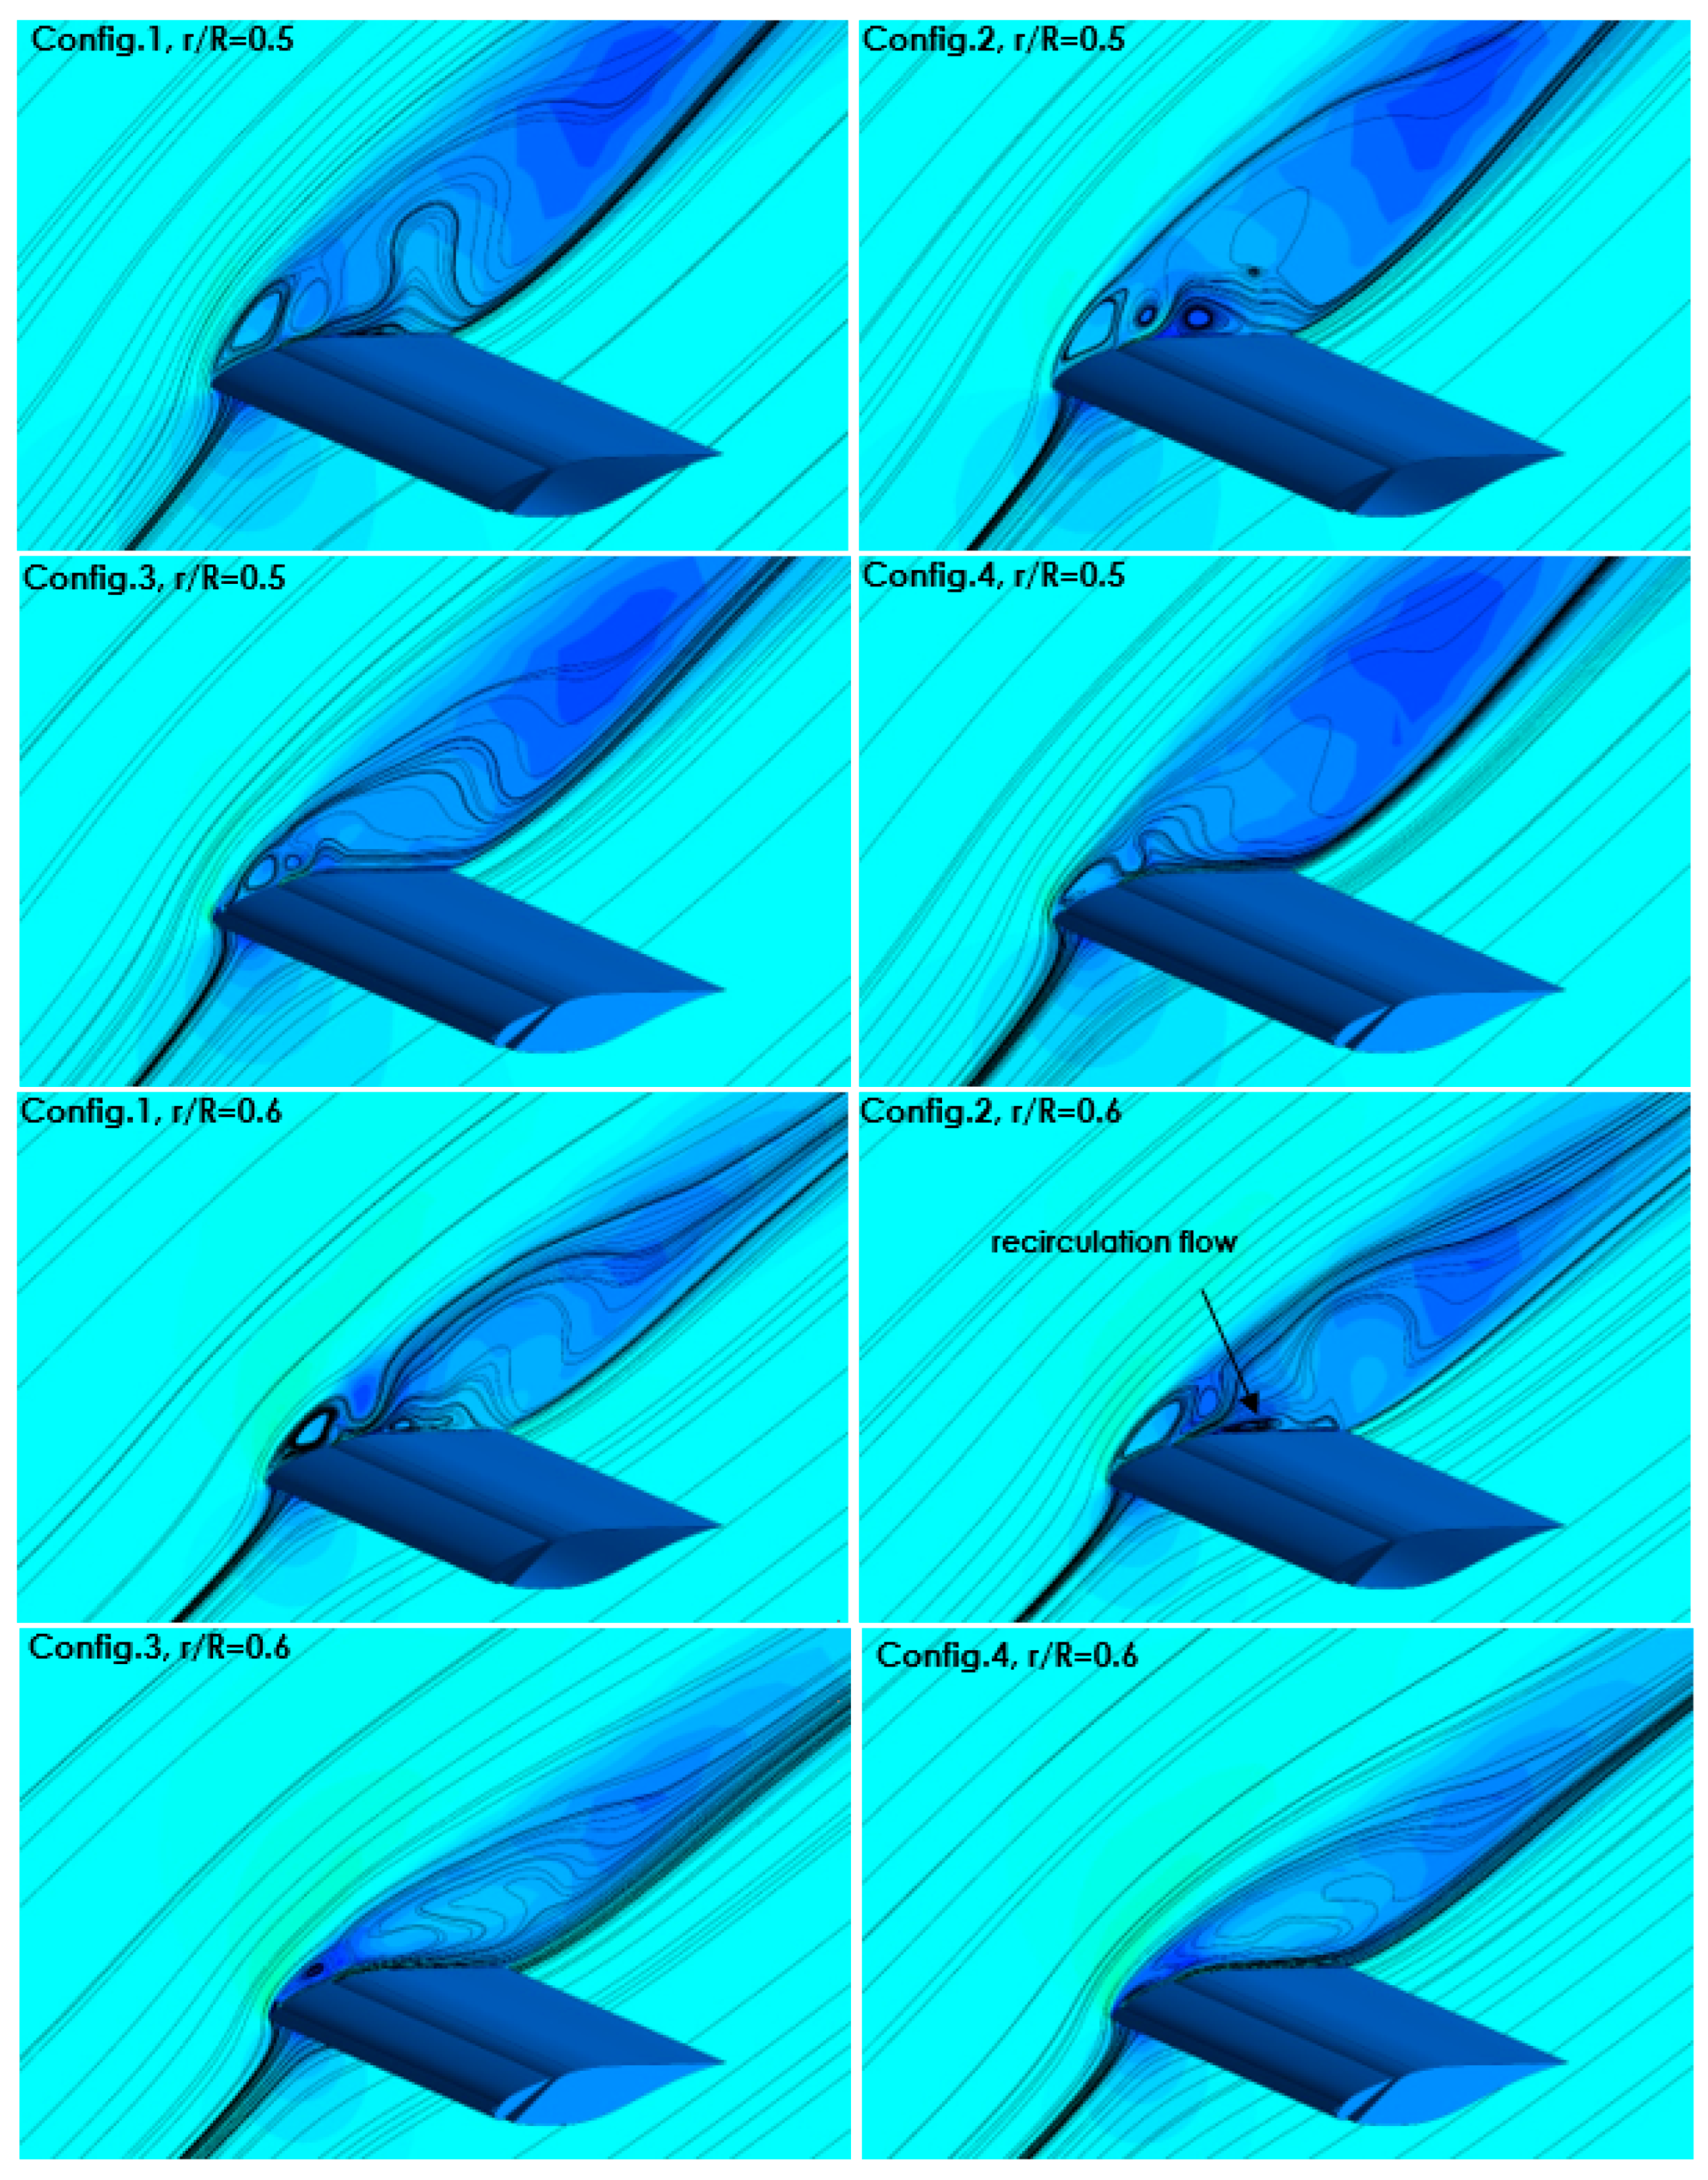
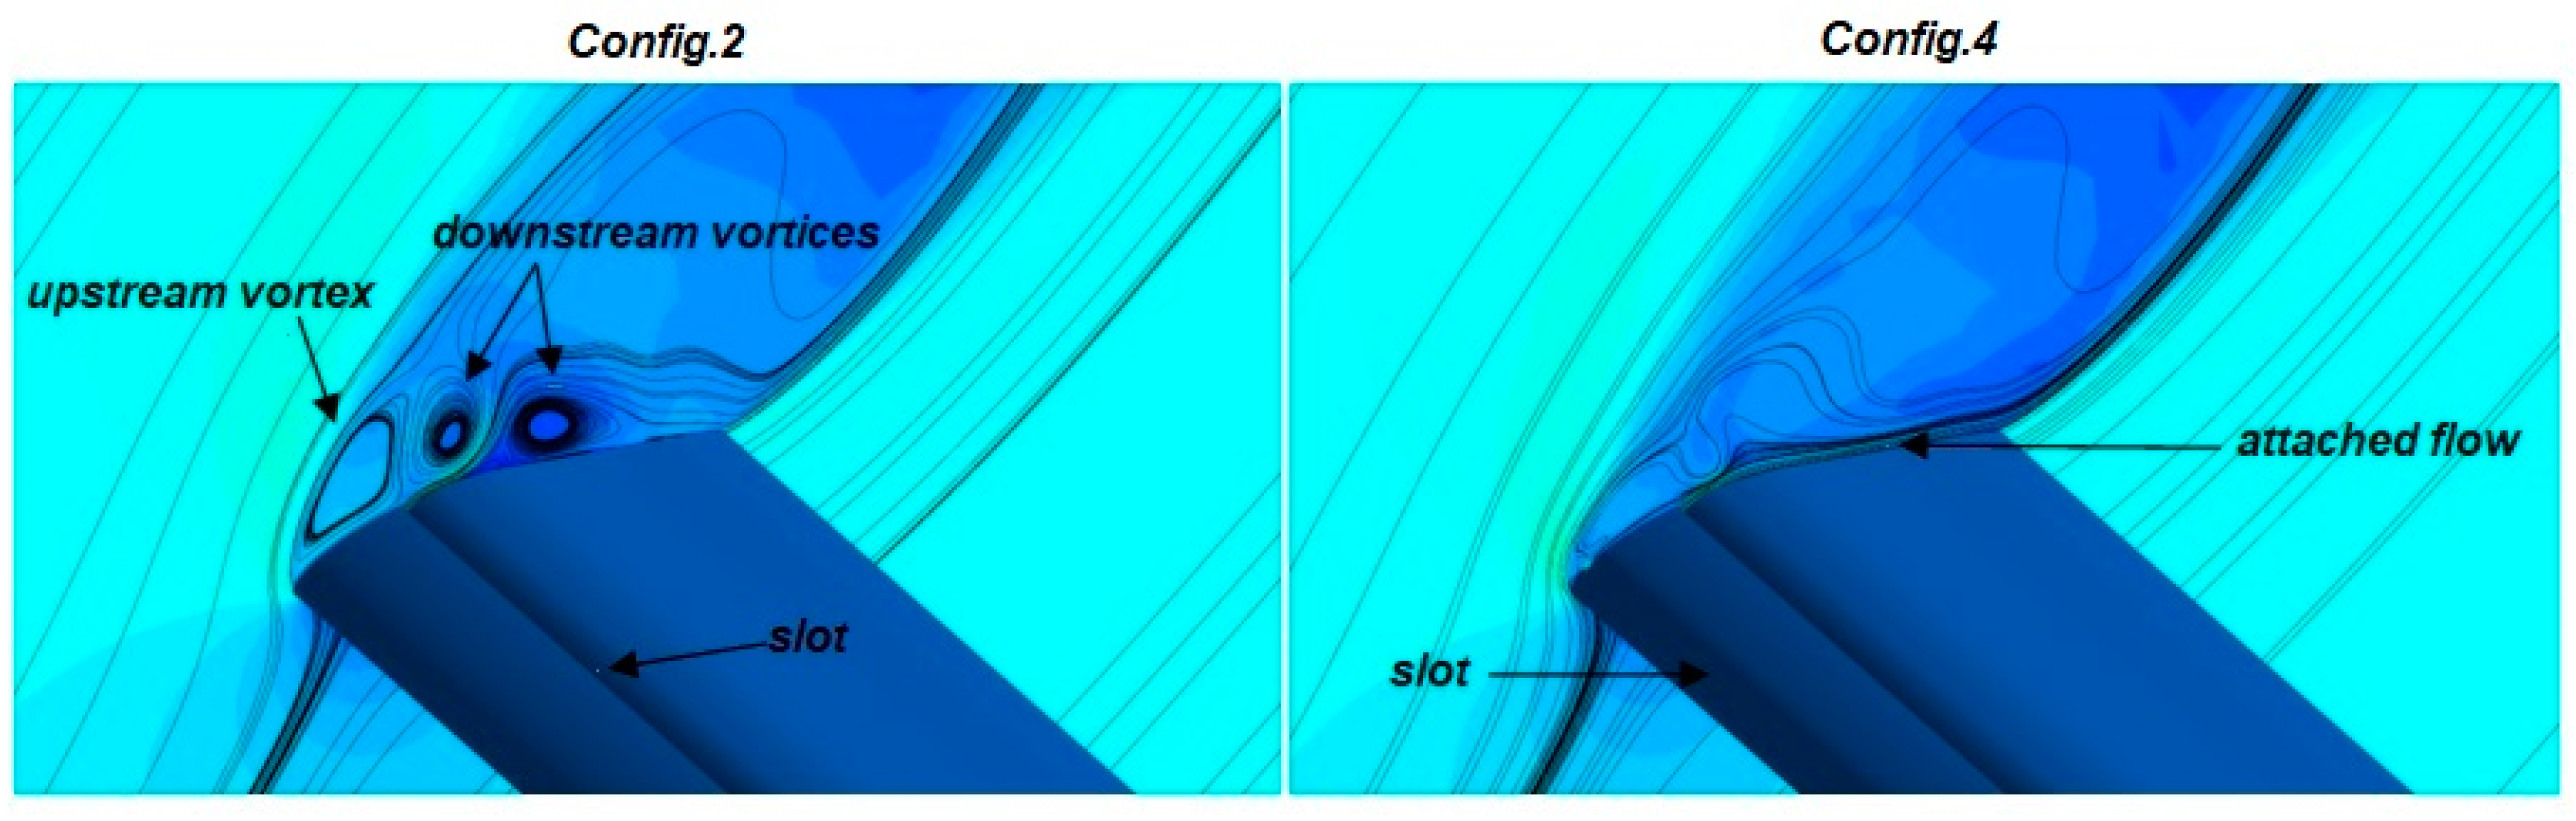
3.3.2. Two-Slots Control System Configurations
- (i)
- The fluid passing through the slot does not have sufficient kinetic energy to re-energize the dead fluid zone;
- (ii)
- The location of the slot in the middle of the separation zone and the upstream vortex (relative to the slot location X2 = 30%) affects the downstream flow (main flow).
4. Conclusions
- (i)
- A first method (active or passive) for the inboard region of the rotor that does not depend on the separation point of the boundary layer. In fact, in this region (up to 30 to 40% of the blade span), the separation begins from the leading edge. However, applying a control method that must be located just upstream of the separation point will not be effective in this case;
- (ii)
- A second control method with two slots is applied for the middle span and the outboard region.
Author Contributions
Funding
Institutional Review Board Statement
Informed Consent Statement
Data Availability Statement
Acknowledgments
Conflicts of Interest
Nomenclature
| AoA | Angle of Attack |
| SST | Shear Stress Transport |
| RANS | Reynolds-averaged Navier–Stokes |
| CFD | Computational Fluid Dynamics |
| R | Diameter |
| Cp | Pressure coefficient |
| L.E | Leading edge |
| T.E | Trailing edge |
| S.S | Suction side |
| P.S | Pressure side |
| S-S | Single slot |
| T-S | Two slots |
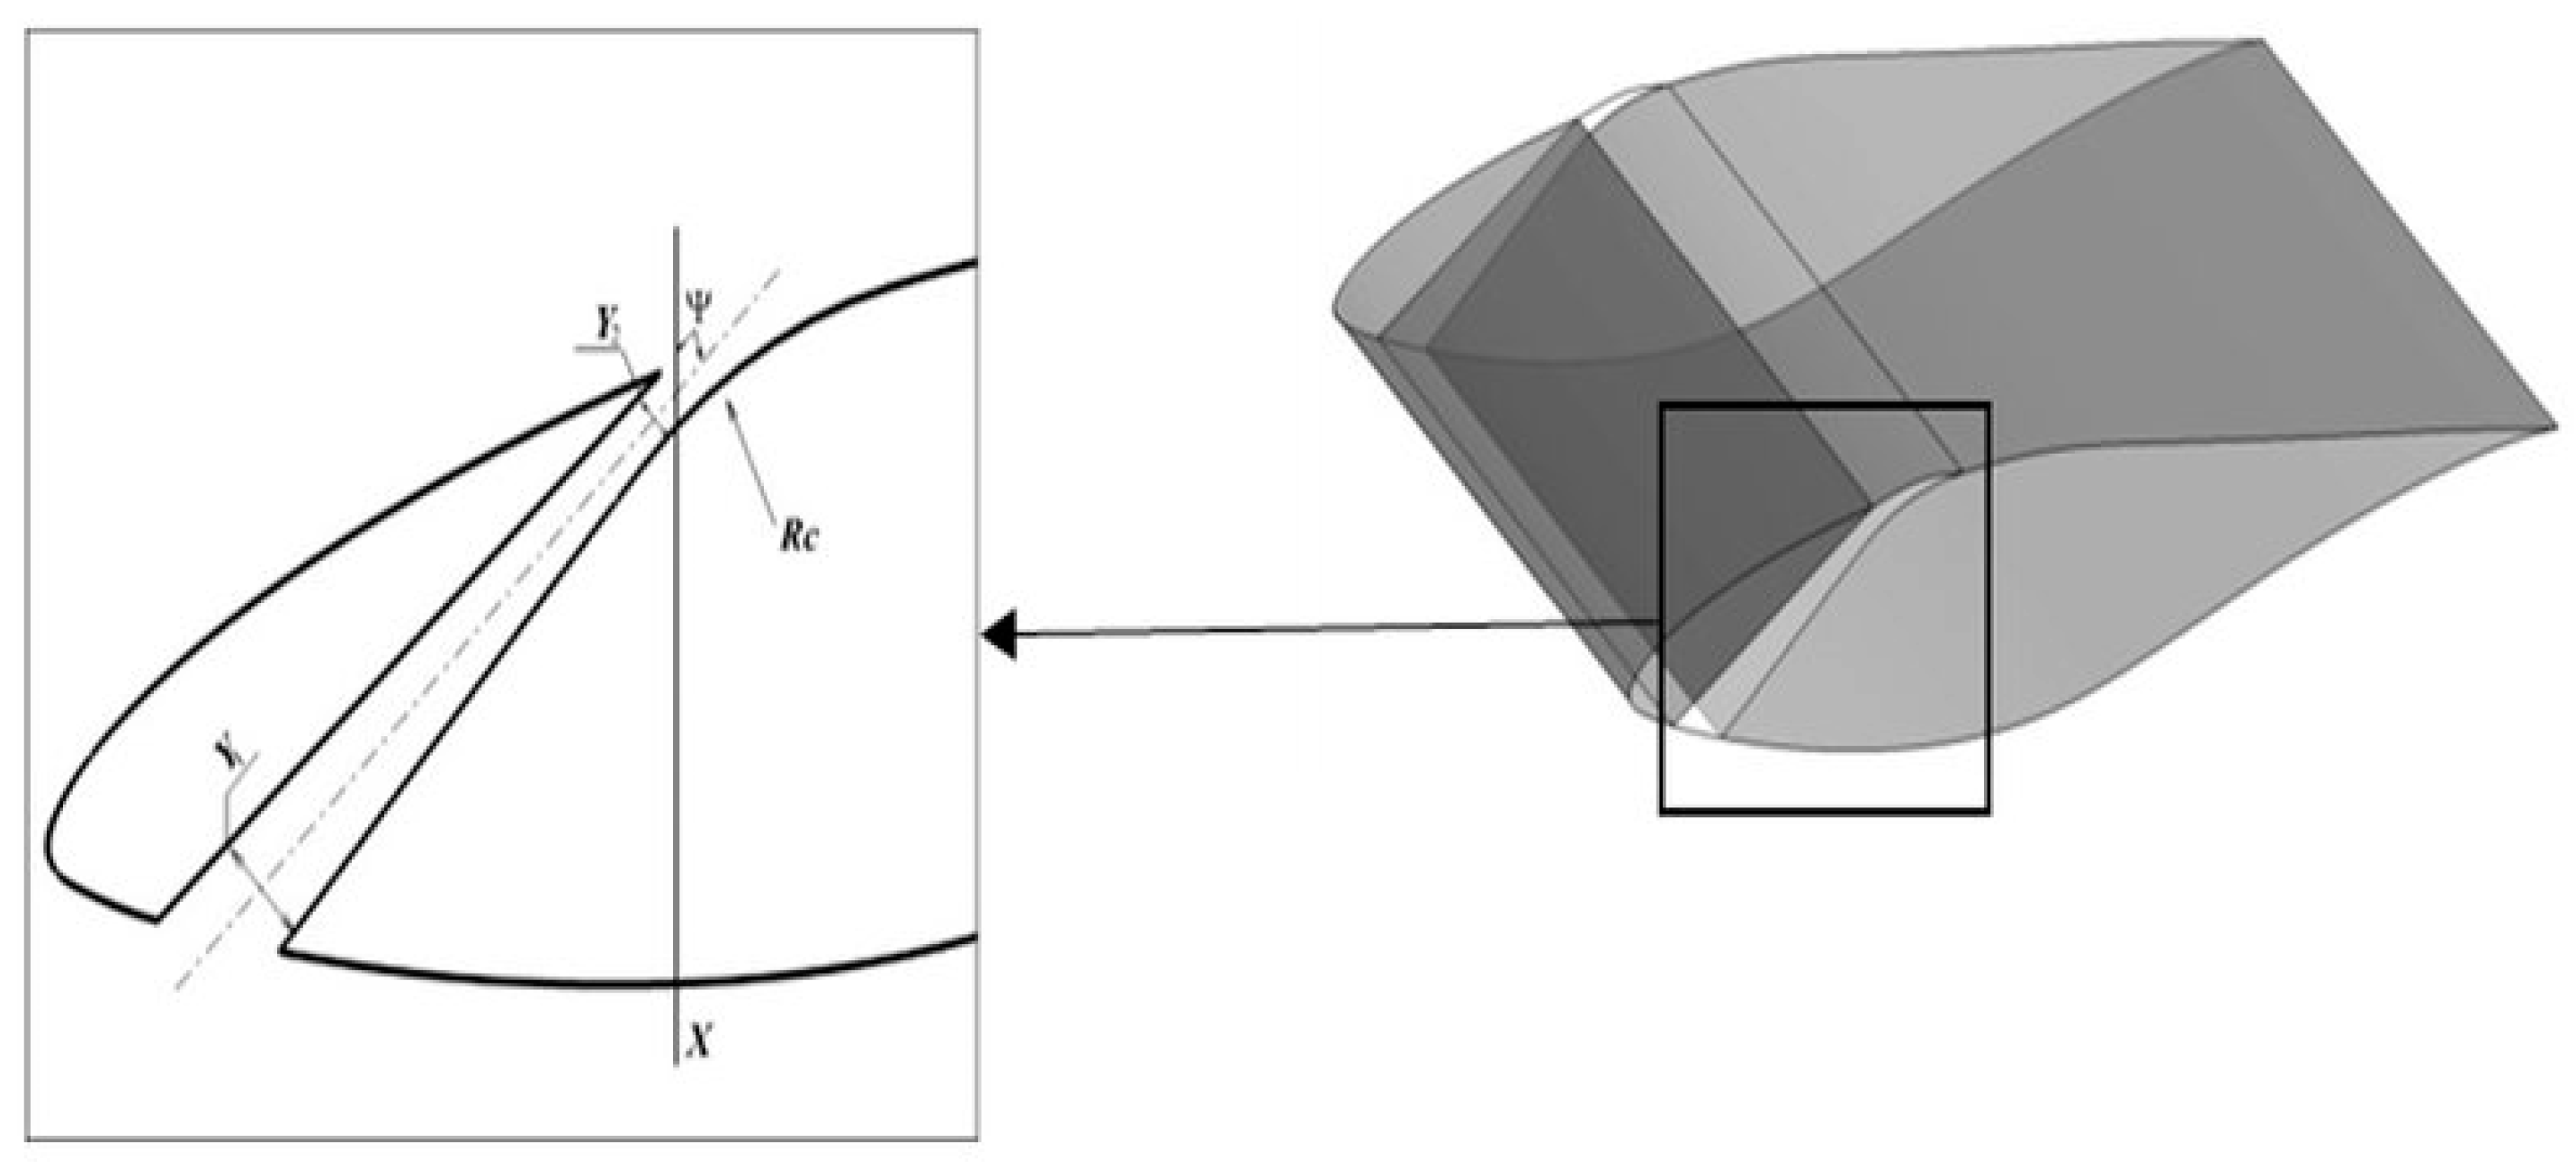
| X | Slot location |
| Y | Slot width |
| ψ | Slot slope |
| Rc | Coanda radius |
References
- Wang, Y.; Li, G.; Luo, D.; Huang, D. Influence of microcylinder with different vibration laws on the flow control effect of a horizontal axis wind turbine. Wind Energy 2019, 22, 1800–1824. [Google Scholar] [CrossRef]
- El-Hak, M.G.; Pollard, A.; Bonnet, J.P. Flow Control, Fundamentals and Practices; Springer: Berlin/Heidelberg, Germany, 1998. [Google Scholar]
- Kral, L.D. Active flow control technology. ASME Fluids Eng. Technol. Brief 2000, 53, 1–28. [Google Scholar]
- Prandtl, L. Ueber Fluessigkeitsbewegungen bei sehr Kleiner Reibung. 3; International Mathematical Congress: Heidelberg, Germany, 1904; p. 7. [Google Scholar]
- Bobonea, A. Unsteady computational simulation for active aerodynamic control of a horizontal axis wind turbine. AIP Conf. Proc. 2012, 1479, 1623–1626. [Google Scholar]
- Hosseini, S.S.; van Dam, C.P.; Pandya, S.A. Aerodynamic Load Control for Multi-Element Airfoils Using Surface-Normal Trailing-Edge Blowing. J. Aircr. 2019, 56, 1668–1676. [Google Scholar] [CrossRef]
- Rezaeiha, A.; Montazeri, H.; Blocken, B. Active flow control for power enhancement of vertical axis wind turbines: Leading-edge slot suction. Energy 2019, 189, 116131. [Google Scholar] [CrossRef]
- Luo, D.H.; Sun, X.J.; Huang, D.G.; Wu, G.Q. Flow control effectiveness of synthetic jet on a stalled airfoil. Proc. Inst. Mech. Eng. Part C J. Mech. Eng. Sci. 2011, 225, 2106–2114. [Google Scholar] [CrossRef]
- Yen, J.; Ahmed, N.A. Enhancing vertical axis wind turbine by dynamic stall control using synthetic jets. J. Wind Eng. Ind. Aerodyn. 2013, 114, 12–17. [Google Scholar] [CrossRef]
- Akhter, M.Z.; Omar, F.K. Review of Flow-Control Devices for Wind-Turbine Performance Enhancement. Energies 2021, 14, 1268. [Google Scholar] [CrossRef]
- Brunton, S.L.; Noack, B.R. Closed-Loop Turbulence Control: Progress and Challenges. Appl. Mech. Rev. 2015, 67, 050801. [Google Scholar] [CrossRef]
- Guoqiang, L.; Weiguo, Z.; Yubiao, J.; Pengyu, Y. Experimental investigation of dynamic stall flow control for wind turbine airfoils using a plasma actuator. Energy 2019, 185, 90–101. [Google Scholar] [CrossRef]
- Belamadi, R.; Djemili, A.; Ilinca, A.; Mdouki, R. Aerodyanmic performance analysis of slotted airfoil for application 482 to wind turbine blades. J. Wind Eng. Ind. Aerodyn. 2016, 151, 79–99. [Google Scholar] [CrossRef]
- Handley, P.F. Wing and Similar Member of Aircraft. U.S. Patent 1353666, 21 September 2021. [Google Scholar]
- Houghton, E.L.; Carpenter, P.W. Aerodynamics for Engineering Students; Elsevier: Amsterdam, The Netherlands, 2003. [Google Scholar]
- Ragheb, A.M.; Selig, M.S. Multielement Airfoils for Wind Turbines. In Wind Energy Engineering; Elsevier: Amsterdam, The Netherlands, 2017; pp. 203–219. [Google Scholar]
- Van Dam, C.P. The aerodynamic design of multi-element high-lift systems for transport airplanes. Prog. Aerosp. Sci. 2002, 38, 101–144. [Google Scholar] [CrossRef] [Green Version]
- Kentfield, J.A.C. Theoretically and experimentally obtained performances of Gurney-flap equipped wind turbines. In Proceedings of the Energy-Sources Technology Conference, New Orleans, LA, USA, 23–26 January 1994; pp. 31–40. [Google Scholar]
- Zhang, Y.; Ramdoss, V.; Saleem, Z.; Wang, X.; Schepers, G.; Ferreira, C. Effects of root Gurney flaps on the aerodynamic performance of a horizontal axis wind turbine. Energy 2019, 187, 11595. [Google Scholar] [CrossRef]
- Fernandez-Gamiz, U.; Errasti, I.; Zulueta, E.; Guede, J.M.L.; Boyano, A. Computational characterization of a Gurney flap on a DU91 (2) W250 airfoil. In MATEC Web of Conferences; EDP Sciences: Les Ulis, France, 2020; p. 01053. [Google Scholar]
- Meyer, R.; Hage, W.; Bechert, D.W.; Schatz, M.; Knacke, T.; Thiele, F. Separation Control by Self-Activated Movable Flaps. AIAA J. 2007, 45, 191–199. [Google Scholar] [CrossRef]
- Taylor, H.D. The Elimination of Diffuser Separation by Vortex Generators; United Air Craft Corporation Report No.R-4012-3; United Air Craft Corporation: Moscow, Russia, 1947. [Google Scholar]
- Wetzel, K.K.; Farokhi, S. Influence of Vortex Generators on NREL S807 Airfoil Aerodynamic Characteristics and Wind Turbine Performance. Wind Eng. 1995, 19, 157–165. [Google Scholar]
- Shan, H.; Jiang, L.; Liu, C.; Love, M.; Maines, B. Numerical study of passive and active flow separation control over a NACA0012 airfoil. Comput. Fluids 2008, 37, 975–992. [Google Scholar] [CrossRef]
- Zahle, F.; Sørensen, N.N.; Johansen, J. CFD Study of a NACA 63-415 Aerofoil Fitted with Stall Strips; Risø-R-1370; Risø National Laboratory, Pitney Bowes Management Services: Roskilde, Denmark, 2002. [Google Scholar]
- Timmer, W.A.; Van Rooij, R.P.J.O.M. Summary of the Delft University wind turbine dedicated airfoils. J. Sol. Energy Eng. 2003, 125, 488–496. [Google Scholar] [CrossRef]
- Handley, P.F. Wing and Similar Member of Aircraft. U.S. Patent 1,414,200, 24 October 1922. [Google Scholar]
- Lachmann, C.; Wieslsberger, C.; Katzmayr, R.; Kirste, L. Experiments with Slotted Wings; National Advisory Committee for Aeronautics: Washington, DC, USA, 1921. [Google Scholar]
- Weick, F.E.; Shortal, J.A. The Effect of Multiple Fixed Slots and a Trailing-Edge Flap on the Lift and Drag of a Clark Y Airfoil; NACA Report No.427; NASA: Washington, DC, USA, 1933; p. 6. [Google Scholar]
- Abbott, I.H.; von Doenhoff, A.E. Theory of Wing Sections; Dover Publications: Mineola, NY, USA, 1958. [Google Scholar]
- Rumsey, C.L.; Ying, S.X. Prediction of high lift: Review of present CFD capability. Prog. Aerosp. Sci. 2002, 38, 145–180. [Google Scholar] [CrossRef]
- Yavuz, T.; Koc, E.; Kaynak, B. Hydrodynamics performance of hydrofoil-slat arrangements in 3D analysis. Energy Convers. Manag. 2013, 75, 44–50. [Google Scholar] [CrossRef]
- Yavuz, T.; Koç, E.; Kılkış, B.; Erol, Ö.; Balas, C.; Aydemir, T. Performance analysis of the airfoil-slat arrangements for hydro and wind 542 turbine applications. Renew. Energy 2015, 74, 414–421. [Google Scholar] [CrossRef]
- Ullah, T.; Javed, A.; Abdullah, A.; Ali, M.; Uddin, E. Computational evaluation of an optimum leading-edge slat deflection angle for dynamic stall control in a novel urban-scale vertical axis wind turbine for low wind speed operation. Sustain. Energy Technol. Assess. 2020, 40, 100748. [Google Scholar] [CrossRef]
- Shi, X.; Sun, J.; Zhong, S.; Huang, D. Flow control of a stalled S809 airfoil using an oscillating micro-cylinder at different angles of attack. Renew. Energy 2021, 175, 405–414. [Google Scholar] [CrossRef]
- Wang, Y.; Li, G.; Shen, S.; Huang, D.; Zheng, Z. Investigation on aerodynamic performance of horizontal axis wind turbine by setting micro-cylinder in front of the blade leading edge. Energy 2018, 143, 1107–1124. [Google Scholar] [CrossRef]
- Luo, D.; Huang, D.; Sun, X. Passive flow control of a stalled airfoil using a microcylinder. J. Wind Eng. Ind. Aerodyn. 2017, 170, 256–273. [Google Scholar] [CrossRef]
- Liggett, N.; Smith, M.J. The physics of modeling unsteady flaps with gaps. J. Fluids Struct. 2013, 38, 255–272. [Google Scholar] [CrossRef]
- Ramzi, M.; AbedErrahmane, G. Passive control via slotted blading in a compressor cascade at stall condition. J. Appl. Fluid Mech. 2013, 6, 571–580. [Google Scholar]
- Bak, C.; Bitsche, R.; Yde, A.; Kim, T.; Hasen, M.H.; Zahle, F.; Gaunaa, M.; Wedel Heinen, J.J.; Behrens, T. Light rotor. In Proceedings of the 10MW Reference Wind Turbine EWEA Conference, Copenhagen, Denmark, 16–19 April 2012. [Google Scholar]
- Gaunaa, M.; Zahle, F.; Sørensen, N.N.; Bak, C. Quantification of the Effects of Using Slats on the Inner Part of a 10 MW Rotor. In Proceedings of the European Wind Energy Conference & Exhibition, EWEA, Copenhagen, Denmark, 16–19 April 2012. [Google Scholar]
- Standish, K.J. Aerodynamic Analysis of Blunt Trailing Edge Airfoils & A Microtab-Based Load Control System. Master’s Thesis, University of California, Davis, CA, USA, December 2003. [Google Scholar]
- Buhl, T.; Andersen, P.B.; Barlas, T.K. 2D Numerical Comparison of Trailing Edge Flaps up Wind WP1B3; Risoe-R No. 1628(EN); Risø National Laboratory, Forskningscenter Risoe: Roskilde, Denmark, 2007. [Google Scholar]
- Harris, F.D. Preliminary study of radial flow effects on rotor blades. J. Am. Helicopter Soc. 1966, 11, 1–21. [Google Scholar] [CrossRef]
- Sørensen, J.N. Prediction of the three-dimensional stall on wind turbine blade using three-level, viscous-inviscid interaction model. In Proceedings of the EWEC 86, Rome, Italy, 7–9 October 1986; pp. 429–435. [Google Scholar]
- Du, Z.; Selig, M.S. The effect of rotation on the boundary layer of a wind turbine blade. Renew. Energy 2000, 20, 167–181. [Google Scholar] [CrossRef]
- Shen, W.Z.; Sørensen, J.N. Quasi-3D Navier-Stokes model for a rotating airfoil. J. Comput. Phys. 1999, 150, 518–548. [Google Scholar] [CrossRef]
- Chaviaropoulos, P.K.; Hansen, M.O.L. Three-dimensional and rotational effects on wind turbine blades by means of a quasi-3D Navier-Stokes solver. J. Fluid Eng. 2000, 122, 330–336. [Google Scholar] [CrossRef]
- Hu, D.; Hua, O.; Du, Z. A study on stall-delay for horizontal axis wind turbine. Renew. Energy 2006, 31, 821–836. [Google Scholar] [CrossRef]
- Cravero, C.; Leutcha, P.J.; Marsano, D. Simulation and Modeling of Ported Shroud Effects on Radial Compressor Stage Stability Limits. Energies 2022, 15, 2571. [Google Scholar] [CrossRef]
- Margalida, G.; Joseph, P.; Roussette, O.; Dazin, A. Active flow control in an axial compressor for stability improvement: On the effect of flow control on stall inception. Exp. Fluids 2021, 62, 12. [Google Scholar] [CrossRef]
- Butterfield, C.P.; Musial, W.P.; Simms, D.A. Combined Experiment Final Report—Phase II; NREL TP-422-4807; National Renewable Energy Laboratory: Golden, CO, USA, 1992. [Google Scholar]
- Burton TSharpe DJenkins, N.; Bossanyi, E. Wind Energy Handbook; John Wiley & Sons Ltd.: Chichester, UK, 2001. [Google Scholar]
- ANSYS Inc. Ansysfluent Theory Guide; ANSYS Inc.: Canonsburg, PA, USA, 2010. [Google Scholar]
- Sorensen, N.N.; Michelsen, J.A. Aerodynamic predictions for the unsteady aerodynamics experiment phase-ii rotor at the national renewable energy laboratory. In Proceedings of the 2000 ASME Wind Energy Symposium, Reno, NV, USA, 10–13 January 2000. AIAA-2000-0037. [Google Scholar]
- Maskell, E.C. Flow Separation in Three-Dimension; Royal Aircraft Establishment: Farnborough, UK, 1955. [Google Scholar]


| Number of blades | 3 |
| Rotor diameter | 10.06 m |
| RPM | 72 rpm |
| Rotor location | Downwind |
| Root extension | 0.723 m |
| Pitch angle | 12° |
| Blade profile | S809 |
| Twist angle | 0° |
| Boundary Conditions | Position |
|---|---|
| Velocity inlet | 2R upstream of the blade |
| symmetry | Outer cylinder at 3R |
| Wall (no-slip) | blade |
| Wall (Euler-slip) | |
| Periodic | At 120° |
| Pressure outlet | 2R downstream of the blade |
| Computed AoA [°] | |||
|---|---|---|---|
| Section r/R | 7 m s−1 | 13 m s−1 | 19 m s−1 |
| 0.3 | 18.86 | 33.99 | 45.46 |
| 0.47 | 8.10 | 22.04 | 33.59 |
| 0.63 | 3.77 | 15.52 | 25.55 |
| 0.80 | 1.20 | 9.40 | 19.27 |
| Wind Speed | Measured Power [kW] | Computed Power [kW] | Error % |
|---|---|---|---|
| 7 | 2.54 | 2.43 | 4.33 |
| 13 | 12.97 | 12.35 | 4.78 |
| 19 | 18.60 | 15.37 | 17.36 |
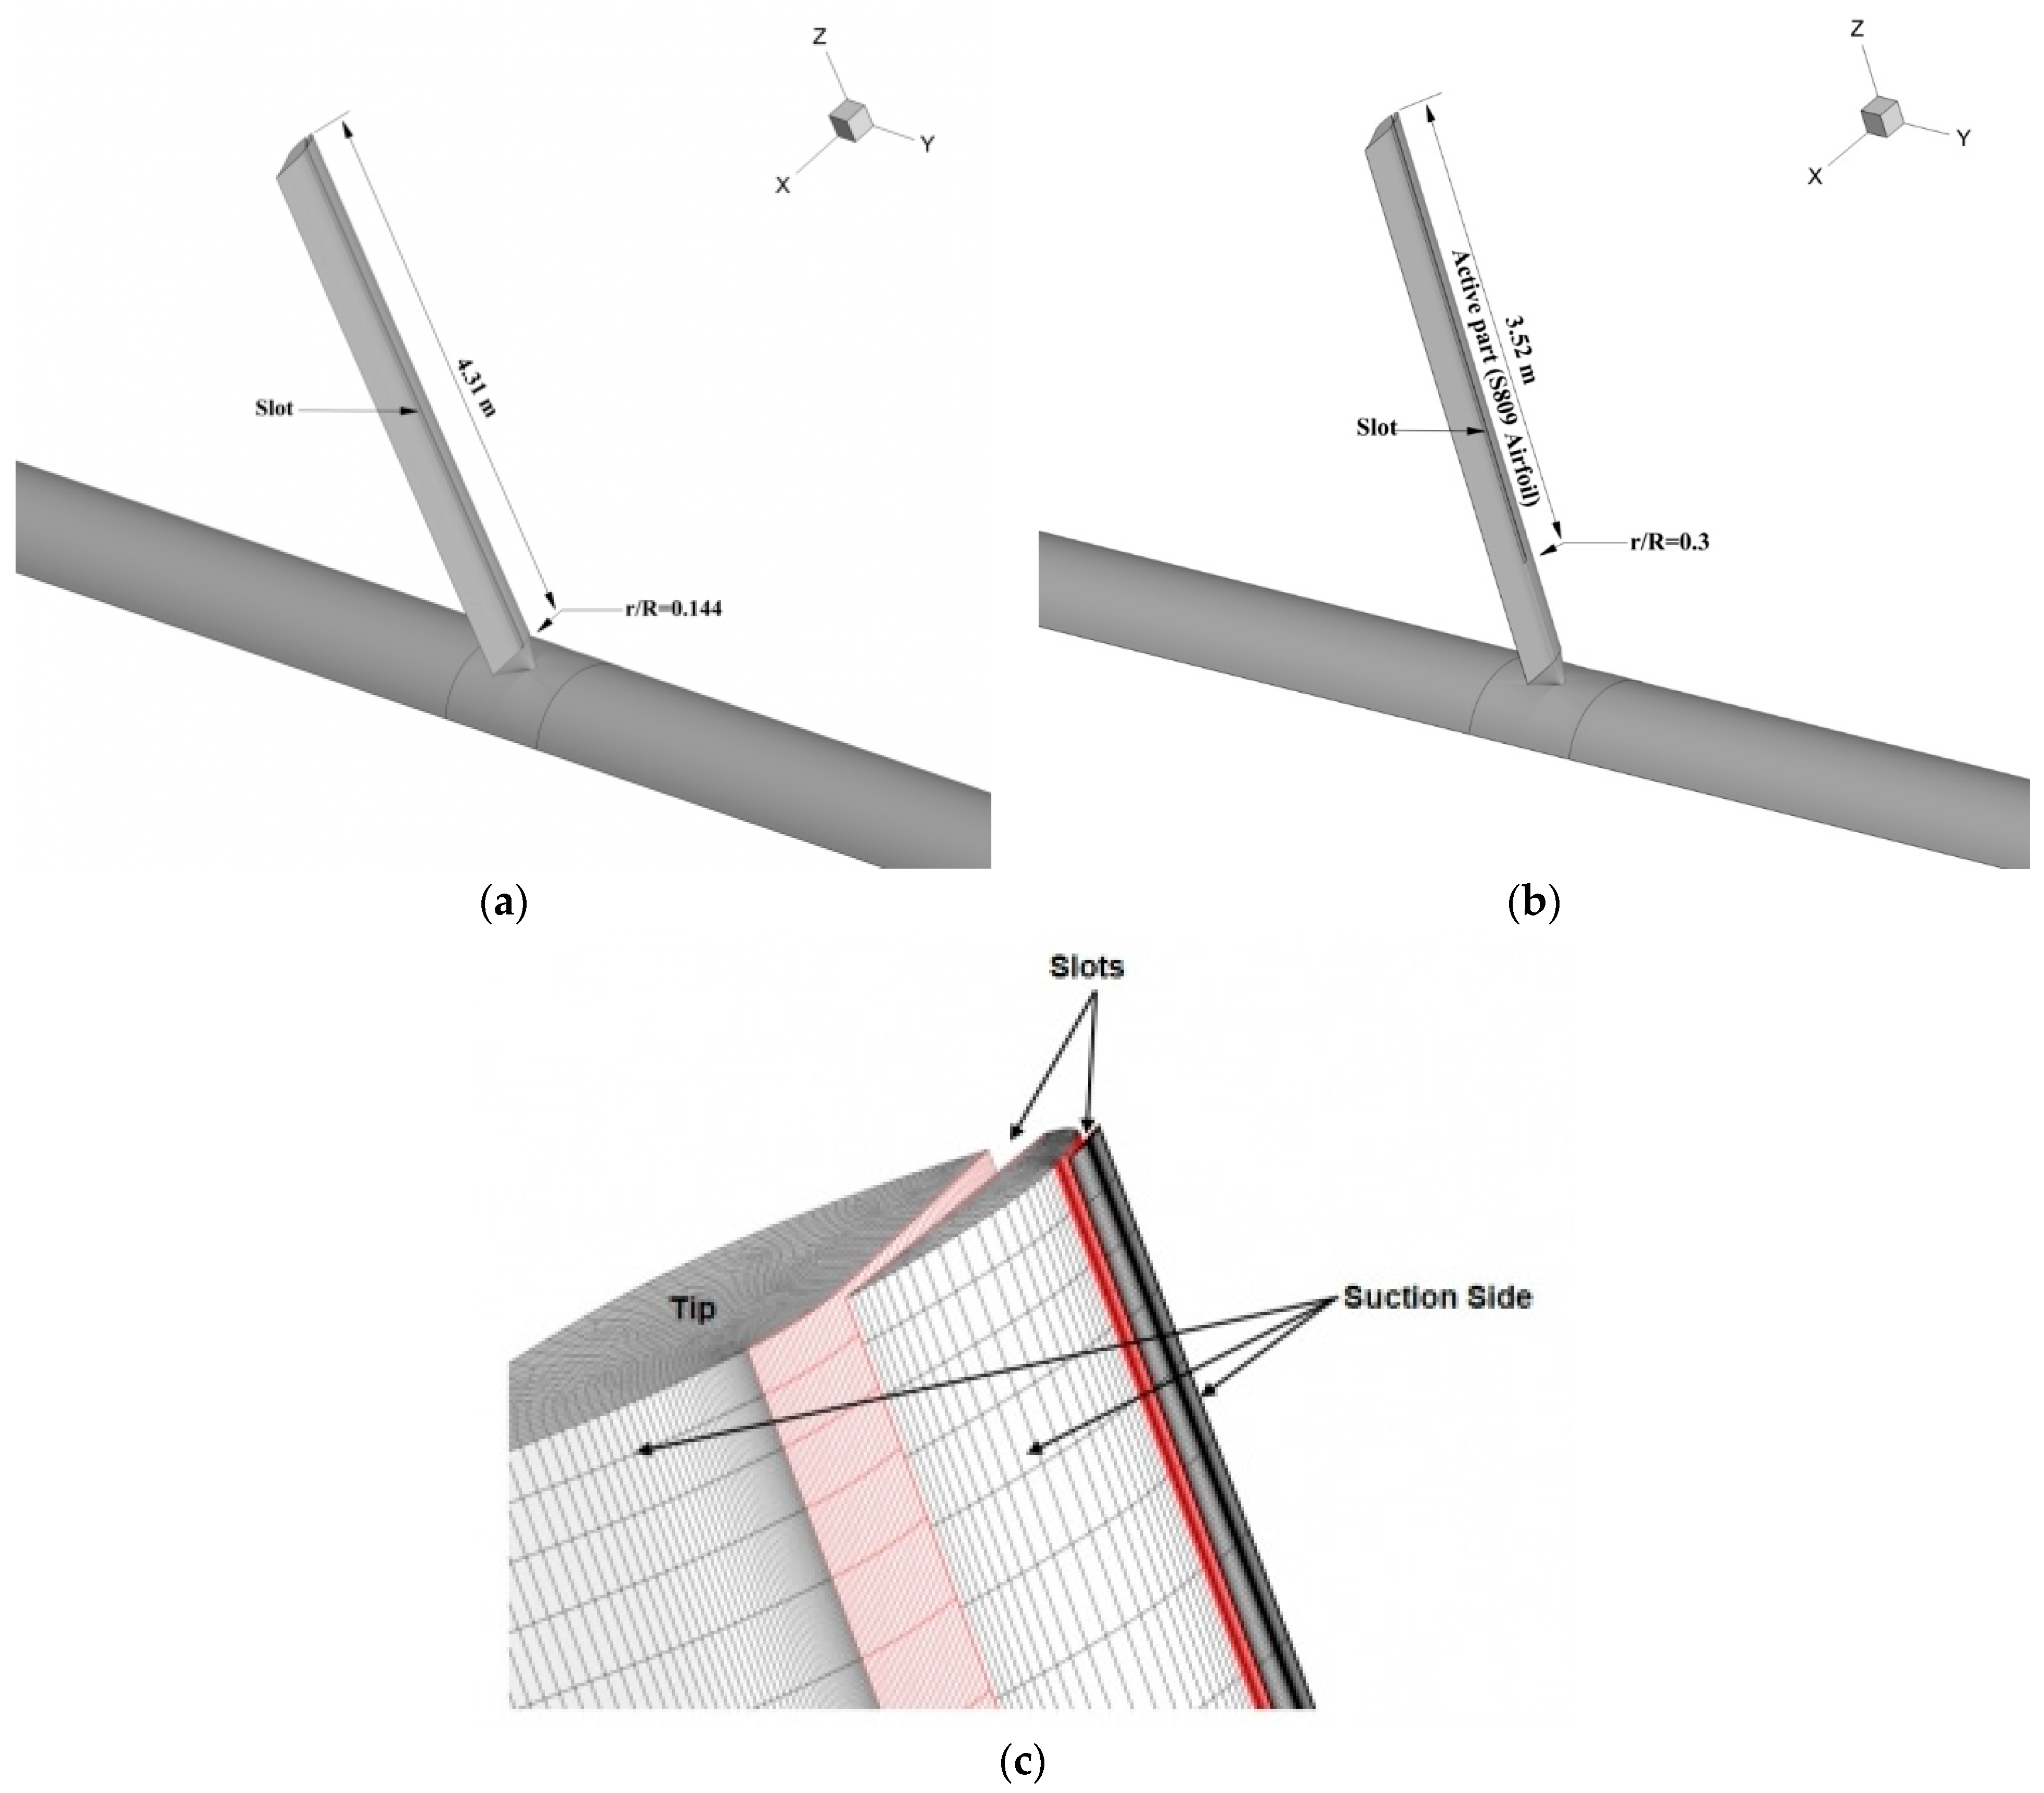
| Configuration 1 | Single-slot from r/R = 0.144 to blade tip (whole blade) |
| Configuration 2 | Single-slot from r/R = 1.509 to blade tip (active part) |
| Configuration 3 | Two-slots from r/R = 1.509 to blade tip (active part) |
| Configuration 4 | Two-slots slot from r/R = 0.144 to blade tip (whole blade) |
Publisher’s Note: MDPI stays neutral with regard to jurisdictional claims in published maps and institutional affiliations. |
© 2022 by the authors. Licensee MDPI, Basel, Switzerland. This article is an open access article distributed under the terms and conditions of the Creative Commons Attribution (CC BY) license (https://creativecommons.org/licenses/by/4.0/).
Share and Cite
Belamadi, R.; Settar, A.; Chetehouna, K.; Ilinca, A. Numerical Modeling of Horizontal Axis Wind Turbine: Aerodynamic Performances Improvement Using an Efficient Passive Flow Control System. Energies 2022, 15, 4872. https://doi.org/10.3390/en15134872
Belamadi R, Settar A, Chetehouna K, Ilinca A. Numerical Modeling of Horizontal Axis Wind Turbine: Aerodynamic Performances Improvement Using an Efficient Passive Flow Control System. Energies. 2022; 15(13):4872. https://doi.org/10.3390/en15134872
Chicago/Turabian StyleBelamadi, Riyadh, Abdelhakim Settar, Khaled Chetehouna, and Adrian Ilinca. 2022. "Numerical Modeling of Horizontal Axis Wind Turbine: Aerodynamic Performances Improvement Using an Efficient Passive Flow Control System" Energies 15, no. 13: 4872. https://doi.org/10.3390/en15134872
APA StyleBelamadi, R., Settar, A., Chetehouna, K., & Ilinca, A. (2022). Numerical Modeling of Horizontal Axis Wind Turbine: Aerodynamic Performances Improvement Using an Efficient Passive Flow Control System. Energies, 15(13), 4872. https://doi.org/10.3390/en15134872