Abstract
Buildings are becoming more data-rich. Building analytics tools, including energy information systems (EIS) and fault detection and diagnostic (FDD) tools, have emerged to enable building operators to translate large amounts of time-series data into actionable findings to achieve energy and non-energy benefits. To expedite data analytics adoption and facilitate technology innovation, building owners, technology developers, and researchers need reliable cost–benefit data and evidence-based guidance on deployment practices. This paper fulfills these needs with the energy use and survey data from a wide-ranging research and industry partnership program that covers thousands of buildings installed with analytics tools. The paper indicates that after two years of implementation, organizations using FDD tools and EIS tools achieved 9% and 3% median annual energy savings, respectively. The median base cost and annual recurring cost for FDD are USD 0.65 per square meter (m2) (USD 0.06 per square foot [ft2]) and USD 0.22 per m2 (USD 0.02 per ft2), and are USD 0.11 per m2 (USD 0.01 per ft2) and USD 0.11 per m2 (USD 0.01 per ft2) for EIS. The common metrics and analyses that are used in the tools to support the discovery of energy efficiency measures are summarized in detail. Two best practice examples identified to maximize the benefits of tool implementation are also presented. Opportunities to advance the state of technology include simplified data integration and management, and more efficient processes for acting on analytics outputs. Compared with previous efforts in the literature, the findings presented in this paper demonstrate the effectiveness of building analytics tools with the largest known dataset.
1. Introduction
1.1. Background and Motivation
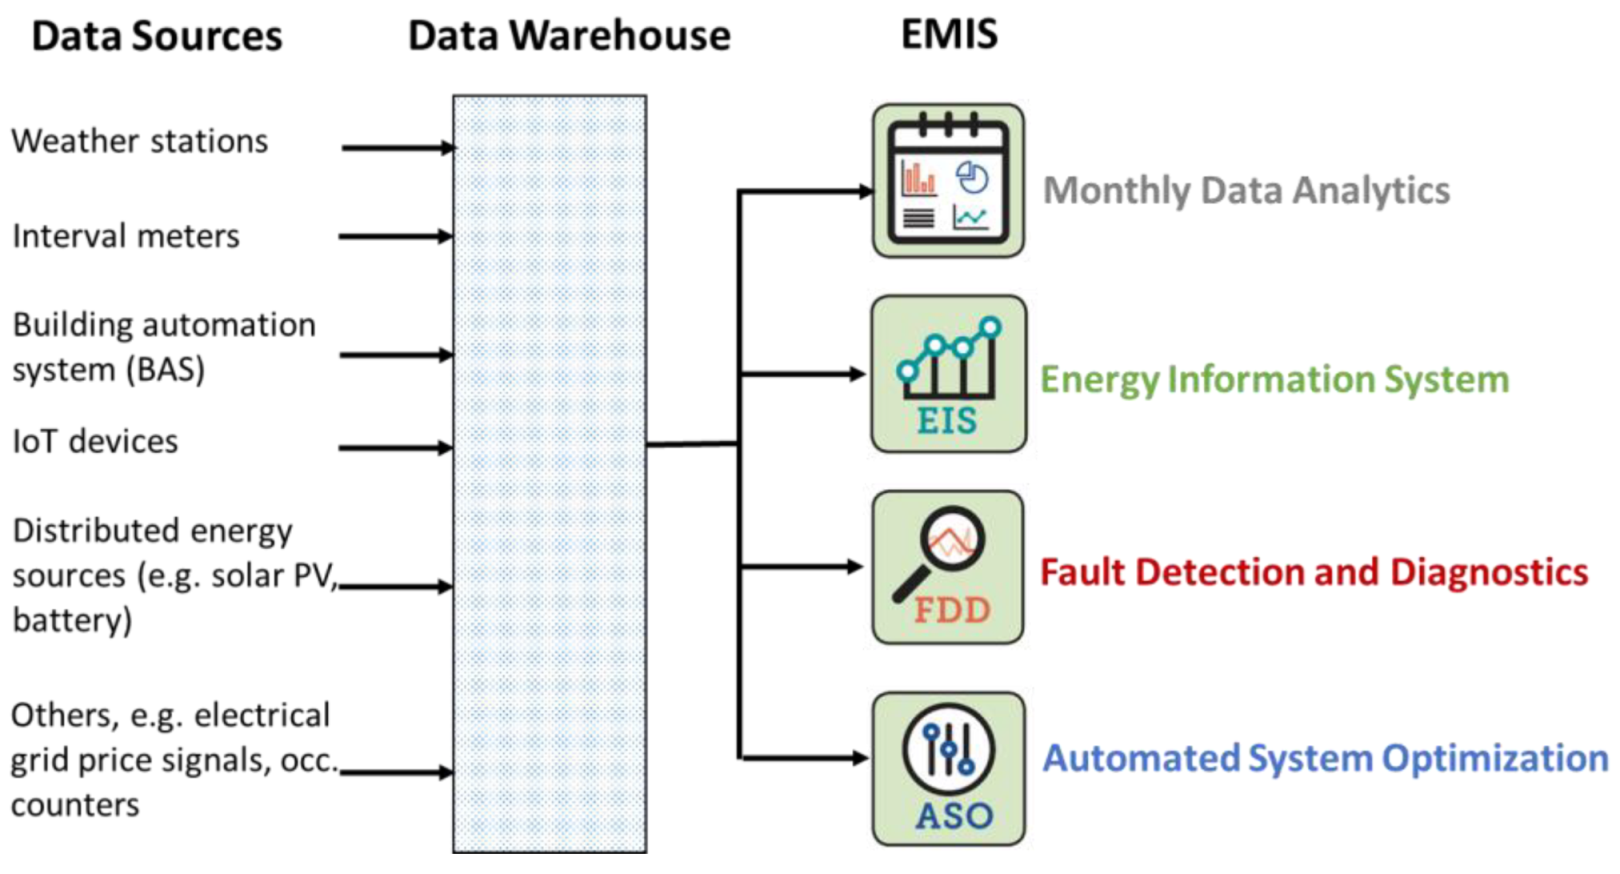
With the increasing penetration of building monitoring systems in commercial buildings, facilities teams have access to unprecedented volumes of data. To unlock the value of data for operational benefits and energy savings potential in buildings, the data must be stored, organized, and analyzed in ways that lead to insights and corrective actions. Analytic software can be applied to everyday building operations to uncover this energy savings potential and to realize cost savings through improved energy management. Building analytics tools are software tools that consist of a broad range of analytics capabilities for commercial building energy management. They are part of the family of smart building software technologies referred to as Energy Management and Information Systems (EMIS) (Figure 1) [1] and are used to improve building operation efficiency by organizing, visualizing, and analyzing operational data. The data integrated into the building analytics tools primarily comes from interval meters and/or building automation systems (BAS), which are utilized to control heating, ventilation, and air conditioning (HVAC) systems for maintaining indoor temperature and ventilation conditions. Other data sources such as weather data, internet of things (IoT) sensors, occupancy counters, electrical grid price signals, or distributed energy resources data may also be integrated into the tool to support its analytical capabilities. Currently, there are two main types of building analytics tools: (1) energy information systems (EIS) and (2) fault detection and diagnostics (FDD) tools. A few building analytics tools include both EIS and FDD capabilities in their software.

Figure 1.
The family of Energy Management and Information Systems.
- Energy information systems: This software is used to monitor, analyze, and visualize energy meter data at hourly or higher resolution, to highlight operational inefficiencies. Example analytics include time-series load profiling, energy benchmarking, peak load analysis, and energy anomaly detection.
- Fault detection and diagnostics tools: This software automatically detects faults and suboptimal performance of building mechanical systems and assists users to diagnose potential root causes. FDD tools primarily use BAS trend data and are usually managed as an individual software application. It provides information about the frequency and duration of faults and/or diagnoses to the users in a position to act to remedy them. Example faults are stuck or leaky valves and dampers, equipment being used outside of intended hours of operation, and excessive outdoor air intake. The FDD tool may also provide additional information, such as ranking/prioritizing identified faults by energy, cost, or maintenance impacts.
Commercially available EIS appeared in the United States more than 20 years ago [2]. EIS options have increased in the past decade, driven by energy related building regulations in the United States, which include basic requirements for smart metering and energy reporting. For instance, the Energy Policy Act 2005 and the Energy Independence and Security Act of 2007 required hourly interval meter data to be collected daily in federal buildings. ASHRAE 90.1 Standard-2013 has incorporated a variety of smart metering requirements for commercial buildings over 2,323 square meters (25,000 square feet [ft2]) in size. ASHRAE requires that the energy of each building shall be recorded at least hourly, and that the system be capable of keeping 36 months’ energy data stored and create energy reports showing annual, monthly, daily, and hourly energy consumption and demand [3].
The research and development of FDD approaches for building HVAC systems has been active since the 1990s [4,5]. The International Energy Agency Annex 34 report [6] documented the development and testing of FDD tools in real buildings and discussed the potential for commercial exploitation. The 2005 review [7] indicated that there were few commercial FDD tools, and the tools that did exist were specialized or not in a fully automated manner. In the past 10–15 years, the technology has matured to a level where many commercial FDD products and services are available to the building community [5,8].
A few studies show that building analytics tools, including EIS and FDD, are promising technologies that can enable persistent energy and cost savings and a reduction in service calls [9,10,11]. Regarding the current state of building analytics tools, EIS and FDD tools are considered to be in the early adoption stage, though there has been significant growth in adoption over the past decade among large commercial building owners. Broader building analytics adoption is hampered by insufficient information on the energy cost savings possible from the tools, technology costs, and the current deployment practices of utilizing building analytics tools in commercial buildings.
1.2. Related Work, Knowledge Gaps, and Study Contributions
Energy and cost savings, as well as cost effectiveness, are often key factors in the decision to apply a building analytics tool. Two recent studies addressed related topics: in [8], 14 FDD technologies were studied and their functionalities and features were characterized; in [12], the features available for FDD to packaged rooftop units in the market were described. However, neither study included quantification of costs or benefits. Table 1 summarizes case studies documenting costs and savings of EIS and FDD technologies in real-world applications. Most studies only reported savings from one to dozens of buildings. Only a few past studies include cost-effectiveness analysis, and there is a general scarcity of published software cost data. In addition, most of the recent studies of building analytics tools focus on new analytics approaches, such as the energy anomaly detection method based on daily energy consumption patterns for central air conditioning systems [13], building energy consumption prediction [14], and data-driven FDD methods [15]. Little information was provided in the literature on the current state of technology applications in actual commercial buildings; for example, addressing questions such as who the users are, what common analytics are used, what actions facility operators have taken utilizing the information provided by EIS and FDD, and what best practices examples achieve the maximum value. Therefore, there are research gaps in providing reliable savings, costs, and cost–benefit data, along with current deployment practices from a large-scale assessment of building analytics tool applications. Specifically, there are needs to answer the following three research questions to increase adoption and facilitate technology innovation:

Table 1.
Case studies that present results of savings, technology costs, and simple payback time.
- What are the energy- and cost-savings benefits of a building analytics tool?
- What are the technology costs of a building analytics tool?
- What is the current state of technology application in U.S. buildings?
In order to comprehensively answer the above research questions on benefits, costs, and deployment practices of building analytics tools, this paper draws data from a research and industry partnership program, the Smart Energy Analytics Campaign (which took place during 2016–2020) and a prior EIS study [11]. The Smart Energy Analytics Campaign engaged with users of a wide variety of building analytics tools to gain a deeper understanding of how these tools were utilized to achieve energy savings. The Campaign offered technical support to assist commercial building owners implement EIS and FDD, and also conferred recognition on owners with exemplary deployments. In return, Campaign participants submitted data on technology costs, energy use before/after installation of building analytics tools, measures implemented with the support of the tools, and qualitative data on tool characteristics and usage. The campaign received data from 104 organizations across the United States. The 104 organizations represent more than 6500 buildings with a total commercial floor area of more than 52.7 million m2 (567 million ft2). In addition to the campaign data, the energy savings and costs of nine organizations (1700 buildings) using EIS from the prior study [11] were included in this study. Due to methodological similarity between the two studies, it was possible to combine the data into a larger dataset that enabled more conclusive findings.
This paper makes three main contributions to the existing body of knowledge: (1) The paper documents the annual energy savings of EIS and FDD based on the measured energy consumption before and after the tool adoption in thousands of U.S. buildings. (2) The paper synthesizes the costs of building analytics tool projects in the categories of the base technology costs, the annual recurring technology costs, and the in-house labor costs, based on the data reported by tool users, and also presents the technology’s cost-effectiveness in terms of simple payback period. (3) The paper illustrates the current deployment practices in commercial buildings. It summarizes the most common energy efficiency measures (EEMs) implemented by building owners in response to the insights gained from building analytics tools. It also highlights the best practices employed to maximize benefits and reveals the research needs to streamline the technology adoption and enhance the technology performance. The results provided in this paper demonstrate the effectiveness of building analytics tool application in wide-ranging actual buildings.
2. Methodology
The results in this paper are derived from information and data collected from organizations with EIS and/or FDD. The study data originates from two primary sources:
- Survey data: Quantitative data from organizations with building analytics tools were updated annually, including building area, annual energy consumption, and technology costs. Participants reported qualitative information including the type of building analytics tool, how the tool was used, and the most frequently adopted EEMs.
- Periodic interviews: Organization staffs were interviewed to better understand their technology implementation. In addition, they were invited to attend in technical support activities. The research needs to advance the current state of technology were identified using the knowledge learned from these activities.
The organizations in the study include nine different market sectors (80% of participants are office and higher education; others include healthcare, K-12 schools, retail and grocery, and more), and with a wide range of portfolio sizes. The most common portfolio size was between 91,000 m2 (1 million ft2) and 460,000 m2 (5 million ft2). The median building size with EIS installed was 8,500 m2 (91,000 ft2), and with FDD installed was 14,000 m2 (155,000 ft2). The median number of buildings per organization installed with EIS was 27 and installed with FDD was 8.
Among 94 organizations, 41 organizations (44%) implemented solely EIS, 21 organizations (23%) utilized FDD software, and the remaining 31 organizations (33%) installed tools with combined EIS and FDD analytics. Organizations with both EIS and FDD inclined to emphasize the FDD functionality due to the detailed recommendations provided. Therefore, FDD and EIS + FDD categories were combined for the savings and costs analysis as category FDD, described in Section 2.1 and Section 2.2. In total, building analytics tools from more than 40 vendors were applied in this study.
2.1. Energy and Cost Savings
Campaign participants reported annual energy consumption before and after technology installation for buildings with active use of analytics tools, and the data was used to derive estimated energy savings. These energy savings are achieved because of multiple EEMs and projects including, but not limited to, use of building analytics tools. Energy savings were determined in one of three ways:
- Annual energy use analysis: Baseline year (pre-installation) energy consumption was compared to each year of energy consumption after analytics implementation. For organizations using ENERGY STAR® Portfolio Manager [20], weather normalized energy usage data were gathered through standard ENERGY STAR reports. If there were no ENERGY STAR Portfolio Manager data, the difference in energy consumption was not weather normalized. In this study, forty-four organizations’ energy savings were calculated using this approach.
- Interval data analysis: Baseline year interval meter data were used to establish a building energy use model. Actual energy use after analytics implementation was subtracted from expected energy use (as determined by the baseline model), to determine energy savings. This approach aligns with the International Performance Measurement and Verification Protocol Option C methodology (avoided energy consumption) [21]. Four organizations’ energy savings were reported using this method.
- Engineering calculations: This method may use BAS trending data or short-term measurements, in combination with engineering assumptions, to inform development of spreadsheet calculations. Two organizations’ energy savings were estimated using this approach.
Annual energy cost savings were calculated by multiplying the annual energy savings by the average cost per unit energy—a blended cost per unit of 0.078 USD/kilowatt-hours (kWh). The blended cost is a combined fuels aggregation with electricity accounting for 65% of consumption and natural gas accounting for 35% based on a national average commercial building energy use breakdown [22]. The national average commercial sector fuel price for electricity is 0.106 USD/kWh [23] and for natural gas is 0.026 USD/kWh [24].
2.2. Costs
In the United States, commercial building analytics tools are most usually delivered as a software-as-a-service (SaaS) offering [8]. The technology costs consist of a single base cost and an annual recurring cost. In addition, on-site staff are needed to support technology installation and ongoing use. Understanding internal labor costs is important to make sure full cost impacts are not underreported. Therefore, technology costs, as well as the in-house labor time commitments, were gathered in the following categories:
- Base technology costs: These are costs for the software installation and configuration, covering service provider and vendor costs. They do not cover additional hardware costs such as adding sensors, meters, or data servers during the project.
- Annual recurring technology costs:
- ○
- Annual software cost: This is the recurring annual charge for a software license, or SaaS fees.
- ○
- Annual ongoing monitoring-based commissioning (MBCx) service provider cost: This is the average annual cost a third-party consultant charges for assistance in analyzing and taking actions upon analytics findings.
- In-house labor costs:
- ○
- Technology installation and configuration: This is the estimated total hours spent by organization staff to assist tool installation and configuration.
- ○
- Ongoing technology use: This is the estimated average hours spent per year by organization staff to review analytics findings, identify opportunities for operation improvement, and implement EEMs.
2.3. Simple Payback Period
The installation of analytics software enables but does not directly create savings. The savings are realized with the execution of the EEMs based on analytics recommendations (i.e., the faulty or inefficient operation that are identified). This means determining the cost-effectiveness of building analytics implementation is challenging.
In this study, the technology cost-effectiveness is measured by a widely used financial metric called simple payback period (SPP), which is the number of years required to recover the initial investment through savings. It is established using Equation (1) below:
For each study participant that provided costs and energy consumption as described in Section 2.1 and Section 2.2, a simple payback period was calculated using Equations (2) or (3).
where is the simple payback period of EIS. First-year costs and savings were adopted because first-year energy savings were more available than second-year savings in the EIS cases of this study. The costs include (base technology costs), (in-house labor costs to support technology installation and configuration), (annual in-house labor costs for technology use), and (an estimate of implementation costs for EEMs based on analytics findings). is determined by comparing energy use from the first year after technology installation with the baseline year before the installation. When calculating the labor costs, an average labor rate of 125 USD/hour was used to convert hours into dollars.
is the simple payback period of FDD. Second-year savings and costs were utilized, because second-year savings are an accurate representation as savings increase up over the FDD usage time period. The implementation costs includes , (annual recurring technology costs, , two years of , and . is calculated by comparing energy use from the second year after technology installation with the baseline year before it was installed.
The study participants did not track the data on costs for applying EEMs (e.g., fixing a leaking valve). The EEMs identified and implemented through use of building analytics tools should be consistent with the measures identified in existing building commissioning (EBCx) projects. Therefore, the study used the median EEMs implementation cost from a recent EBCx study across three decades and 1,500 buildings [25] as an estimation of CEEM. The EBCx study documented common EEM implementation costs as approximately one-third of the entire EBCx cost. We selected 1.20 USD/m2 (0.11 USD/ft2) as an estimate for the EEM implementation cost related to the use of EIS and 2.40 USD/m2 (0.22 USD/ft2) as an EEM implementation cost estimate associated with to the utilization of FDD. The ongoing cost associated with FDD was estimated to be twice as high as EIS because FDD identifies more savings opportunities.
2.4. Current State of Building Analytics Tools in Buildings
Online surveys were conducted to gain insights into the current state of building analytics tools in buildings. Organizations reported information such as the type of tool being used, the energy management processes supported by the tool, and the most frequently implemented operational improvements in response to tool recommendations. In addition, organizations in the campaign were interviewed to gain an in-depth understanding of their implementation and best practices associated with use of the tools.
3. Results
3.1. Energy and Cost Savings
Table 2 shows EIS and FDD energy and cost savings for the first and second years after implementation. As described in Section 2.1, savings are calculated by comparing baseline year energy data before the tool was in place with data from the years after analytics implementation. By the second year of after the technology was installed, 10 organizations with EIS achieved energy savings ranging from −15% to 22%, with a median annual energy savings of 3% and associated cost savings of 0.32 USD/m2 (0.03 USD/ft2). Eighteen organizations with FDD achieved energy savings ranging from 1% to 28%, with a median annual energy savings of 9% and associated cost savings of 2.58 USD/m2 (0.24 USD/ft2) (Figure 2). The second-year savings were selected as a reliable representation of energy savings benefits from using EIS and FDD because both tools are usually incorporated into the building energy management process, and it takes time for the users to gain experience with the tool, establish routine processes to act upon suggestions, and take actions.
Table 2.
Energy savings for organizations with EIS and organizations with FDD.
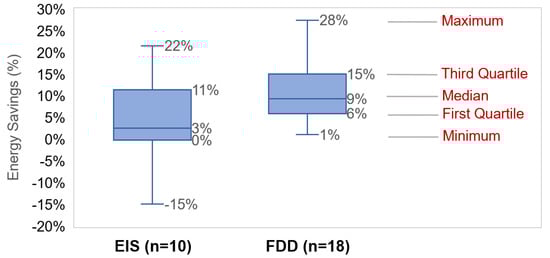
Figure 2.
Second-year energy savings for organizations with EIS and organizations with FDD.
While EIS and FDD tools do not save energy directly, users shared that the tools’ data analysis capabilities were essential for enabling savings from their overall energy management program. In addition, ongoing use of the analytics tools supported persistence in savings. For example, there was an organization whose annual energy savings were 4% in the first year and increased to 17% after seven years of EIS implementation, and another two organizations whose annual energy savings rose from 12% to 31% and 8% to 22%, respectively, after five years of FDD implementation.
Table 3 shows the second-year energy savings distributions by building sector. The ENERGY STAR Portfolio Manager building classification scheme [26] was used to designate the building sector (e.g., healthcare, higher education, office, grocery, hospitality, and K-12 school).
Table 3.
The second-year energy savings distributions by building sector.
3.2. Costs
Table 4 summarizes the median of base technology costs and annual recurring technology costs across 37 organizations using EIS and 35 organizations using FDD. The technology providers’ price models vary: some are based on total building floor area, some are price per building, and some are by number of points (e.g., cost per 10,000 points). Therefore, three cost metrics are reported, including dollars per square meter (USD/m2), dollars per data point (USD/pt) integrated into the tool, and dollars per building (USD/building). In this study, a “point” is defined as a single data point that is tracked and stored in the building analytics tool. A “point” corresponds to electricity and natural gas meter data in EIS, and corresponds to meter and BAS sensor data in FDD.
Table 4.
Median base technology costs and median annual recurring technology costs for EIS and FDD tools.
As shown in Table 4, median base cost for EIS installation was 0.11 USD/ m2 (400 USD/meter; 1500 USD/building). Median annual recurring cost was 0.11 USD/m2 (150 USD/meter; 400 USD/building). On average, four meters were integrated to the EIS in a building. FDD costs were generally higher than for EIS. Median base cost for FDD set up was 0.65 USD/m2 (9 USD/point; 13,000 USD/building), while median annual recurring cost was 0.02 USD/m2 (4 USD/point; 3500 USD/building). EIS cost per meter was USD 400 while the recurring cost was 150 USD/meter (This cost is only for existing meter data integration and software configuration and does not include meter hardware costs). Costs per BAS point for FDD were low because on average 1655 BAS points per building were connected to FDD software. Median cost per building to apply FDD was more than eight times higher than EIS. Although the median building area with FDD was larger (14,400 m2 [155,000 ft2]) than the median building size with EIS (8361 m2 [91,000 ft2]), it would not fully account for the eight-fold difference in cost.
In addition to the technology costs, the labor hours it takes for in-house facility engineers to support technology set up and configuration and to use the tool to identify and follow up on issues were also collected from 18 organizations using EIS and 28 organizations using FDD. The median labor hour to support technology installation and configuration was two hours per building for organizations with EIS and 12 h per building for organizations with FDD. For the ongoing technology use, the median values indicated that organizations interact with EIS about eight hours per year per building and interface with FDD approximate 96 hours per year per building.
3.3. Simple Payback Period
Figure 3 illustrates simple payback period results calculated with the cost-effectiveness method presented in Section 2.3. Twenty-four organizations had sufficient cost and savings data to calculate payback. The median simple payback period for both EIS and FDD is two years for a total of 19 million m2 (206 million ft2) of floor area analyzed.
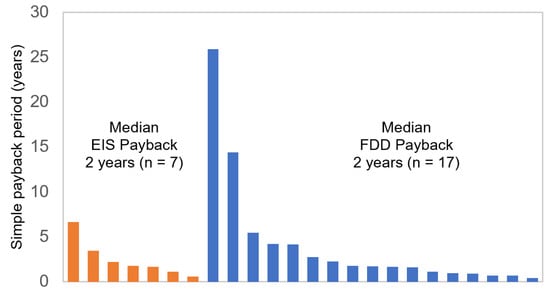
Figure 3.
Estimated simple payback period of EIS and FDD (n = 24, 19 million m2 [206 million ft2]).
3.4. Current State of Building Analytics Tools in Buildings
In this study, more than 100 building analytics tool products on the U.S. market were identified (68 EIS products and 34 FDD products). Twenty-five vendors offered both EIS and FDD products. The building analytics market continues to be dynamic, with new tools continually being developed, and recent years seeing a limited amount of market consolidation and acquisitions. Table 5 summarizes EIS and FDD use in commercial buildings. EIS was most utilized by energy managers for portfolio energy management activities. EIS users commonly reviewed tool outputs daily or monthly to perform daily load analysis and support monthly energy team meetings and reports. FDD tools were used by facility operation engineers, energy managers, and service providers for more detailed system or equipment analysis. The FDD outputs were most commonly reviewed weekly or monthly due to the limited time that operation and maintenance staff have.
Table 5.
Summary of building analytics tool use in commercial buildings.
Organizations provided data on the most frequently implemented EEMs that resulted from their use of building analytics tools (results are shown in Table 5). Both EIS and FDD helped detection of sub-optimal schedules. FDD additionally identified suboptimal economizer operation, control loop hunting problems, simultaneous heating and cooling issues, and more aggressive control setpoint reset opportunities.
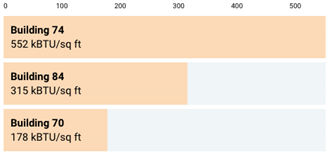
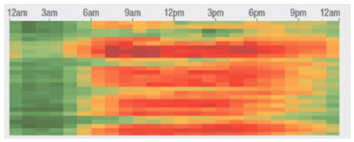
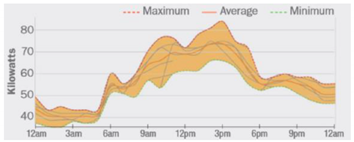
Table 6 includes three common EIS analyses: (1) benchmarking, (2) heat maps, and (3) load profiles. Benchmarking, which compares a building’s energy use intensity with a peer group, can find buildings with high savings potential. Heat maps visualize and present the information included in a time-series load profile, color coding the amount of the energy usage so unusually high energy consumption can be identified easily with “hot spots” and abnormal patterns. The x-axis indicates time of day, and the y-axis shows day or date. Load profiles plot the system or building energy use against time, highlighting changes or abnormalities in system performance that could lead to increased energy consumption. There are many ways to visualize the analyses; Table 6 provides one example of visualization from our study participants for benchmarking, heat maps, and load profiles, respectively.
Table 6.
Commonly adopted EIS metrics and analyses.
Table 7 lists the common faults detected by FDD tools, including the general faults applicable to multiple HVAC equipment and specific faults for a specific HVAC equipment such as variable air volume (VAV) terminal boxes and air handling units (AHUs). The analyses presented in Table 6 and Table 7 assist the discovery of EEMs presented in Table 5.
Table 7.
Common faults or opportunities identified by FDD tools.
3.5. Best Practices
Obtaining the best results from any tool requires using it correctly for the right applications, and the same holds true for building analytics tools. As presented in Section 3.1 and Section 3.3, organizations in the campaign have shown that building analytics tools can enable energy savings and attractive payback when used properly. The best results were achieved by organizations that implemented the following two best practices: (1) implementing MBCx; (2) linking building analytics tools to a work order system.
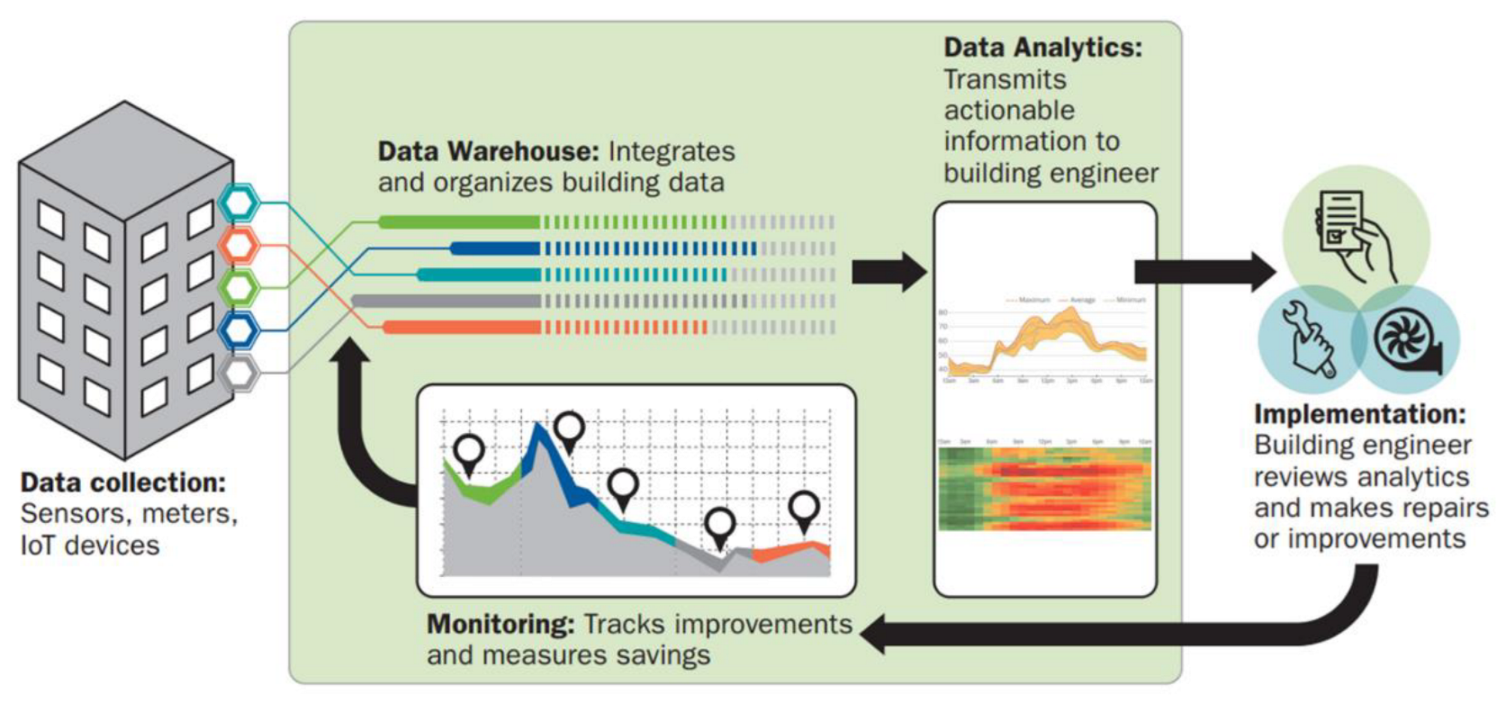
Monitoring-based commissioning: Having a structured MBCx process is one of the best practices identified in the organizations with greater achieved energy savings, as it takes full advantage of building analytics tool functionality. MBCx is an ongoing commissioning process characterized by using building data to maintain and continuously improve organization operation performance over time [27]. Building analytics tools were implemented by building operators or service companies to streamline and automate the MBCx process.
Figure 4 illustrates the four main elements of a structured MBCx process using building analytics tools: (1) data collection, (2) data analytics, (3) implementation, and (4) verification. For data collection, the tool continuously collects data from building systems, typically energy meters and energy consuming systems. For data analytics, the tool identifies issues and opportunities with analytics (Table 6 and Table 7) and develops summary reports. For implementation, the in-house facility team or third-party commissioning firm reviews the analytic results on a regular basis and implements corrective actions accordingly. The analytics review can be part of a daily operations team meeting, or it can be covered in a more comprehensive monthly report or meeting. Any equipment failures or critical items will be communicated immediately, and energy saving opportunities and proactive maintenance measures will be documented and prioritized. For verification, the tool is used to track the status of corrective actions and resolutions and verify energy savings to provide visibility on results for executive-level review. Leveraging building analytics tools into MBCx is a powerful method to ensure that identified chances are acted upon.
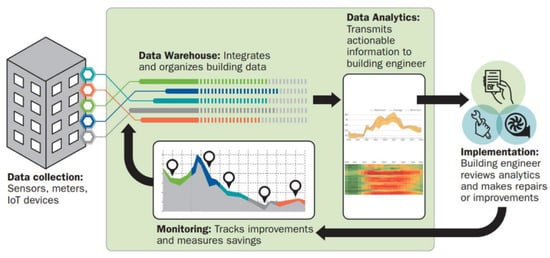
Figure 4.
Leveraging building analytics tools into MBCx.
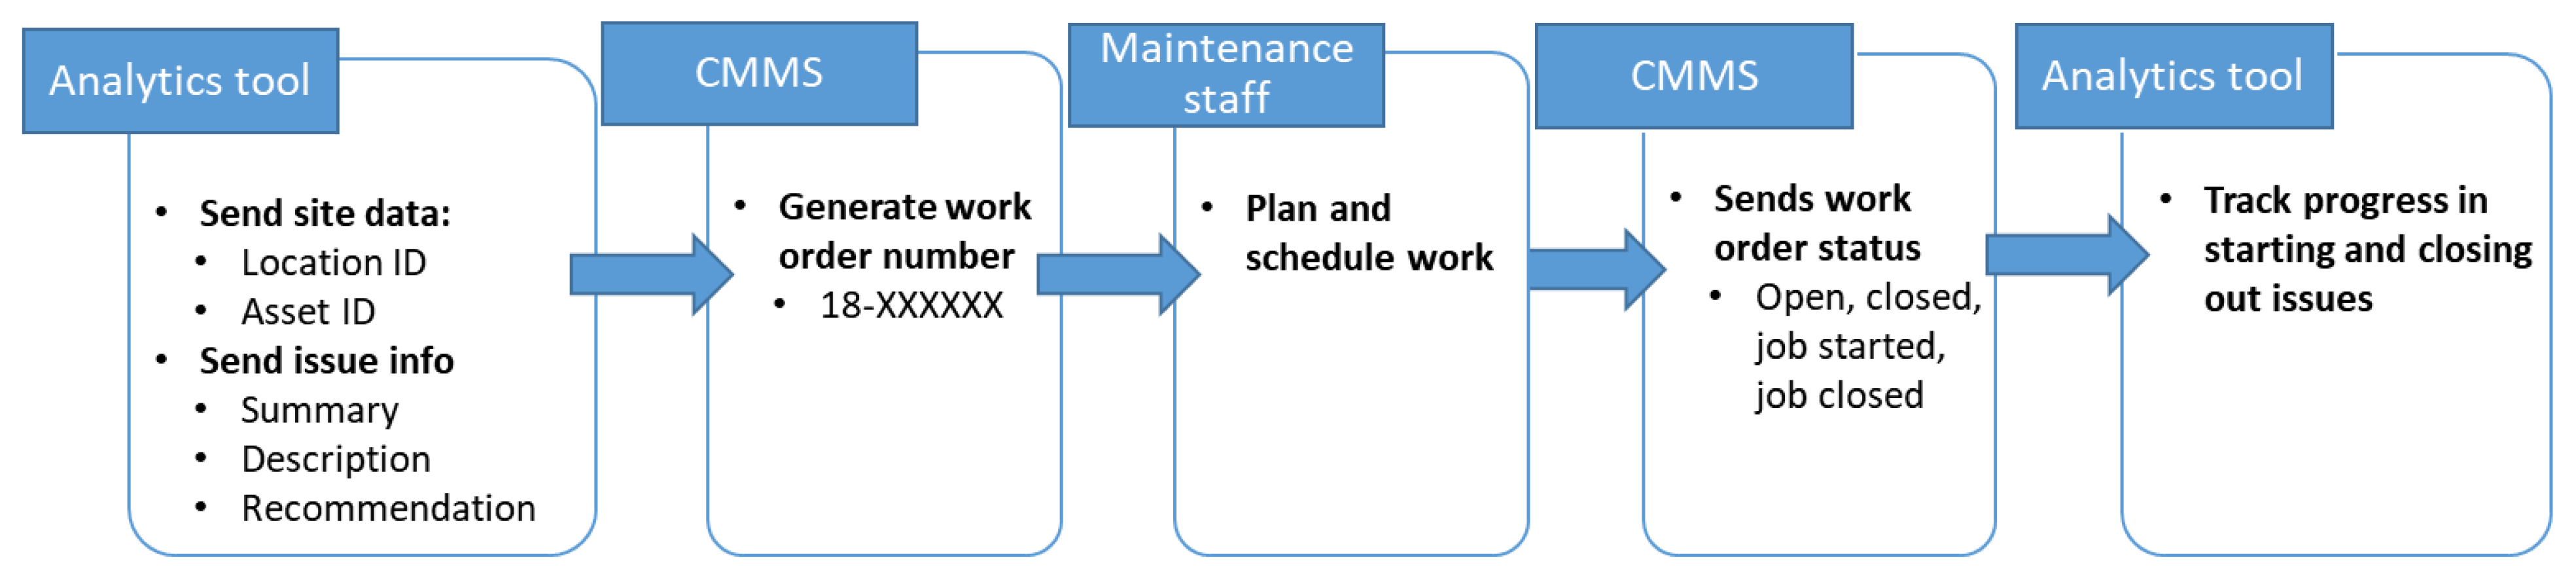
Link building analytics tools to a work order system: Organizations commonly use a computerized maintenance management system (CMMS) to help manage assets, schedule maintenance, and track work orders. Linking a building analytics tool to a CMMS is a reliable way to integrate issue resolution into daily maintenance practices. By doing so, a work order for correction can be created for any issue reported from the tool, and progress toward resolution can be tracked. Figure 5 shows how one campaign organization integrates the building analytics and CMMS workflow. The analytics tool and the CMMS communicate via a web application programming interface. When an issue is reported by the analytics tool, the facility staff initiates a request for a work order within the tool, which generates a work order in the CMMS, and using the application programming interface, transfers information to the work order description. Maintenance staff then take action and complete the work. The work order status can be transferred back to the analytics tool to close the issue.

Figure 5.
Integration of a building analytics tool and a CMMS (University of Iowa).
4. Discussion
This section discusses the research findings and presents research needs to advance today’s building analytics tools.
4.1. Costs and Benefits of EIS and FDD Tools
Energy savings and costs associated with implementation of EIS and FDD tools are documented in Section 3. Organizations with EIS reported median annual energy savings of 3% and organizations with FDD tools achieved median savings of 9% by the second year of installation. These savings were realized at a cost of 0.32 USD/m2 (0.03 USD/ft2) for EIS, and 2.58 USD/m2 (0.24 USD/ft2) for FDD. FDD tools show higher savings than EIS because they identify more specific improvement opportunities. As described in Table 4, Table 5 and Table 6, EIS catches big-picture trends in energy usage while FDD points out faults at the system or equipment level. Best practice implementations (top quartile) result in 11–22% portfolio savings for EIS and 15–28% for FDD tools (Figure 2).
While achieving higher savings, FDD tools cost more than EIS. The base cost per square meter for installing FDD tool (0.65 USD/m2 [0.06 USD/ft2]) was six times that of EIS (0.11 USD/m2 [0.01 USD/ft2]). Remarkably more effort is needed to integrate the BAS data into FDD software and develop FDD rules than to bring meter data into EIS tools and develop the associated analysis. For each building, there might be hundreds of BAS data points while having fewer than 10 meters.
The recurring software costs for FDD tools (0.22 USD/m2 [0.02 USD/ft2]) were higher than for EIS (0.11 USD/m2 [0.01 USD/ft2]). This cost difference was due to high data storage requirements, the complexity of setting up new rules and tuning existing FDD rules, and sophisticated training for site staff. As noted in Section 3.2, another component of the recurring costs is labor cost (internal staff or contracted), for which FDD tools also cost more. Organizations spend more time using their FDD tool than their EIS tool, because of the granular system or equipment-level suggestions provided with FDD implementation. Another reason is that in the campaign, organizations with EIS only use in-house staff to manage technology use, while about half of the organizations with FDD asked consulting companies for additional assistance, which reduces the need of in-house support.
With a total of 19 million m2 (206 million ft2) of floor area investigated, the median simple payback period for both EIS and FDD is two years, which meets the two- to four-year payback requirements that motivate most energy conservation decisions. With easier installation and lower cost, EIS is usually the beginning point for an organization with a limited budget. For an organization that has never implemented an FDD, a good strategy to reduce costs is to start with the functionalities that only require existing data or data that can be collected with little additional time and cost. This approach allows the organization to achieve savings before gaining approvals for further investment. The tool’s complexity can be ramped up as an organization becomes more proficient with the tool. FDD and EIS can work at the same time to offer both a bottom-up and top-down analysis for building energy management and system operation.
4.2. Research Needs
Application of analytics in commercial buildings has grown and matured significantly over the past decade in the United States. Building portfolio owners are increasingly using EIS to monitor energy usage and prioritize energy conservation efforts, and facility teams are using FDD to track and analyze HVAC system performance. Campaign data analysis highlighted two main topic areas for further research: (1) analytics data integration and management, and (2) maximizing conversion of analytics findings into verified system fixes.
- Analytics data integration and management: Accurately and effectively collecting, understanding, and sharing data from diverse devices and systems is a typical challenge that can result in long configuration time duration (several months). A university campus may be integrating submeters and meters for multiple fuels including electric, natural gas, steam, hot water, and chilled water, with various meter vintages, versions, and products across the portfolio, and integrating BAS with multiple vendors, hardware vintage, and system configuration. The data in each building often have inconsistent names so it is hard to understand the data content, type, location, unit, and relationships to other equipment. Connecting many types of devices and systems to the analytics tools, and communicating and interpreting the meaning of the data in readable format for building analytics tools, typically requires extensive expertise and labor intensive efforts. The telecommunication and consumer electronics industries provide examples of what a more mature industry could look like, with devices that recognize one another and systems that self-configure with minimal user intervention. Clearly more research is needed to improve current data integration and management approaches.
- Maximizing conversion of analytics findings into verified system fixes: With competing priorities, staff often do not have enough time to review the analytics tool reports and findings, and to investigate and take actions. Tools can notify building staffs of operational issues, but an action is required to fix issues and produce the associated energy savings. Linking building analytics tools to a work order system can streamline this process, but it is not yet a standard offering of most of the analytics tools. Automating the process of fixing faults is one area of research that holds promise for reducing costs and increasing savings from analytics. A subset of faults can be addressed automatically by overwriting the control variable in the BAS with a corrected or improved value. By closing the loop between diagnostics and control, the need for operations and maintenance staff intervention is reduced, and the value of the tools is increased. Another area that can be improved by future research is root cause isolation. Definitively pinpointing the root cause of a fault can be challenging. For instance, the FDD tool might detect a fault with AHU supply air temperature higher than its setpoint and recommend that the possible reasons include undersized coils, stuck dampers or valves, uncalibrated sensors, and an error in control sequences. New techniques such as machine learning, artificial intelligence, and proactive functional testing can be studied to shorten the list of diagnostics results.
5. Conclusions
In the past 10 years, there is a growing interest in building analytics tool applications in commercial buildings that help building operators and owners find energy savings potential and operation inefficiencies in order to reduce energy use and improve operations and maintenance. In this paper, we present savings, costs, and the state of practice of implementing and utilizing building analytics tools (EIS and FDD tools) based on data from the U.S. Department of Energy’s Smart Energy Analytics Campaign over the course of 2016–2020 and a prior EIS study [11]. This is the largest known dataset on building analytics tool use, covering 113 organizations with thousands of buildings.
Organizations using FDD tools achieved 9% median energy savings while organizations using EIS tool achieved 3% median energy savings. The median base cost and annual recurring software cost for FDD are USD 0.65 per m2 (USD 0.06 per square foot) and USD 0.22 per m2 (USD 0.02 per square foot), respectively; and are USD 0.11 per m2 (USD 0.01 per square foot) and USD 0.11 per m2 (USD 0.01 per square foot), respectively, for EIS. The study also showed that the implementation of EIS or FDD tools resulted in a two-year simple payback period. The realized energy savings are attributable to several implemented EEMs enabled based on the results of the analytics tools, including improving HVAC scheduling, improving airside economizer operation, reducing simultaneous heating and cooling, adopting more aggressive setpoint resets, and dozens of additional measures. The common metrics and analyses in EIS and FDD to support the identification of EEMs are presented. Monitoring-based commissioning and connecting building analytics tools with a work order system were two best practices identified to maximize the benefits of tool implementation.
Regarding current deployment practices, the dataset shows a maturing and evolving market for building analytics tools, with a broad range of tools being implemented successfully at scale. More than 100 building analytics tool products on the U.S. market were identified (68 EIS products and 34 FDD products). Building analytics tools have involved from being a promising emerging technology to being an essential energy management tool used by leading organizations as they strive for improved building performance, enhanced occupant comfort, and aggressive energy reductions. Further, current building analytics tools can still be improved through research focused on simplified data integration and management and more efficient approaches to close the loop of implementing improvements based on the analytic findings. The findings in this paper can also be utilized to select fundamental recommendations for optimizing building operation and improving building system maintenance management.
Author Contributions
Conceptualization, J.G.; methodology, H.K., G.L. and J.G.; formal analysis, H.K., G.L., E.C. and V.N.; writing—original draft preparation, G.L., H.K. and V.N.; writing—review and editing, H.K., J.G. and V.N.; funding acquisition, J.G. All authors have read and agreed to the published version of the manuscript.
Funding
This research was funded by the Assistant Secretary for Energy Efficiency and Renewable Energy, Building Technologies Office, of the U.S. Department of Energy under Contract No. DE-AC02-05CH11231.
Acknowledgments
The authors wish to acknowledge Amy Jiron and Cedar Blazek for their guidance and support of the research. We thank all the organizations who participated in this study.
Conflicts of Interest
The authors declare no conflict of interest.
Nomenclature
| EMIS | Energy management and information system |
| BAS | Building automation system |
| HVAC | Heating, ventilation, and air conditioning |
| IoT | Internet of things |
| EIS | Energy information systems |
| FDD | Fault detection and diagnostics |
| EEM | Energy efficiency measure |
| MBCx | Monitoring-based commissioning |
| SPP | Simple payback period |
| EBCx | Existing building commissioning |
| AHU | Air handling units |
| VAV | Variable air volume |
| CMMS | Computerized maintenance management system |
| Base technology costs | |
| In-house labor costs to support technology installation and configuration | |
| Annual in-house labor costs for technology use | |
| An estimate of implementation costs for EEMs based on analytics findings | |
| The first-year savings, which are calculated by comparing energy use from the first year after technology was installed with the baseline year before it was installed. | |
| Annual recurring technology costs | |
| The second-year savings which are calculated by comparing energy use from the second year after technology was installed with the baseline year before it was installed |
References
- Granderson, J.; Lin, G.; Kramer, H. A Primer on Organizational Use of Energy Management and Information Systems; Better Buildings, U.S. Department of Energy: Washington, DC, USA, 2021.
- Motegi, N.; Piette, M.A.; Kinney, S.; Dewey, J. Case Studies of Energy Information Systems and Related Technology: Operational Practices, Costs, and Benefits. Report prepared for the California Energy Commission, Public Interest Energy Research, HPCBS # E5P2.2T1e. LBNL Report No. 53406. In Proceedings of the International Conference for Enhanced Building Operations, Berkeley, CA, USA, 13–15 October 2003. [Google Scholar]
- ASHRAE. ASHRAE Standard 90.1–2013, Energy Standard for Buildings Except Low Rise Residential Buildings; Standard 90.1; American Society of Heating Refrigeration and Air Conditioning Engineers: Washington, DC, USA, 2013. [Google Scholar]
- Katipamula, S.; Brambley, M.R. Review Article: Methods for Fault Detection, Diagnostics, and Prognostics for Building Systems—A Review, Part I. HVACR Res. 2005, 11, 3–25. [Google Scholar] [CrossRef]
- Kim, W.; Katipamula, S. A review of fault detection and diagnostics methods for building systems. Sci. Technol. Built Environ. 2018, 24, 3–21. [Google Scholar] [CrossRef]
- Dexter, A.; Pakanen, J. (Eds.) Demonstrating Automated Fault Detection and Diagnosis Methods in Real Buildings: International Energy Agency. Energy Conservation in Buildings and Community Systems ANNEX 34, 2001, VTT Symposium; VTT Technical Research Centre of Finland: Espoo, Finland, 2001. [Google Scholar]
- Katipamula, S.; Brambley, M.R. Review Article: Methods for Fault Detection, Diagnostics, and Prognostics for Building Systems—A Review, Part II. HVACR Res. 2005, 11, 169–187. [Google Scholar] [CrossRef]
- Granderson, J.; Singla, R.; Mayhorn, E.; Ehrlich, P.; Vrabie, D.; Frank, S. Characterization and Survey of Automated Fault Detection and Diagnostic Tools (No. LBNL-2001075); Lawrence Berkeley National Laboratory: Berkley, CA, USA, 2017.
- Meiman, A.; Brown, K.; Anderson, M. Monitoring-Based Commissioning: Tracking the Evolution and Adoption of a Paradigm-Shifting Approach to Retro-Commissioning. In Proceedings of the 2012 ACEEE Summer Study, Pacific Grove, CA, USA, 12–17 August 2012. [Google Scholar]
- Henderson, P.; Waltner, M. Real-Time Energy Management: A Case Study of Three Large Commercial Buildings in Washington, D.C (No. CS:13-07-A); Natural Resources Defense Council: Washington, DC, USA, 2013. [Google Scholar]
- Granderson, J.; Lin, G. Building energy information systems: Synthesis of costs, savings, and best-practice uses. Energy Effic. 2016, 9, 1369–1384. [Google Scholar] [CrossRef] [Green Version]
- Wheeler, G.; Deru, M.; Hirsch, A.; Trenbath, K. Provider and User Perspectives on Automated Fault Detection and Diagnostic Products for Packaged Rooftop Units (No. NREL/TP-5500-75461); National Renewable Energy Laboratory: Golden, CO, USA, 2020.
- Zhou, X.; Yang, T.; Liang, L.; Zi, X.; Yan, J.; Pan, D. Anomaly detection method of daily energy consumption patterns for central air conditioning systems. J. Build. Eng. 2021, 38, 102179. [Google Scholar] [CrossRef]
- Amasyali, K.; El-Gohary, N.M. A review of data-driven building energy consumption prediction studies. Renew. Sustain. Energy Rev. 2018, 81, 1192–1205. [Google Scholar] [CrossRef]
- Mirnaghi, M.S.; Haghighat, F. Fault detection and diagnosis of large-scale HVAC systems in buildings using data-driven methods: A comprehensive review. Energy Build. 2020, 229, 110492. [Google Scholar] [CrossRef]
- Mills, E.; Mathew, P. Monitoring Based Commissioning: Benchmarking Analysis of 24 UC/CSU/IOU Projects (No. LBNL-1972E); Lawrence Berkeley National Lab. (LBNL): Berkeley, CA, USA, 2009. [CrossRef] [Green Version]
- Summer, H.; Hilger, C. Fault Detection and Diagnostic Software (No. Report ET11PGE3131); Pacific Gas and Electric’s Emerging Technology Program: Berkley, CA, USA, 2012. [Google Scholar]
- Fernandes, S.; Granderson, J.; Singla, R.; Touzani, S. Corporate Delivery of a Global Smart Buildings Program. Energy Eng. 2018, 115, 7–25. [Google Scholar] [CrossRef] [Green Version]
- Wall, J.; Guo, Y. Evaluation of Next-Generation Automated Fault Detection & Diagnostics, Diagnostics (FDD) Tools for Commercial Building Energy Efficiency—Final Report Part I: Case Studies in Australia, FDD Case Studies in Australia (No. RP1026); Low Carbon Living CRC: Boca Raton, FL, USA, 2018. [Google Scholar]
- Energy Star®. Benchmark Your Building Using ENERGY STAR® Portfolio Manager® [WWW Document]. 2022. Available online: https://www.energystar.gov/buildings/benchmark (accessed on 9 January 2022).
- EVO. International Performance Measurement and Verification Protocol: Concepts and Options for Determining Energy and Water Savings Volume I (No. EVO-10000-1); Efficiency Valuation Organization: Washington, DC, USA, 2012. [Google Scholar]
- U.S. Energy Information Administration (EIA), Commercial Buildings Energy Consumption Survey (CBECS), Table C1 [WWW Document]. 2016. Available online: https://www.eia.gov/consumption/commercial/ (accessed on 9 January 2022).
- U.S. Energy Information Administration, Electric Power Monthly with data for December 2017 [WWW Document]. 2018. Available online: https://www.eia.gov/electricity/monthly/archive/february2018.pdf (accessed on 23 June 2022).
- U.S. Energy Information Administration, Price of Natural Gas Sold to Commercial Consumers (Dollars per Thousand Cubic Feet) [WWW Document]. 2019. Available online: https://www.eia.gov/dnav/ng/hist/n3020us3A.htm (accessed on 23 May 2022).
- Crowe, E.; Mills, E.; Poeling, T.; Curtin, C.; Bjørnskov, D.; Fischer, L.; Granderson, J. Building commissioning costs and savings across three decades and 1500 North American buildings. Energy Build. 2020, 227, 110408. [Google Scholar] [CrossRef]
- Energy Star®. Property Types in Portfolio Manager [WWW Document]. 2022. Available online: https://www.energystar.gov/buildings/benchmark/understand_metrics/property_types (accessed on 9 January 2022).
- Stum, K.; Bjornskov, D. The Building Commissioning Handbook, 3rd, ed.; APPA: Alexandria, VA, USA, 2017; pp. 22314–23492. [Google Scholar]


Publisher’s Note: MDPI stays neutral with regard to jurisdictional claims in published maps and institutional affiliations. |
© 2022 by the authors. Licensee MDPI, Basel, Switzerland. This article is an open access article distributed under the terms and conditions of the Creative Commons Attribution (CC BY) license (https://creativecommons.org/licenses/by/4.0/).