
Impacts of Urban Development on Regional Green Development Efficiency—A Case of the Yangtze River Delta in China


Abstract
:1. Introduction
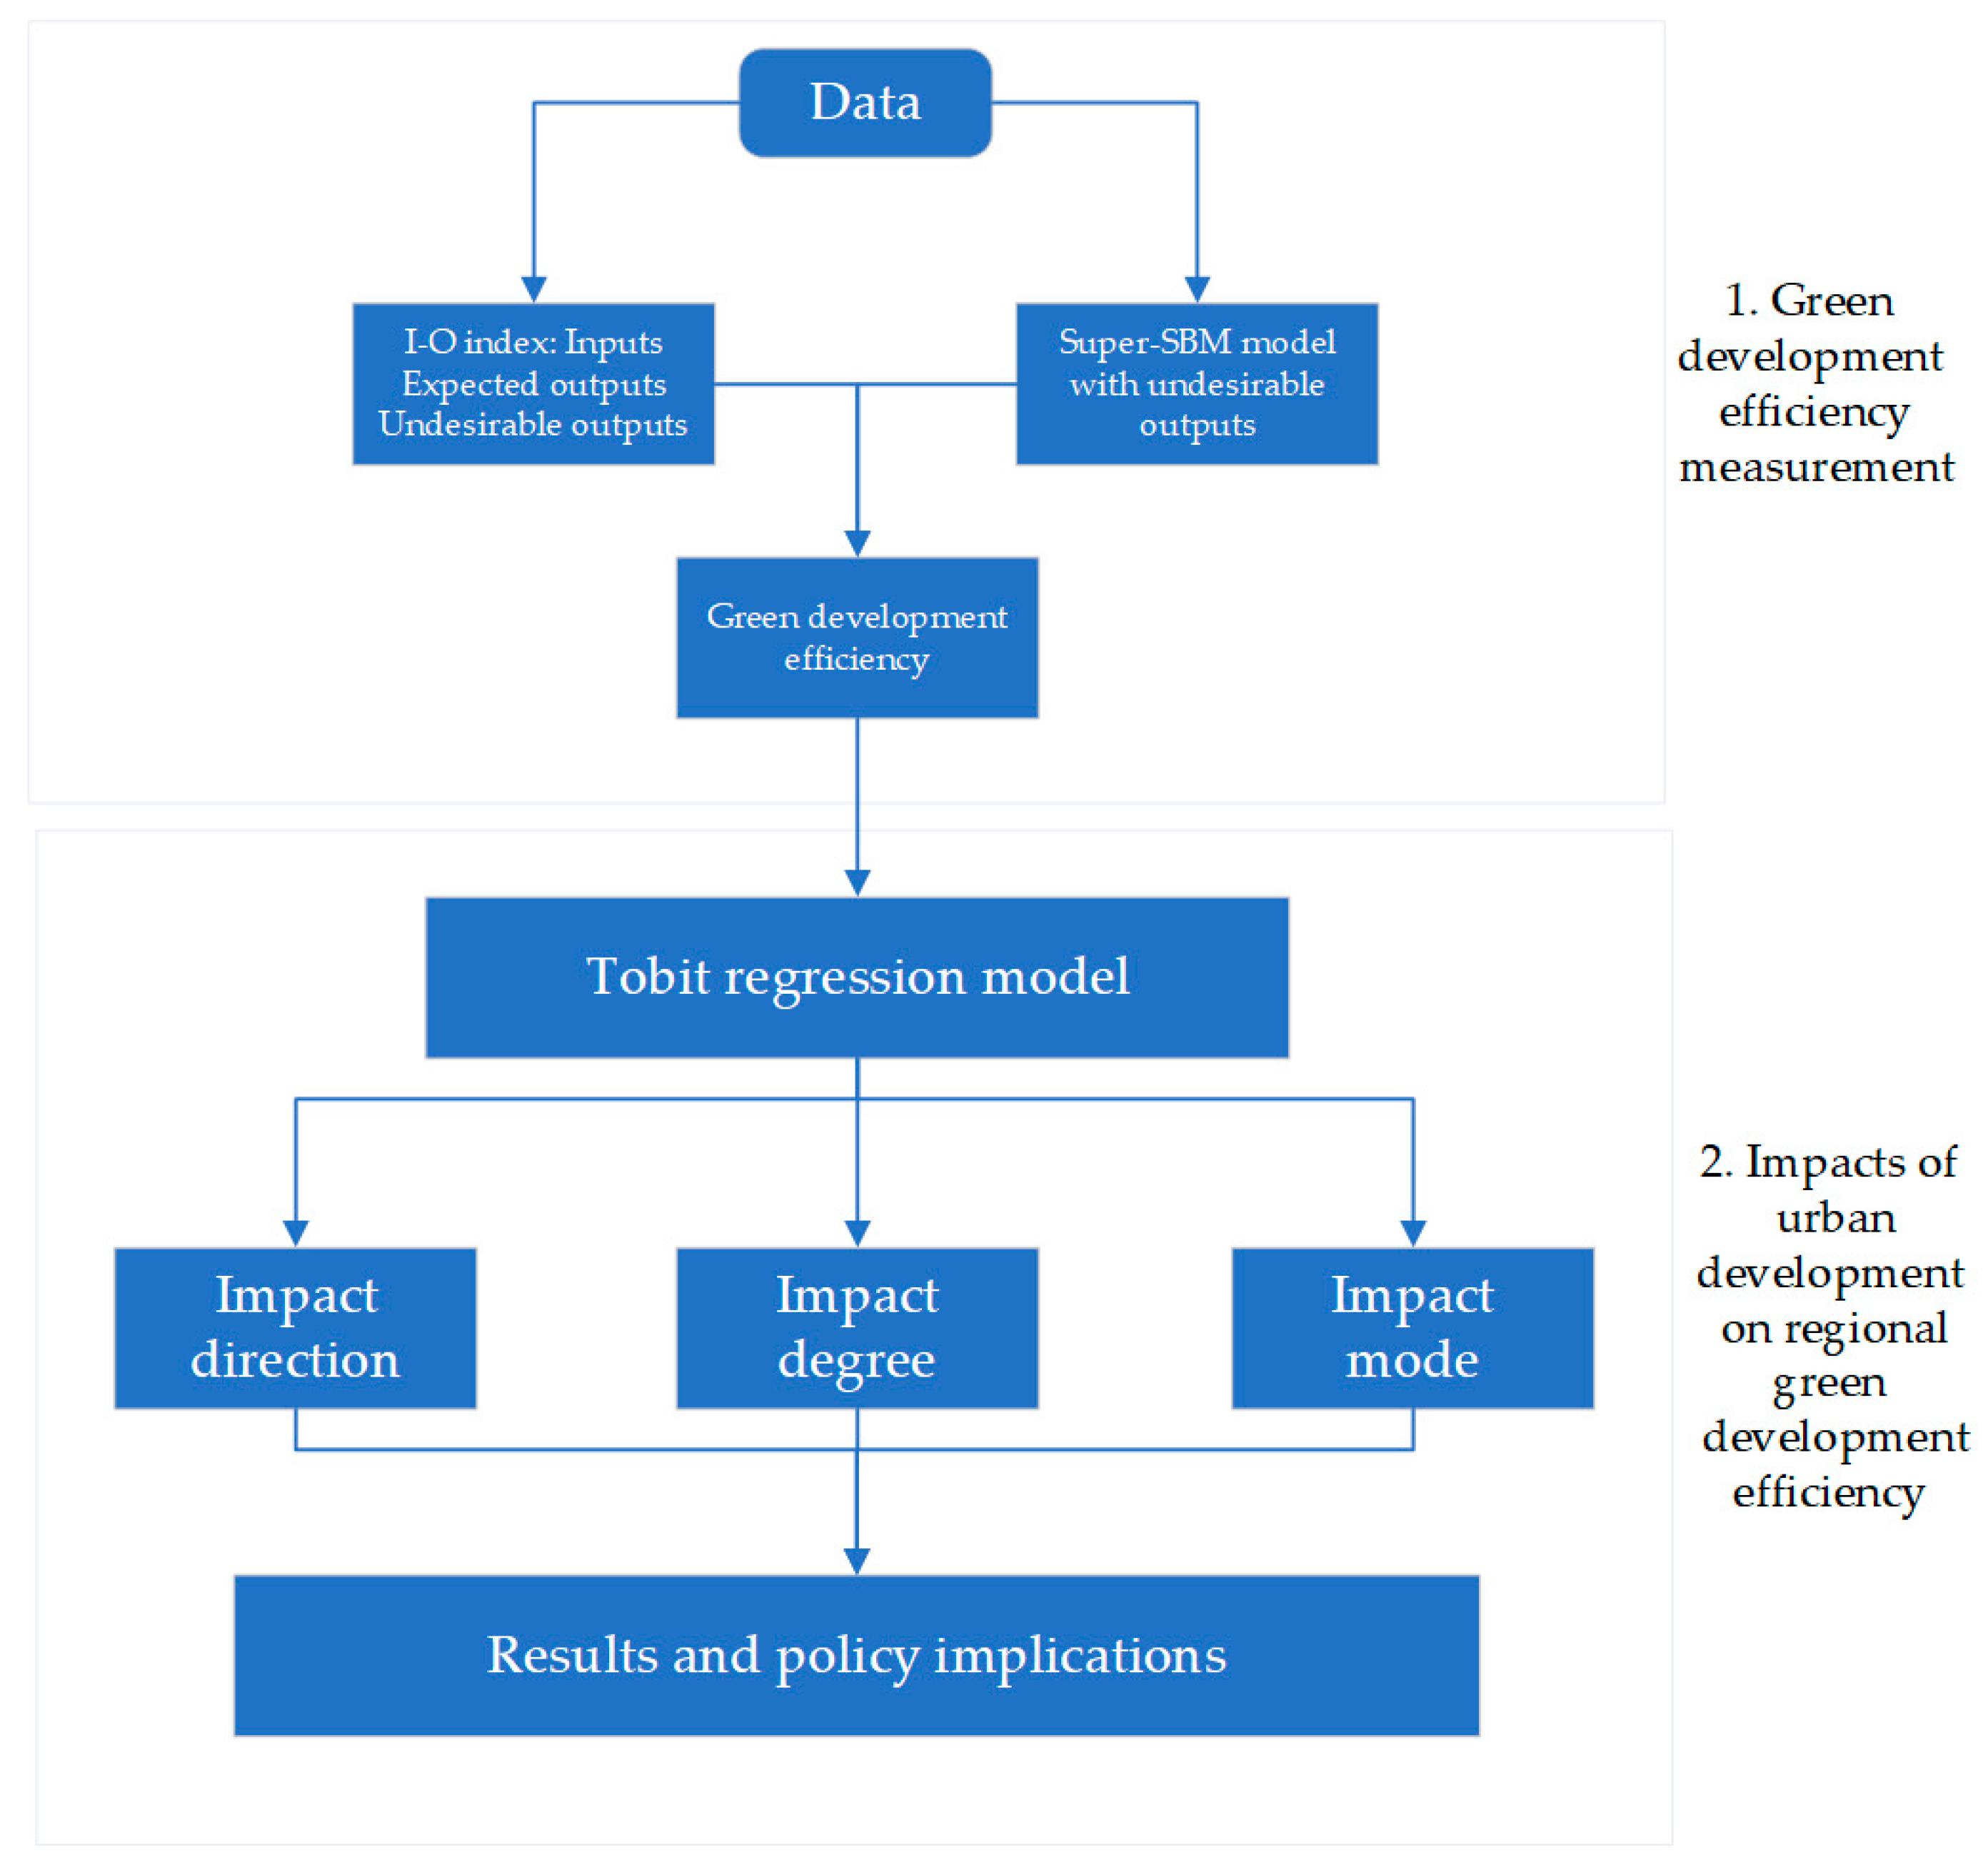
2. Materials and Methods
2.1. Description of Variables
2.1.1. GDE Variables
2.1.2. Urban Development Variables
- (1)
- (2)
- Innovation level (U2): The expenditure for education, science, and technology (EEST) indicates the levels of science and education. A high level of innovation can promote the circular economy of cities and protect the environment to some extent [29].
- (3)
- Urban construction (U3): The area of built districts (ABD) represents urban construction. Faced with the expansion of construction land, the corresponding pollution may have a certain impact on the environment.
- (4)
- Government planning (U4): The green-covered area of built-up area (GACA) is a result of government planning. As one kind of environmental regulation, better green development may be achieved for cities by attaching importance to the investment and planning of green land.
- (5)
- Other control variables: The industrial structure (C1) and urbanization level (C2). Tertiary industry’s share of GDP (TGDP) refers to the industrial structure, and the urbanization rate (UR) stands for the urbanization level. Many studies have found that industrial structure and urbanization levels have an impact on green development efficiency [20,21,30]. The above input, output, and urban development indices are summarized in Table 1.
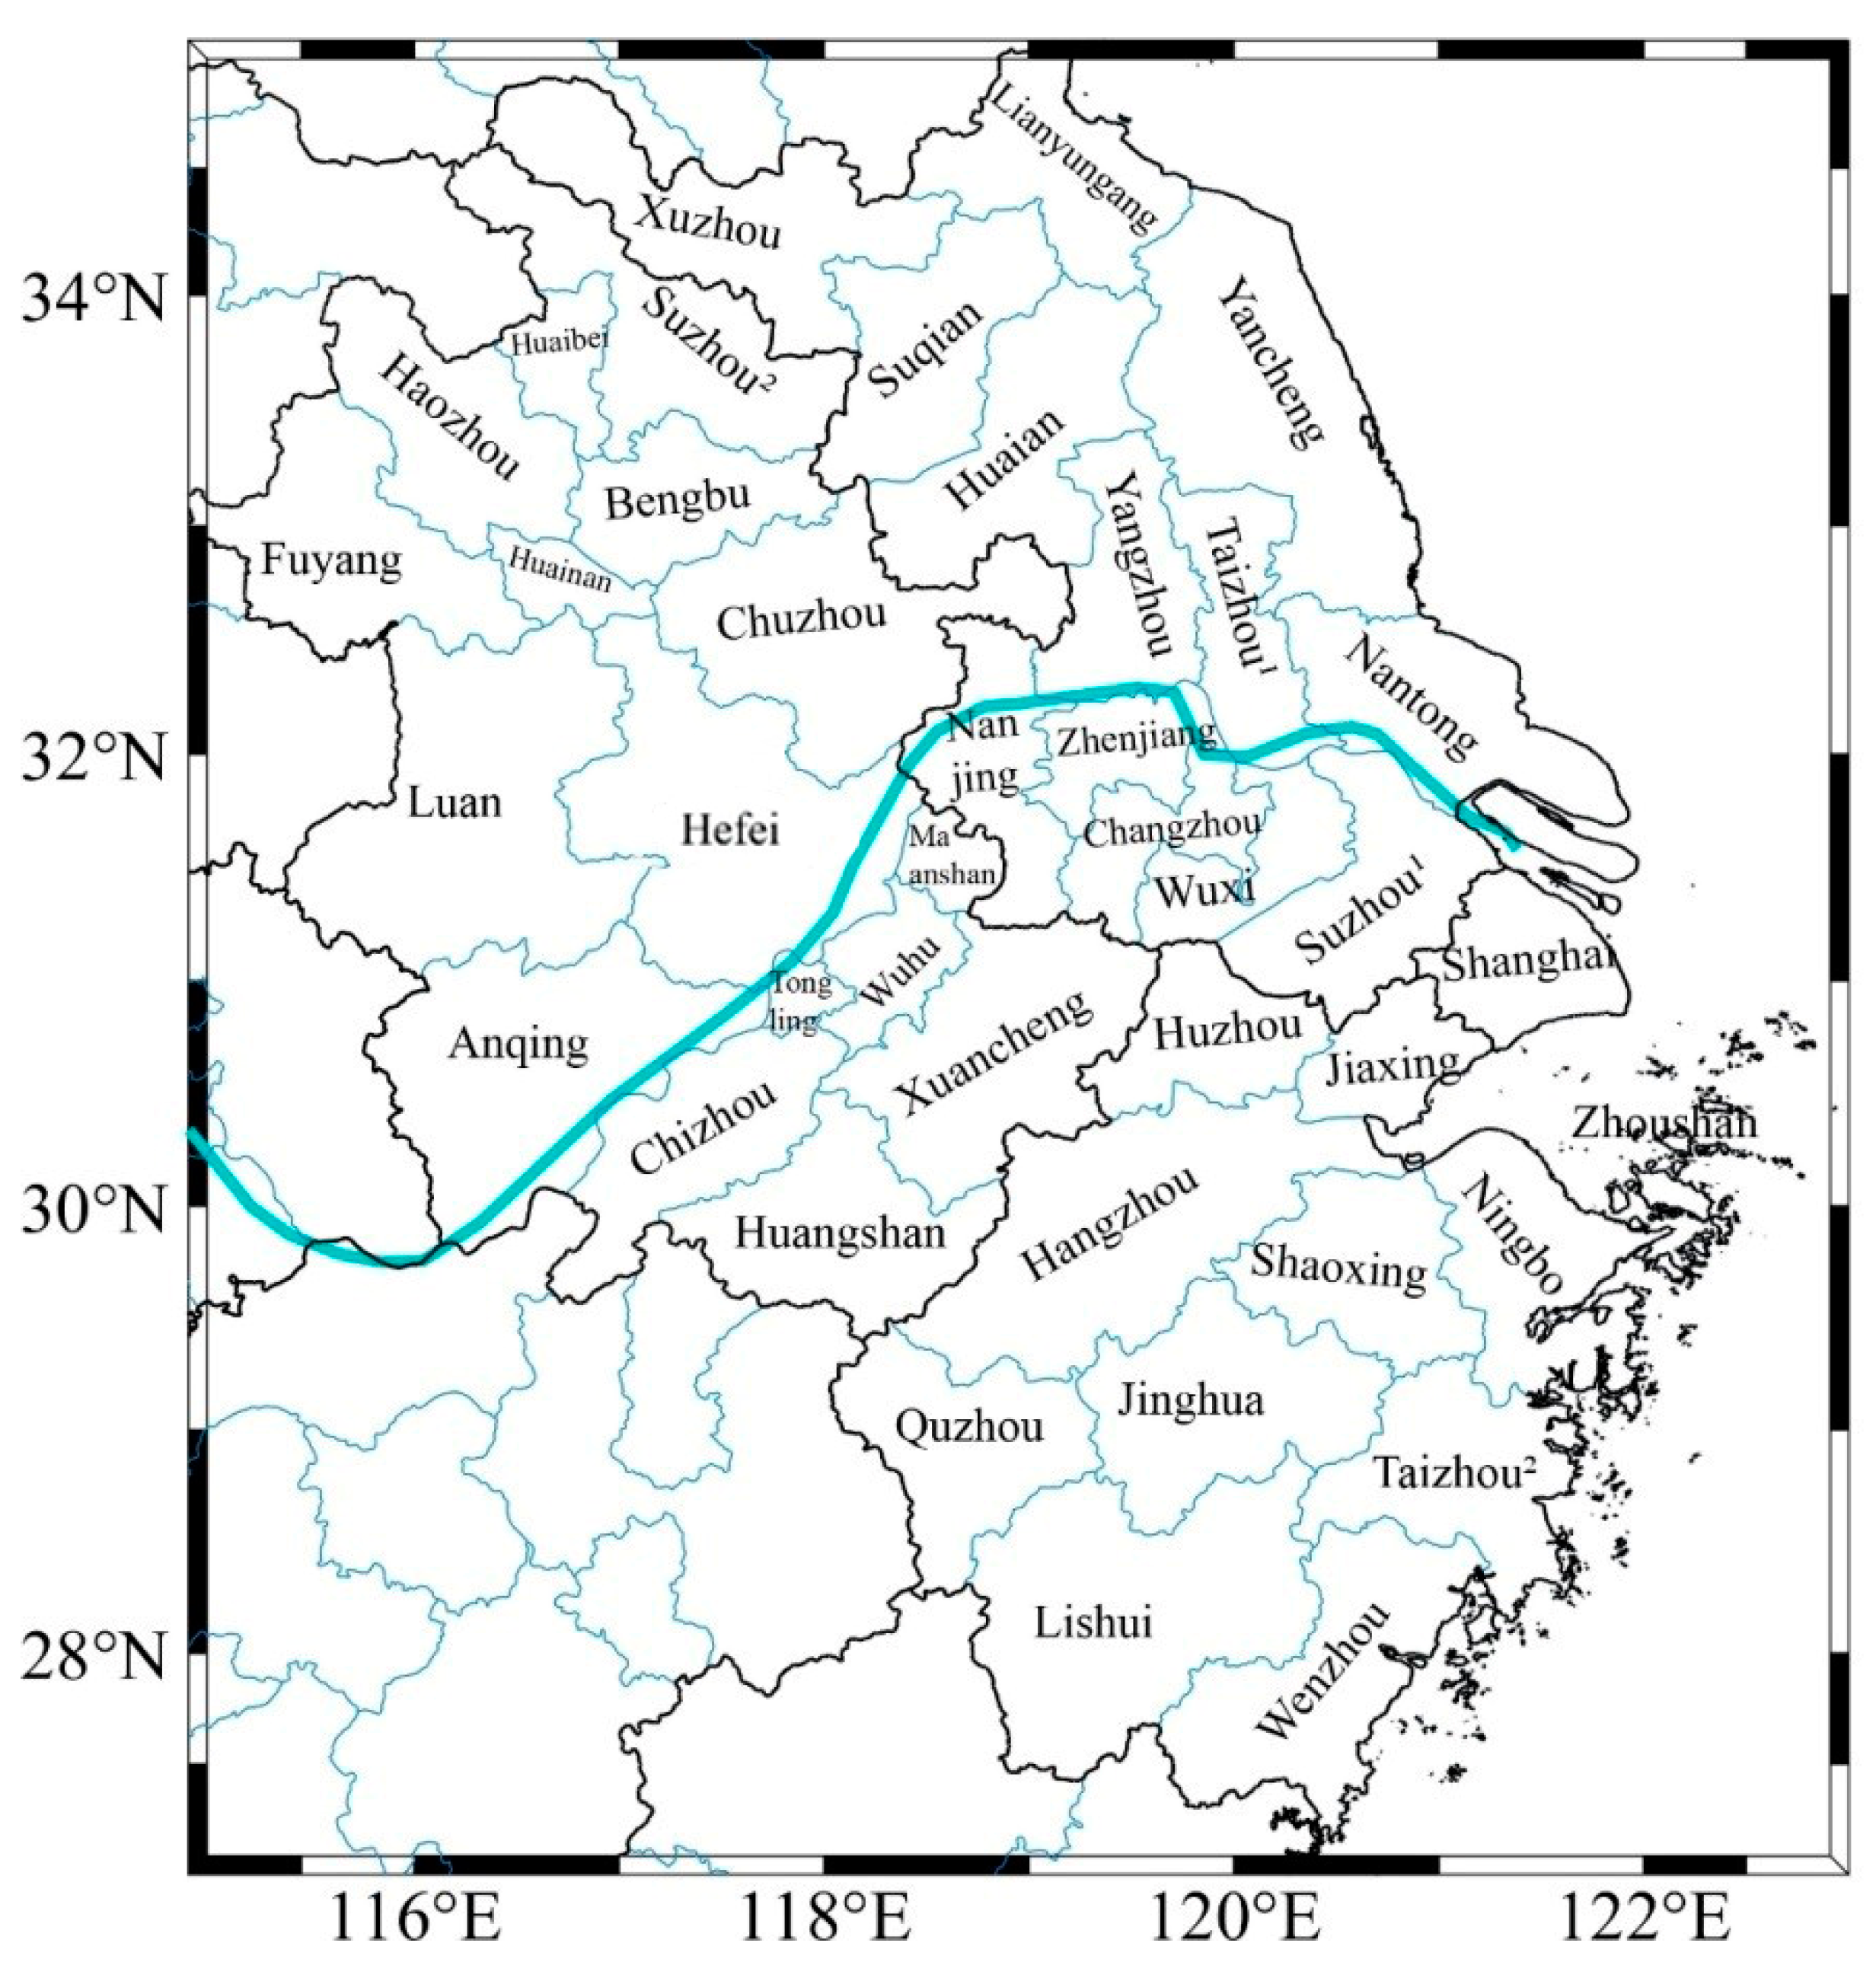
2.2. Research Area and Data Sources
2.3. Description of Calculation Modes
2.3.1. Super-SBM Model
2.3.2. Tobit Regression Model
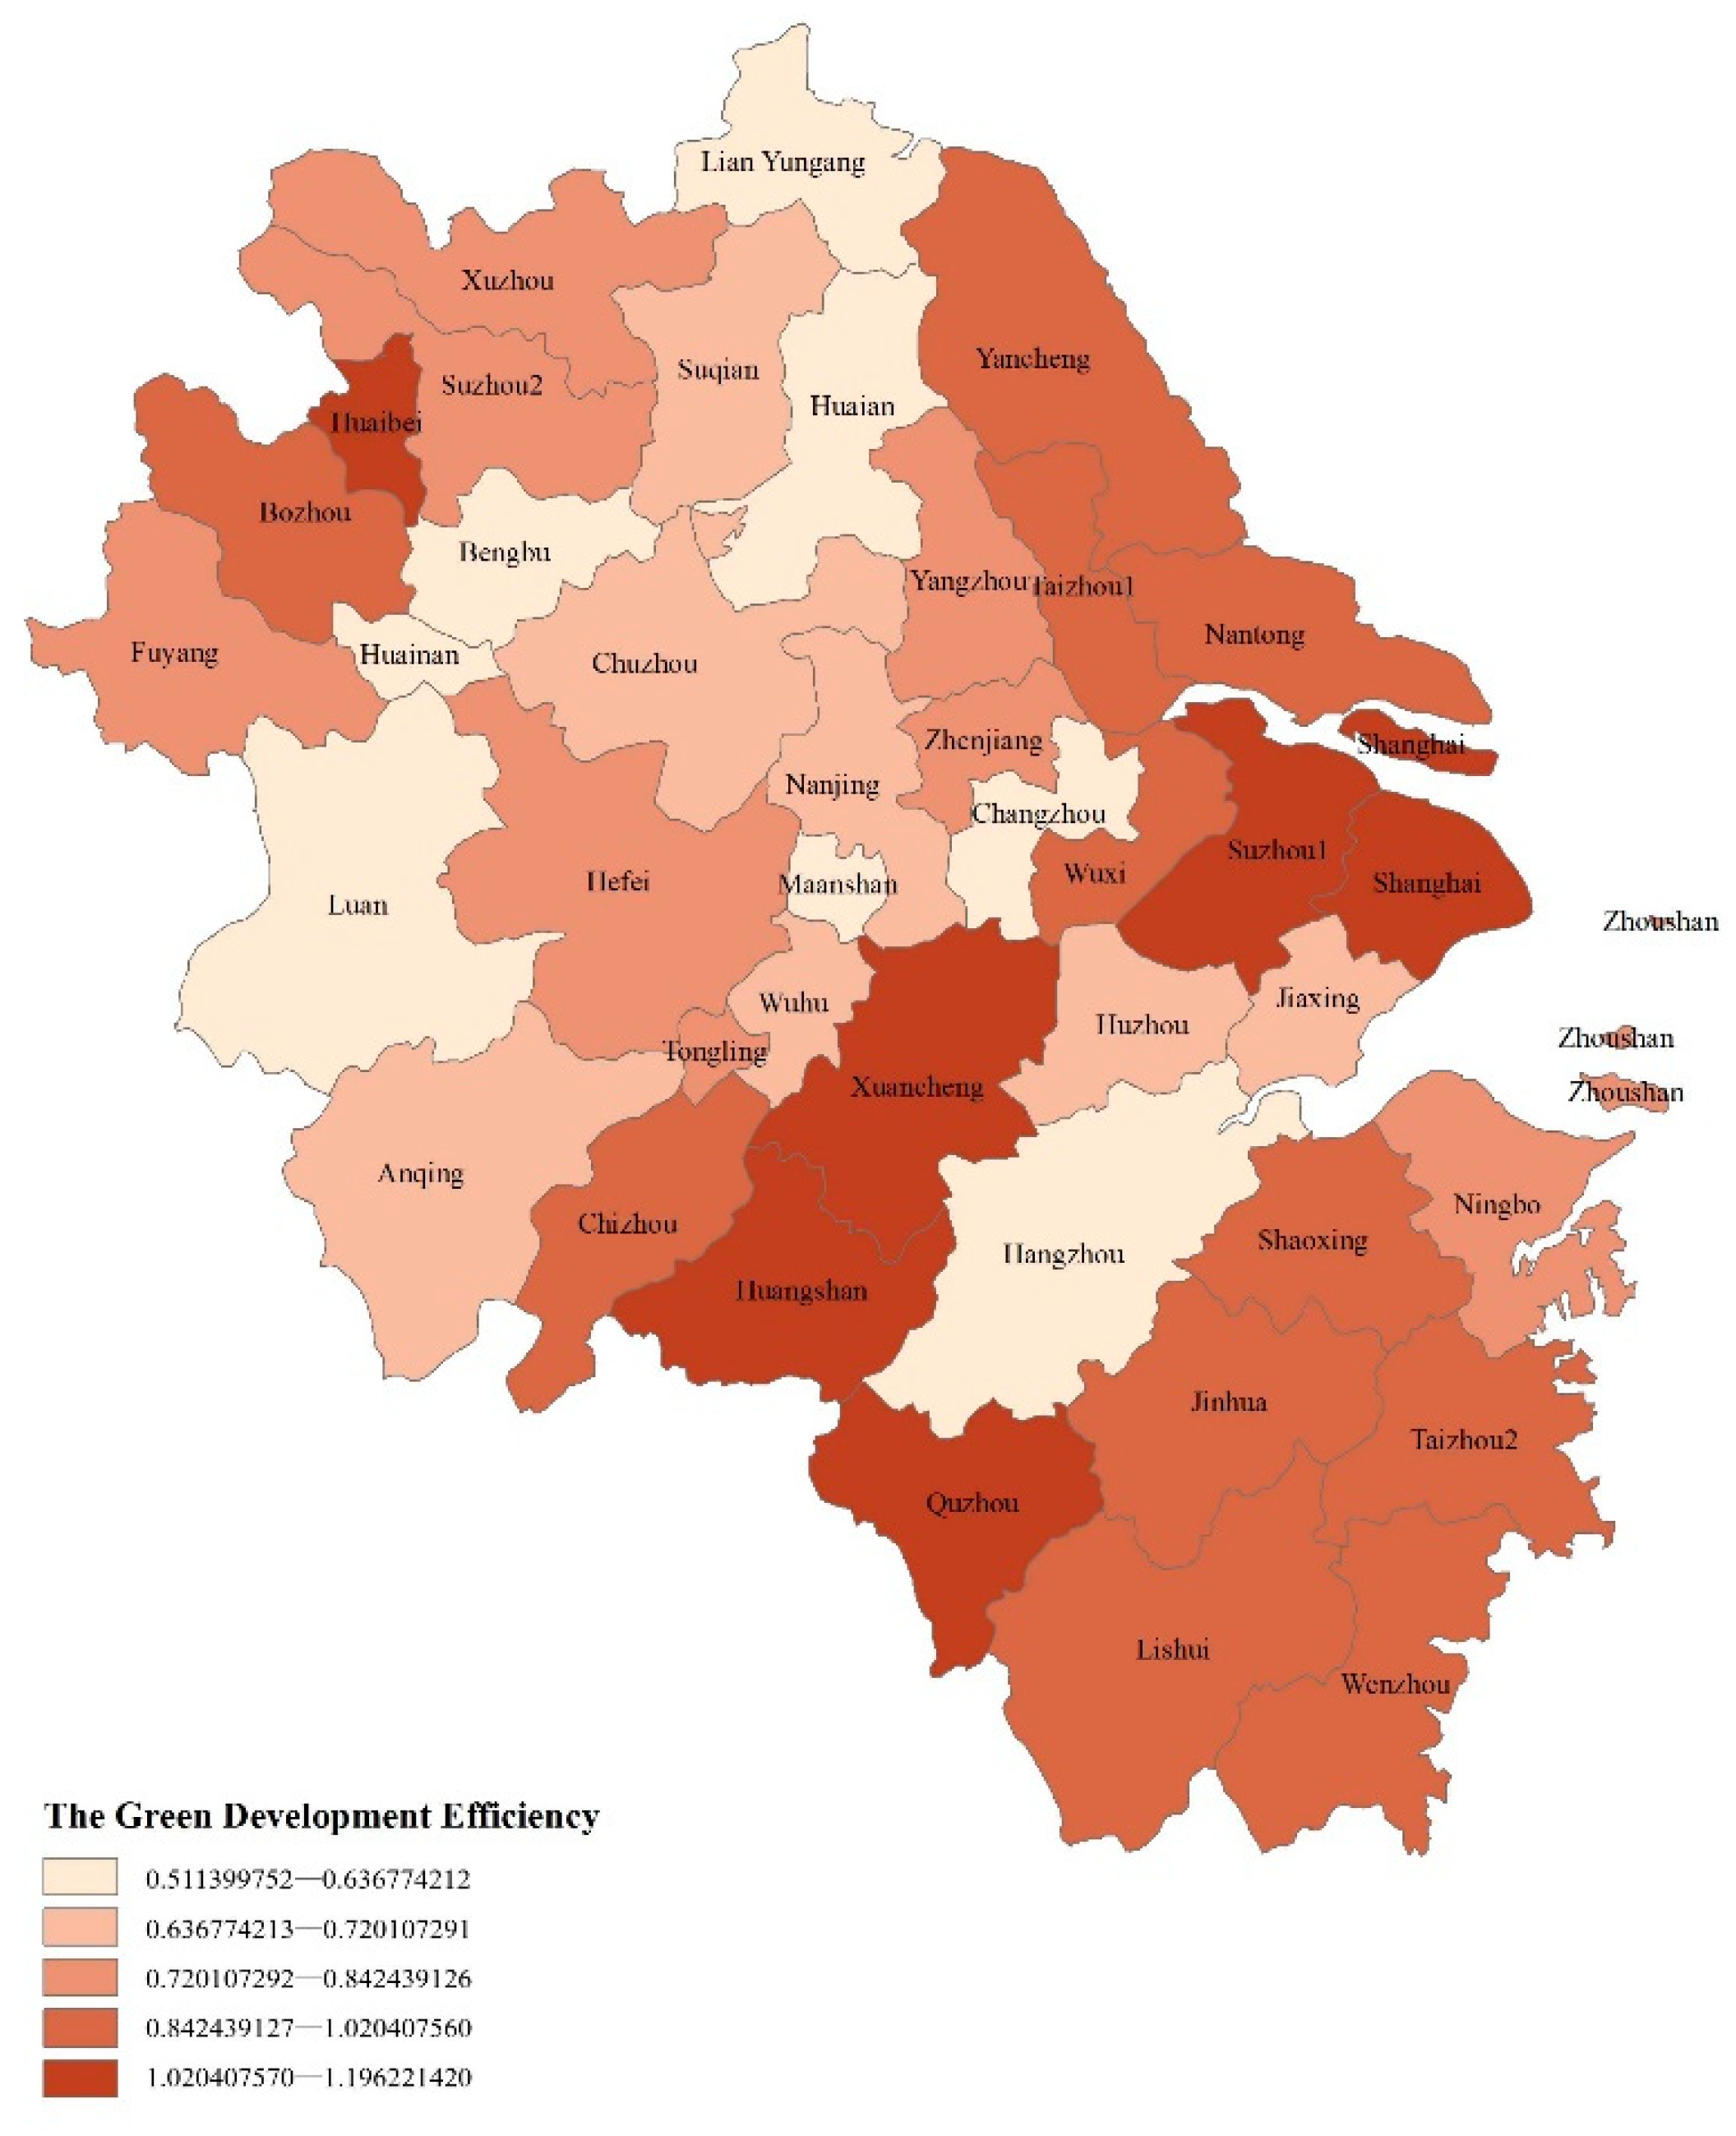
3. Results
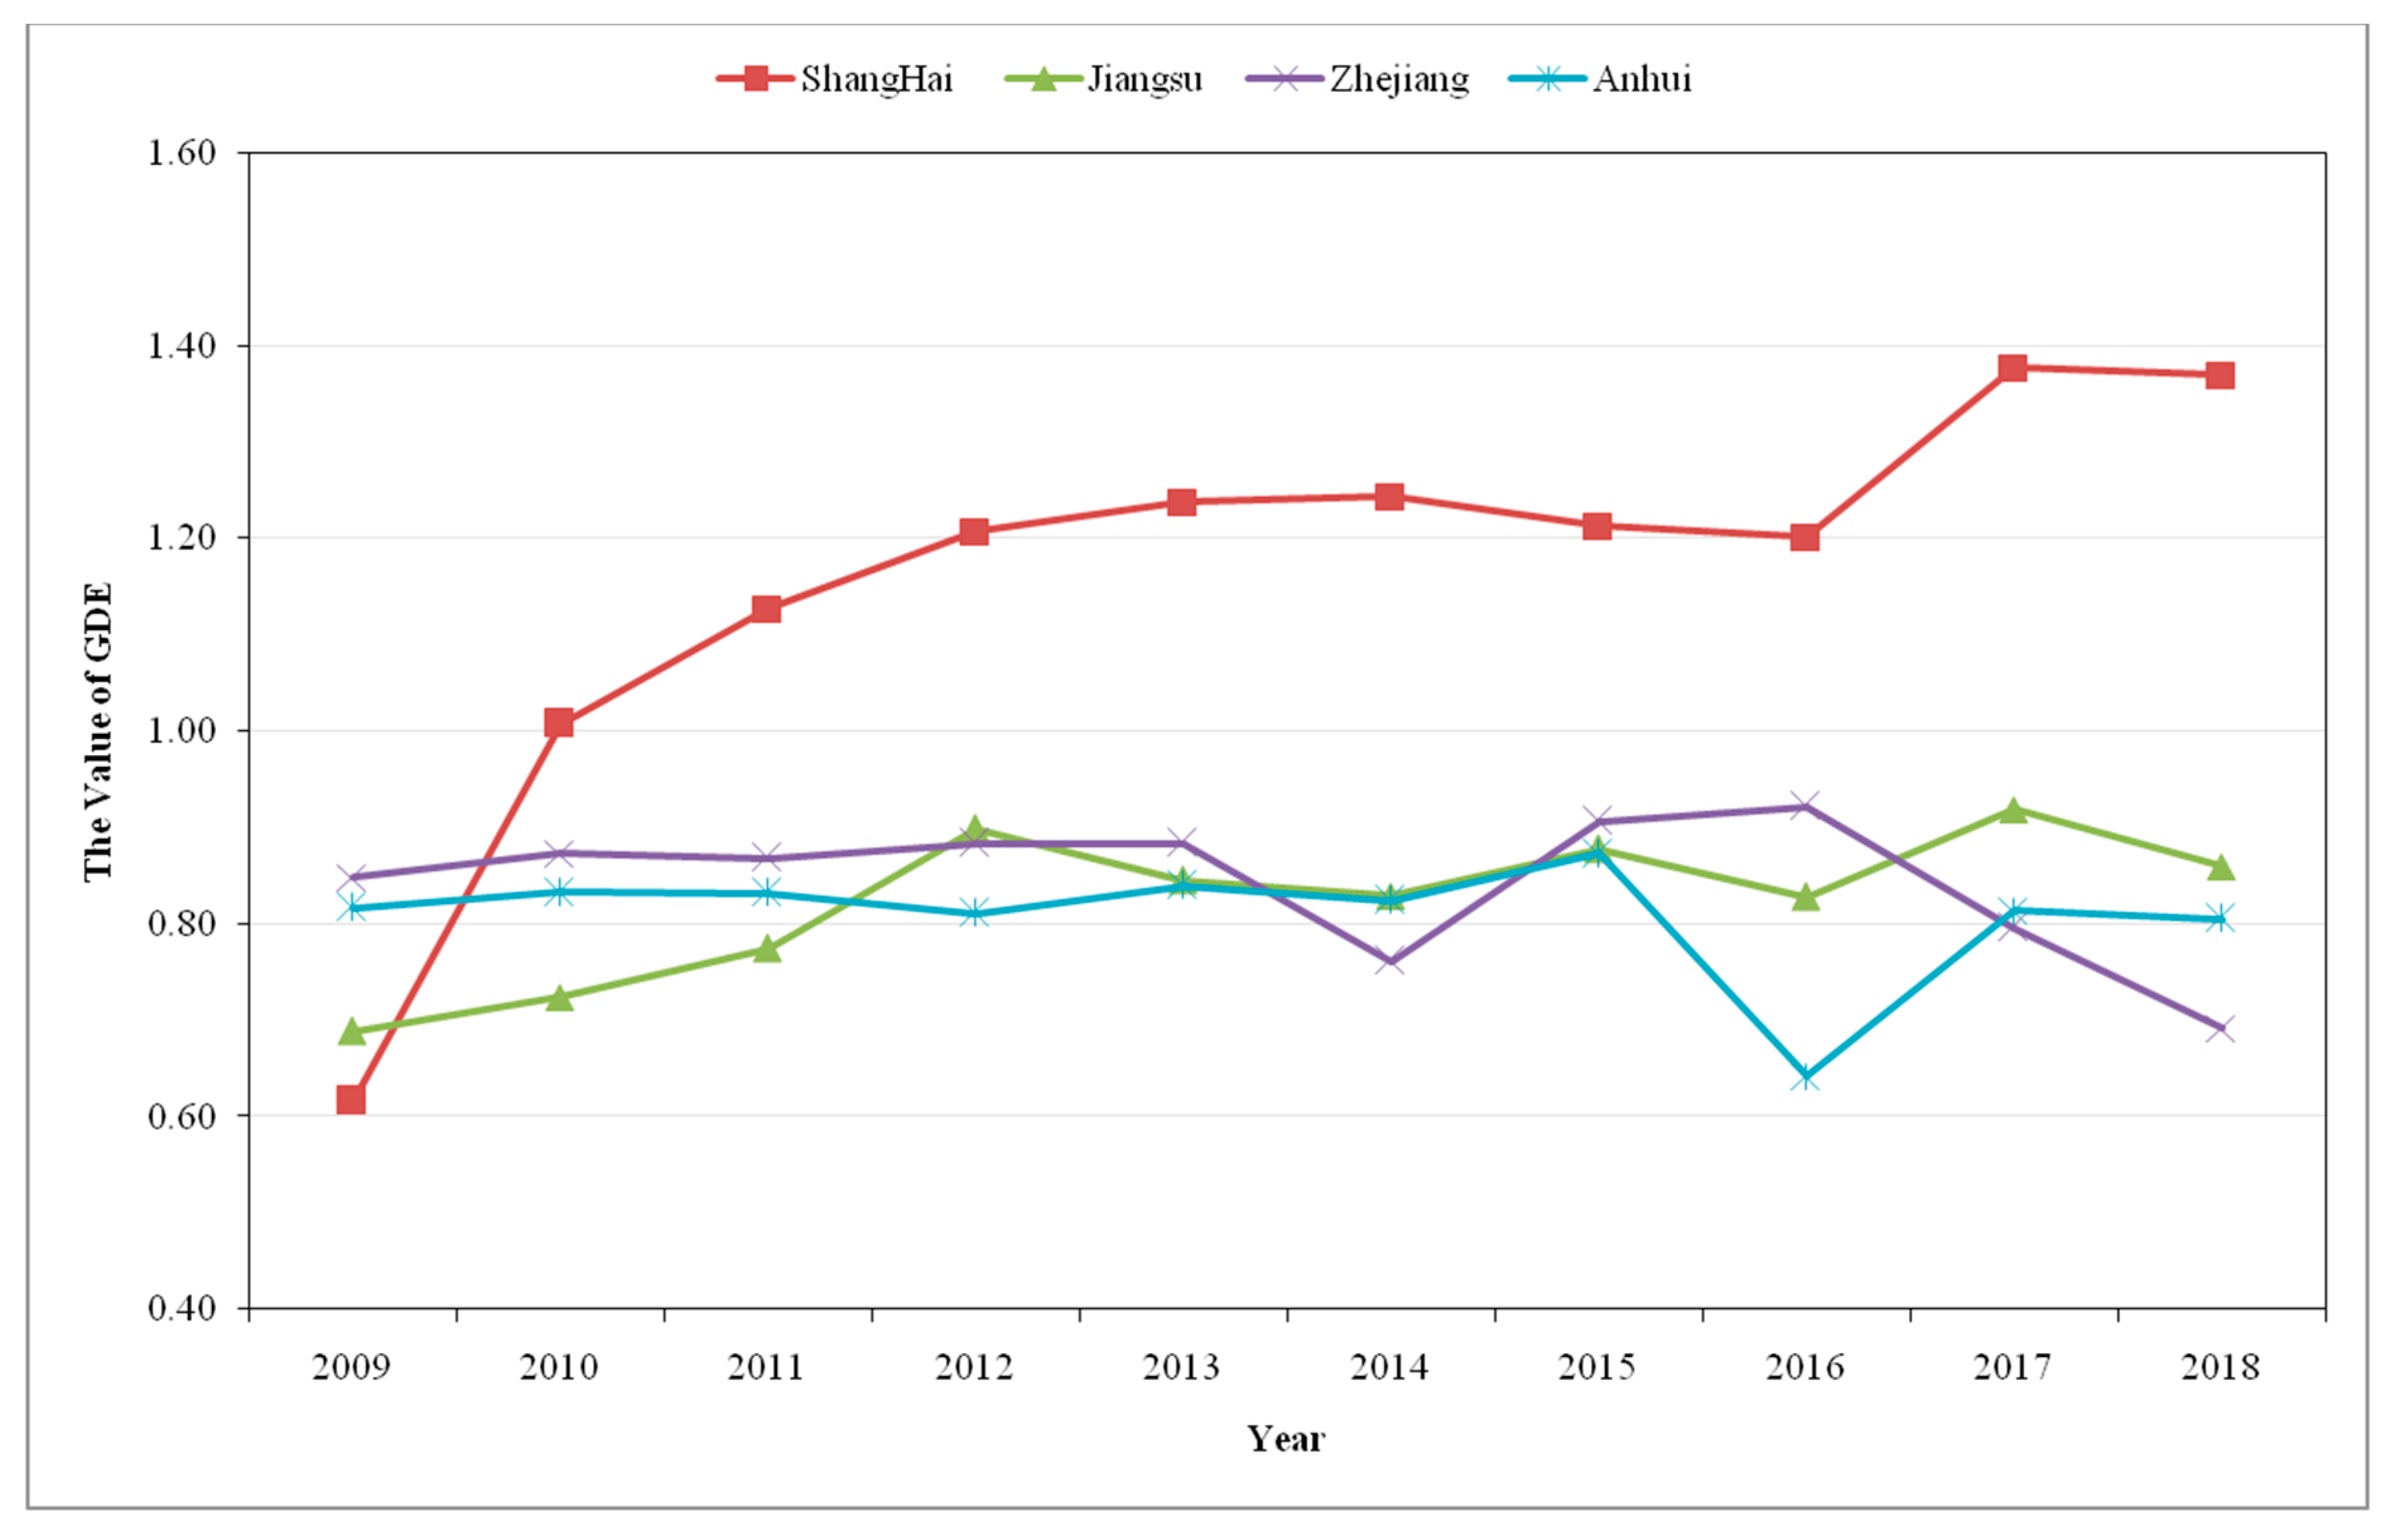
3.1. GDE
3.2. Analysis of the Impact of Urban Development on GDE
3.3. Robustness Tests
4. Discussion
4.1. Information on GDE
4.2. Impact of Urban Development on GDE
4.2.1. Economic Development
4.2.2. Innovation Level
4.2.3. Urban Construction
4.2.4. Government Planning
4.2.5. Other Factors
5. Conclusions
Author Contributions
Funding
Institutional Review Board Statement
Informed Consent Statement
Data Availability Statement
Conflicts of Interest
Appendix A

| City | 2009 | 2010 | 2011 | 2012 | 2013 | 2014 | 2015 | 2016 | 2017 | 2018 | Mean Value | Average Annual Growth Rate |
|---|---|---|---|---|---|---|---|---|---|---|---|---|
| Shanghai | 0.616 | 1.007 | 1.127 | 1.207 | 1.238 | 1.244 | 1.213 | 1.202 | 1.377 | 1.369 | 1.160 | 10.34% |
| Nanjing | 0.468 | 0.488 | 0.527 | 0.576 | 0.666 | 0.617 | 0.763 | 0.684 | 0.998 | 0.774 | 0.656 | 7.40% |
| Wuxi | 0.796 | 0.793 | 0.849 | 1.077 | 1.122 | 0.919 | 1.064 | 1.060 | 1.197 | 0.982 | 0.986 | 3.33% |
| Xuzhou | 0.564 | 0.528 | 0.552 | 1.642 | 0.659 | 0.498 | 0.695 | 0.841 | 0.785 | 0.748 | 0.751 | 4.67% |
| Changzhou | 0.557 | 0.526 | 0.548 | 0.607 | 0.670 | 0.546 | 0.702 | 0.625 | 0.833 | 0.756 | 0.637 | 4.77% |
| Suzhou1 | 1.106 | 1.149 | 1.212 | 1.034 | 1.013 | 1.067 | 1.108 | 1.162 | 1.114 | 0.797 | 1.076 | −2.88% |
| Nantong | 0.774 | 0.803 | 0.788 | 1.087 | 0.928 | 0.675 | 1.010 | 1.016 | 1.005 | 0.869 | 0.896 | 3.73% |
| Lian Yungang | 0.522 | 0.557 | 0.599 | 0.615 | 0.676 | 0.508 | 0.679 | 0.709 | 0.611 | 0.586 | 0.606 | 2.47% |
| Huaian | 0.425 | 0.392 | 0.502 | 0.532 | 0.618 | 0.587 | 0.699 | 0.604 | 0.761 | 0.813 | 0.593 | 8.42% |
| Yancheng | 1.021 | 1.021 | 1.035 | 1.041 | 1.222 | 1.447 | 0.863 | 0.894 | 0.776 | 0.767 | 1.009 | −1.49% |
| Yangzhou | 0.760 | 0.803 | 0.791 | 0.780 | 0.592 | 0.833 | 0.907 | 0.833 | 1.009 | 1.060 | 0.837 | 5.15% |
| Zhenjiang | 0.632 | 0.629 | 0.672 | 0.746 | 0.790 | 0.859 | 0.823 | 0.783 | 0.829 | 0.791 | 0.755 | 2.71% |
| Taizhou1 | 0.828 | 0.855 | 0.969 | 0.988 | 0.991 | 1.017 | 1.055 | 0.985 | 0.874 | 1.045 | 0.961 | 3.00% |
| Suqian | 0.579 | 0.587 | 0.668 | 0.656 | 0.644 | 0.791 | 0.711 | 0.601 | 0.692 | 0.678 | 0.661 | 2.43% |
| Hangzhou | 0.552 | 0.494 | 0.522 | 0.558 | 0.629 | 0.618 | 0.681 | 0.676 | 0.891 | 0.648 | 0.627 | 2.99% |
| Ningbo | 0.694 | 0.703 | 0.766 | 0.804 | 0.848 | 0.564 | 0.820 | 0.725 | 0.819 | 0.696 | 0.744 | 2.10% |
| Wenzhou | 1.181 | 1.155 | 0.860 | 0.901 | 0.945 | 0.644 | 1.022 | 1.035 | 0.760 | 0.639 | 0.914 | −3.61% |
| Jiaxing | 0.476 | 0.716 | 0.724 | 0.729 | 0.809 | 0.642 | 0.793 | 1.045 | 0.589 | 0.567 | 0.709 | 5.60% |
| Huzhou | 0.663 | 0.684 | 0.705 | 0.722 | 0.774 | 0.307 | 0.857 | 0.785 | 0.677 | 0.550 | 0.672 | 10.42% |
| Shaoxing | 1.123 | 1.141 | 1.078 | 1.086 | 0.736 | 0.712 | 0.753 | 0.795 | 0.708 | 0.654 | 0.879 | −5.10% |
| Jinhua | 1.100 | 1.099 | 1.084 | 1.053 | 1.098 | 1.110 | 1.135 | 0.849 | 0.680 | 0.458 | 0.967 | −8.27% |
| Quzhou | 1.088 | 0.888 | 1.056 | 1.049 | 1.032 | 1.066 | 1.056 | 1.806 | 0.854 | 0.599 | 1.049 | −1.23% |
| Zhoushan | 0.673 | 0.775 | 0.716 | 0.717 | 0.700 | 0.673 | 0.748 | 0.488 | 1.027 | 1.583 | 0.810 | 15.83% |
| Taizhou2 | 0.857 | 0.897 | 1.021 | 1.001 | 1.001 | 0.954 | 1.002 | 0.927 | 0.838 | 0.663 | 0.916 | −2.35% |
| Lishui | 0.925 | 1.053 | 1.016 | 1.102 | 1.148 | 1.090 | 1.100 | 1.004 | 0.911 | 0.554 | 0.991 | −4.26% |
| Hefei | 0.533 | 0.565 | 0.588 | 0.618 | 0.823 | 0.509 | 0.884 | 0.860 | 1.082 | 1.010 | 0.747 | 11.15% |
| Wuhu | 0.672 | 0.583 | 0.608 | 0.647 | 0.668 | 0.502 | 0.769 | 0.694 | 0.715 | 0.952 | 0.681 | 6.17% |
| Bengbu | 0.575 | 0.572 | 0.552 | 0.558 | 0.559 | 0.576 | 0.749 | 0.456 | 0.805 | 0.697 | 0.610 | 6.03% |
| Huainan | 0.540 | 0.545 | 0.485 | 0.532 | 0.457 | 0.479 | 0.492 | 0.765 | 0.325 | 0.495 | 0.511 | 4.81% |
| Maanshan | 0.728 | 0.668 | 0.561 | 0.538 | 0.550 | 0.347 | 0.569 | 0.544 | 0.569 | 0.656 | 0.573 | 1.81% |
| Huaibei | 0.676 | 1.162 | 1.099 | 1.134 | 1.048 | 1.446 | 1.545 | 1.171 | 1.212 | 1.469 | 1.196 | 11.94% |
| Tongling | 1.112 | 1.009 | 0.771 | 0.740 | 0.715 | 0.774 | 0.722 | 0.689 | 0.876 | 1.018 | 0.842 | 0.01% |
| Anqing | 0.650 | 0.712 | 0.700 | 0.764 | 0.740 | 0.687 | 0.837 | 0.656 | 0.773 | 0.682 | 0.720 | 1.46% |
| Huangshan | 0.851 | 0.930 | 1.051 | 1.234 | 1.223 | 1.494 | 1.242 | 0.434 | 1.402 | 1.121 | 1.098 | 20.19% |
| Chuzhou | 0.630 | 0.643 | 0.727 | 0.681 | 0.729 | 0.751 | 0.875 | 0.669 | 0.591 | 0.565 | 0.686 | −0.46% |
| Fuyang | 1.059 | 0.817 | 0.795 | 0.541 | 0.813 | 0.882 | 0.951 | 0.737 | 0.705 | 0.491 | 0.779 | −5.34% |
| Suzhou2 | 0.792 | 0.783 | 0.770 | 0.752 | 0.792 | 0.783 | 0.763 | 0.682 | 0.766 | 0.897 | 0.778 | 1.69% |
| Luan | 0.715 | 0.619 | 0.561 | 0.647 | 0.599 | 1.101 | 0.552 | 0.380 | 0.563 | 0.435 | 0.617 | 1.47% |
| Bozhou | 1.356 | 1.311 | 1.182 | 1.115 | 1.050 | 1.026 | 1.006 | 0.581 | 0.897 | 0.681 | 1.020 | −4.54% |
| Chizhou | 0.795 | 1.038 | 1.171 | 1.149 | 1.268 | 1.002 | 0.891 | 0.424 | 1.161 | 1.112 | 1.001 | 15.20% |
| Xuancheng | 1.390 | 1.362 | 1.691 | 1.329 | 1.402 | 0.837 | 1.114 | 0.532 | 0.581 | 0.598 | 1.084 | −4.57% |
References
- Wang, J.; Cao, S.-J.; Yu, C.W. Development Trend and Challenges of Sustainable Urban Design in the Digital Age; SAGE Publications Sage UK: London, UK, 2021; Volume 30, pp. 3–6. [Google Scholar]
- Kuddus, M.A.; Tynan, E.; McBryde, E. Urbanization: A problem for the rich and the poor? Public Health Rev. 2020, 41, 1–4. [Google Scholar] [CrossRef]
- Liang, L.; Wang, Z.; Li, J. The effect of urbanization on environmental pollution in rapidly developing urban agglomerations. J. Clean. Prod. 2019, 237, 117649. [Google Scholar] [CrossRef]
- Liu, Z.; Ciais, P.; Deng, Z.; Lei, R.; Davis, S.J.; Feng, S.; Zheng, B.; Cui, D.; Dou, X.; Zhu, B. Near-real-time monitoring of global CO2 emissions reveals the effects of the COVID-19 pandemic. Nat. Commun. 2020, 11, 5172. [Google Scholar] [CrossRef] [PubMed]
- Yigitcanlar, T.; Teriman, S. Rethinking sustainable urban development: Towards an integrated planning and development process. Int. J. Environ. Sci. Technol. 2015, 12, 341–352. [Google Scholar] [CrossRef] [Green Version]
- Wu, J.; Xiang, W.-N.; Zhao, J. Urban ecology in China: Historical developments and future directions. Landsc. Urban Plan. 2014, 125, 222–233. [Google Scholar] [CrossRef]
- Fawzy, S.; Osman, A.I.; Doran, J.; Rooney, D.W. Strategies for mitigation of climate change: A review. Environ. Chem. Lett. 2020, 18, 2069–2094. [Google Scholar] [CrossRef]
- Osman, A.I.; Hefny, M.; Abdel Maksoud, M.; Elgarahy, A.M.; Rooney, D.W. Recent advances in carbon capture storage and utilisation technologies: A review. Environ. Chem. Lett. 2021, 19, 797–849. [Google Scholar] [CrossRef]
- Berndes, G.; Abt, B.; Asikainen, A.; Cowie, A.; Dale, V.; Egnell, G.; Lindner, M.; Marelli, L.; Paré, D.; Pingoud, K. Forest biomass, carbon neutrality and climate change mitigation. Sci. Policy 2016, 3. [Google Scholar] [CrossRef]
- Chen, J.M. Carbon neutrality: Toward a sustainable future. Innovation 2021, 2, 100127. [Google Scholar] [CrossRef]
- Chen, L.; Msigwa, G.; Yang, M.; Osman, A.I.; Fawzy, S.; Rooney, D.W.; Yap, P.S. Strategies to achieve a carbon neutral society: A review. Env. Chem. Lett. 2022, 1–34. [Google Scholar] [CrossRef]
- Li, X.; Pan, J. China Green Development Index Report 2012; Springer: Berlin/Heidelberg, Germany, 2015. [Google Scholar]
- Caineng, Z.; Xiong, B.; Huaqing, X.; ZHENG, D.; Zhixin, G.; Ying, W.; JIANG, L.; Songqi, P.; Songtao, W. The role of new energy in carbon neutral. Pet. Explor. Dev. 2021, 48, 480–491. [Google Scholar]
- Sun, C.; Tong, Y.; Zou, W. The evolution and a temporal-spatial difference analysis of green development in China. Sustain. Cities Soc. 2018, 41, 52–61. [Google Scholar] [CrossRef]
- Grossman, G.M.; Krueger, A.B. Economic Growth and the Environment. Q. J. Econ. 1995, 110, 353–377. [Google Scholar] [CrossRef] [Green Version]
- Awan, A.G. Relationship between environment and sustainable economic development: A theoretical approach to environmental problems. Int. J. Asian Soc. Sci. 2013, 3, 741–761. [Google Scholar]
- White, S.S.; Ellis, C. Sustainability, the environment, and new urbanism: An assessment and agenda for research. J. Archit. Plan. Res. 2007, 24, 125–142. [Google Scholar]
- UNEP. Towards a Green Economy: Pathways to Sustainable Development and Poverty Eradication; UNEP: Nairobi, Kenya, 2011. [Google Scholar]
- Chen, L.; Zhang, X.; He, F.; Yuan, R. Regional Green Development Level and Its Spatial Relationship under the Constraints of Haze in China. J. Clean. Prod. 2018, 210, 376–387. [Google Scholar] [CrossRef]
- Zhu, B.Z.; Zhang, M.F.; Zhou, Y.H.; Wang, P.; Sheng, J.C.; He, K.J.; Wei, Y.M.; Xie, R. Exploring the effect of industrial structure adjustment on interprovincial green development efficiency in China: A novel integrated approach. Energy Policy 2019, 134, 12. [Google Scholar] [CrossRef]
- Sun, W.; Huang, C.C. How does urbanization affect carbon emission efficiency? Evidence from China. J. Clean. Prod. 2020, 272, 9. [Google Scholar] [CrossRef]
- Wu, H.; Li, Y.; Hao, Y.; Ren, S.; Zhang, P. Environmental decentralization, local government competition, and regional green development: Evidence from China. Sci. Total Environ. 2020, 708, 135085. [Google Scholar] [CrossRef]
- Yang, Q.; Wan, X.; Ma, H. Assessing green development efficiency of municipalities and provinces in China integrating models of super-efficiency DEA and malmquist index. Sustainability 2015, 7, 4492–4510. [Google Scholar] [CrossRef] [Green Version]
- Yan, H.; Ting, P.; Wei, Z. On the economic growth effect of the coordinated innovation of the Yangtze river delta urban agglomeration under the integrated national strategy. J. East China Norm. Univ. (Philos. Soc. Sci.) 2019, 51, 99. [Google Scholar]
- Zhang, Y.J.; Yi, W.C.; Li, B.W. The impact of urbanization on carbon emission: Empirical evidence in Beijing. In Proceedings of the 7th International Conference on Applied Energy (ICAE), Abu Dhabi, United Arab Emirates, 28–31 March 2015; pp. 2963–2968. [Google Scholar]
- Feng, S.; Xu, L.D. Decision support for fuzzy comprehensive evaluation of urban development. Fuzzy Sets Syst. 1999, 105, 1–12. [Google Scholar] [CrossRef]
- Su, Y.; Xue, H.; Liang, H. An evaluation model for urban comprehensive carrying capacity: An empirical case from Harbin city. Int. J. Environ. Res. Public Health 2019, 16, 367. [Google Scholar] [CrossRef] [PubMed] [Green Version]
- Feng, C.; Wang, M.; Liu, G.-C.; Huang, J.-B. Green development performance and its influencing factors: A global perspective. J. Clean. Prod. 2017, 144, 323–333. [Google Scholar] [CrossRef]
- Jin, P.; Peng, C.; Song, M. Macroeconomic uncertainty, high-level innovation, and urban green development performance in China. China Econ. Rev. 2019, 55, 1–18. [Google Scholar] [CrossRef]
- Li, Y.M.; Zhao, R.; Liu, T.S.; Zhao, J.F. Does urbanization lead to more direct and indirect household carbon dioxide emissions? Evidence from China during 1996–2012. J. Clean. Prod. 2015, 102, 103–114. [Google Scholar] [CrossRef]
- Charnes, A.; Cooper, W.W.; Rhodes, E. Measuring the efficiency of decision making units. Eur. J. Oper. Res. 1978, 2, 429–444. [Google Scholar] [CrossRef]
- Tone, K. Dealing with Undesirable Outputs in DEA: A Slacks-Based Measure (SBM) Approach; Presentation at NAPW III, Toronto; National Graduate Institue For Policy Studies: Tokyo, Japan, 2004; pp. 44–45. [Google Scholar]
- Tone, K. A slacks-based measure of super-efficiency in data envelopment analysis. Eur. J. Oper. Res. 2002, 143, 32–41. [Google Scholar] [CrossRef] [Green Version]
- Zhang, J.; Zeng, W.; Wang, J.; Yang, F.; Jiang, H. Regional low-carbon economy efficiency in China: Analysis based on the Super-SBM model with CO2 emissions. J. Clean. Prod. 2017, 163, 202–211. [Google Scholar] [CrossRef]
- Saglam, U. A two-stage performance assessment of utility-scale wind farms in Texas using data envelopment analysis and Tobit models. J. Clean. Prod. 2018, 201, 580–598. [Google Scholar] [CrossRef]
- Ma, X.; Liu, Y.; Wei, X.; Li, Y.; Zheng, M.; Li, Y.; Cheng, C.; Wu, Y.; Liu, Z.; Yu, Y. Measurement and decomposition of energy efficiency of Northeast China-based on super efficiency DEA model and Malmquist index. Environ. Sci. Pollut. Res. 2017, 24, 19859–19873. [Google Scholar] [CrossRef] [PubMed]
- Zhang, J.; Chang, Y.; Zhang, L.; Li, D. Do technological innovations promote urban green development?—A spatial econometric analysis of 105 cities in China. J. Clean. Prod. 2018, 182, 395–403. [Google Scholar]
- Cheng, Y.; Shao, T.; Lai, H.; Shen, M.; Li, Y. Total-Factor Eco-Efficiency and Its Influencing Factors in the Yangtze River Delta Urban Agglomeration, China. Int. J. Environ. Res. Public Health 2019, 16, 3814. [Google Scholar] [CrossRef] [Green Version]
- Florek, M.; Breitbarth, T.; Conejo, F. Mega Event = Mega Impact? Travelling fans’ experience and perceptions of the 2006 FIFA World Cup host nation. J. Sport Tour. 2008, 13, 199–219. [Google Scholar]
- Zagnoli, P.; Radicchi, E. Do major sports events enhance tourism destinations? Phys. Cult. Sport 2009, 47, 44. [Google Scholar] [CrossRef]
- Suárez, F.F.; Cusumano, M.A.; Fine, C.H. Flexibility and Performance: A Literature Critique and Strategic Framework; Sloan School of Management, Massachusetts Institute of Technology: Cambridge, MA, USA, 1991. [Google Scholar]
- Yang, Y.; Liu, Z.; Chen, H.; Wang, Y.; Yuan, G. Evaluating Regional Eco-Green Cooperative Development Based on a Heterogeneous Multi-Criteria Decision-Making Model: Example of the Yangtze River Delta Region. Sustainability 2020, 12, 3029. [Google Scholar] [CrossRef] [Green Version]
- Guo, Y.H.; Tong, L.J.; Mei, L. The effect of industrial agglomeration on green development efficiency in Northeast China since the revitalization. J. Clean. Prod. 2020, 258, 13. [Google Scholar] [CrossRef]
- Wang, S.X.; Fu, Y.B.; Zhang, Z.G. Population growth and the environmental Kuznets curve. China Econ. Rev. 2015, 36, 146–165. [Google Scholar] [CrossRef]
- Musakwa, W.; Van Niekerk, A. Monitoring sustainable urban development using built-up area indicators: A case study of Stellenbosch, South Africa. Environ. Dev. Sustain. 2015, 17, 547–566. [Google Scholar] [CrossRef]
- Droste, N.; Hansjürgens, B.; Kuikman, P.; Otter, N.; Antikainen, R.; Leskinen, P.; Pitkänen, K.; Saikku, L.; Loiseau, E.; Thomsen, M. Steering innovations towards a green economy: Understanding government intervention. J. Clean. Prod. 2016, 135, 426–434. [Google Scholar] [CrossRef]
- Wu, Z.; Chen, R.; Meadows, M.E.; Sengupta, D.; Xu, D. Changing urban green spaces in Shanghai: Trends, drivers and policy implications. Land Use Policy 2019, 87, 104080. [Google Scholar] [CrossRef]
- Pang, R.; Zheng, D.; Shi, M.; Zhang, X. Pollute first, control later? Exploring the economic threshold of effective environmental regulation in China’s context. J. Environ. Manag. 2019, 248, 109275. [Google Scholar]
- Deng, X.; Huang, J.; Rozelle, S.; Uchida, E. Economic growth and the expansion of urban land in China. Urban Stud. 2010, 47, 813–843. [Google Scholar] [CrossRef]
- Song, W.; Deng, X.; Liu, B.; Li, Z.; Jin, G. Impacts of grain-for-green and grain-for-blue policies on valued ecosystem services in Shandong Province, China. Adv. Meteorol. 2015, 2015, 213534. [Google Scholar] [CrossRef] [Green Version]
- Zheng, S.; Kahn, M.E. Does government investment in local public goods spur gentrification? Evidence from Beijing. Real Estate Econ. 2013, 41, 1–28. [Google Scholar] [CrossRef]
- Wang, S.; Luo, K.; Liu, Y.; Zhang, S.; Lin, X.; Ni, R.; Tian, X.; Gao, X. Economic level and human longevity: Spatial and temporal variations and correlation analysis of per capita GDP and longevity indicators in China. Arch. Gerontol. Geriatr. 2015, 61, 93–102. [Google Scholar] [CrossRef]
- Wang, H.; Wang, M. Effects of technological innovation on energy efficiency in China: Evidence from dynamic panel of 284 cities. Sci. Total Environ. 2020, 709, 136172. [Google Scholar] [CrossRef]
| Vector | No. | Index | Unit |
|---|---|---|---|
| Input Index | I1 | Annual electricity consumption | 10,000 kwh |
| I2 | Investment in fixed assets | 10,000 RMB | |
| I3 | Persons employed in the management of water conservancy and the environment | Person | |
| Output Index | O1 | Industrial wastewater discharge | 10,000 tons |
| O2 | Industrial sulfur dioxide production | Ton | |
| O3 | Gross regional product | 10,000 RMB | |
| Urban Development Index | U1 | RSCG | 10,000 RMB |
| U2 | EEST | 10,000 RMB | |
| U3 | ABD | sq.km | |
| U4 | GACA | Hectare | |
| C1 | TGDP | % | |
| C2 | UR | % |
| Variable | N | Mean | STD. | Min. | Max. |
|---|---|---|---|---|---|
| I1 | 410 | 1.828 × 10⁶ | 3.031 × 10⁶ | 67,166 | 3.182 × 10⁷ |
| I2 | 410 | 2.173 × 10⁷ | 1.806 × 10⁷ | 2.352 × 10⁶ | 1.124 × 10⁸ |
| I3 | 410 | 9873 | 12,761 | 455 | 93,600 |
| O1 | 410 | 11,624 | 13,123 | 486 | 80,468 |
| O2 | 410 | 43,067 | 45,387 | 1407 | 496,377 |
| O3 | 410 | 3.578 × 10⁷ | 4.420 × 10⁷ | 1.331 × 10⁶ | 3.268 × 10⁸ |
| U1 | 410 | 1.354 × 10⁷ | 1.690 × 10⁷ | 791,784 | 1.267 × 10⁸ |
| U2 | 410 | 1.022 × 10⁶ | 1.572 × 10⁶ | 64,104 | 1.344 × 10⁷ |
| U3 | 410 | 176.5 | 186.4 | 31 | 1238 |
| U4 | 410 | 7925 | 10,934 | 1256 | 139,427 |
| C1 | 410 | 0.420 | 0.0825 | 0.234 | 0.793 |
| C2 | 410 | 0.587 | 0.123 | 0.291 | 0.896 |
| Variable | Model | |
|---|---|---|
| Model 1 | Model 2 | |
| RSCG (U1) | 0.636 * (1.87) | |
| EEST (U2) | 0.574 ** (2.26) | |
| ABD (U3) | −1.915 *** (−4.46) | |
| GACA (U4) | 0.915 ** (2.56) | |
| TGDP (C1) | 0.292 *** (3.85) | 0.214 ** (2.30) |
| UR (C2) | −0.114 * (−1.65) | −0.038 (−0.46) |
| Cons | 0.767 *** (25.86) | 0.780 *** (21.25) |
| Log-Likelihood | −48.224 | −26.523 |
| LR chi2 (n) | 15.00 | 58.40 |
| Prob > chi2 | 0.0006 | 0.0000 |
| Pseudo-R2 | 0.1346 | 0.5240 |
| Variable | Model | |
|---|---|---|
| Model 1 | Model 2 | |
| RSCG (U1) | 0.6491939 ** (1.99) | |
| EEST (U2) | 0.5516435 ** (2.28) | |
| ABD (U3) | −1.787332 *** (−3.94) | |
| GACA (U4) | 0.816832 ** (2.07) | |
| TGDP (C1) | 0.2765065 *** (3.8) | 0.1836616 ** (2.01) |
| UR (C2) | −0.1033908 (−1.59) | −0.0346601 (−0.44) |
| Cons | 0.7350799 *** (17.06) | 0.7804275 *** (21.25) |
| Prob > F | 0.0217 | 0.0000 |
| R2 | 0.0541 | 0.1600 |
Publisher’s Note: MDPI stays neutral with regard to jurisdictional claims in published maps and institutional affiliations. |
© 2022 by the authors. Licensee MDPI, Basel, Switzerland. This article is an open access article distributed under the terms and conditions of the Creative Commons Attribution (CC BY) license (https://creativecommons.org/licenses/by/4.0/).
Share and Cite
Li, D.; Shangguan, Z.; Huang, M.; Zhang, X.; Tang, L. Impacts of Urban Development on Regional Green Development Efficiency—A Case of the Yangtze River Delta in China. Energies 2022, 15, 4785. https://doi.org/10.3390/en15134785
Li D, Shangguan Z, Huang M, Zhang X, Tang L. Impacts of Urban Development on Regional Green Development Efficiency—A Case of the Yangtze River Delta in China. Energies. 2022; 15(13):4785. https://doi.org/10.3390/en15134785
Chicago/Turabian StyleLi, Dian, Ziheng Shangguan, Malan Huang, Xinyue Zhang, and Lu Tang. 2022. "Impacts of Urban Development on Regional Green Development Efficiency—A Case of the Yangtze River Delta in China" Energies 15, no. 13: 4785. https://doi.org/10.3390/en15134785
APA StyleLi, D., Shangguan, Z., Huang, M., Zhang, X., & Tang, L. (2022). Impacts of Urban Development on Regional Green Development Efficiency—A Case of the Yangtze River Delta in China. Energies, 15(13), 4785. https://doi.org/10.3390/en15134785