1. Introduction
The main causes of insulation failures in high-voltage equipment are overvoltages due to lightning and switching operations in high-voltage (HV) energy transmission and distribution systems. Therefore, the international standards [
1,
2,
3,
4,
5] suggest performing impulse voltage tests on HV equipment to confirm its insulation performance. The standard lightning and switching impulse voltages can be generated by a simple resistor and capacitor circuit [
6]. Switching overvoltages are caused by switching operations of circuit breakers and disconnecting switches in HV power systems, and the insulation performance of HV equipment under switching overvoltages has still not been completely studied [
7,
8,
9]. Switching overvoltages produce high electrical field stresses with quite a long time period (several milliseconds) on the insulation of the HV equipment and can possibly cause insulation failures. Thus, according to IEC standards [
4], the insulation performance of HV equipment operating at a system voltage of not less than 300 kV must be confirmed using a switching impulse voltage test.
In impulse voltage tests, the software used for the evaluation of the impulse waveform parameters must be assessed for accuracy using the waveform generated by the test data generator (TDG) program attached to IEC 61083-2 [
10]. The evaluation of the lightning and switching impulse voltage waveform parameters has been widely studied [
11,
12,
13,
14,
15,
16,
17]. In the switching impulse voltage tests, the waveform parameters must be adjusted as per the standard requirements [
1,
2,
3,
4,
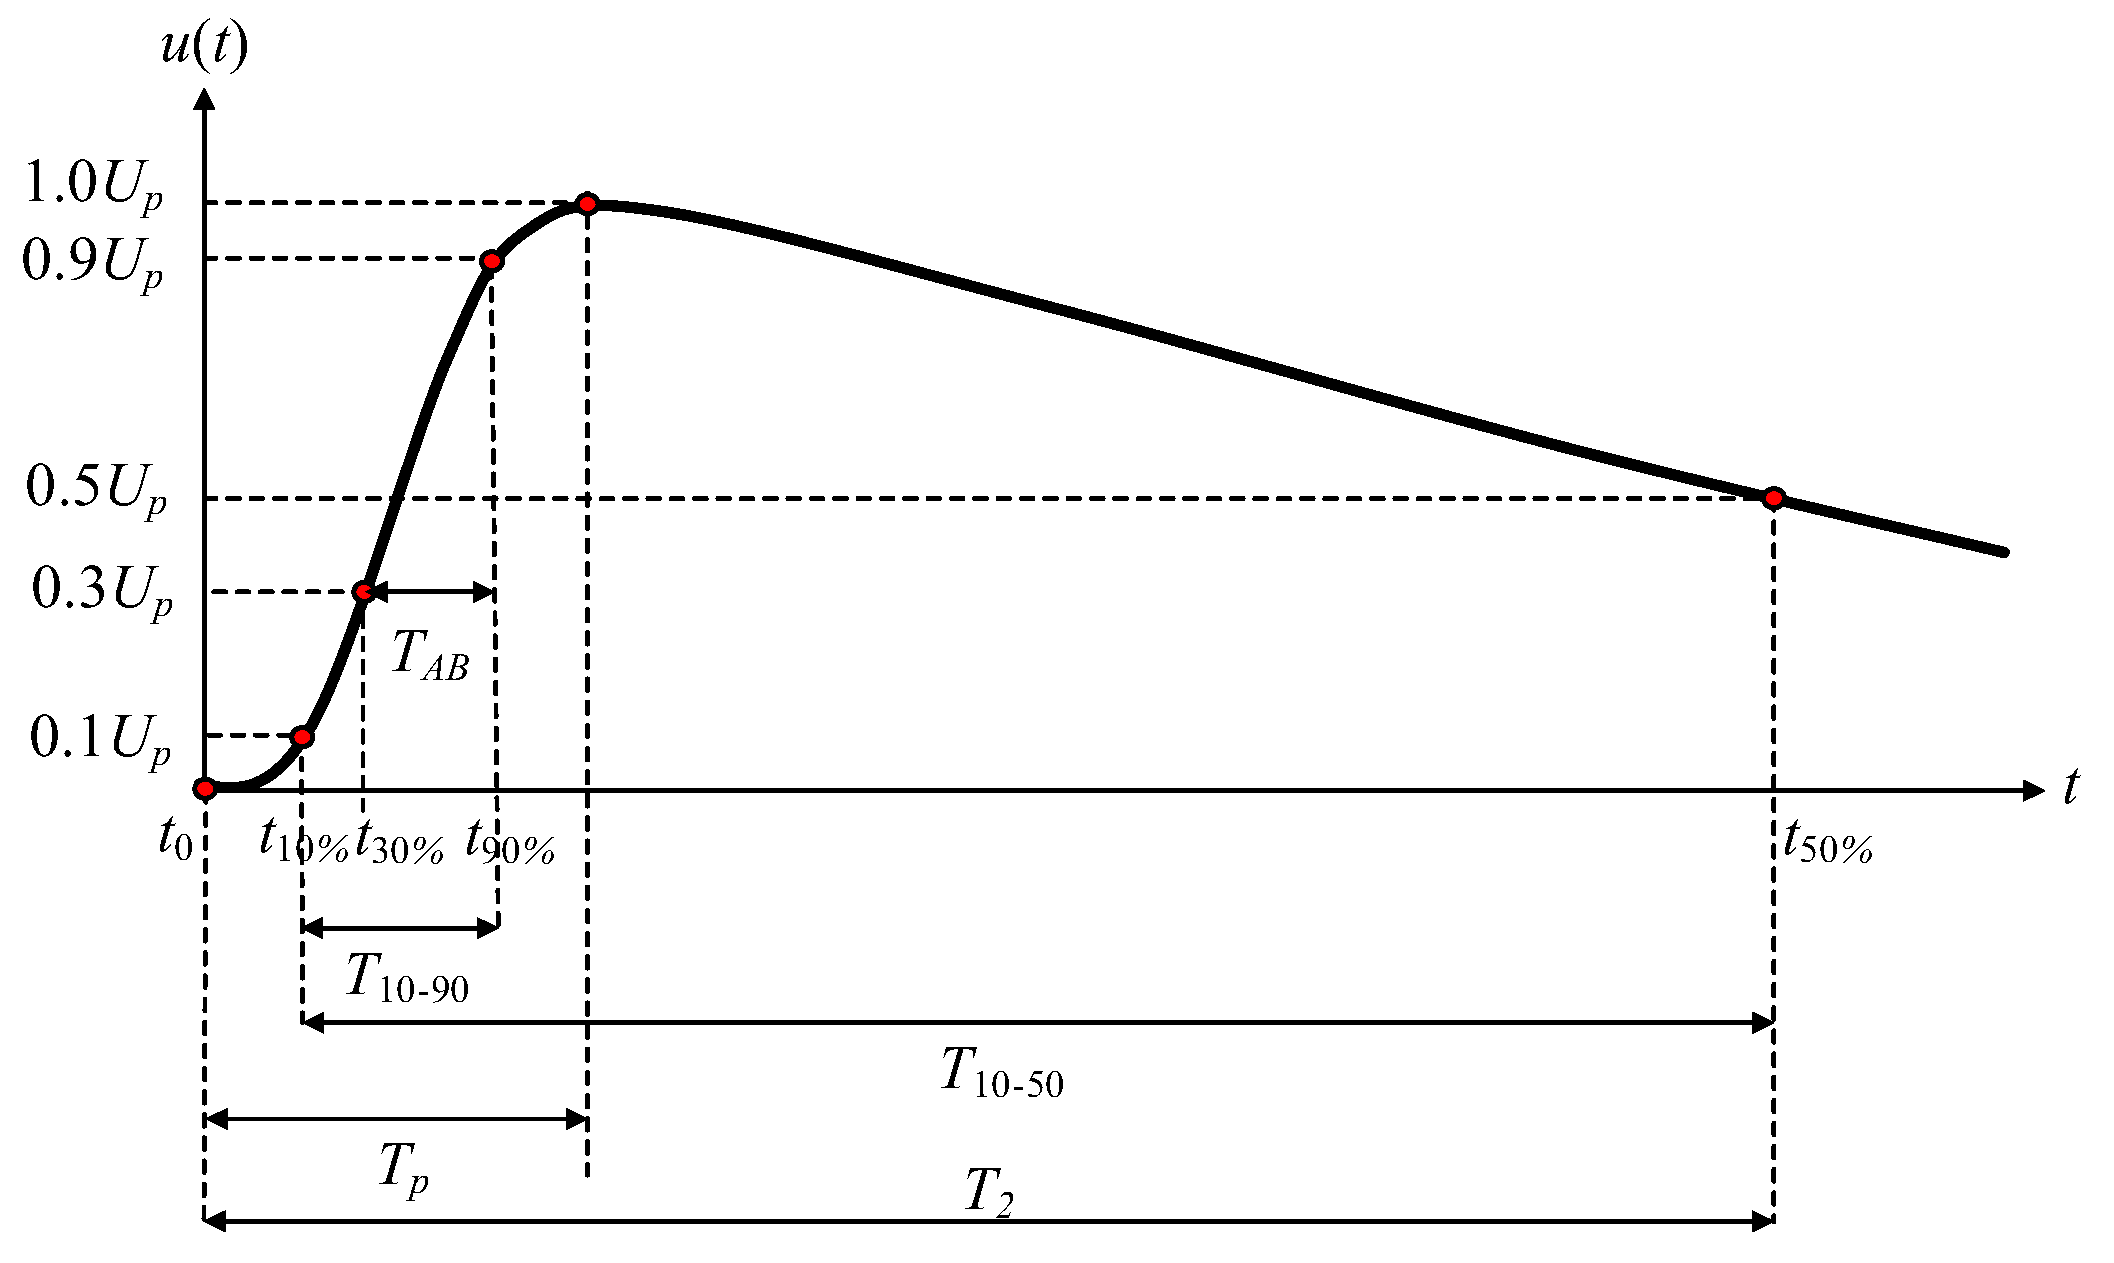
5]. As illustrated in
Figure 1, the time to crest (
Tp), the time to half (
T2), and the peak voltage (
Up) shall be 250 μs ± 20%, 2500 μs ± 60%, and the specified value depending on the system voltage with a tolerance of ±3%, respectively.
T2 is defined as the duration time from the actual origin time (
t0) to the time (
t50%) at 50% of the peak voltage at the tail part of the waveform.
T2 can be determined by proper search and interpolation algorithms.
Up can be determined by searching for the maximum value for the positive waveform or the minimum value for the negative waveform after the offset voltage is removed from the considered waveform. However, there are some difficulties in determining
t0 and
Tp due to noise superimposing on the recorded waveform. In addition,
Tp cannot be determined precisely due to noise and a long duration time around the peak voltage. According to the standard [
1],
Tp can be calculated by Equation (1), where
K and
TAB are defined as Equations (2) and (3).
For determination of
Tp, however, it was reported that
Tp determined by Equation (1) is accurate in only some cases where the times to crest and the times to half are close to 250 μs and 2500 μs, respectively. There is some research which presents approaches for the determination of the accurate time to crest [
16]. The analytical formulas for estimating the waveform parameters
Tp,
T2, and
Up were proposed in [
16].
Tp is also determined from
TAB and the estimated starting point of the considered waveform. The formulas can estimate the waveforms derived from simulated two-exponential waveforms precisely, but deviations in the parameters are increased in the cases of experimental waveforms. In [
17], two-exponential fitting based on a non-linear regression on the waveform data around the crest value was employed to estimate the waveform parameters accurately. Since this method requires software for estimation of the parameters, it is not useful for test engineers for determination of the waveform parameters when compared with the standard and previously developed formulas.
In this paper, a practical approach for the determination of the waveform parameters of the switching impulse voltage was developed. A simple, but relatively accurate approach for the determination of
t0 is proposed. Furthermore, the accurate formula used in the evaluation of
Tp was derived from the analytically simulated two-exponential waveforms, where
Tp and
T2 are in the ranges of 20 μs to 300 μs and 1000 μs to 4000 μs, respectively. The waveforms collected from the standard [
10], simulations and experiments were utilized for verification of the proposed approach. The proposed approach provides relatively high accuracy when compared with those calculated by the standard [
1] and the previously developed formula [
16]. This paper is organized as follows.
Section 1 introduces the problem of evaluation of the waveform parameters of the switching impulse voltages in HV tests and performs the literature review.
Section 2 describes an approach for the analytical generation of switching impulse voltages on the basis of the two-exponential function employed for the development of the new expressions. The development of a new and accurate expression for the determination of the waveform parameters is also presented. The proposed expressions and their verification are presented in
Section 3. At the end of this paper, the conclusions are addressed.
2. Development of the Approach for Evaluation of the Switching Impulse Voltage Parameters
The new accurate approach for evaluation of the switching impulse voltage parameters is developed from the waveform parameters of the impulse voltage waveforms in the form of a two-exponential function, as given in Equation (4). It is quite straightforward to determine
Tp and
T2 from the known
τ1 and
τ2. From Equation (4),
Tp can be calculated analytically by Equation (5), but there is no analytical expression of
T2; it can be calculated by Equation (6) using a numerical approach. A simple Newton–Raphson algorithm [
18] is an effective method used in this paper.
However, accurate
τ1 and
τ2 computed from
Tp and
T2 are required for the development of the proposed approach. In this section, the effective approach for determination of
τ1 and
τ2 from
Tp and
T2 will be presented in
Section 2.1, and the analytical formula for the required waveform parameters will be presented in
Section 2.2.
2.1. Analytical Generation of Switching Impulse Waveforms
For generation of the accurate waveform in the form of a two-exponential function described by
T2 and
Tp, it is necessary to know the accurate time constants of
τ1 and
τ2. In this paper, a time normalization technique was utilized to reduce the number of variables, and the secant method [
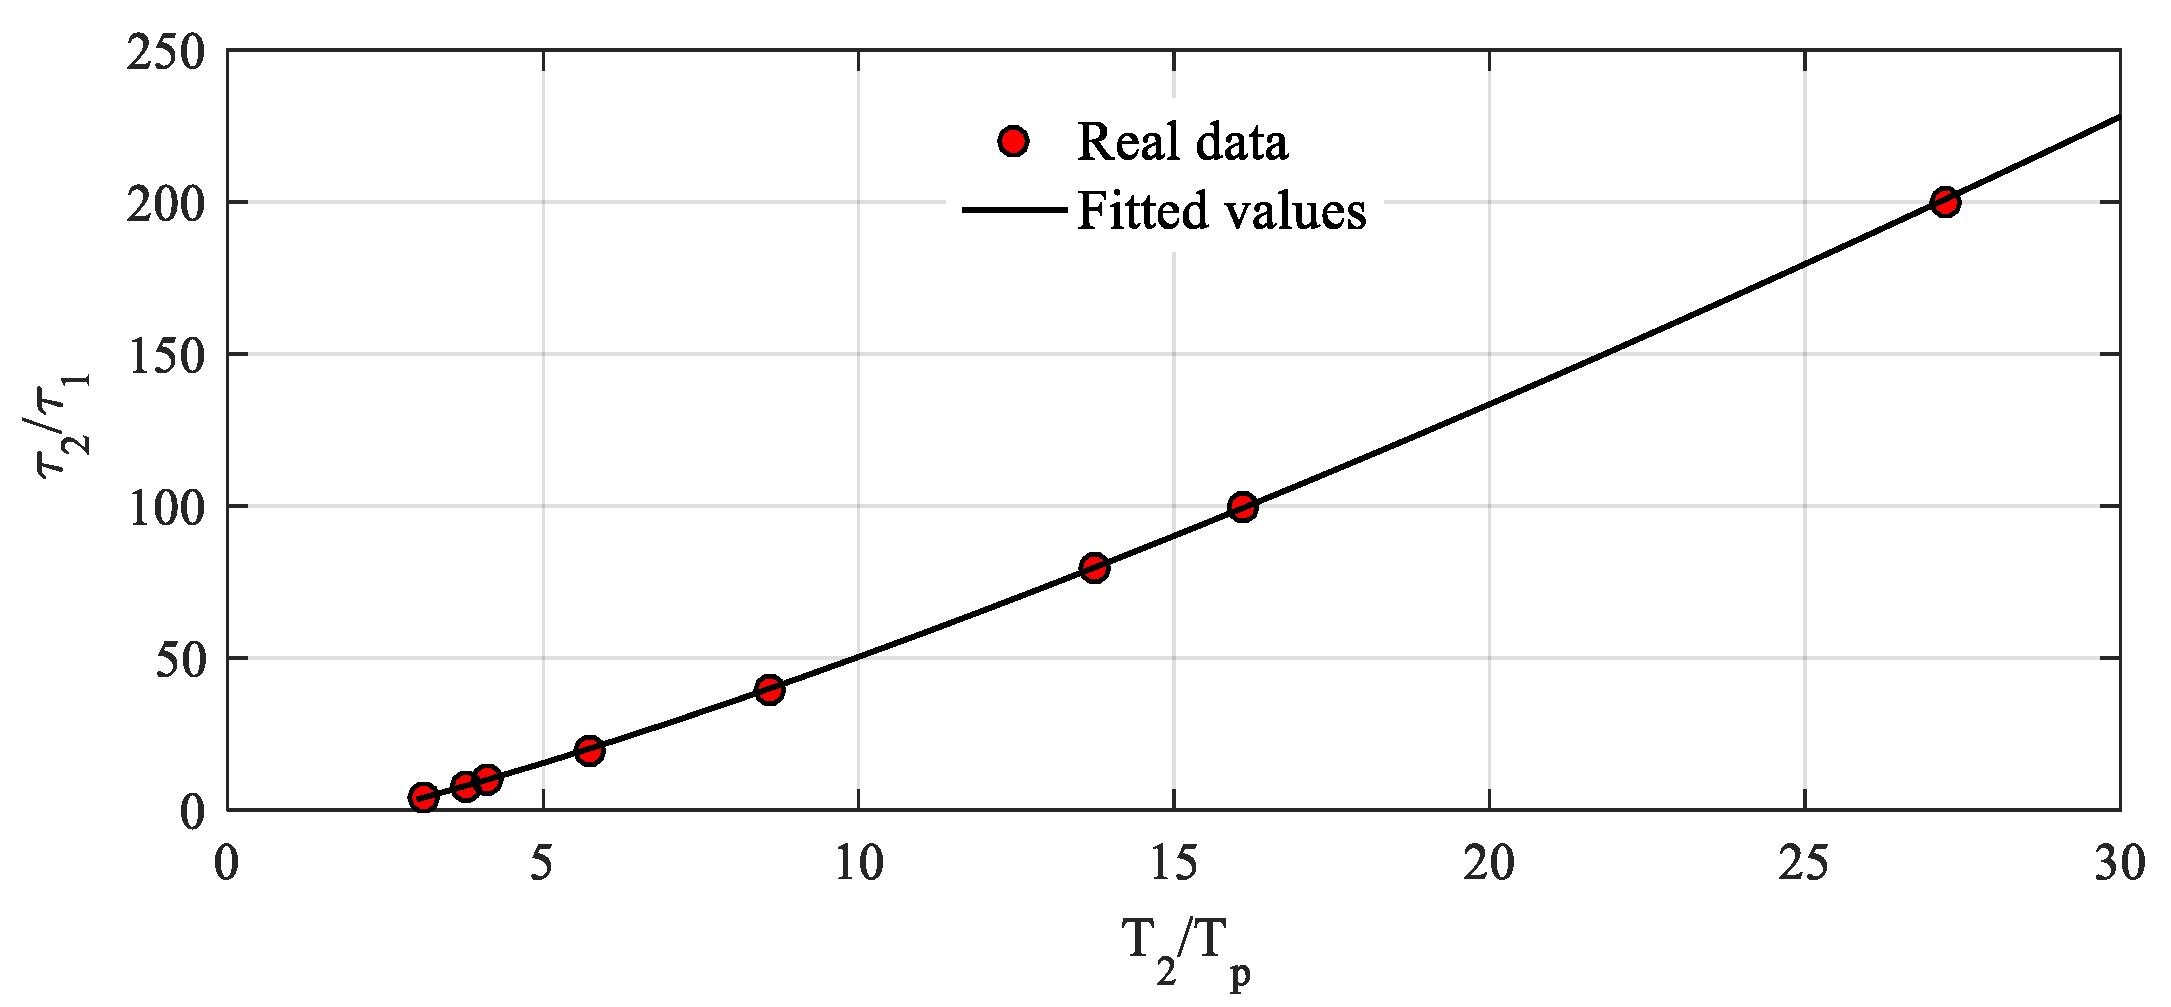
18] was employed to determine the solution or the required time parameters. It is noticed that the ratio of
T2 to
Tp (
T2/
Tp) has a monotonic relation with the ratio of
τ2 to
τ1 (
τ2/
τ1), as expressed in
Figure 2, of which the range covers
Tp of 20 μs to 300 μs and
T2 of 1000 μs to 4000 μs. Therefore, the relation of
T2/
Tp and
τ2/
τ1 can be represented as functions in Equations (7) and (8).
In this paper, the normalized base was selected to be
τ1, and all normalized time parameters (
τ1n,
τ2n,
T2n, and
Tpn) are given by Equation (9).
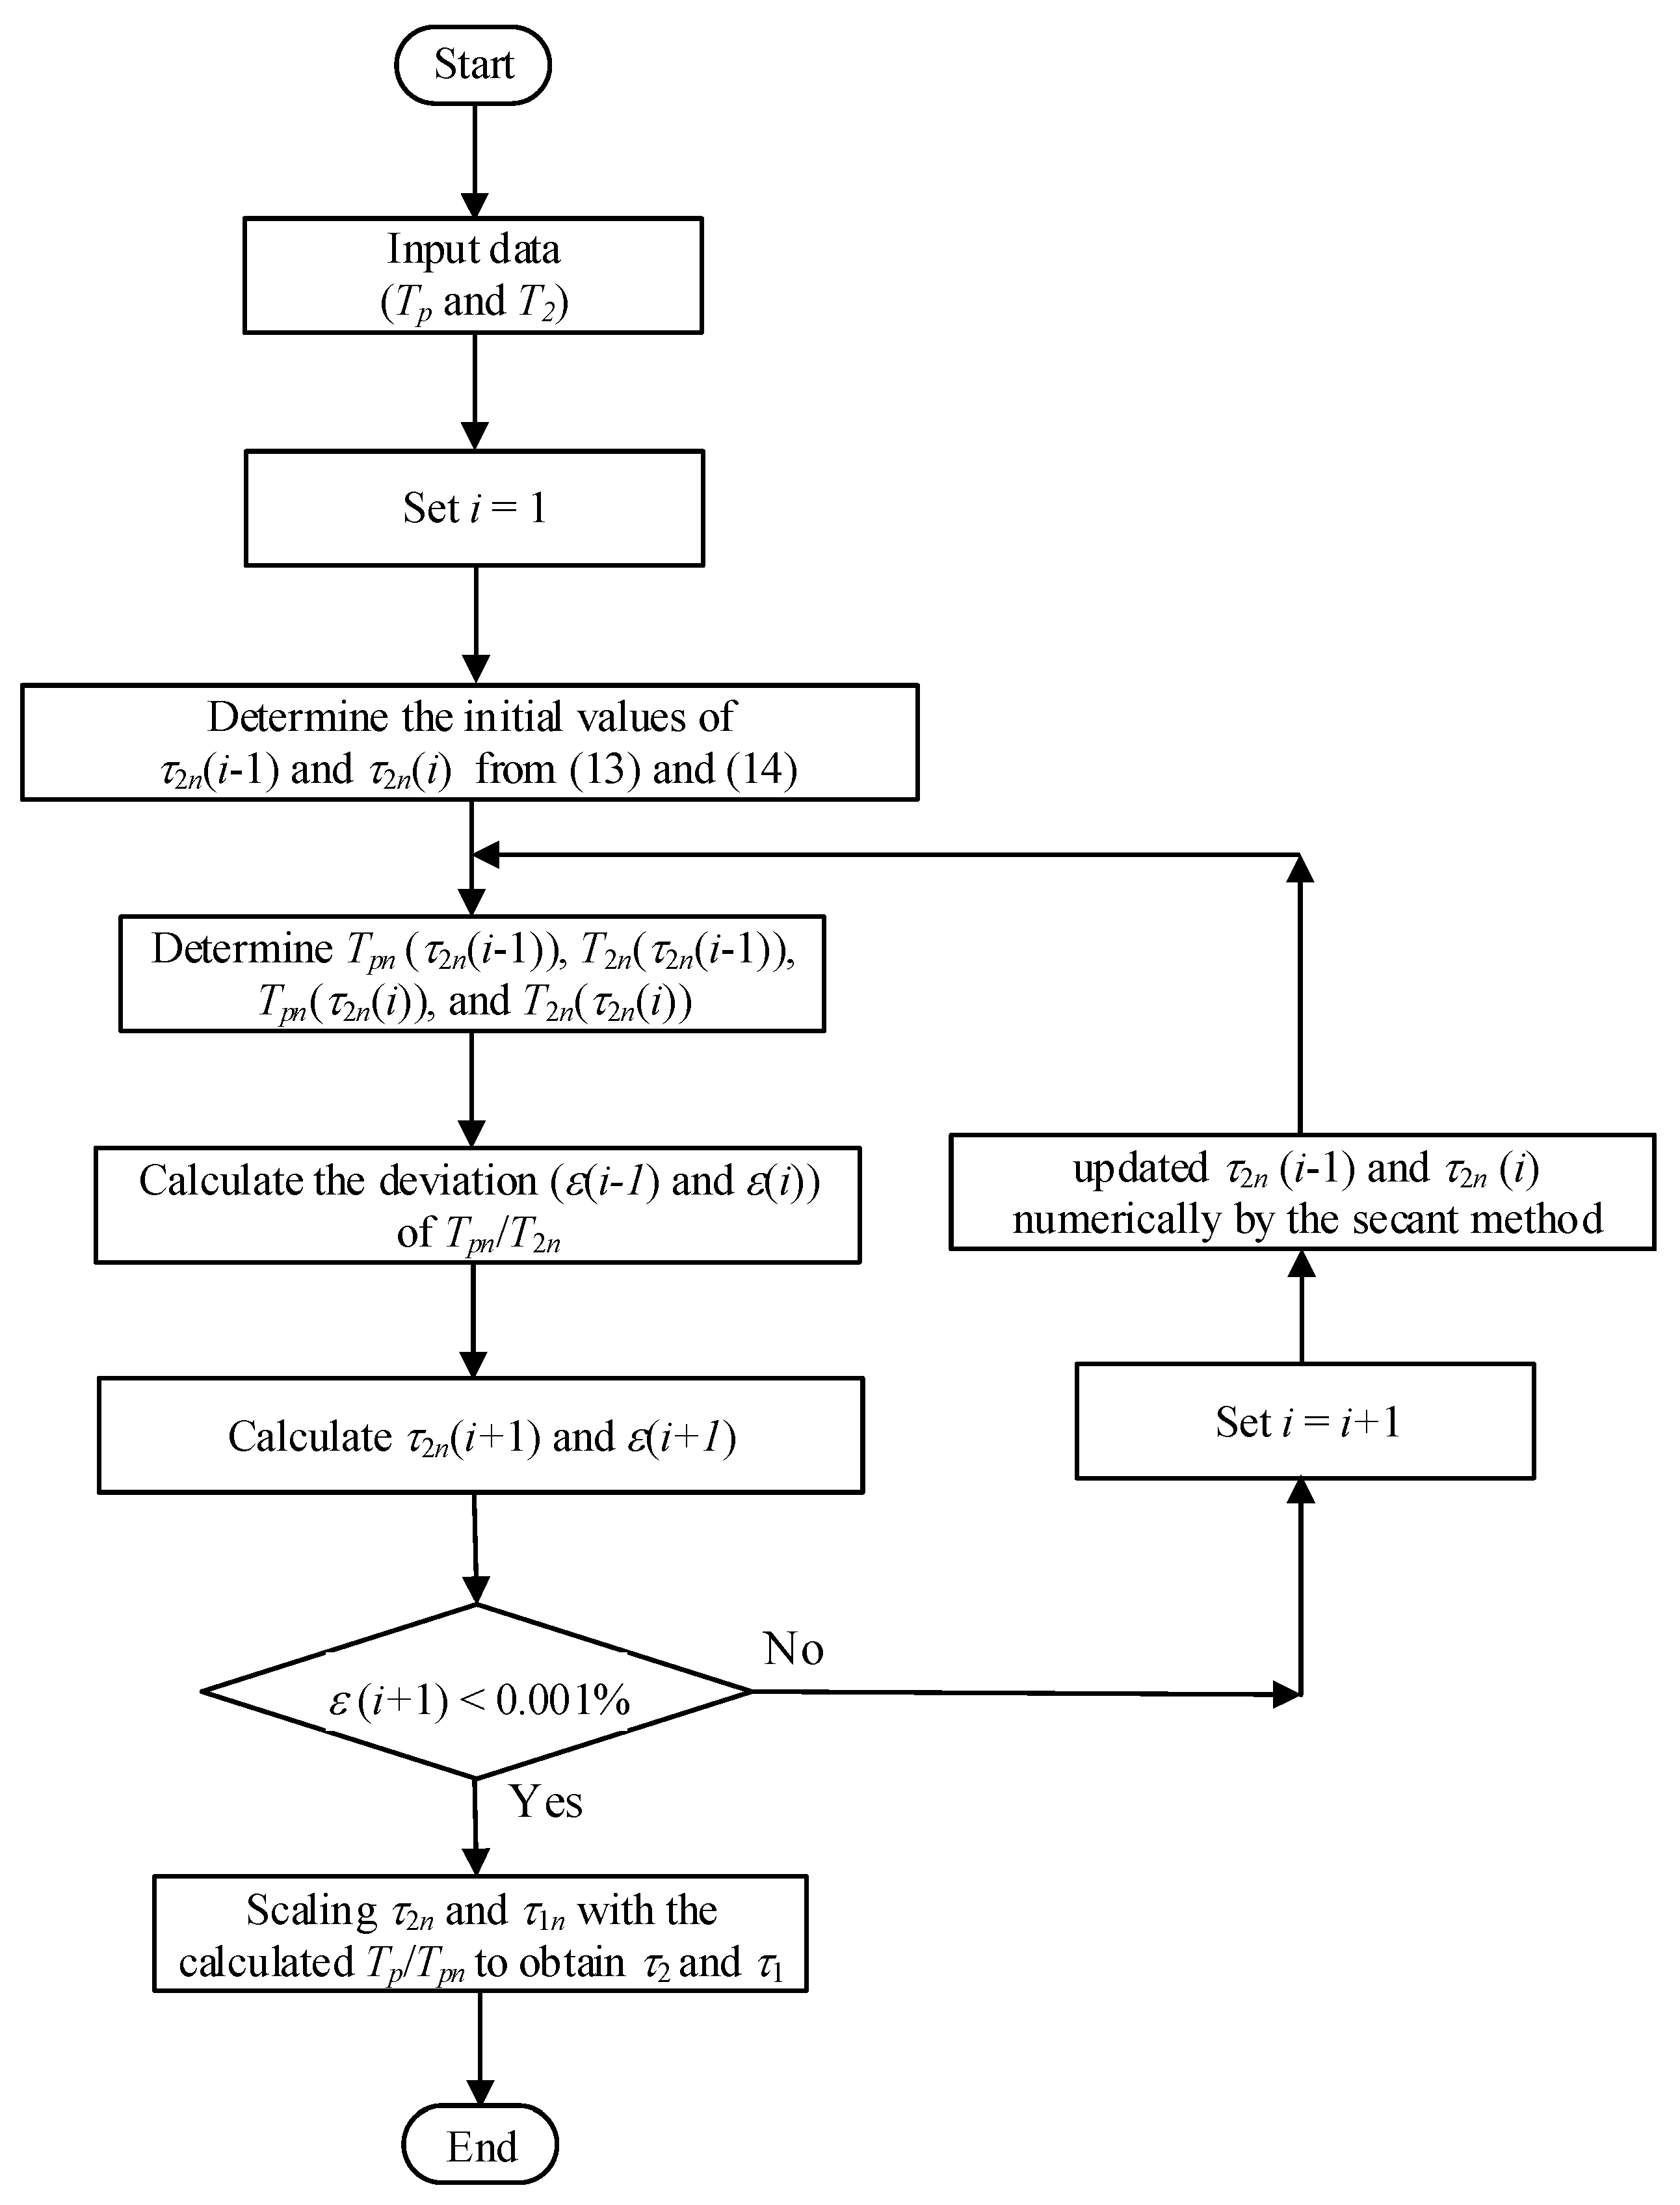
The procedure for determination of
τ1 and
τ2 from the input variable of
T2 and
Tp is presented in the flowchart shown in
Figure 3.
From Equation (10), the secant method is employed to find the solutions of
τ2n from
Tpn/T2n, which equals
Tp/T2. The goal of the secant method is to determine
τ2n where the deviation (
ε) of
Tpn/T2n is minimized, and the deviation goal was set to be 0.001%. Equation (11) can be utilized to calculate the deviation
ε(
i) of the solution of the
ith iteration, where
T2n(
τ2n(
i)) is the normalized parameter calculated by the Newton–Raphson algorithm [
18] at
τ2n(
i), and
Tpn(
τ2n(
i)) is calculated by the analytical formula expressed by Equation (5). From the calculated
ε(
i), (
τ2n(
i + 1)) is calculated by Equation (12).
τ2n is calculated repetitively until the deviation goal is reached.
The secant method requires the initial values of
τ2n(0) and
τ2n(1). From the relation of
T2/
Tp and
τ2/
τ1 in
Figure 3, the initial values are set as given by Equations (13) and (14).
With the initial values in Equations (13) and (14), only two or three iterations are required to reach the deviation goal. Finally, τ1 and τ2 can be determined from Equation (9) with the known Tp and Tpn, which can be calculated by Equation (5). Using the proposed method for the determination of τ1 and τ2 from the specified T2 and Tp, the switching impulse voltage waveforms with Tp from 10 μs to 300 μs and T2 from 1000 μs to 4000 μs can be precisely generated analytically.
From the calculated
τ2/
τ1 determined by
T2/
Tp using the proposed method, a numerical curve fitting based on a Levenberg–Marquardt algorithm [
19] was employed and the formula of the fitting curve given in Equation (15) was obtained. It is noted that the formula can be used for the initial values in the secant method. In fact, the formula is quite accurate and the maximum deviation of the value from the formula and the actual value is less than 0.5%. However, if more accurate results are required, it is recommended to utilize the proposed method, as it is used in the paper with a deviation of less than 0.001%.
2.2. The New Approach for Evaluation of the Switching Impulse Voltage Parameters
In the proposed method, analytical switching impulse voltage waveforms generated by the approach presented in
Section 2.1 were utilized for development of the formula used for time to crest estimation. The time parameters, i.e.,
t10%,
t90%, and
t50% shown in
Figure 1, are calculated by the Newton–Raphson method due to no analytical solution, and
Tp and
T2 are considered in the ranges of 20 μs to 300 μs and 1000 μs to 4000 μs, respectively, which cover the waveform parameters used in the practical tests.
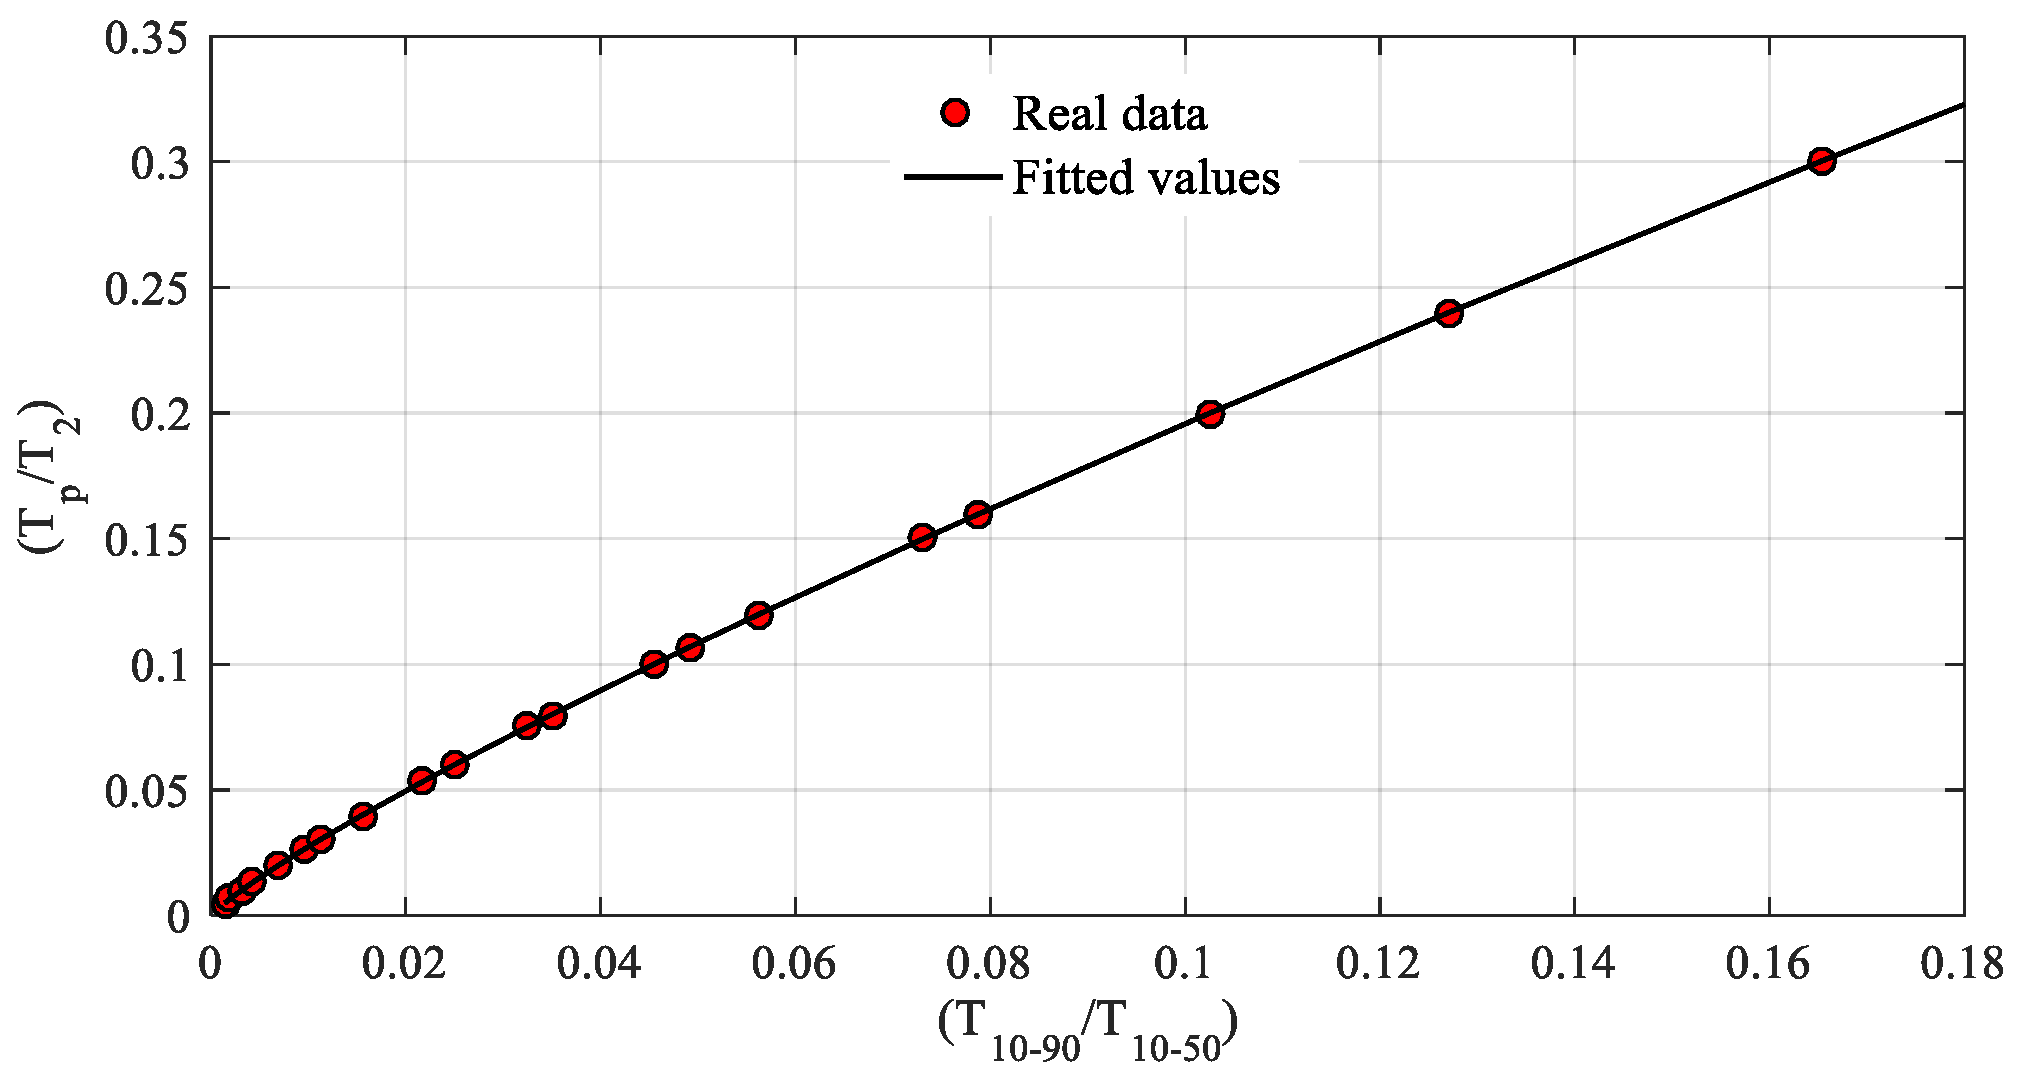
t0 is zero. It is found that
Tp/
T2 has a monotonic relation with
T10–50/
T10–90, as shown in
Figure 4, and parameters used for calculation of such proportions can be calculated by Equations (16)–(18).
From the data of
Tp/
T2 and
T10–50/
T10–90, the fitting curve can be determined by a non-linear regression based on a Levenberg–Marquardt algorithm [
19]. The expression of the fitted curve is given as Equation (19). From Equation (19) and the required
T2,
Tp can be calculated by Equation (20).
Up can also be determined by searching for the crest voltage of the considered waveform. It is noted that the approach for the crest voltage determination is the same as those of the standard and previously developed methods [
1,
16].
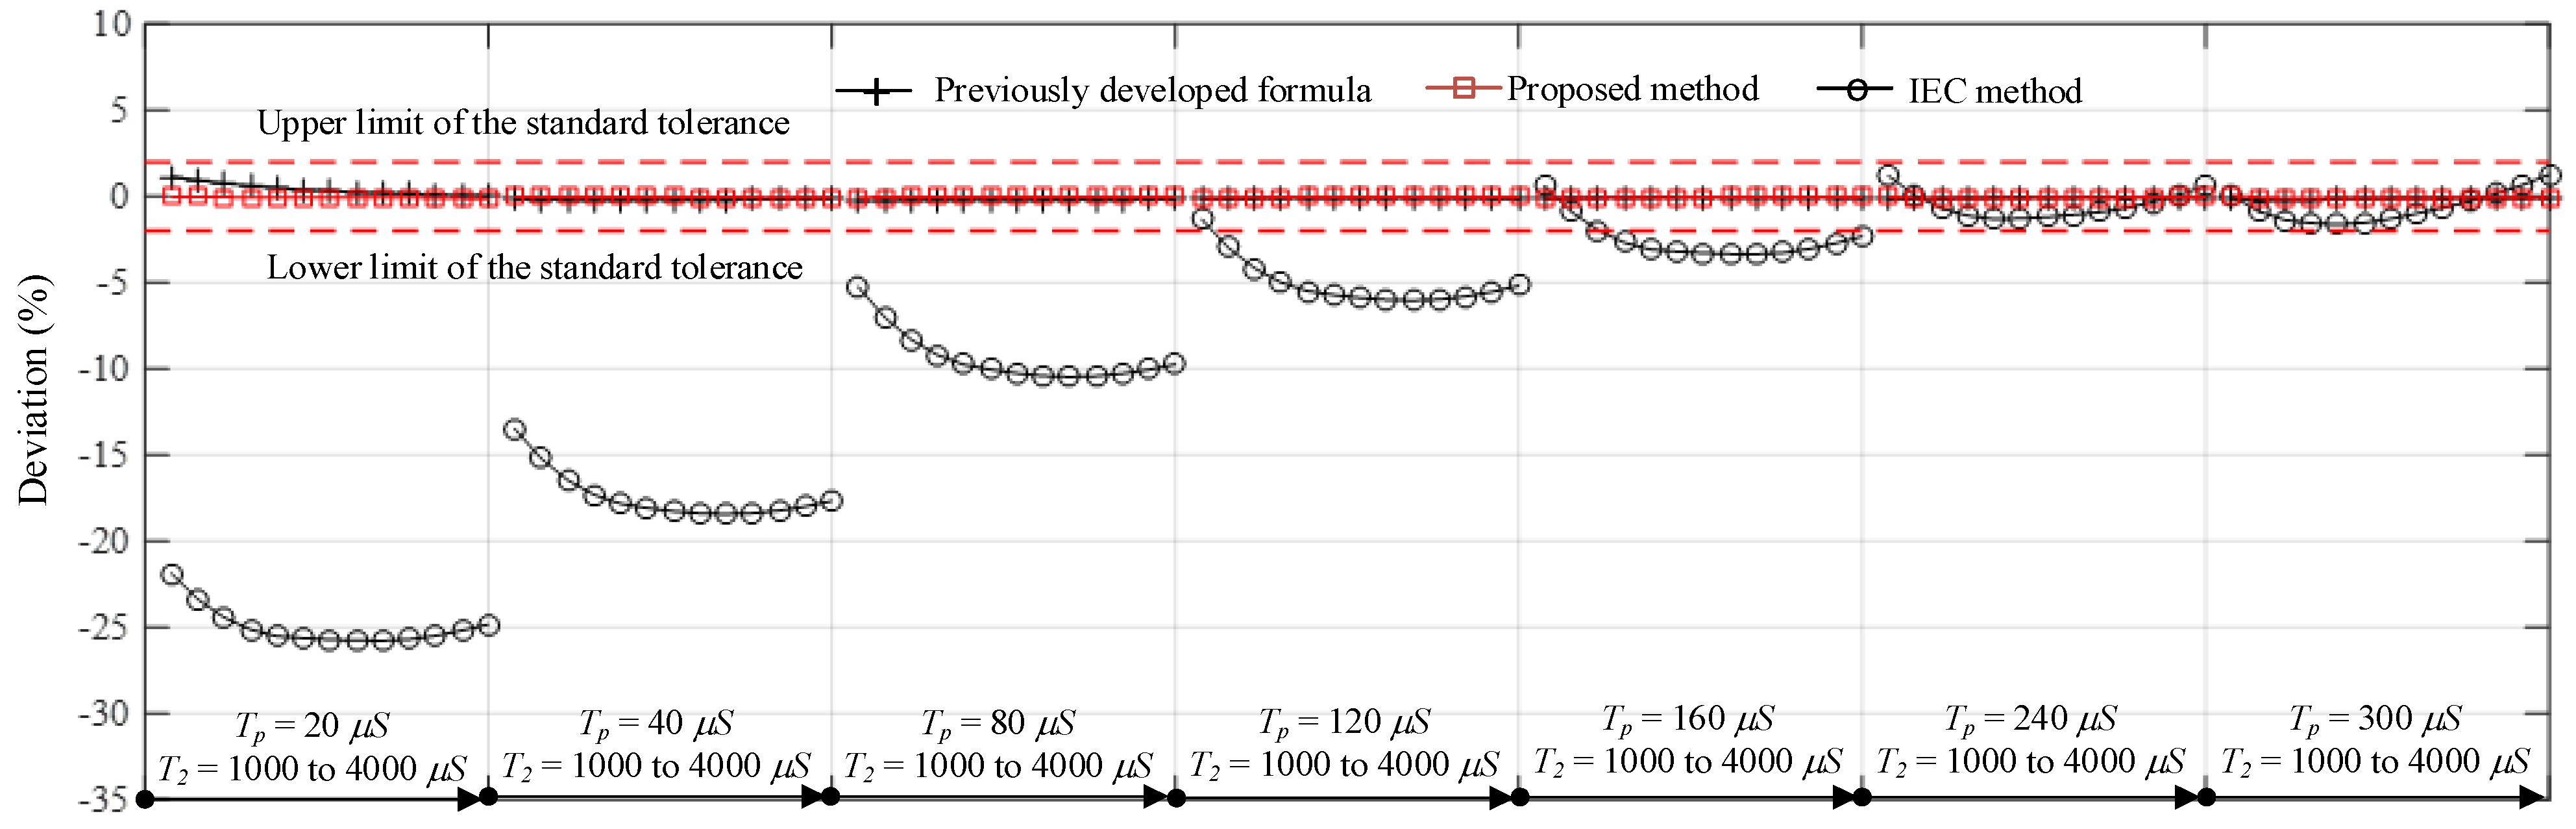
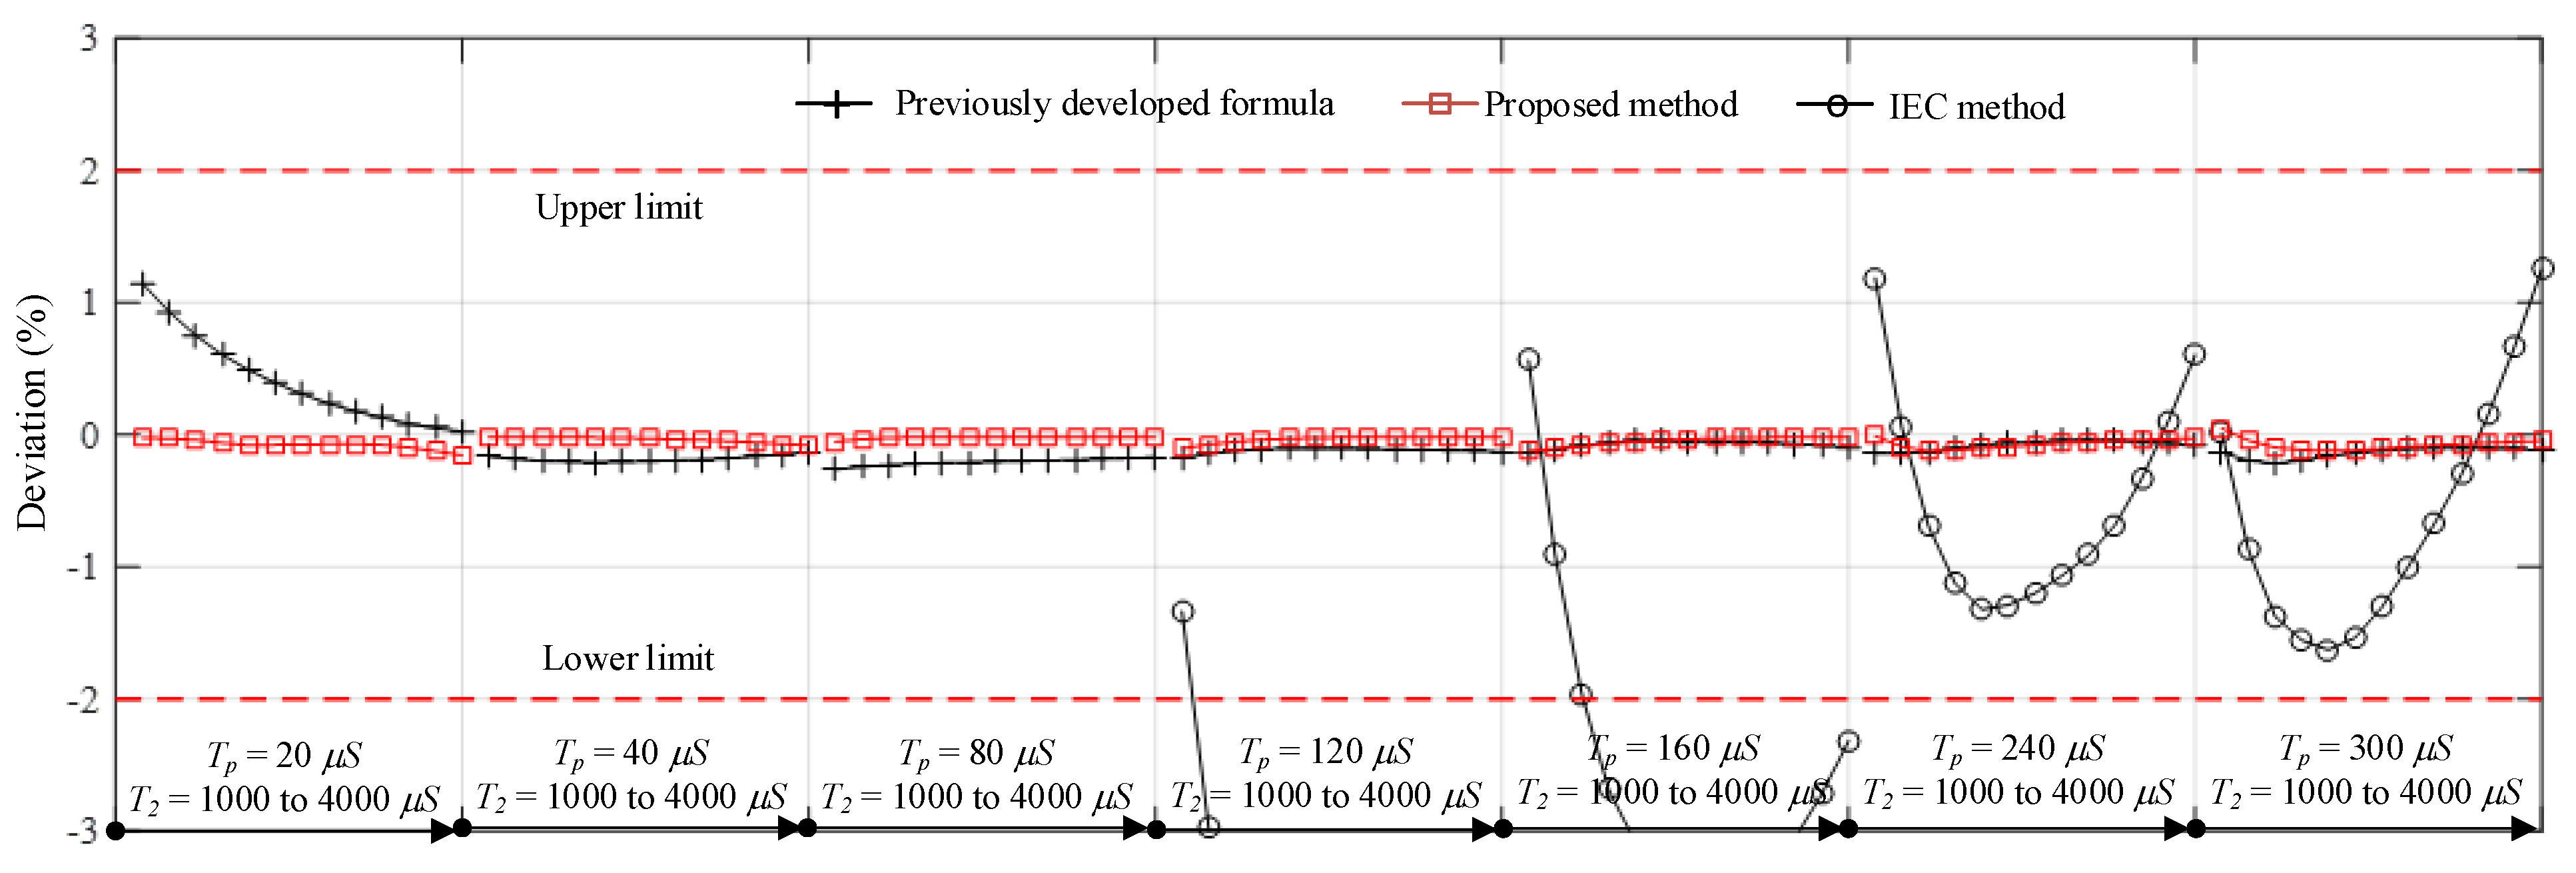
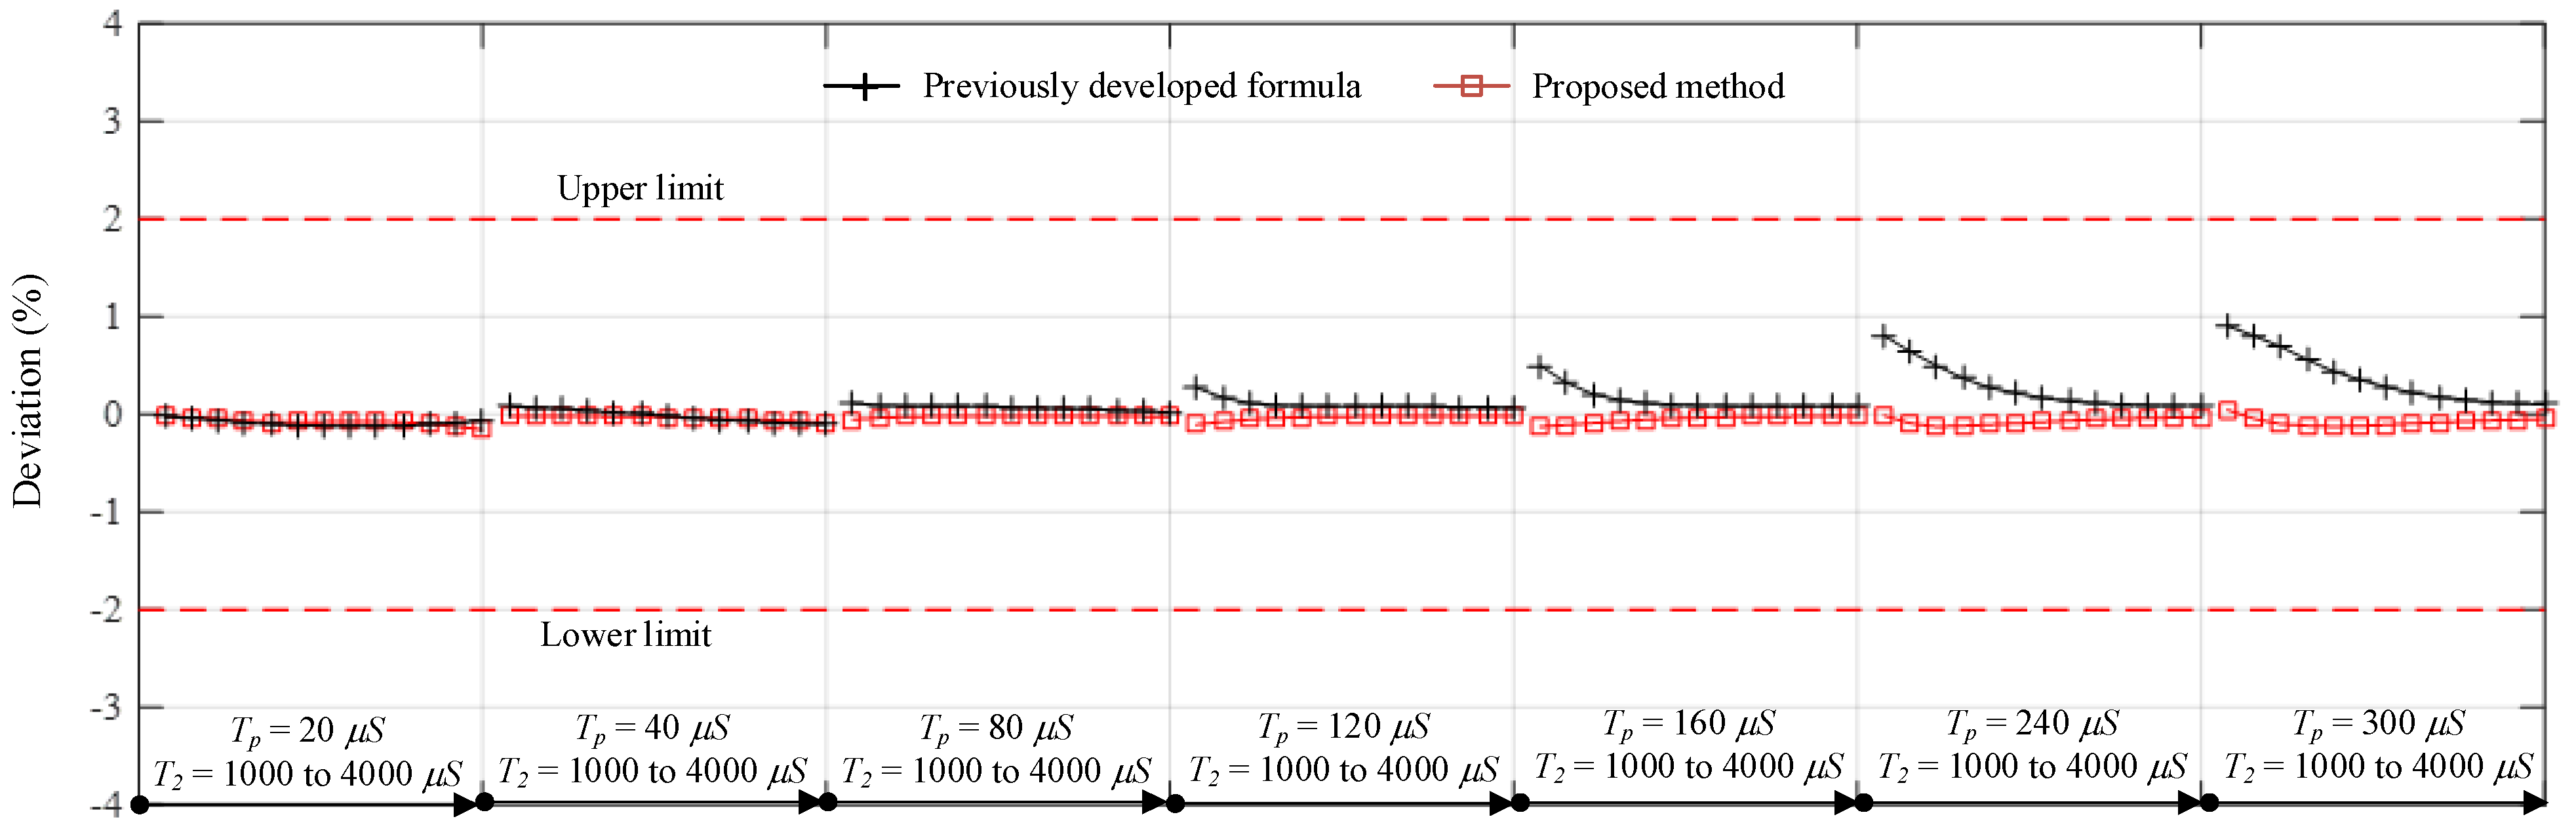
Comparisons of the times to crest computed by the proposed, standard, and previously developed formulas [
1,
16] are presented in
Figure 5 and
Figure 6. It is noticed that the proposed formula provides the best accuracy with a maximum deviation of 0.156%, whereas the standard and previously developed formulas [
1,
16] provide maximum deviations of 25.778% and 1.147%, respectively. From the results of all test cases, the previously developed and proposed formula can provide
Tp within the acceptable limits defined by the standard [
10]. The standard formula is accurate in cases of the waveform with time to crest close to the standard time to peak (250 μs). The shorter the
Tp is, the higher the deviation is. Additionally, as shown in
Figure 7 the proposed approach for the
T2 determination also provides promising accuracy when it is compared with the previously developed formula [
1]. The maximum deviations of the proposed and previously developed formulas are 0.165% and 0.98%, respectively.
3. Verification of the Proposed Method
By using the presented approach for determination of the waveform parameters, the offset voltage is removed and the time parameters are determined.
t0 can be estimated by searching for the time at which the voltage is less than 0.1% of the peak voltage, and the approach for searching starts from the peak voltage in reversed order. The other time parameters, i.e.,
t10%,
t90%, and
t50% shown in
Figure 1, are calculated by the Newton–Raphson method due to no analytical solutions. Then, using such time parameters,
T10–50/
T10–90 is calculated by Equations (17) and (18) and substituted in Equation (19) to obtain
Tp/
T2. Eventually,
T2 is calculated by Equation (16),
Tp is determined from
Tp/
T2 with the known
T2, and
Up is determined by the crest value of the considered waveform.
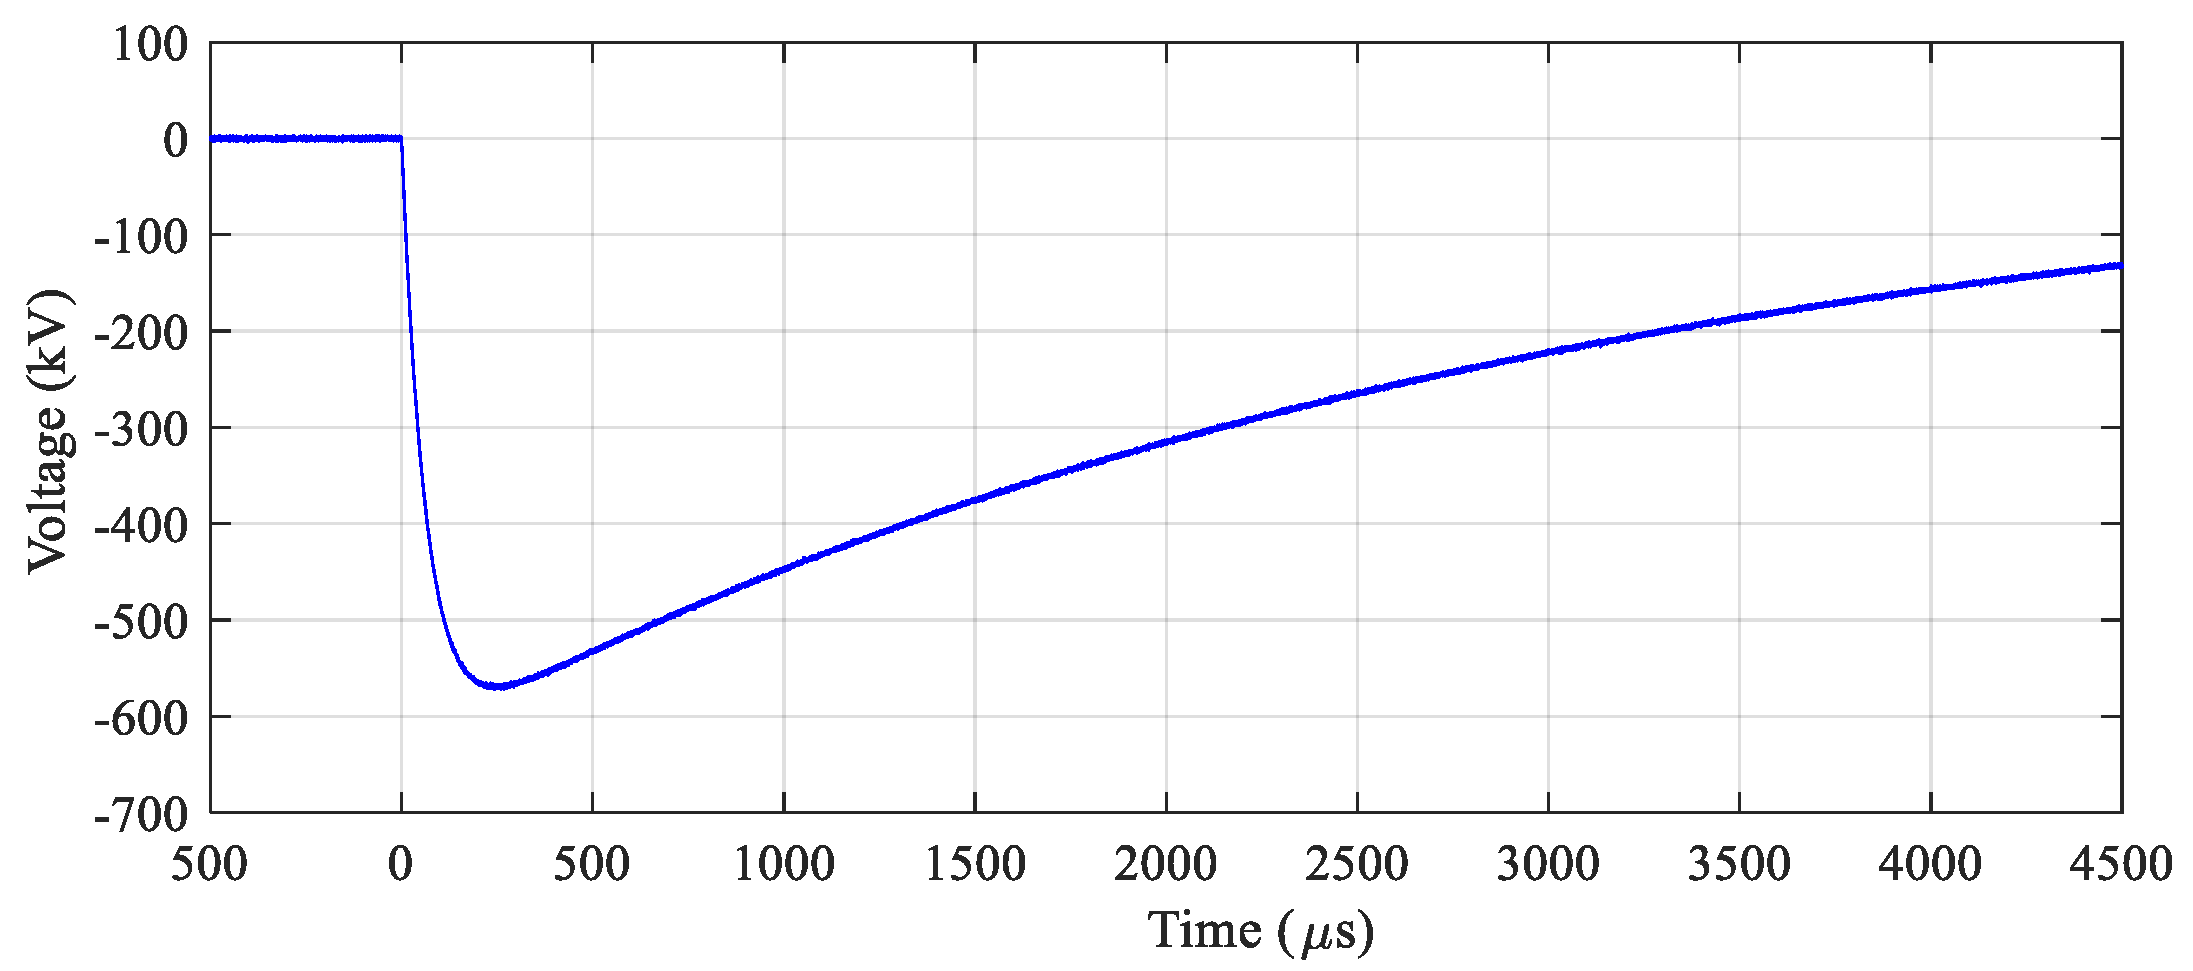
The proposed method is verified by the waveform parameter evaluation of waveforms composed of four groups collected from (1) analytically simulated two-exponential waveforms used in the method development; (2) IEC 61083-2 [
10], composed of SI-A1 to SI-A3 (simulation waveforms) and SI-M1 and SI-M2 (waveforms measured in experiments); (3) simulations with and without additional noise signal (SI-X1 and SI-X2), and (4) experiments (SI-X3 and SI-X4). The example experimental waveform is presented in
Figure 8. Additionally, the accuracy of the proposed method is compared with those of the standard and previously developed methods [
1,
16] as expressed in
Table 1 and
Table 2. It is to be mentioned that the reference values in the cases of SI-X3 and SI-X4 have been collected from commercial software [
20]. The approved measuring system, composed of a 1500 kV voltage divider, a measuring cable, and a 12-bit digital recorder, was utilized to measure the switching impulse voltage in the experiments.
From the test results of the evaluation of the waveform parameters, it is clear that the accuracy of the proposed method is relatively higher than that of the standard and previously developed methods. All waveform parameters determined by the proposed method are within the standard tolerances [
1,
10]. The deviations of
Tp in the cases of the waveforms, simulated by two-exponential function, provided by the standard, additional simulation with and without noise signal, and collected from the experiments are within 0.156%, 1.34%, 1.45%, and 2.00%, respectively. The deviations of
T2 of the waveforms from simulation and measured experimentally are within 0.06% and 1.60%, respectively. In cases of the waveforms from simulation and measured experimentally, the deviations of
Up are within 0.005% and 0.48%, respectively.
4. Conclusions
This paper presents an effective approach for the analytical generation of the switching impulse waveforms with the required
Tp and
T2. From the generated waveforms, a new, simplified, and accurate approach for the waveform parameters determination of the switching impulse voltages has been developed and verified successfully by simulated and experimental waveforms. Using the developed analytical formula, the proportion of
T10–50 and
T10–90 is employed to determine the time to crest (
Tp) precisely. The deviation of
Tp calculated by the proposed formula is very small and within the standard tolerance for both simulated and experimental waveforms. The proposed technique has the largest deviations of +1.45% and +2.00% for the simulated and experimental waveforms, respectively, whereas the maximum error according to the standard formula [
1] is −26.4% for the simulated waveforms and −4.81% for the experimental waveforms, and the maximum deviations determined by the previously developed formula [
16] are +1.89% for the simulated waveforms and −8.78% for the experimental waveforms. Furthermore, the proposed approach provides the small deviations of
T2 and
Up and also falls within the standard tolerances. It can be concluded that the presented approach is superior to the approaches proposed by the IEC standard and a previously developed formula for the determination of waveform parameters of switching impulse voltages from simulations and experiments.


