
Urban Wind: An Alternative for Sustainable Cities


Abstract
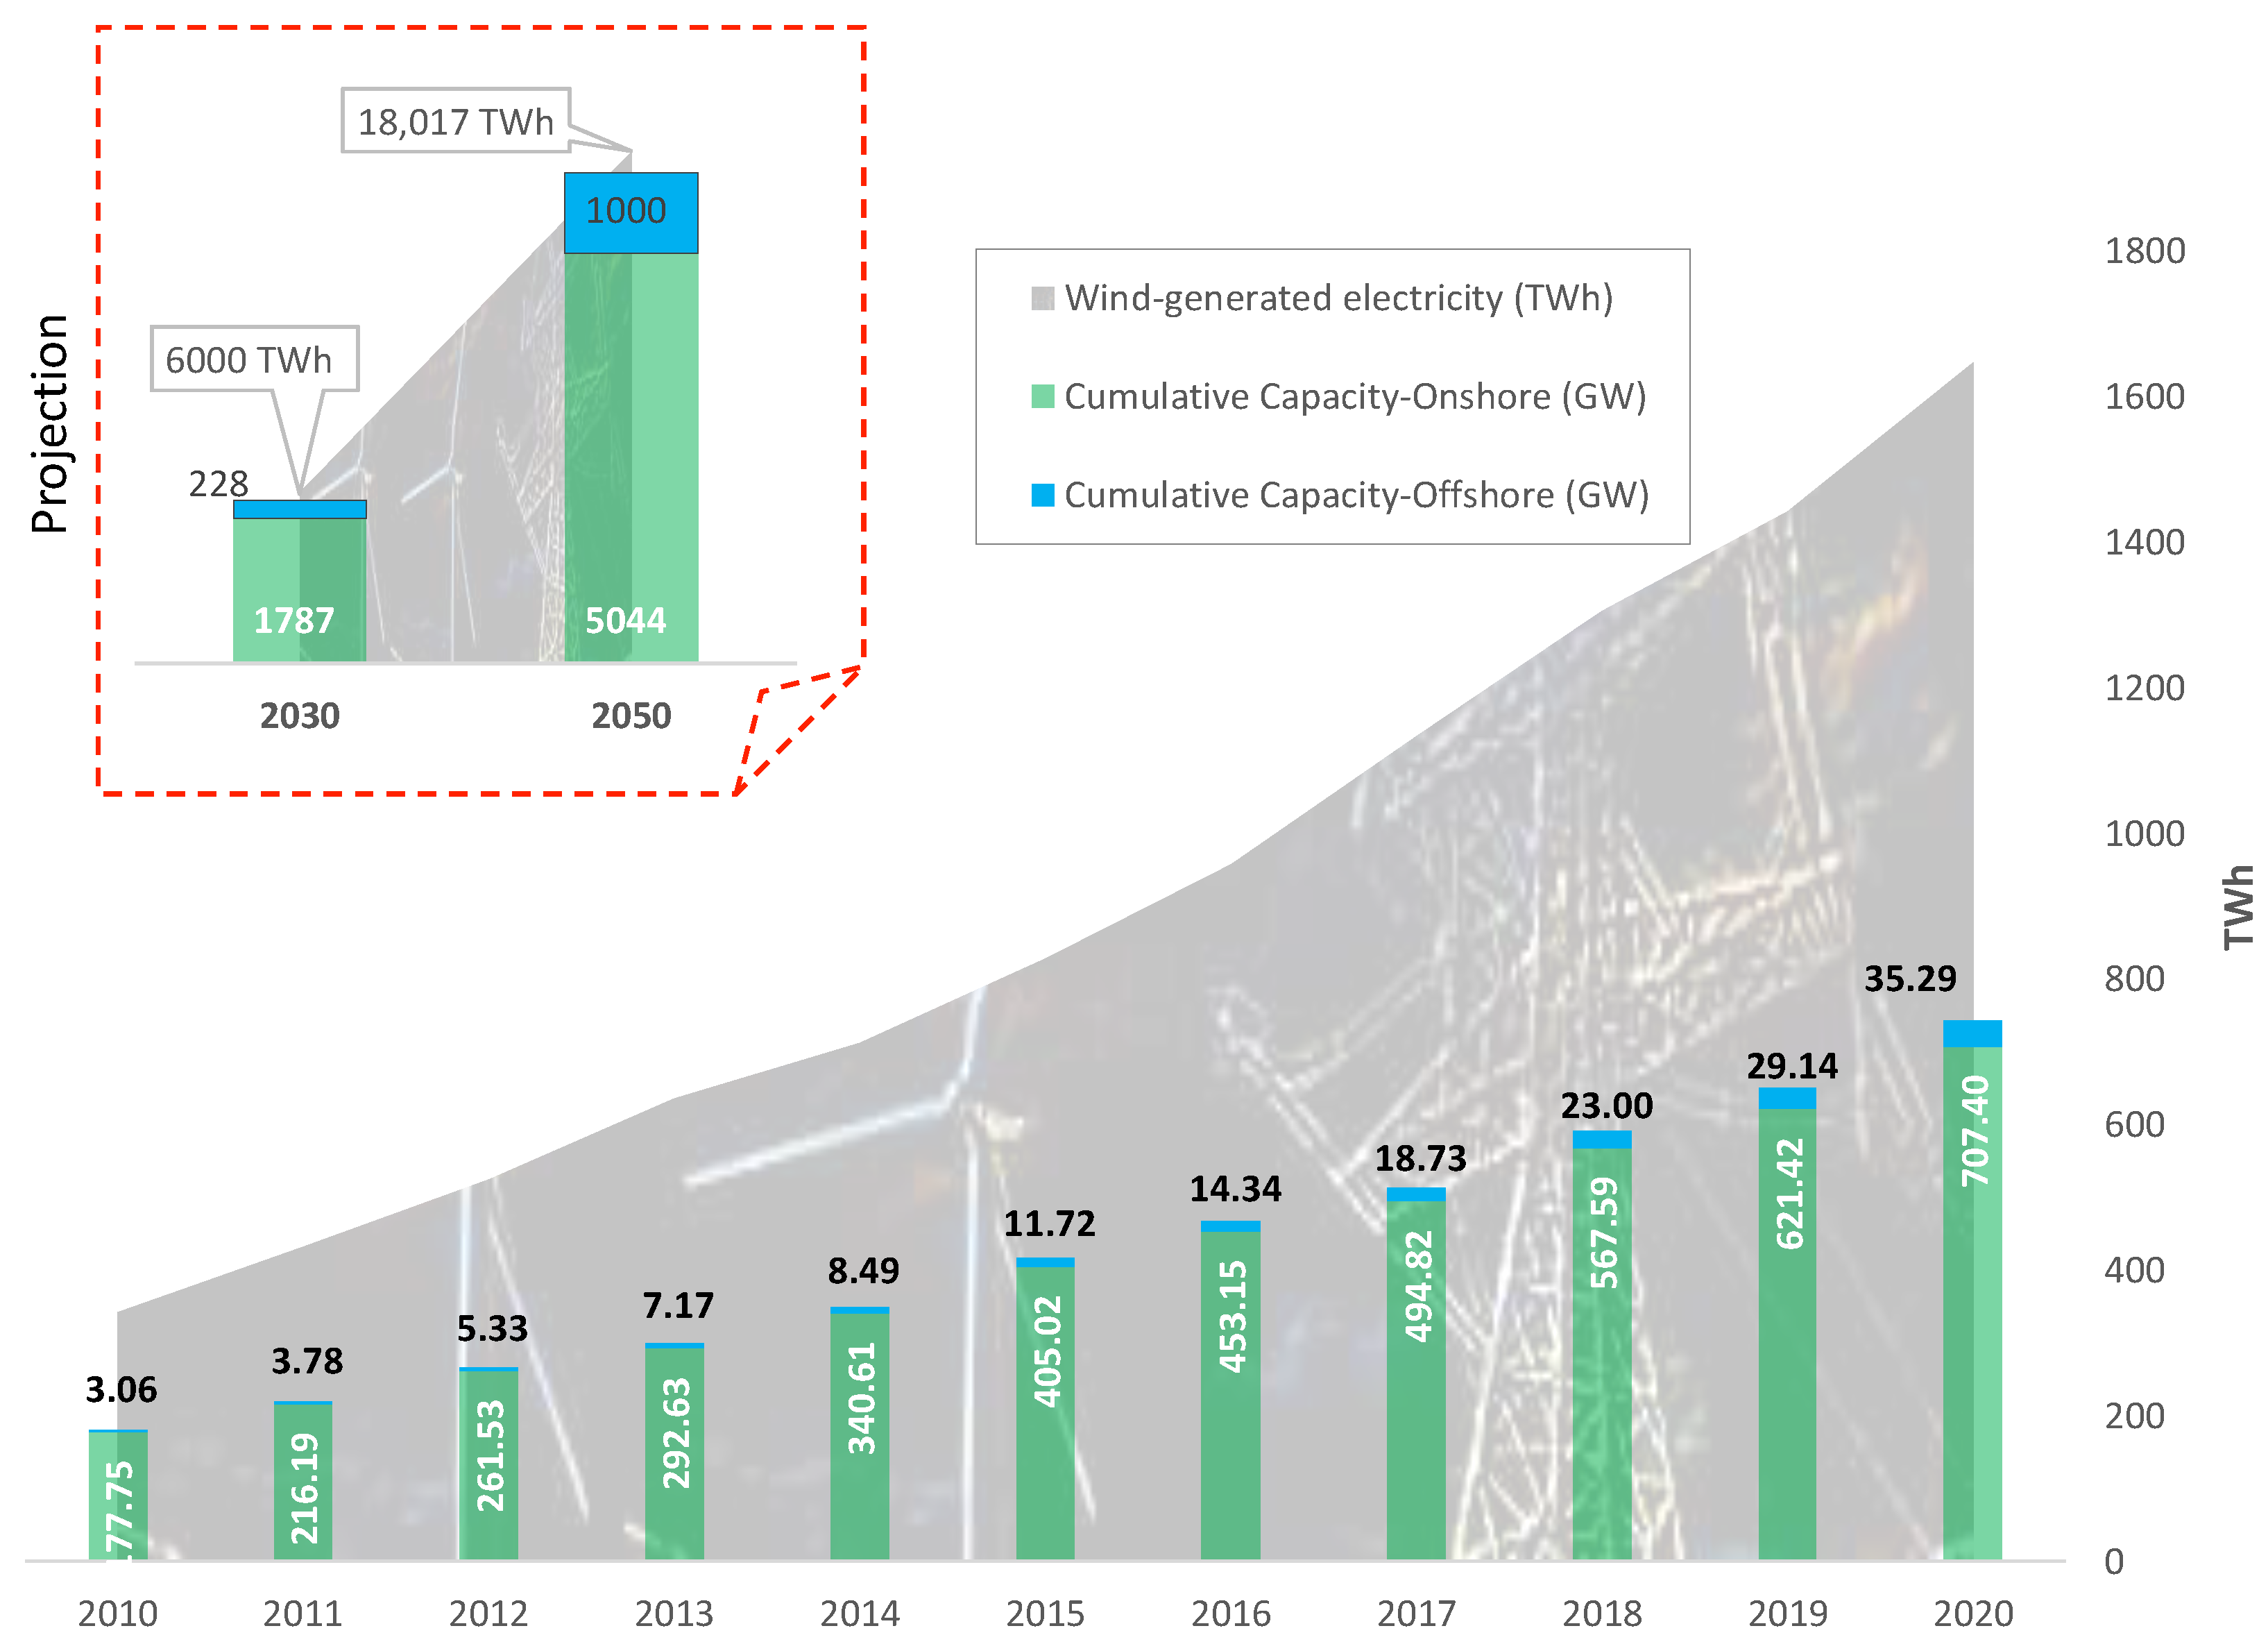
:1. Introduction
- Technological: Inefficient wind turbines, as they cannot capture low wind speeds in turbulent environments; therefore, electricity generation is low.
- Socio-environmental: Visual impact and noise disturbances generate little social acceptance. Safety for fauna (birds).
- Use of the wind resource: Methodologies for energy predictions based on the evaluation of the wind resource.
- Economic: Low viability of the facilities.
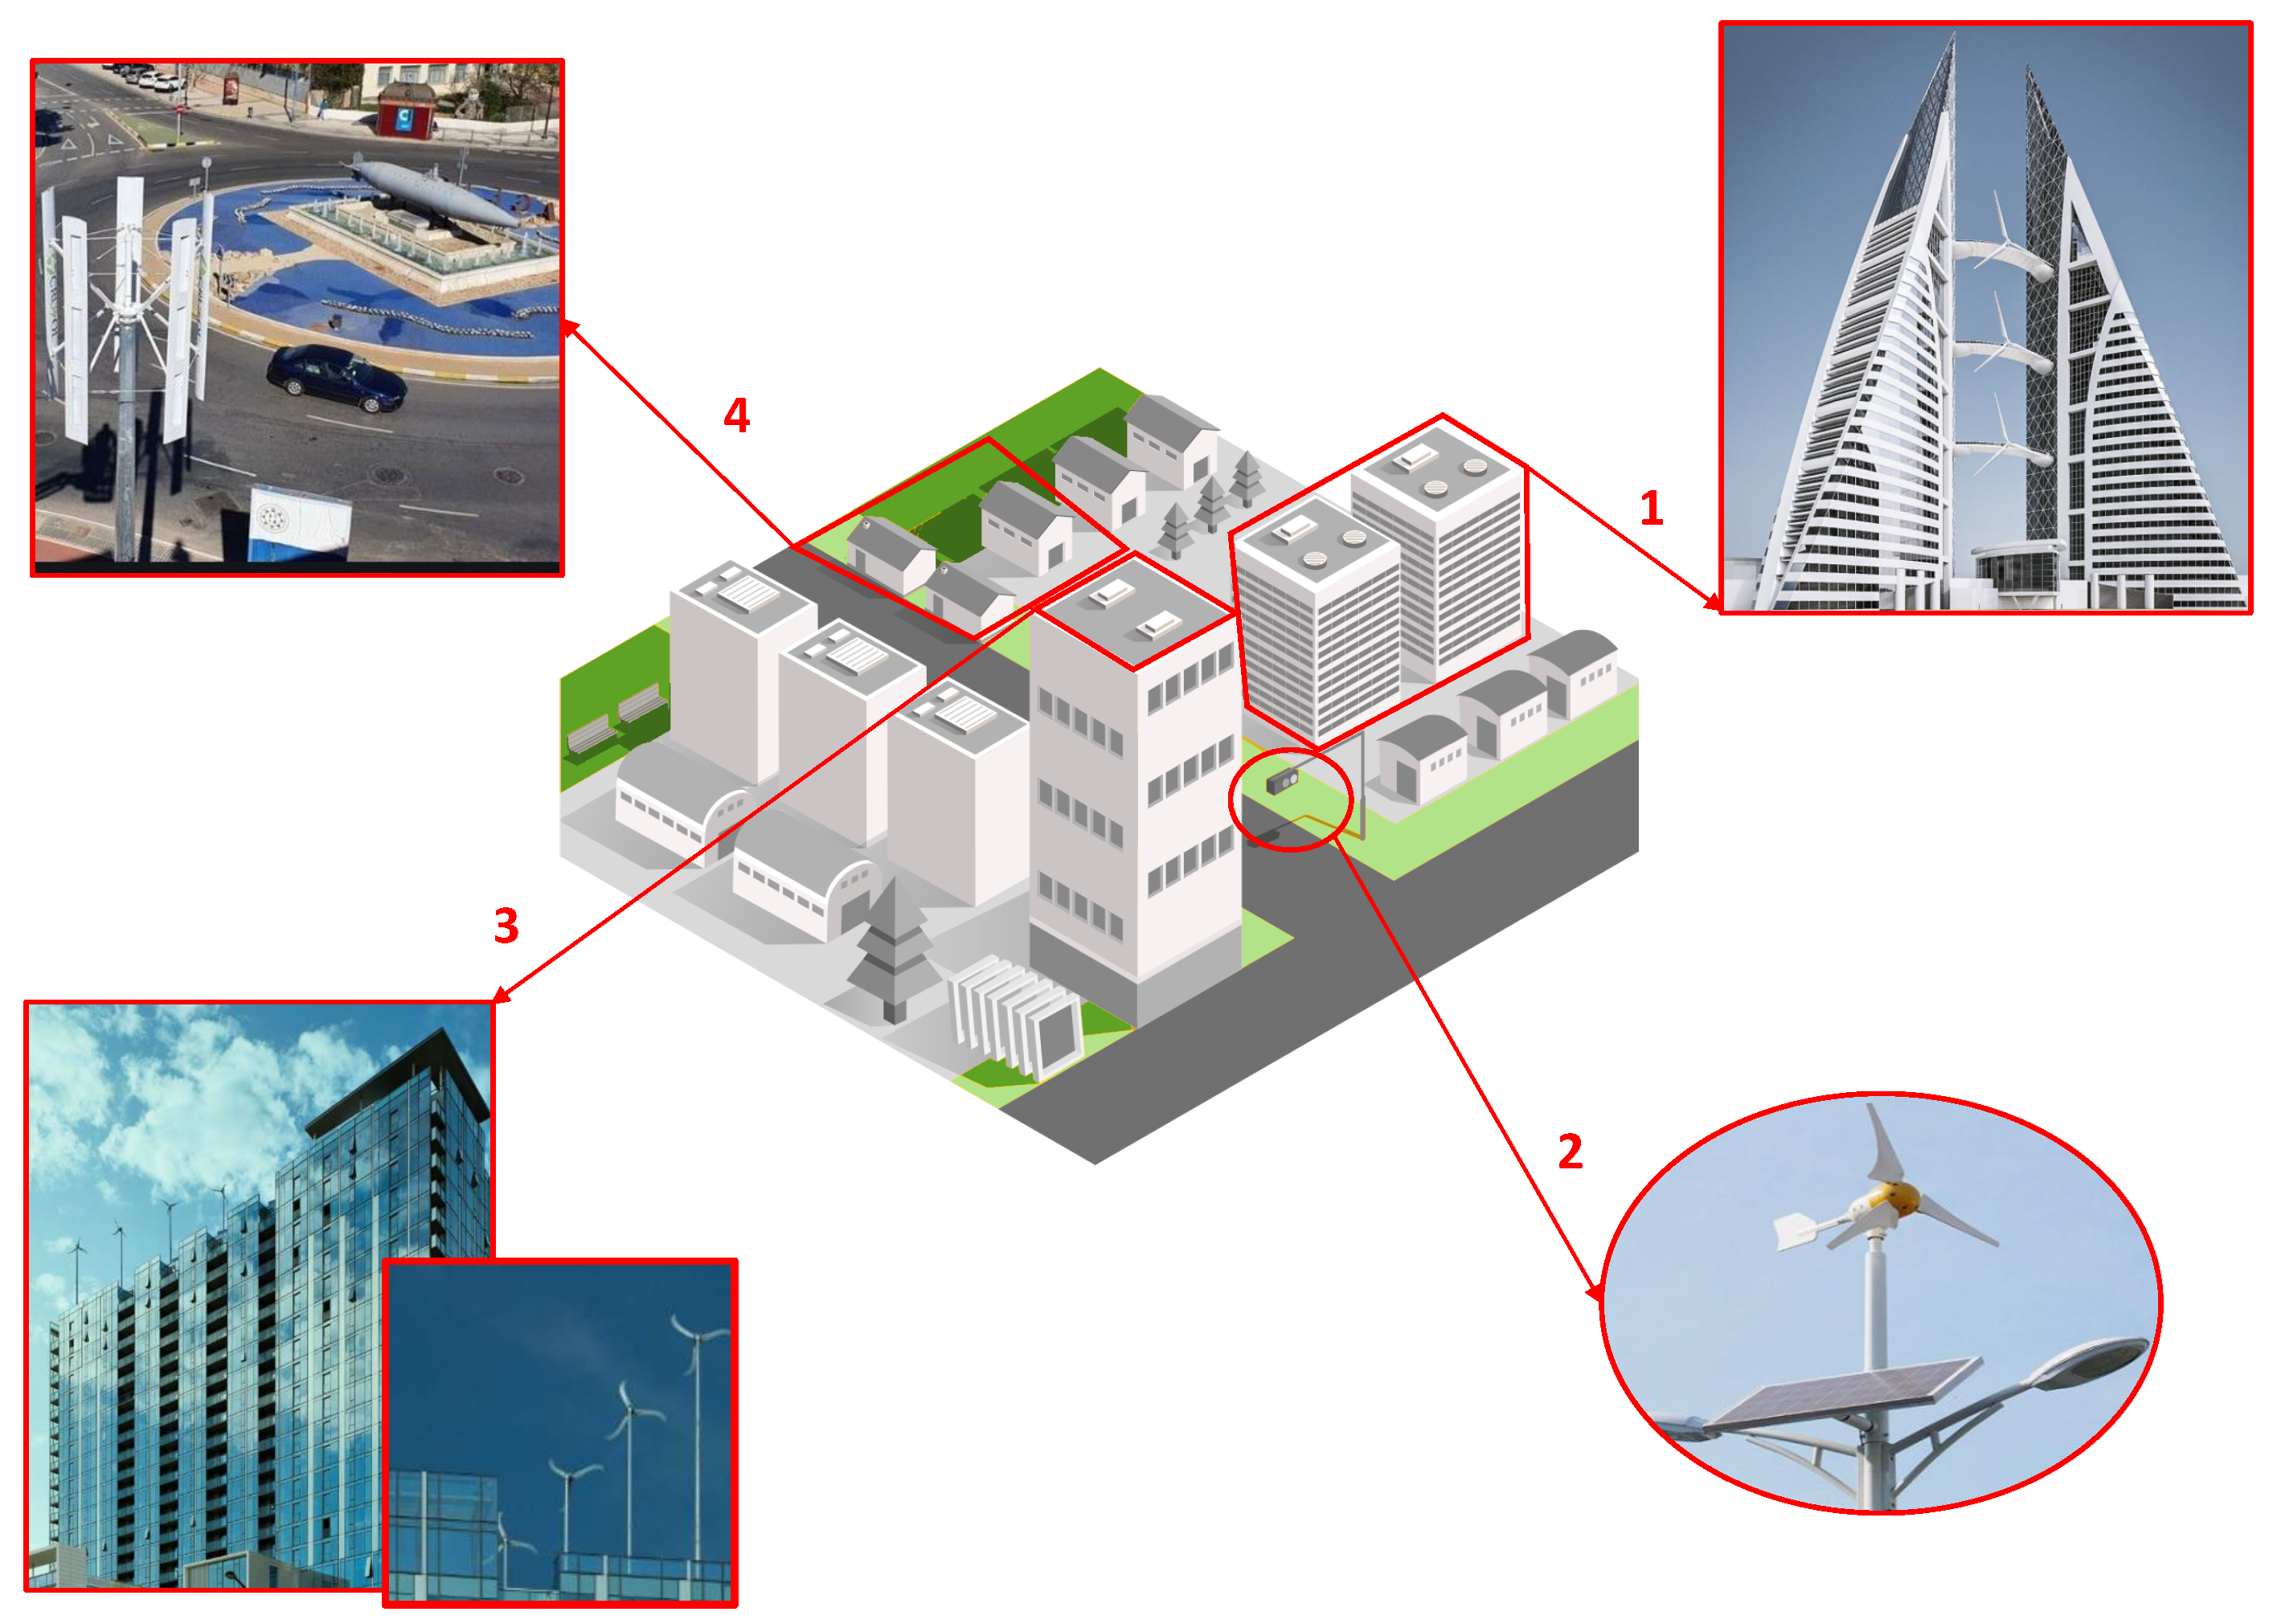
2. Types of Urban Wind Energy Collection Systems
- Its height reaches the layers of high wind speed without turbulence, with no need for a tower.
- The lower energy demand by covering a piece with on-site generation is a selling point.
- It is relevant for environmental awareness.
- The structure can be used to clad turbines to improve their performance, conceal them visually, and make them safer.
- The aerodynamic structure of the building can direct and concentrate the wind towards the turbine.
- The long transmission lines for energy transport, which are linked to significant losses, can be omitted.
- Fewer energy losses due to decreases in transport distance.
- The energy generated is consumed directly at the installation site; the owners get a free additional source of energy.
- The typical background noise of cities covers most noise emissions from turbines.
- Shorter towers are needed.
- They are affordable for individuals and small businesses.
- The system is independent of the grid; if it is interrupted, the lighting of the area is not affected.
- The positioning depends on the wind conditions, as it is independent of buildings.
- Potential vibrations do not affect the structure of a building.
- Turbine performance depends on positioning and obstacles that can cause turbulence; therefore, future surrounding buildings have to be part of the installation project.
- Hybrid systems are recommended for systems that are not connected to the grid due to wind oscillations.
- Noise and vibrations can cause social non-acceptance.
- Wind speed in the city is lower than in rural areas, and thus, the wind turbine performance will become lower.
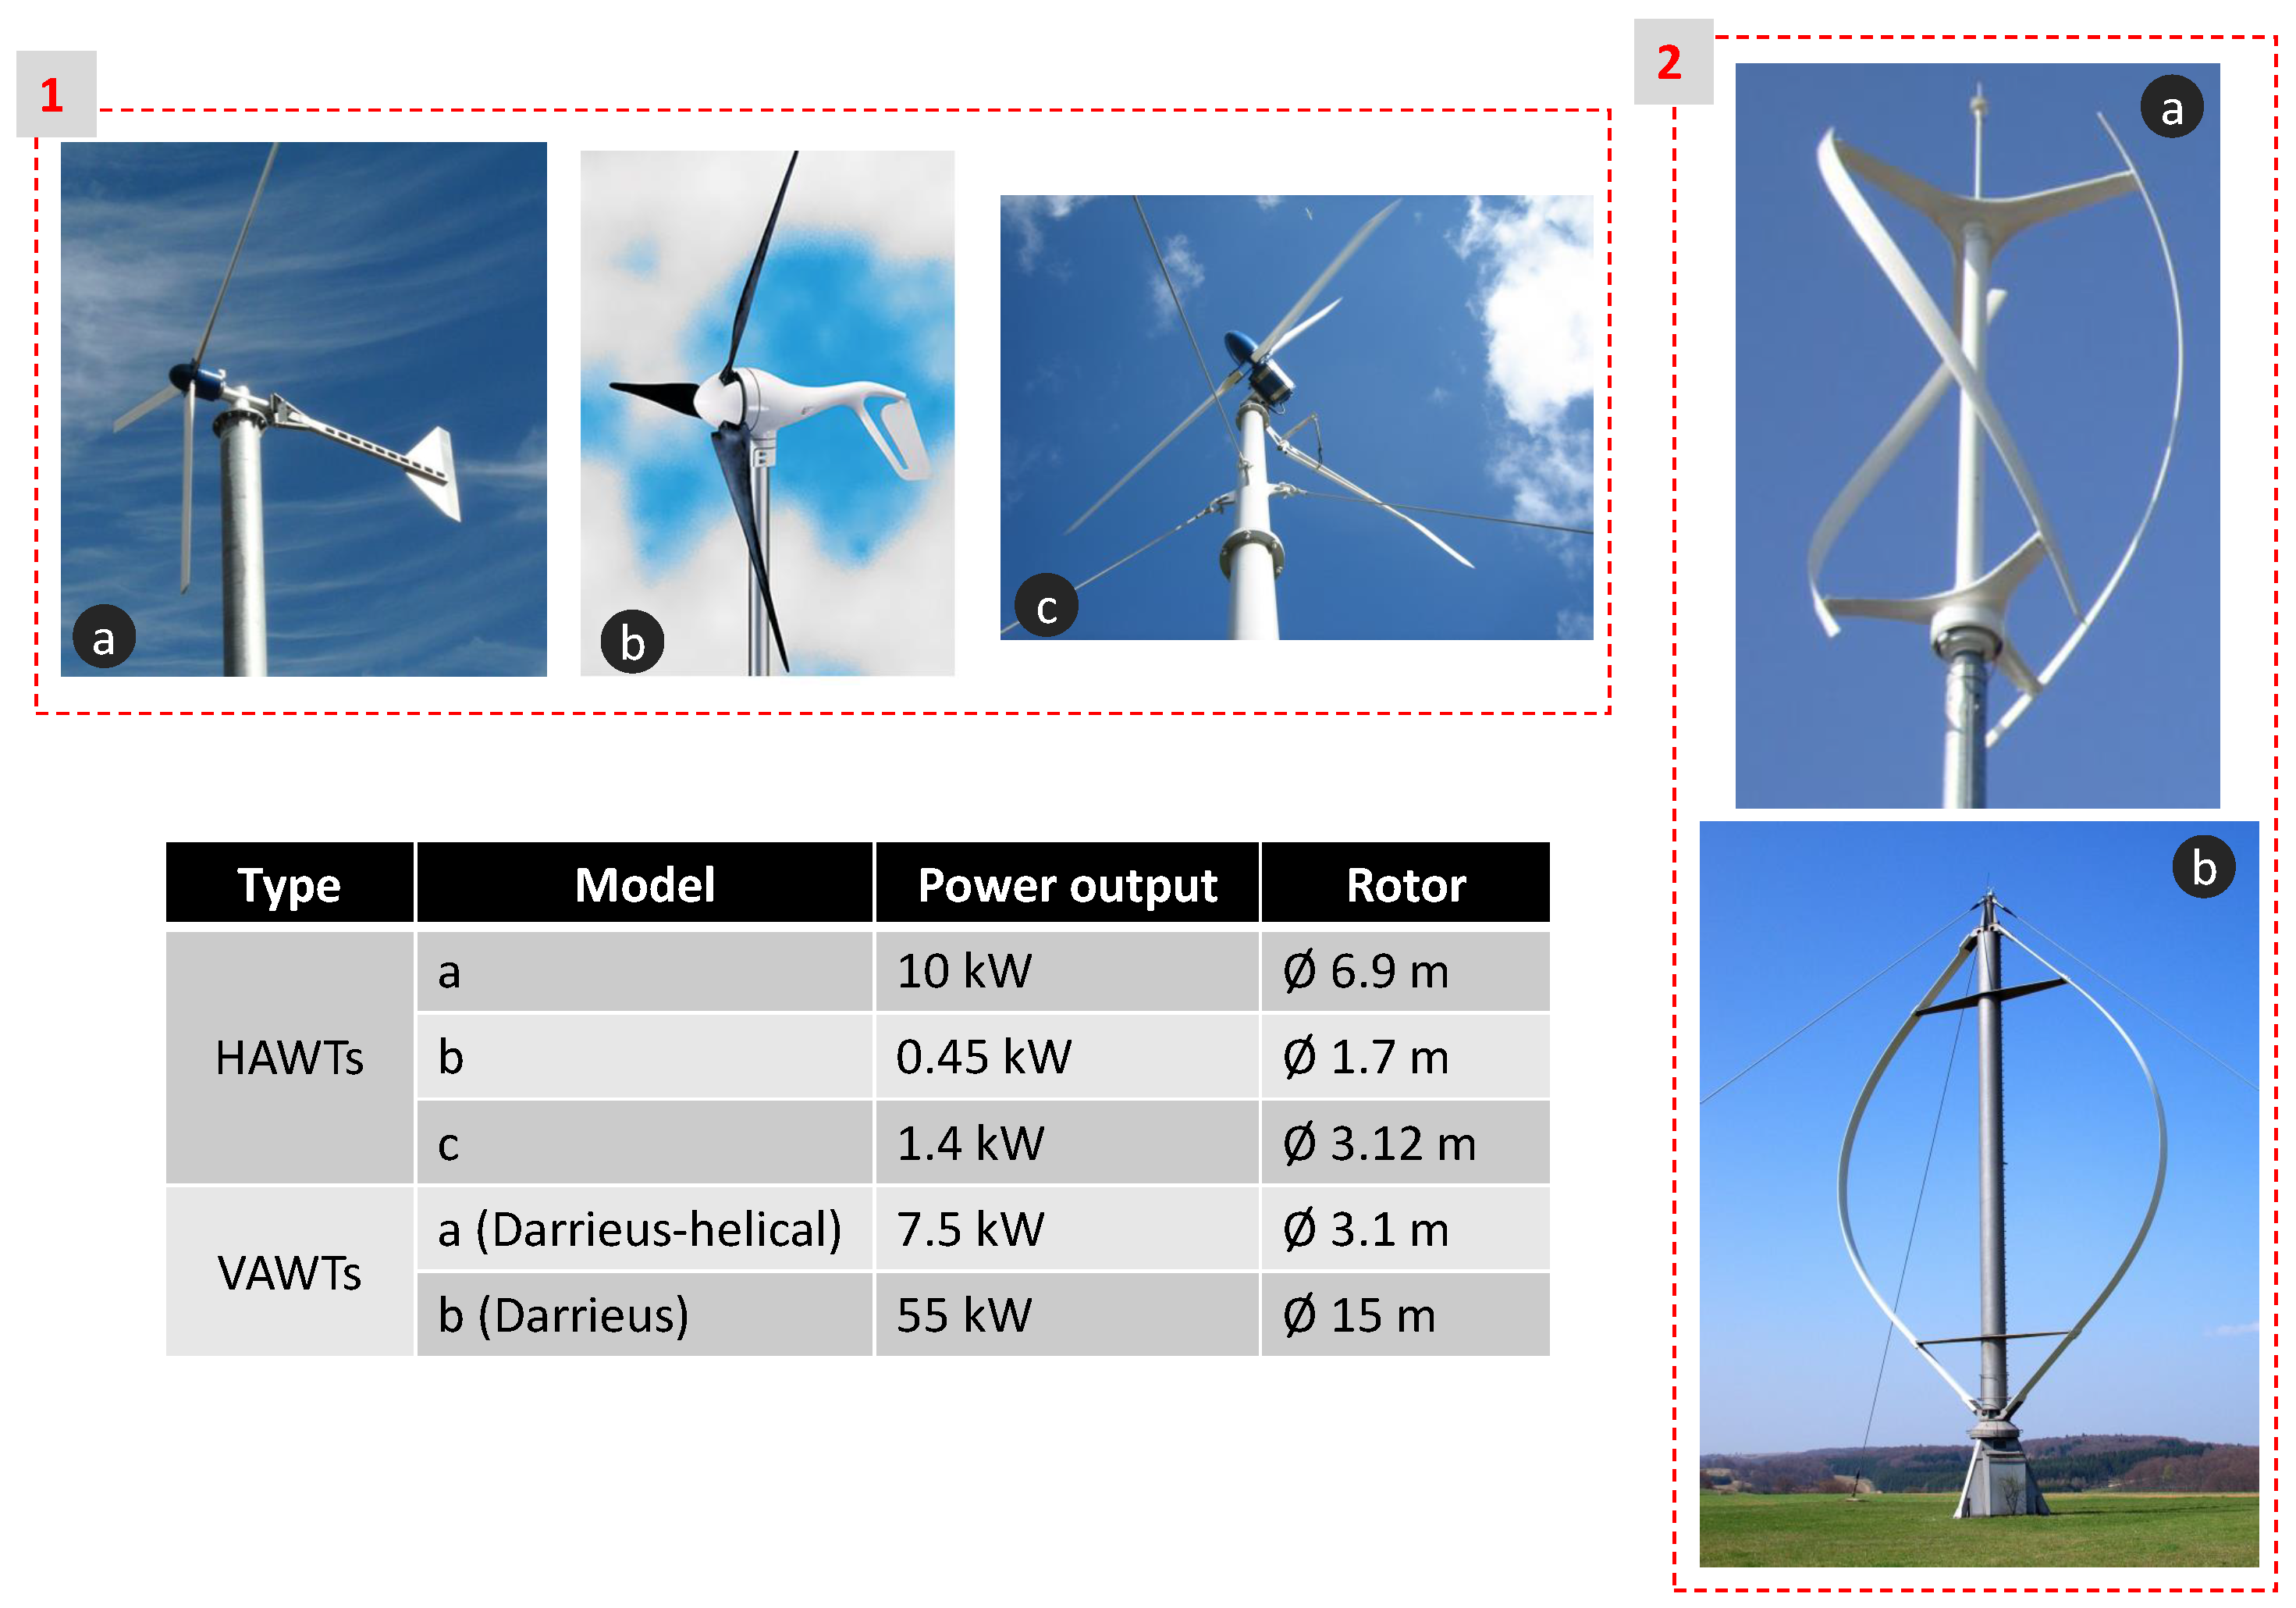
3. Current Technology: Horizontal- and Vertical-Axis Wind Turbines

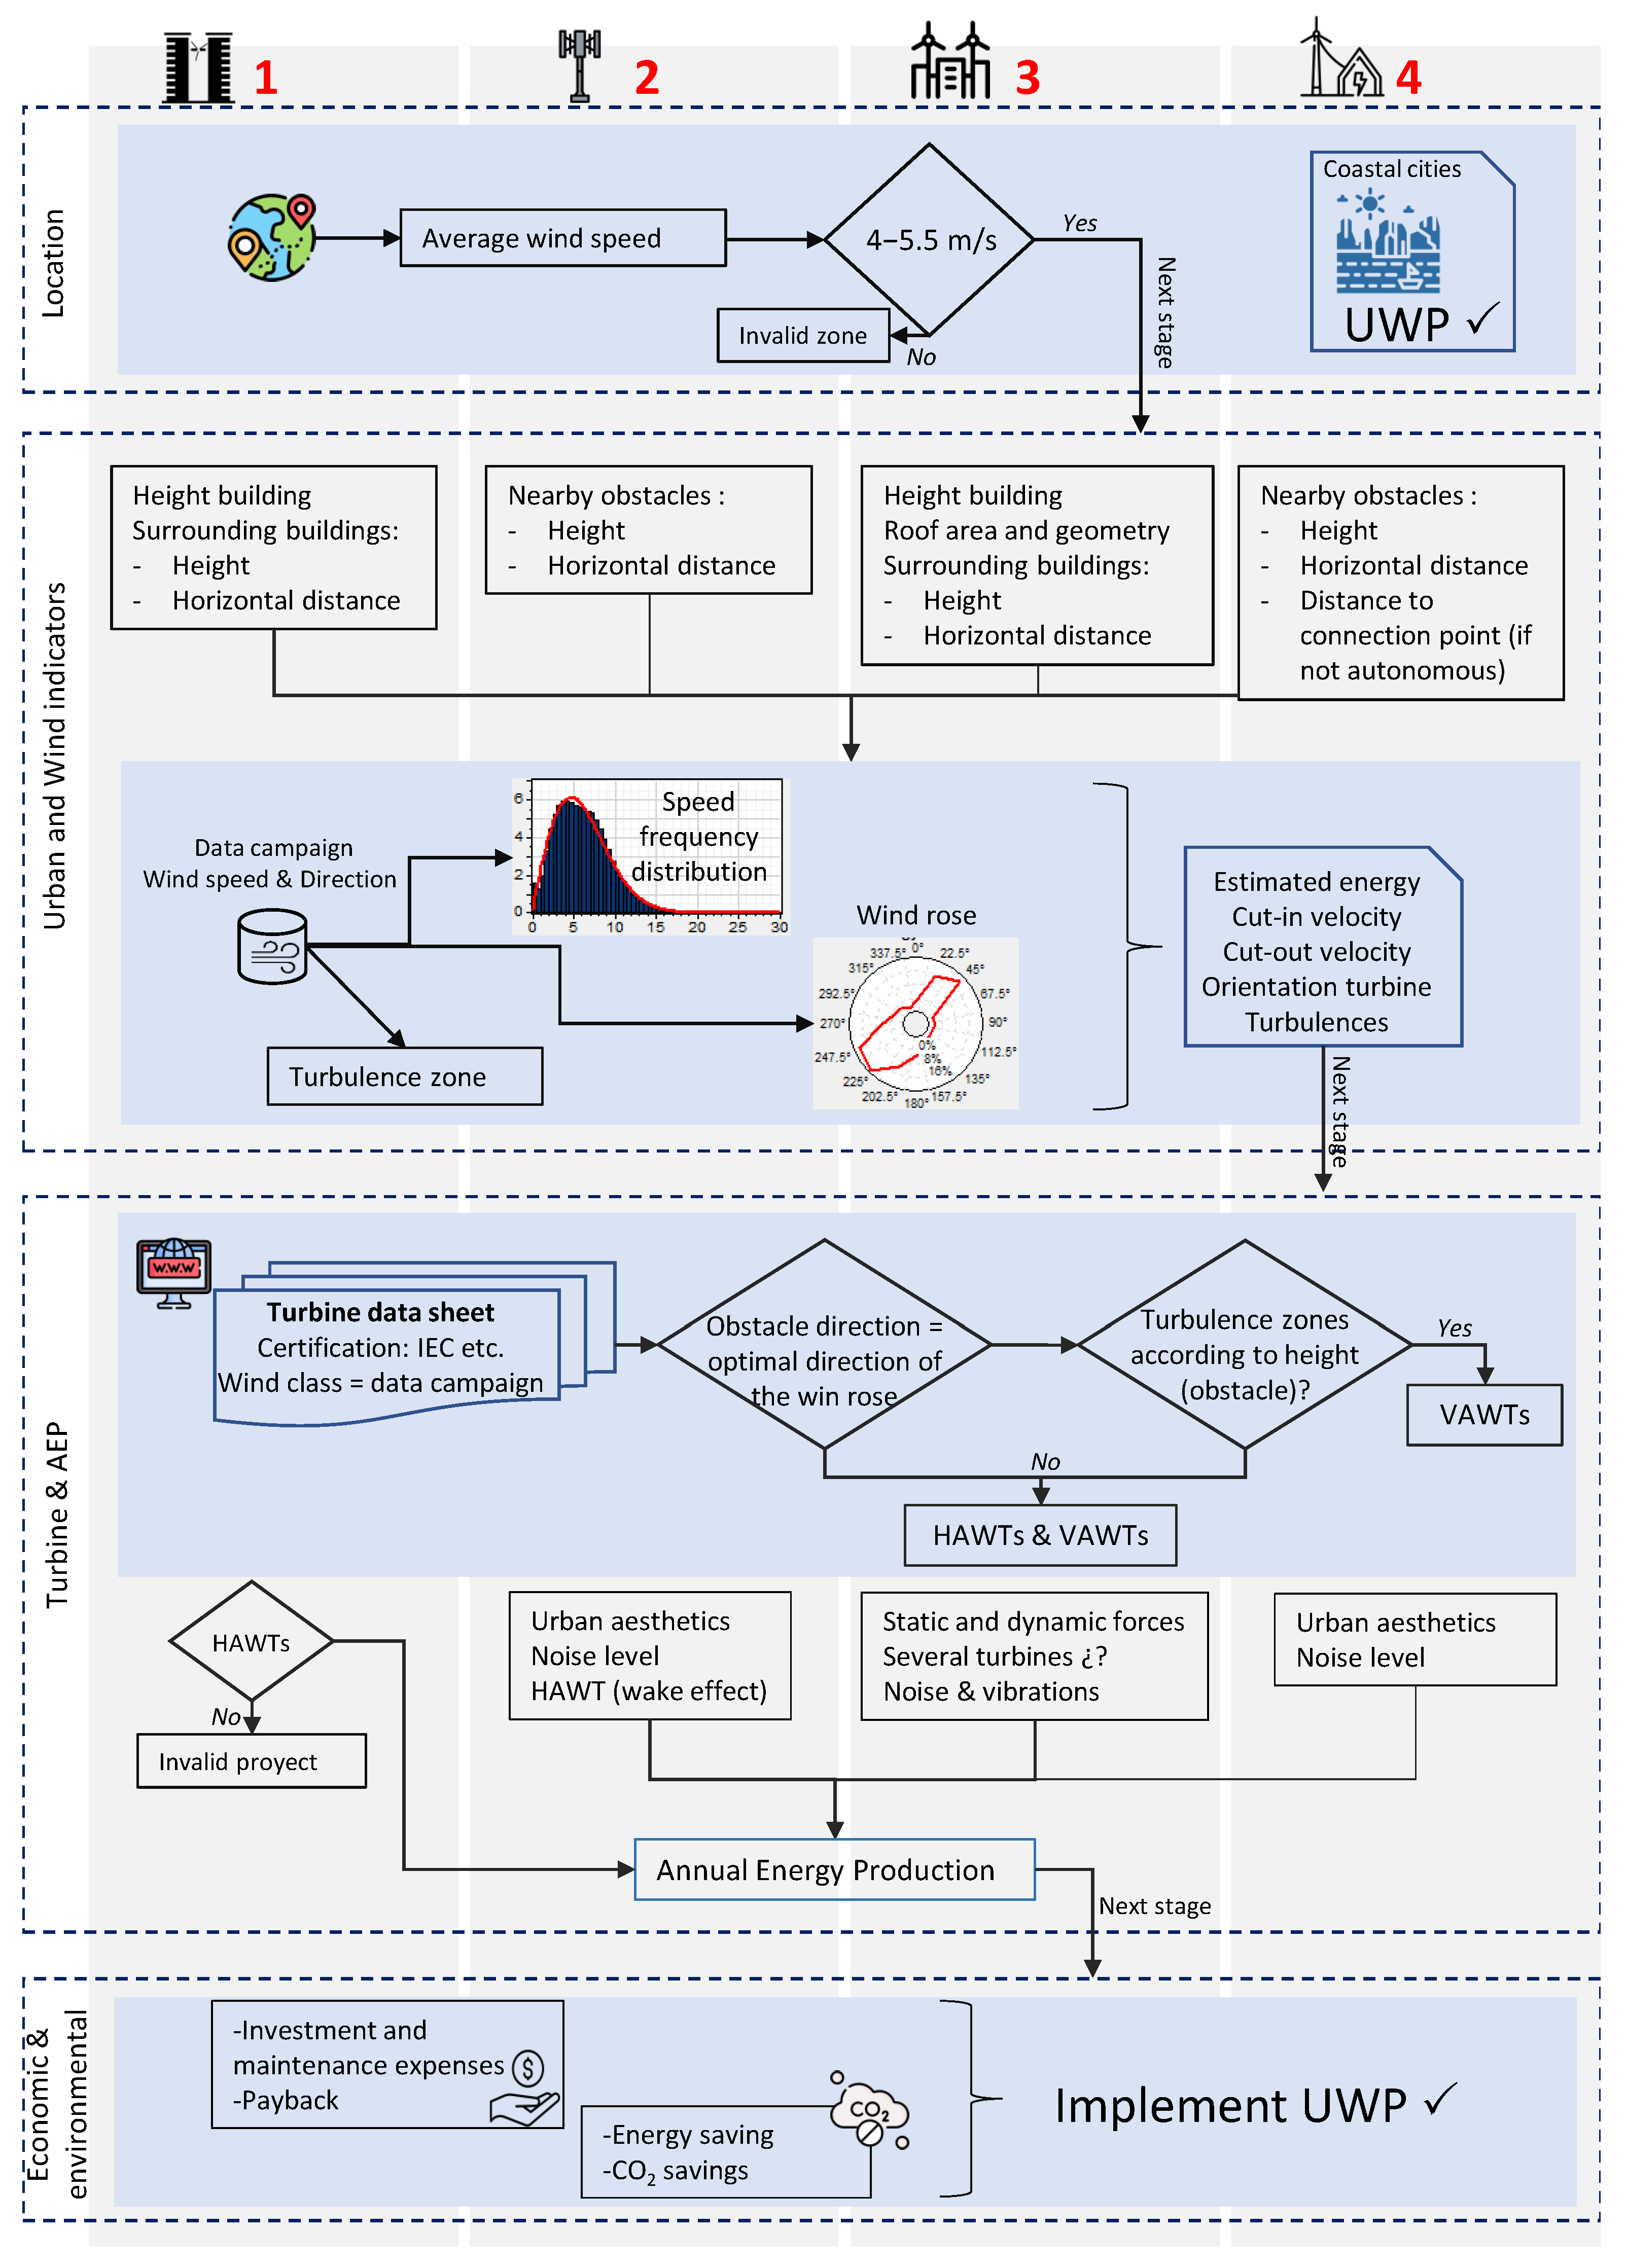
4. Guide for Urban Wind Projects
- The methodology simultaneously integrates the different typologies of urban wind projects.
- Analysis indicators, such as wind speed, wind direction, and urban planning, are specified in each methodological stage, whether or not they are common to the different typologies.
- The results of power generation and the economic–environmental analysis are included in the proposed methodology to evaluate the implementation of such favorable alternatives.
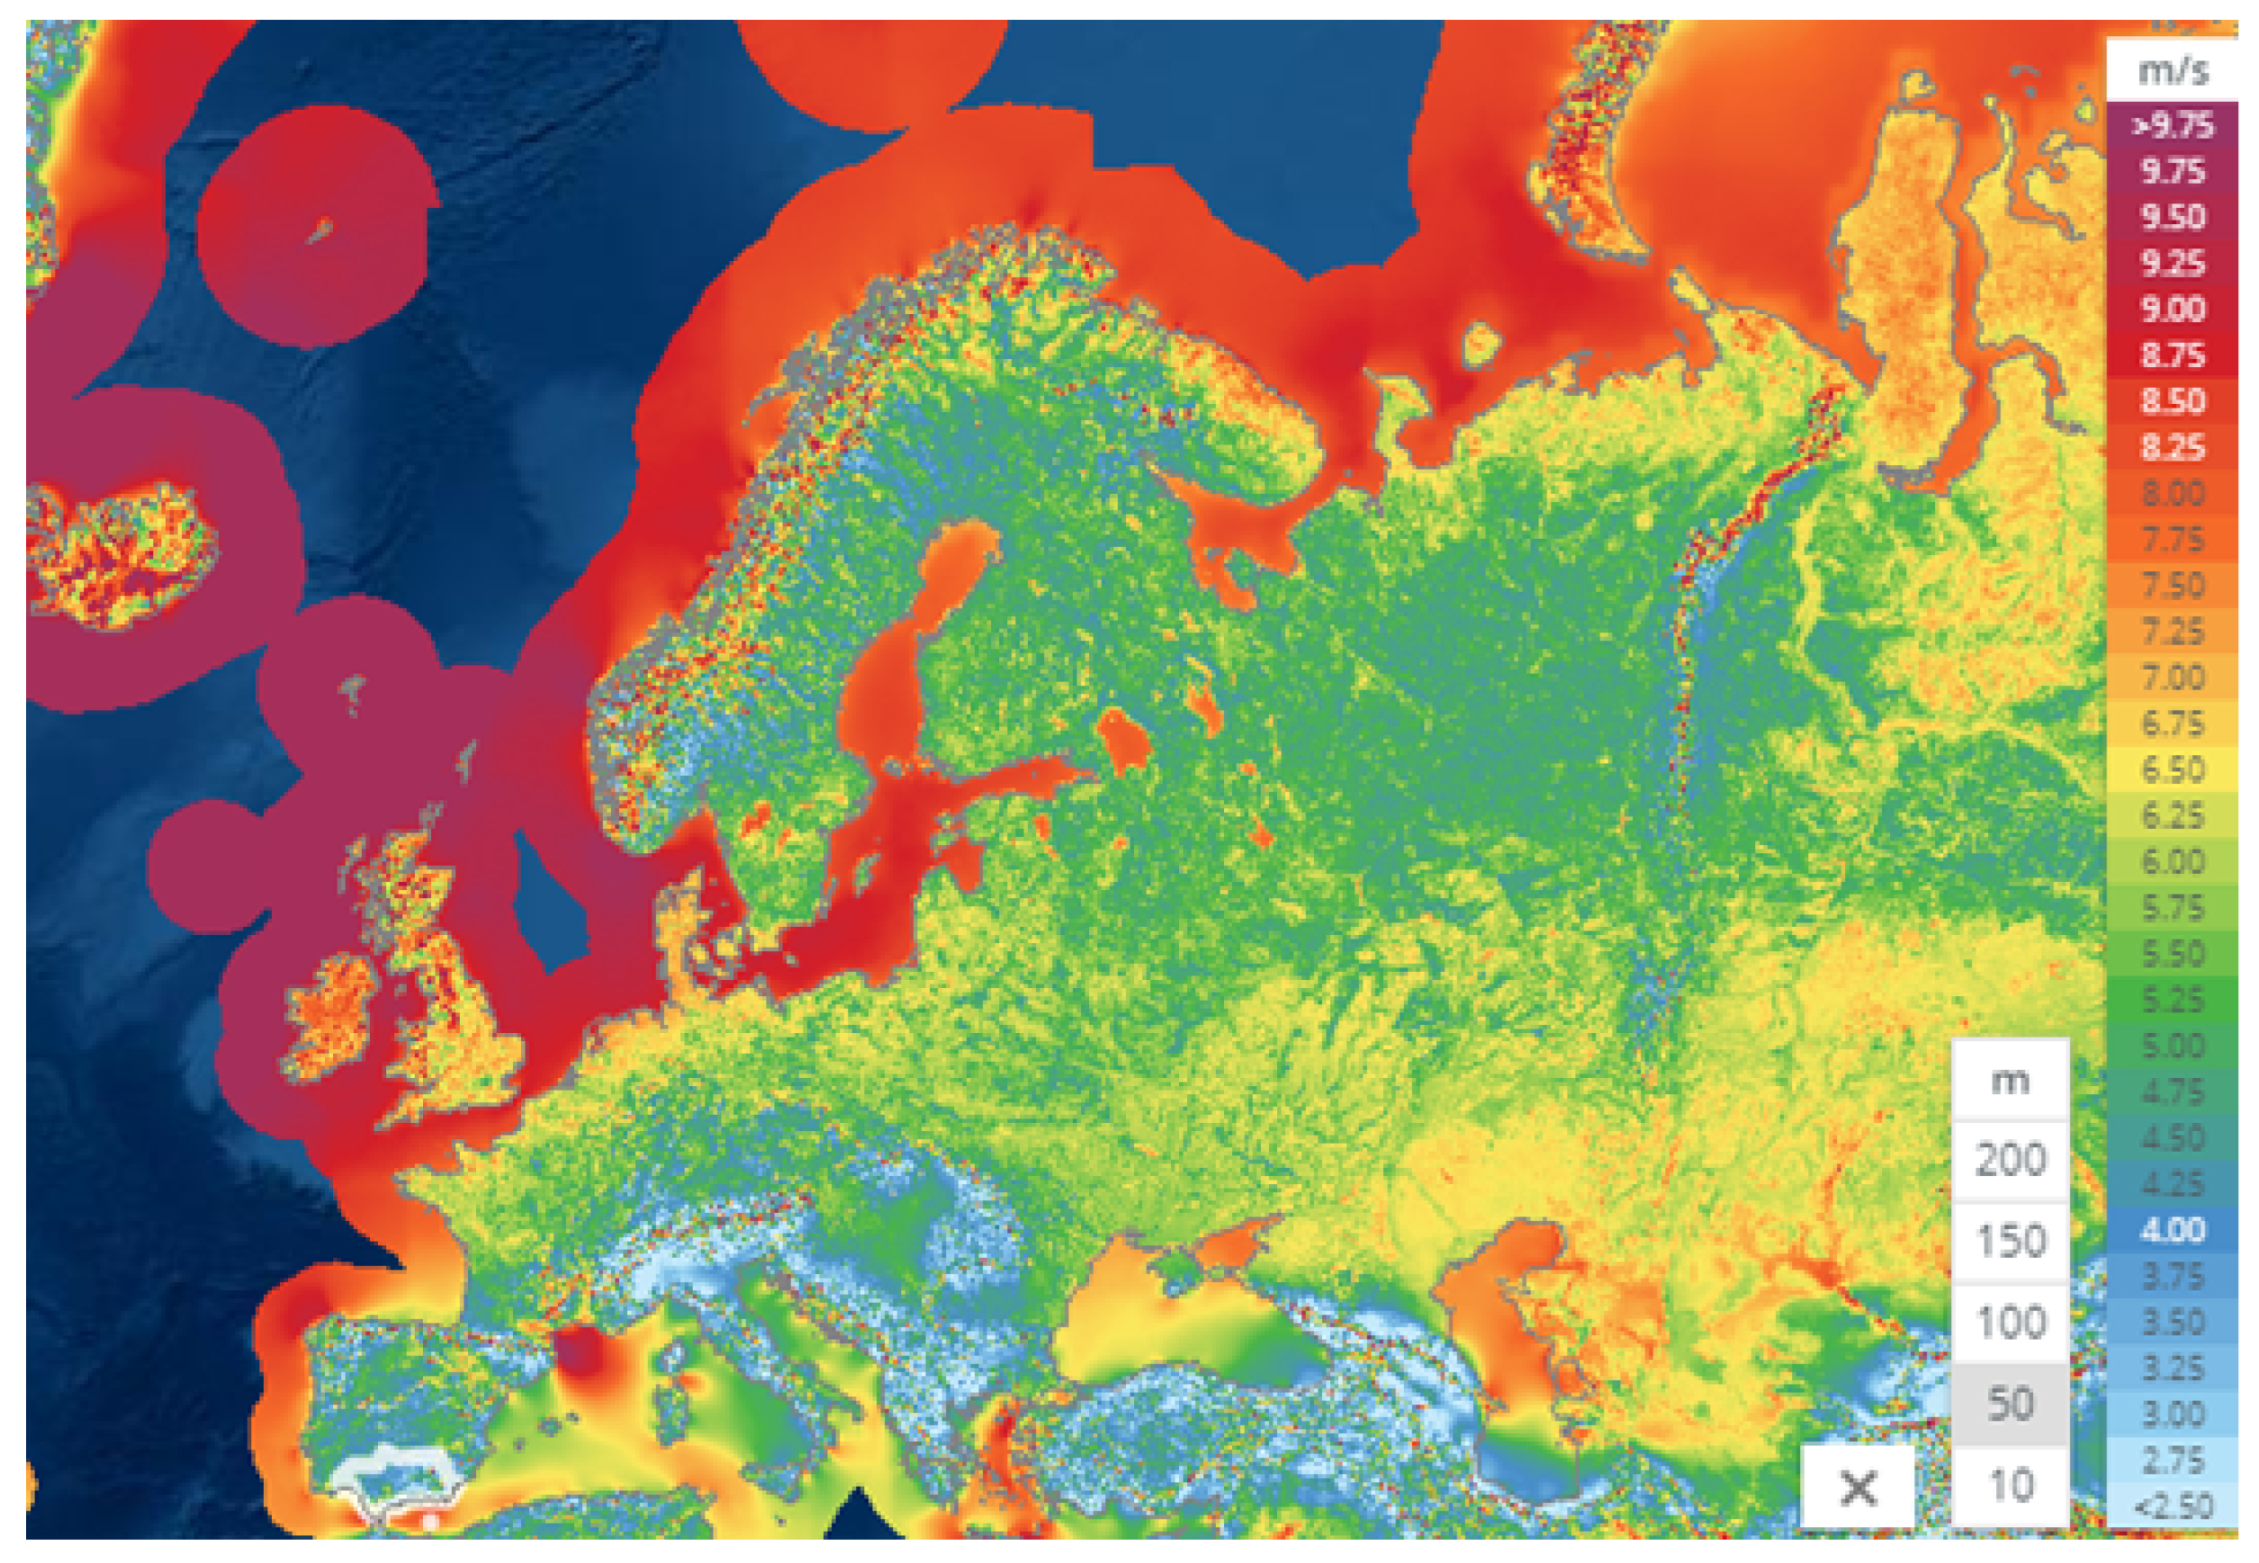
4.1. Location
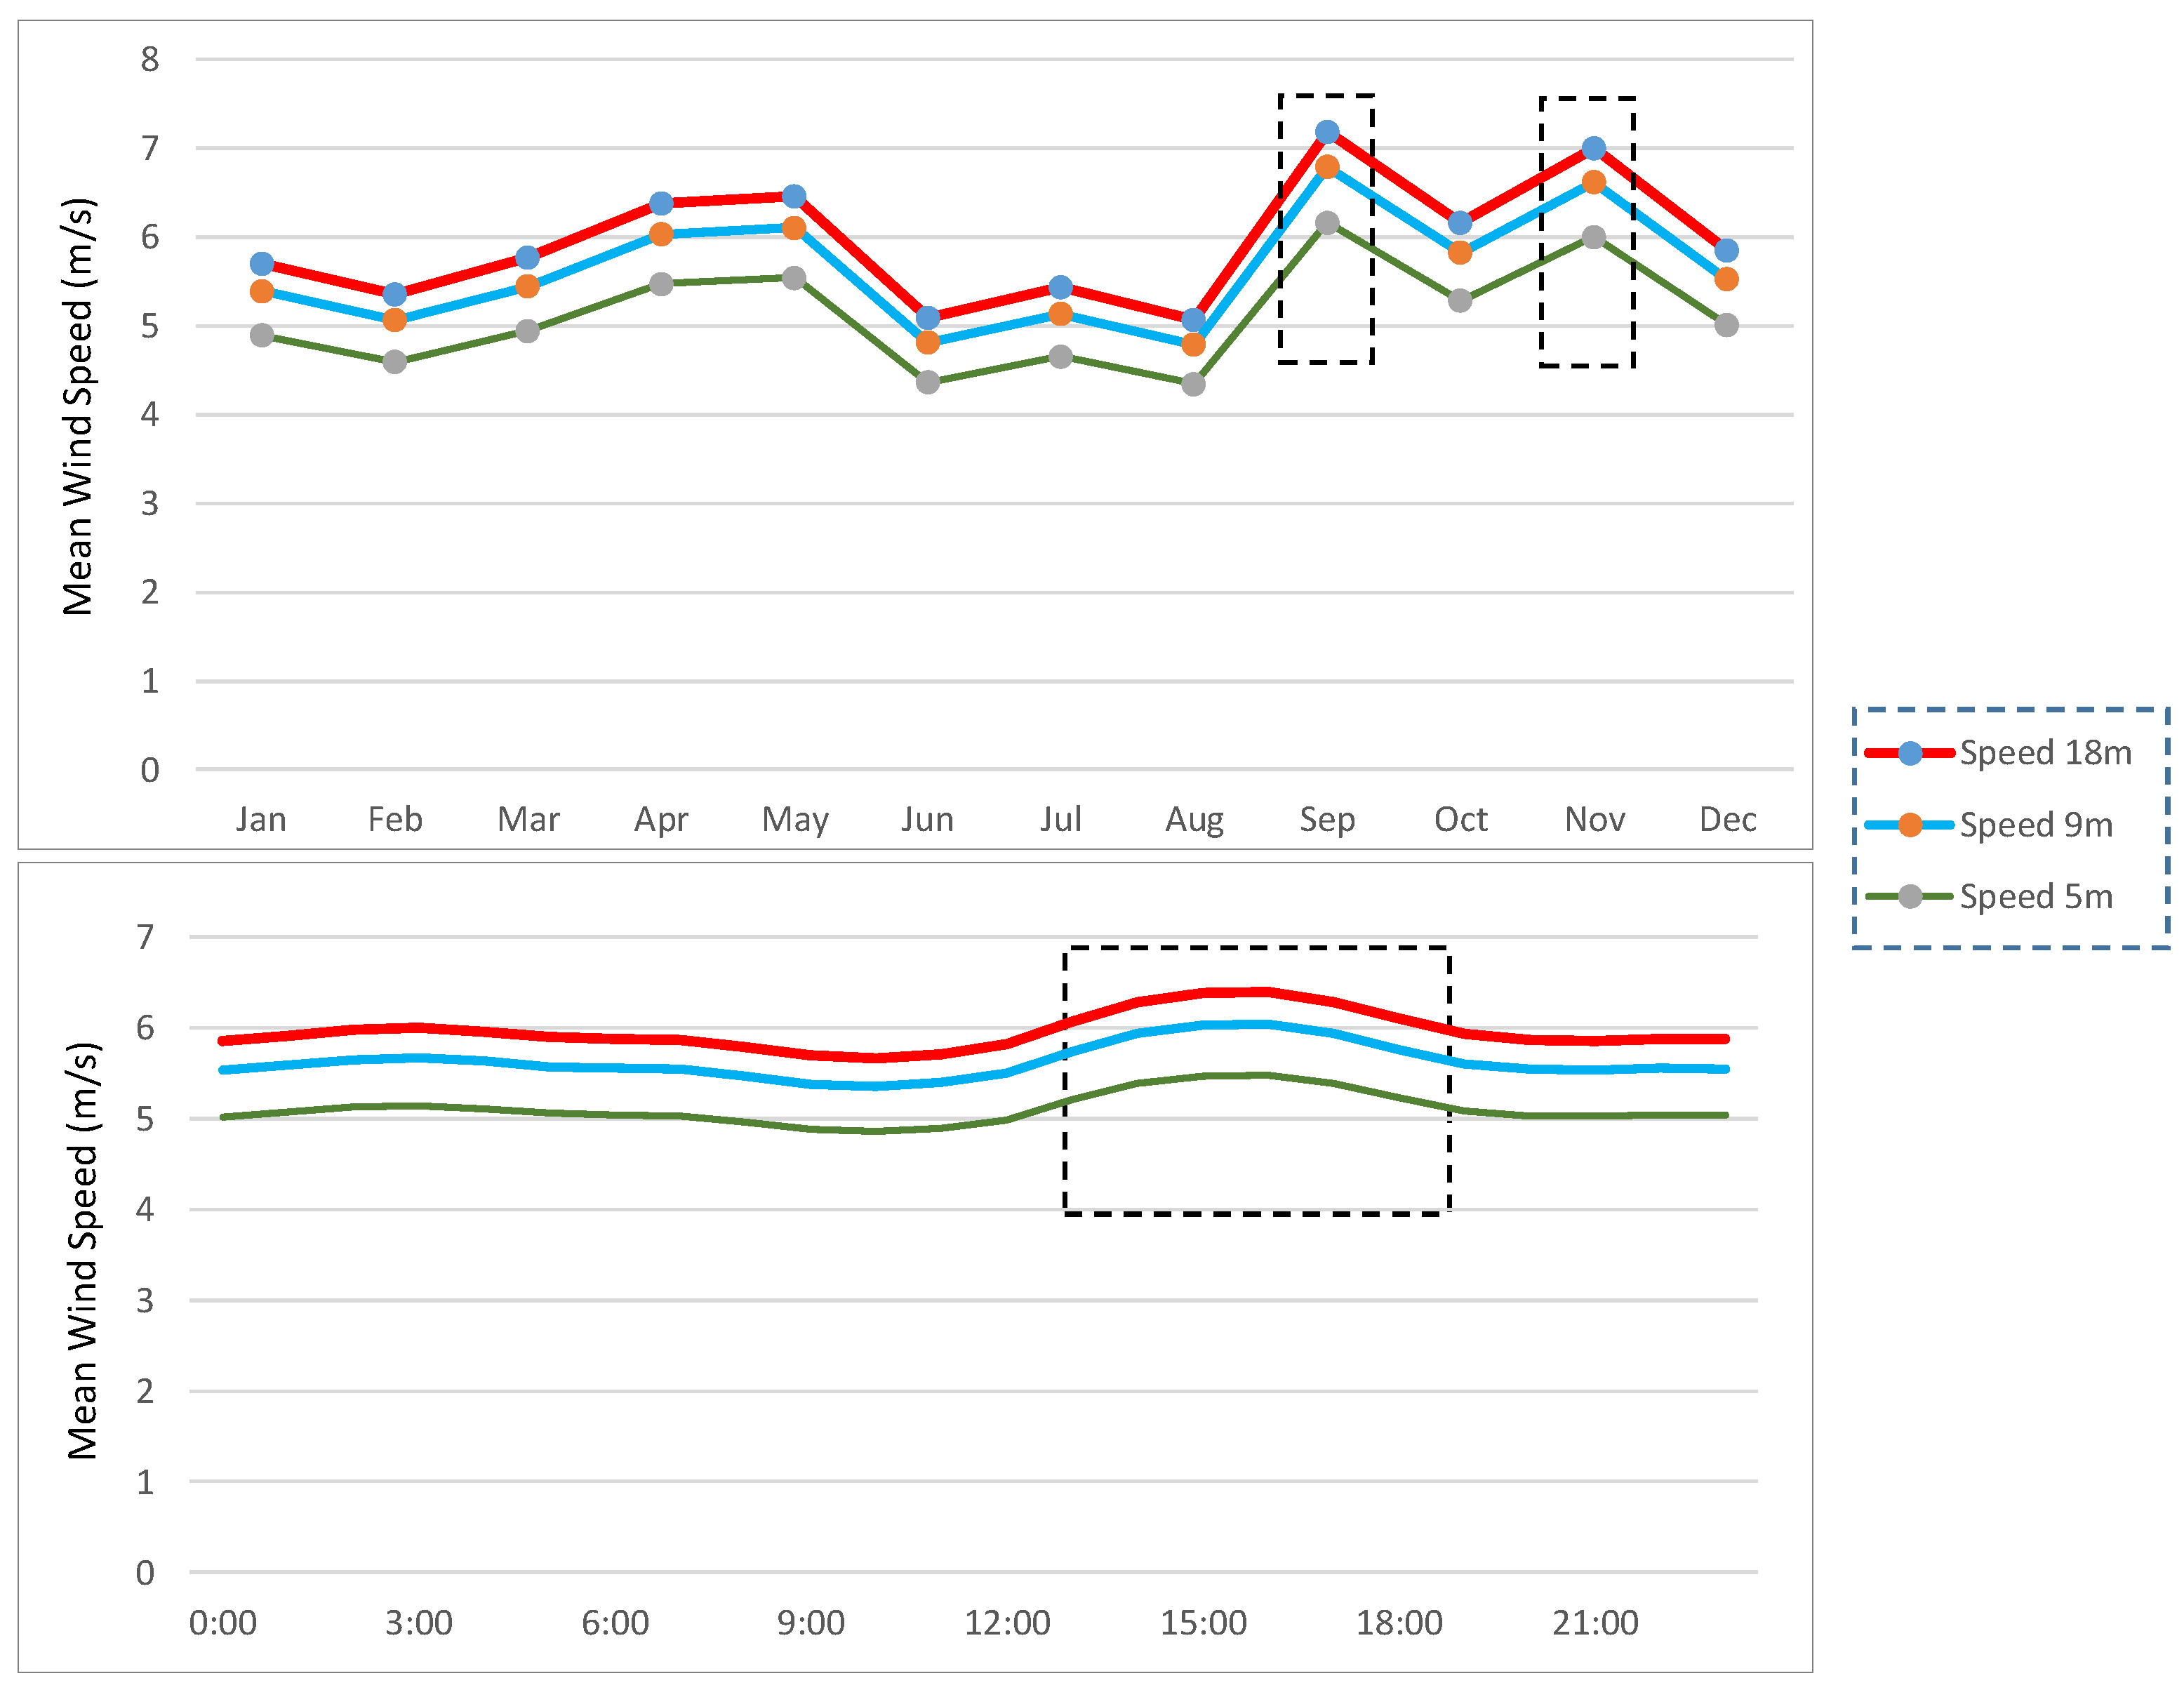
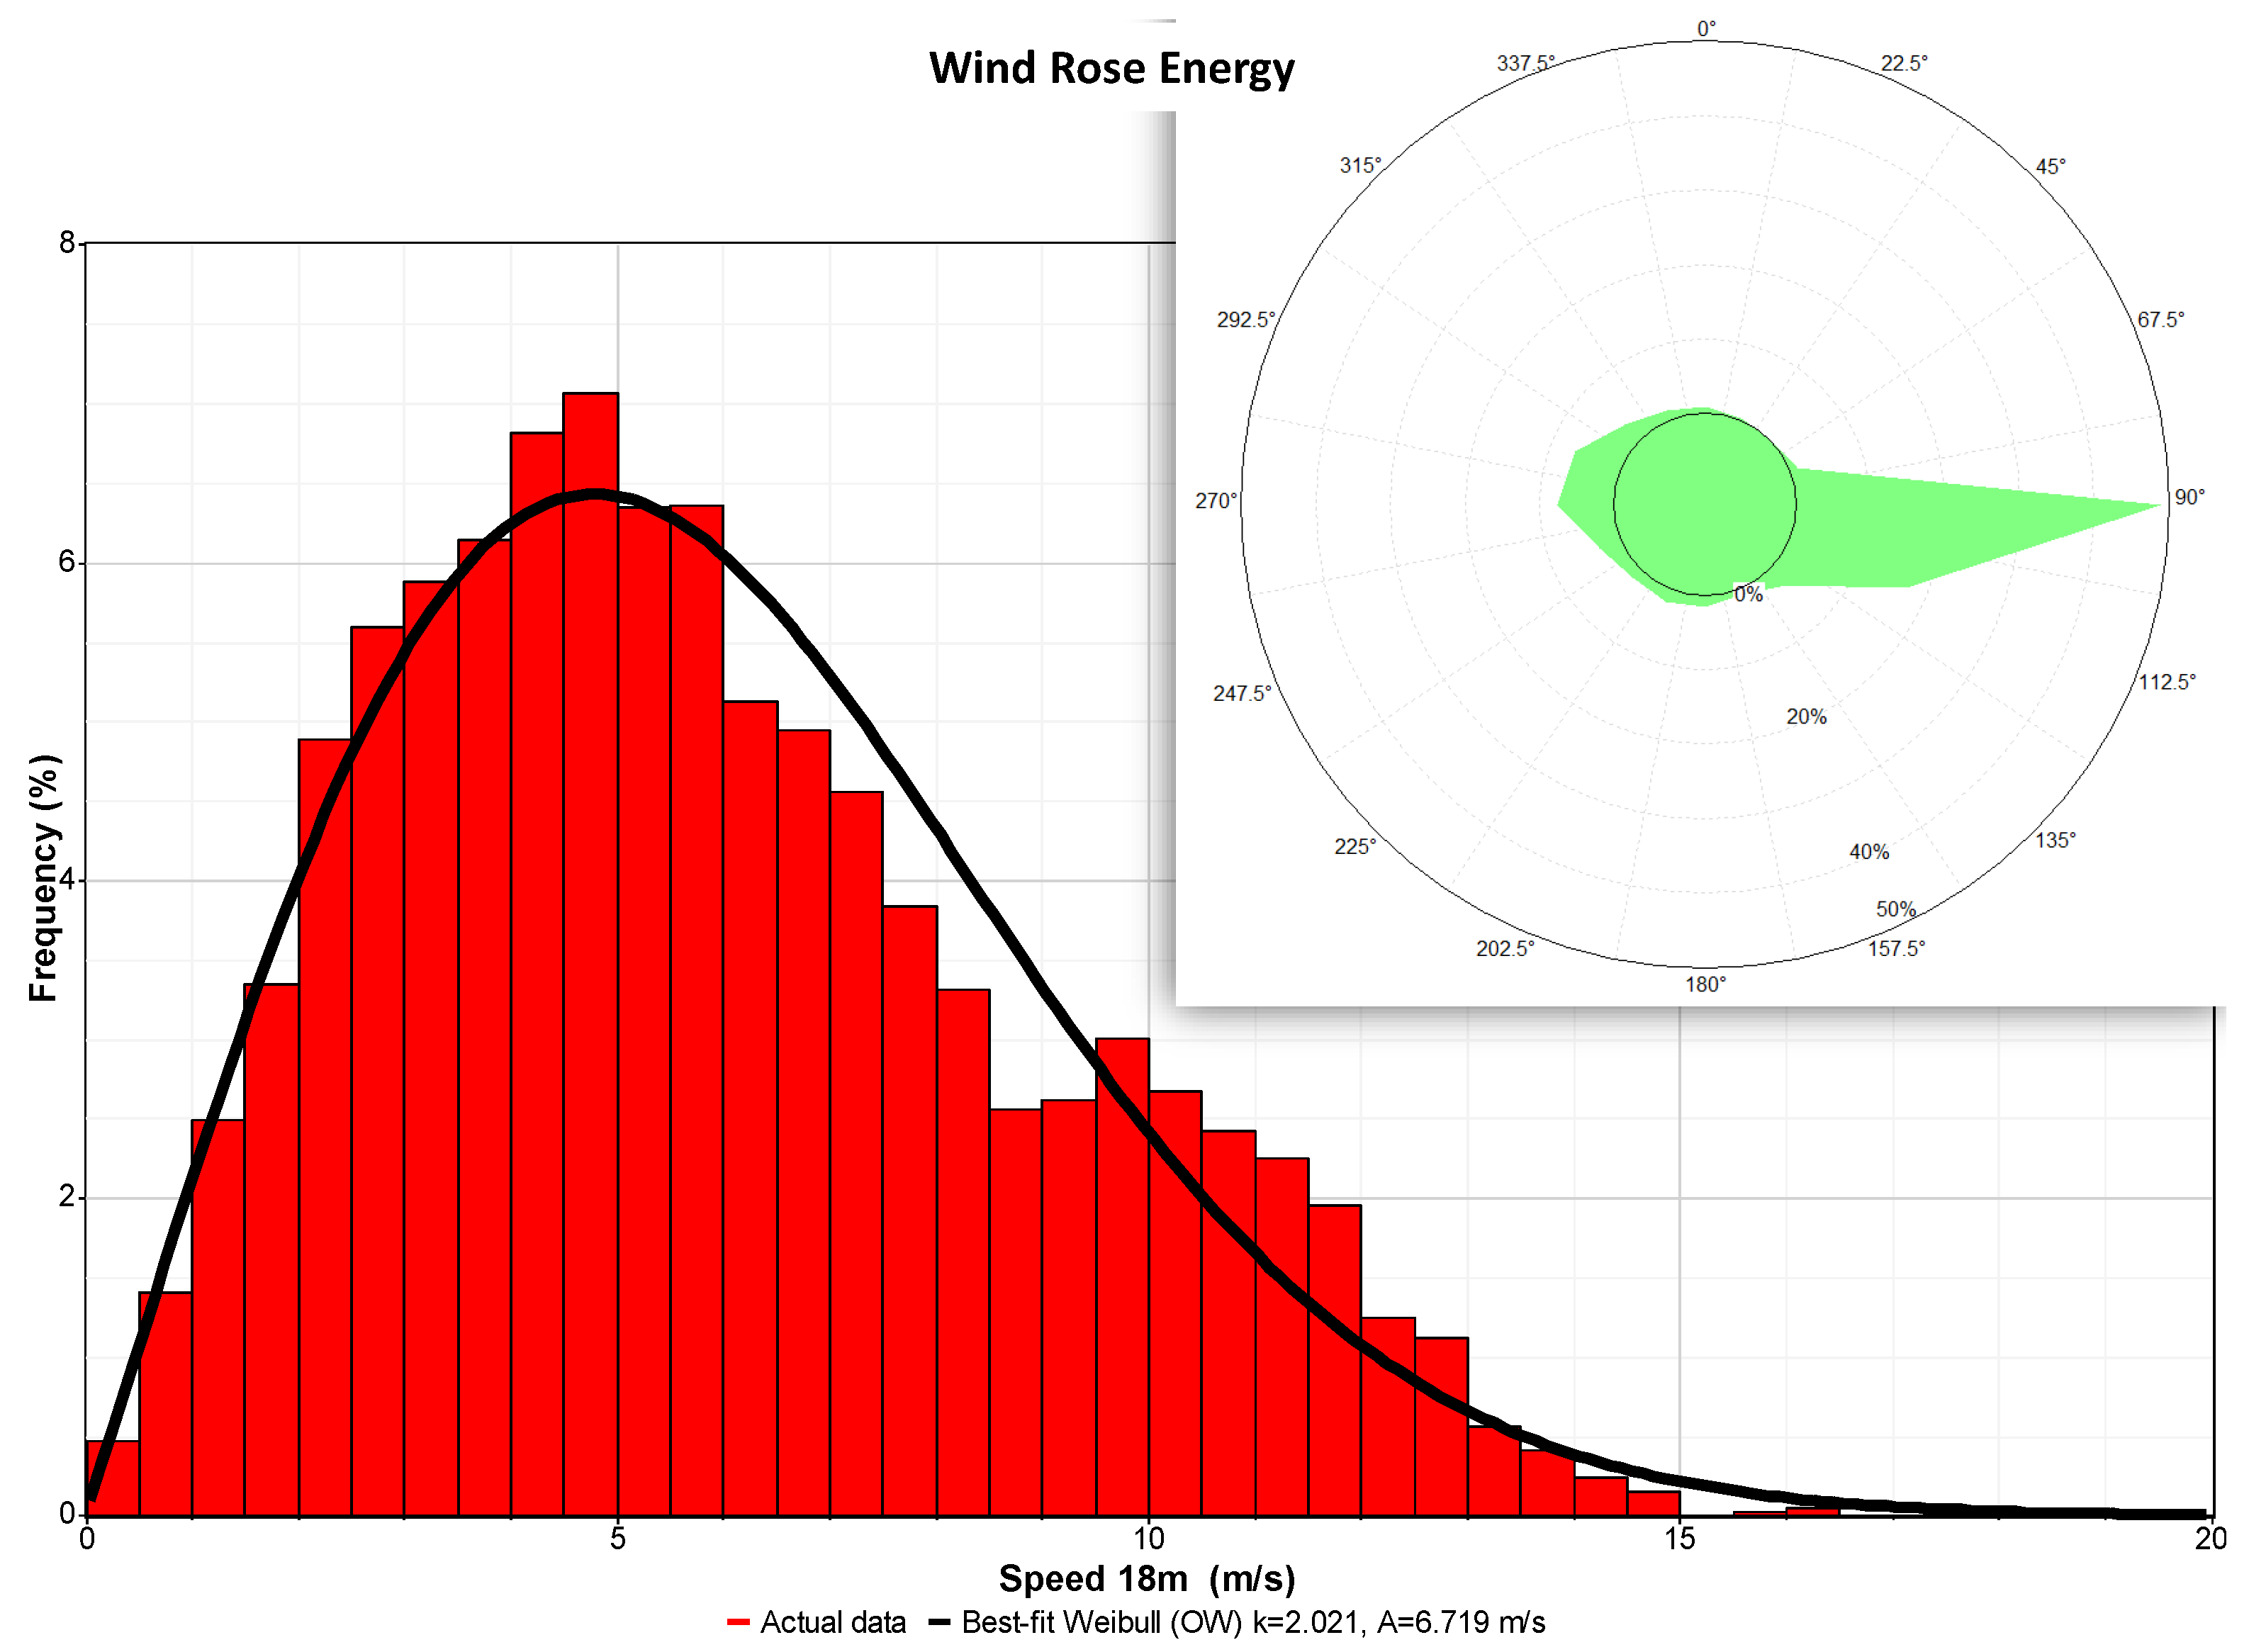
4.2. Urban and Wind Indicators
- Free standing: It is necessary to know the height and horizontal distance of nearby obstacles.
- On the roofs of buildings: It is assumed that the buildings are already built. The measurements that would be necessary a priori would be the height of the building, the height of the surrounding buildings, the horizontal distance between them and the area of the site, the area and geometry of the roof, and future building projects. Roofs with sloping or rounded edges are recommended to enhance the aerodynamic properties.
- Alone near buildings: It is necessary to know the height and horizontal distance of nearby obstacles. If they are wind turbines connected to the grid, the distance to the connection point should be minimized. The height of the buildings can be obtained from free-access GIS databases on websites such as Google Earth [46], Skyscraperpage [47], and WorldBuilding Map [48].
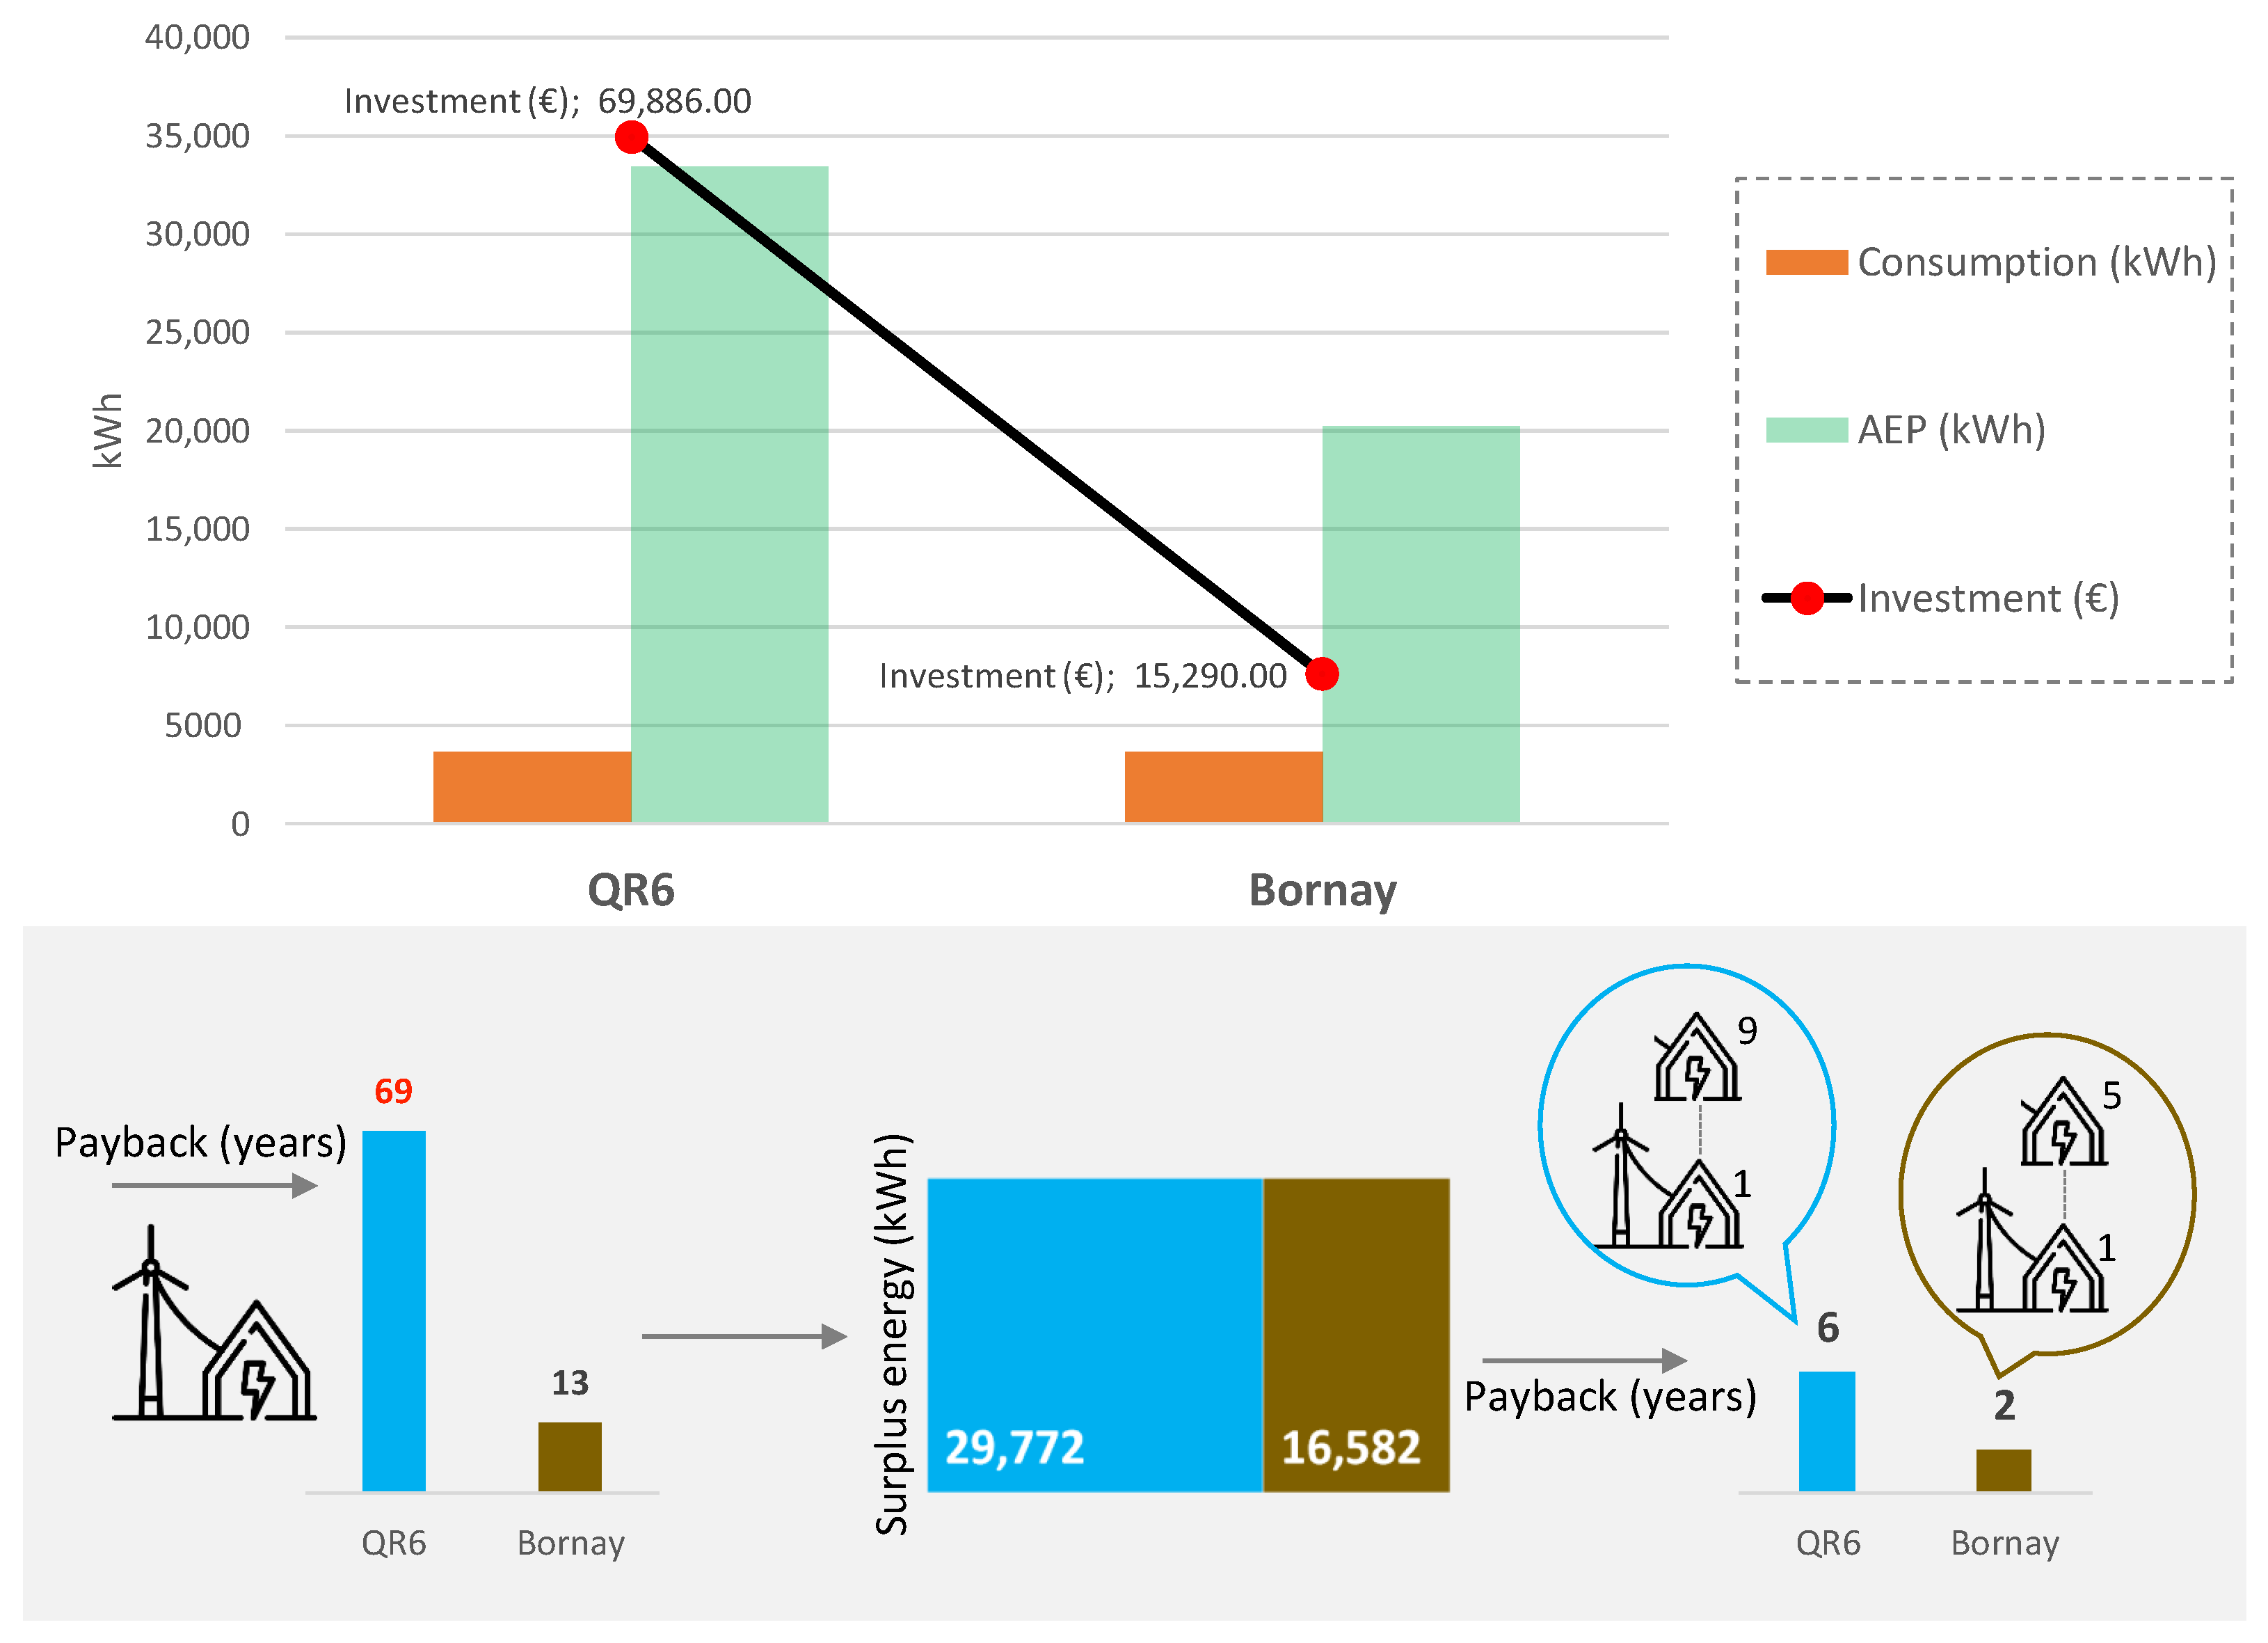
4.3. Wind Turbine Selection and Annual Energy Production (AEP) Estimation
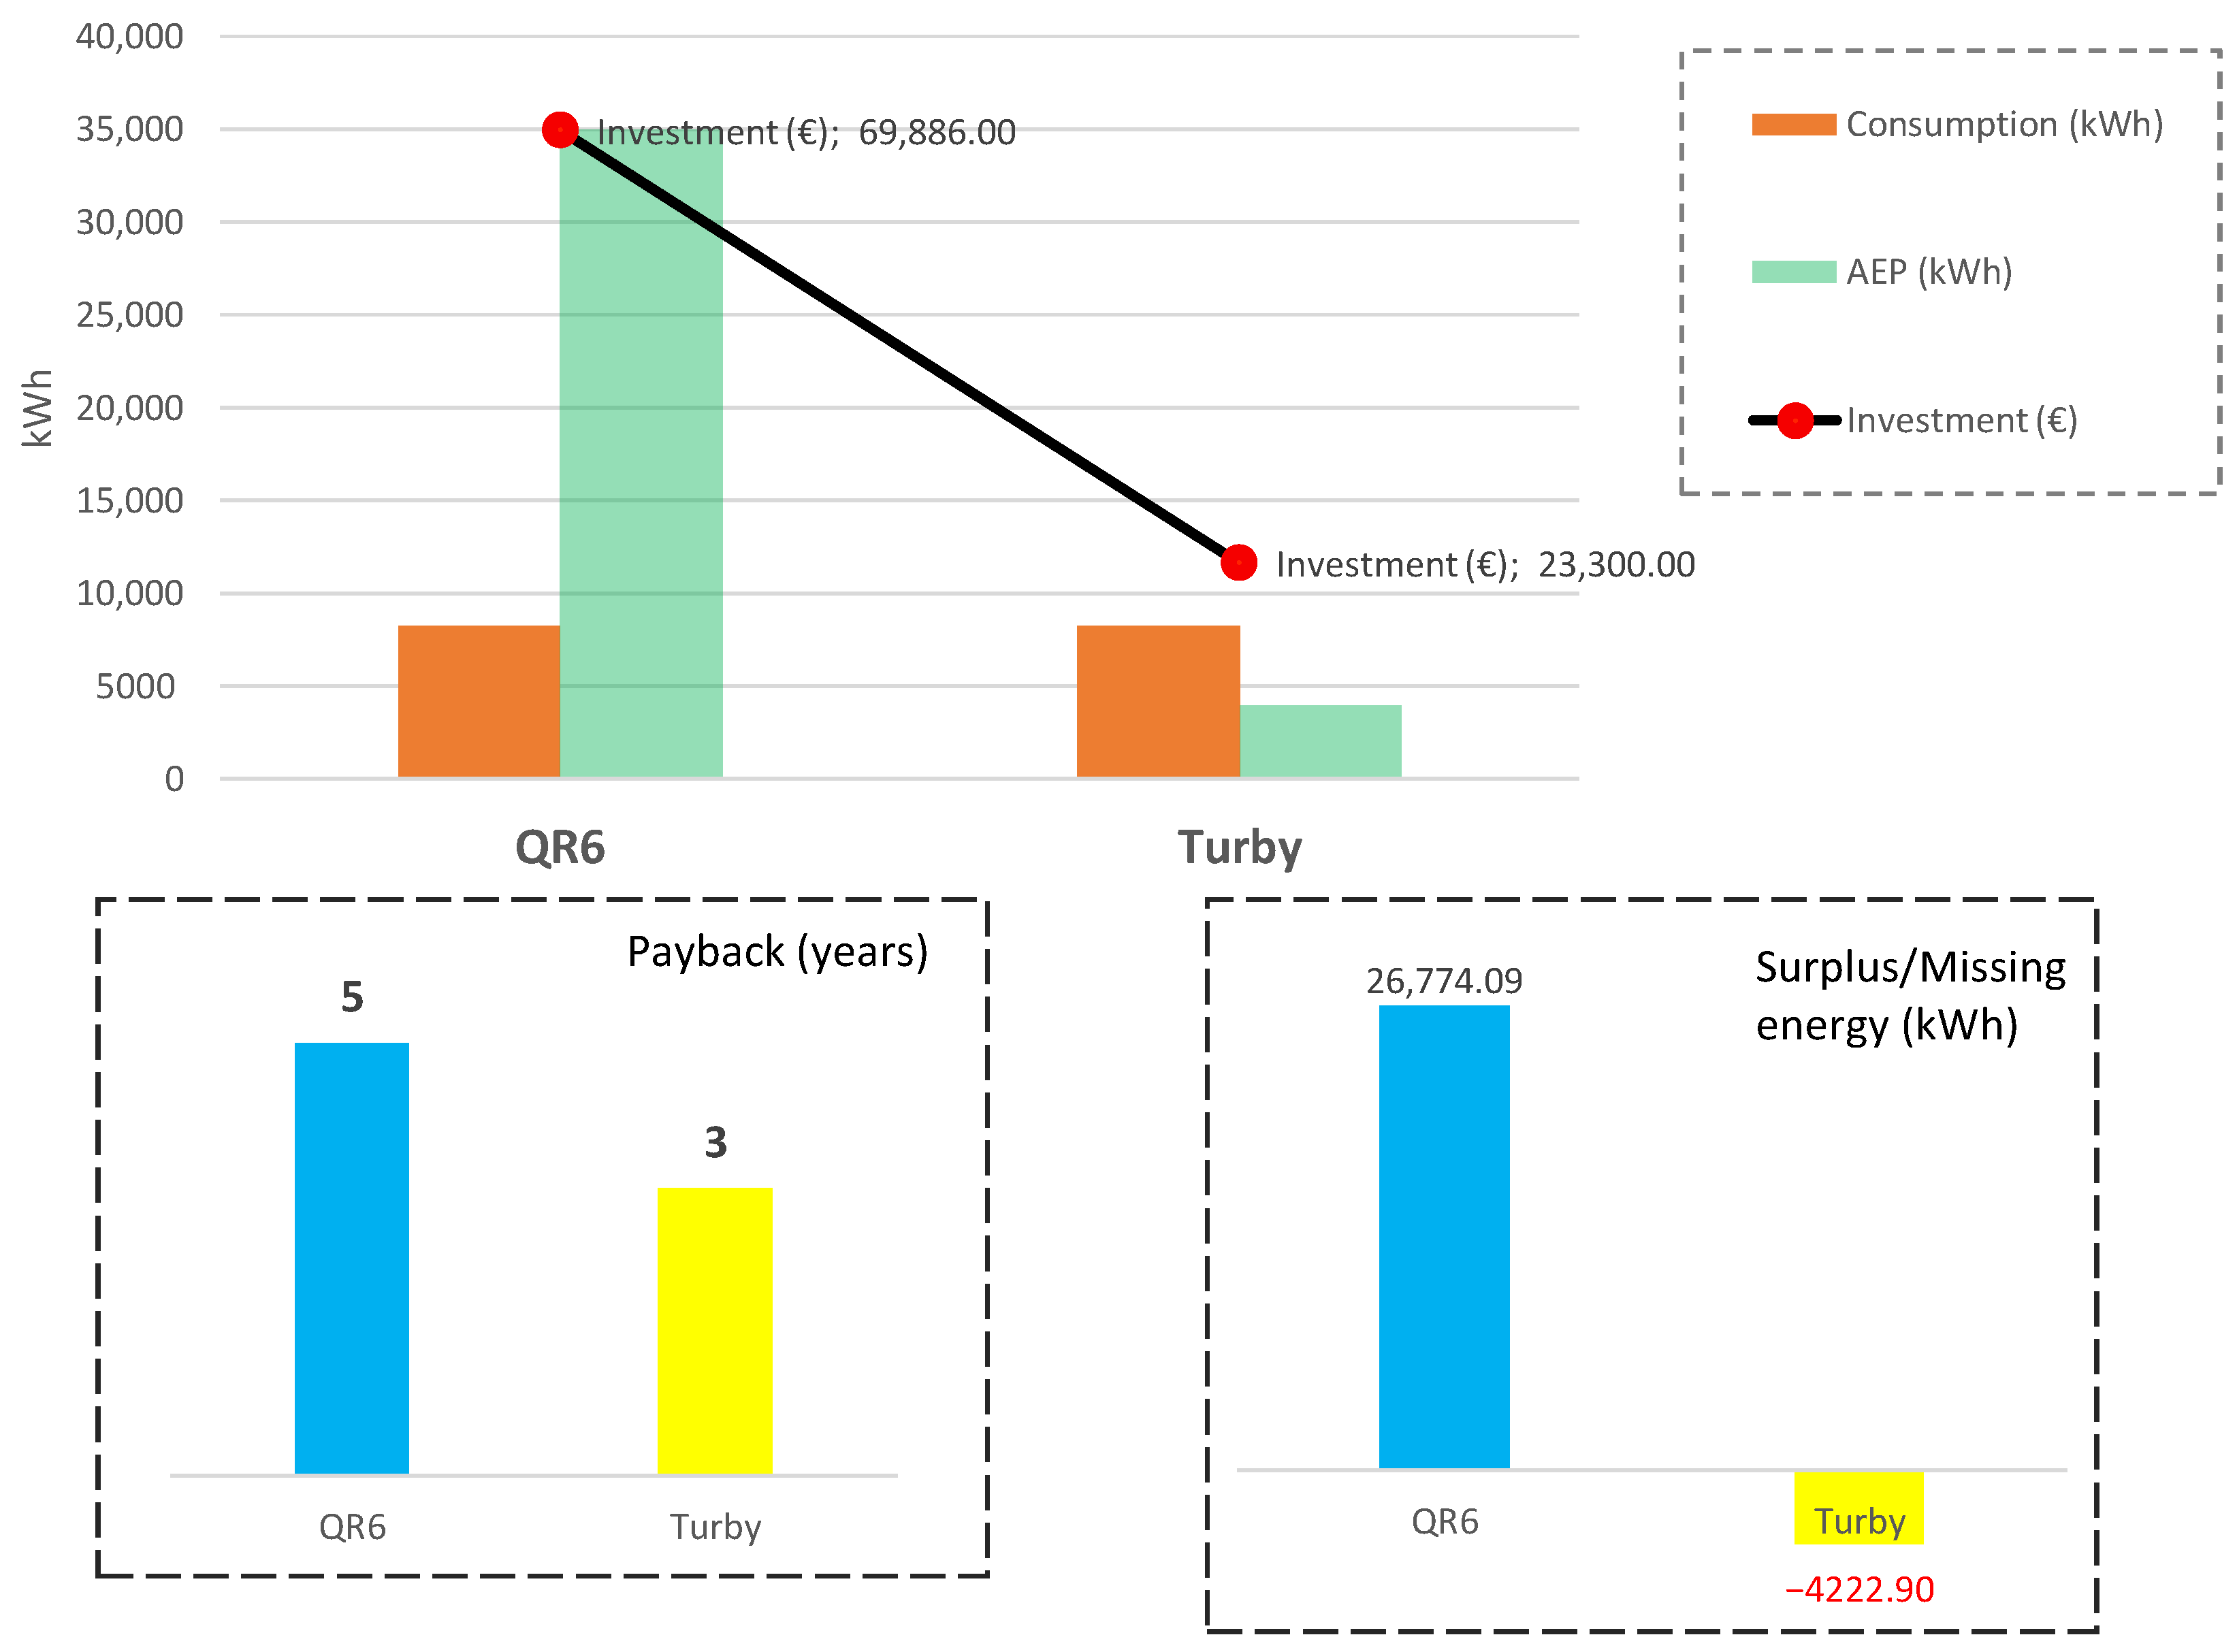
4.4. Economic and Environmental Analysis
- Investment and maintenance expenses.
- Amortization period.
- Energy saving.
- CO savings.
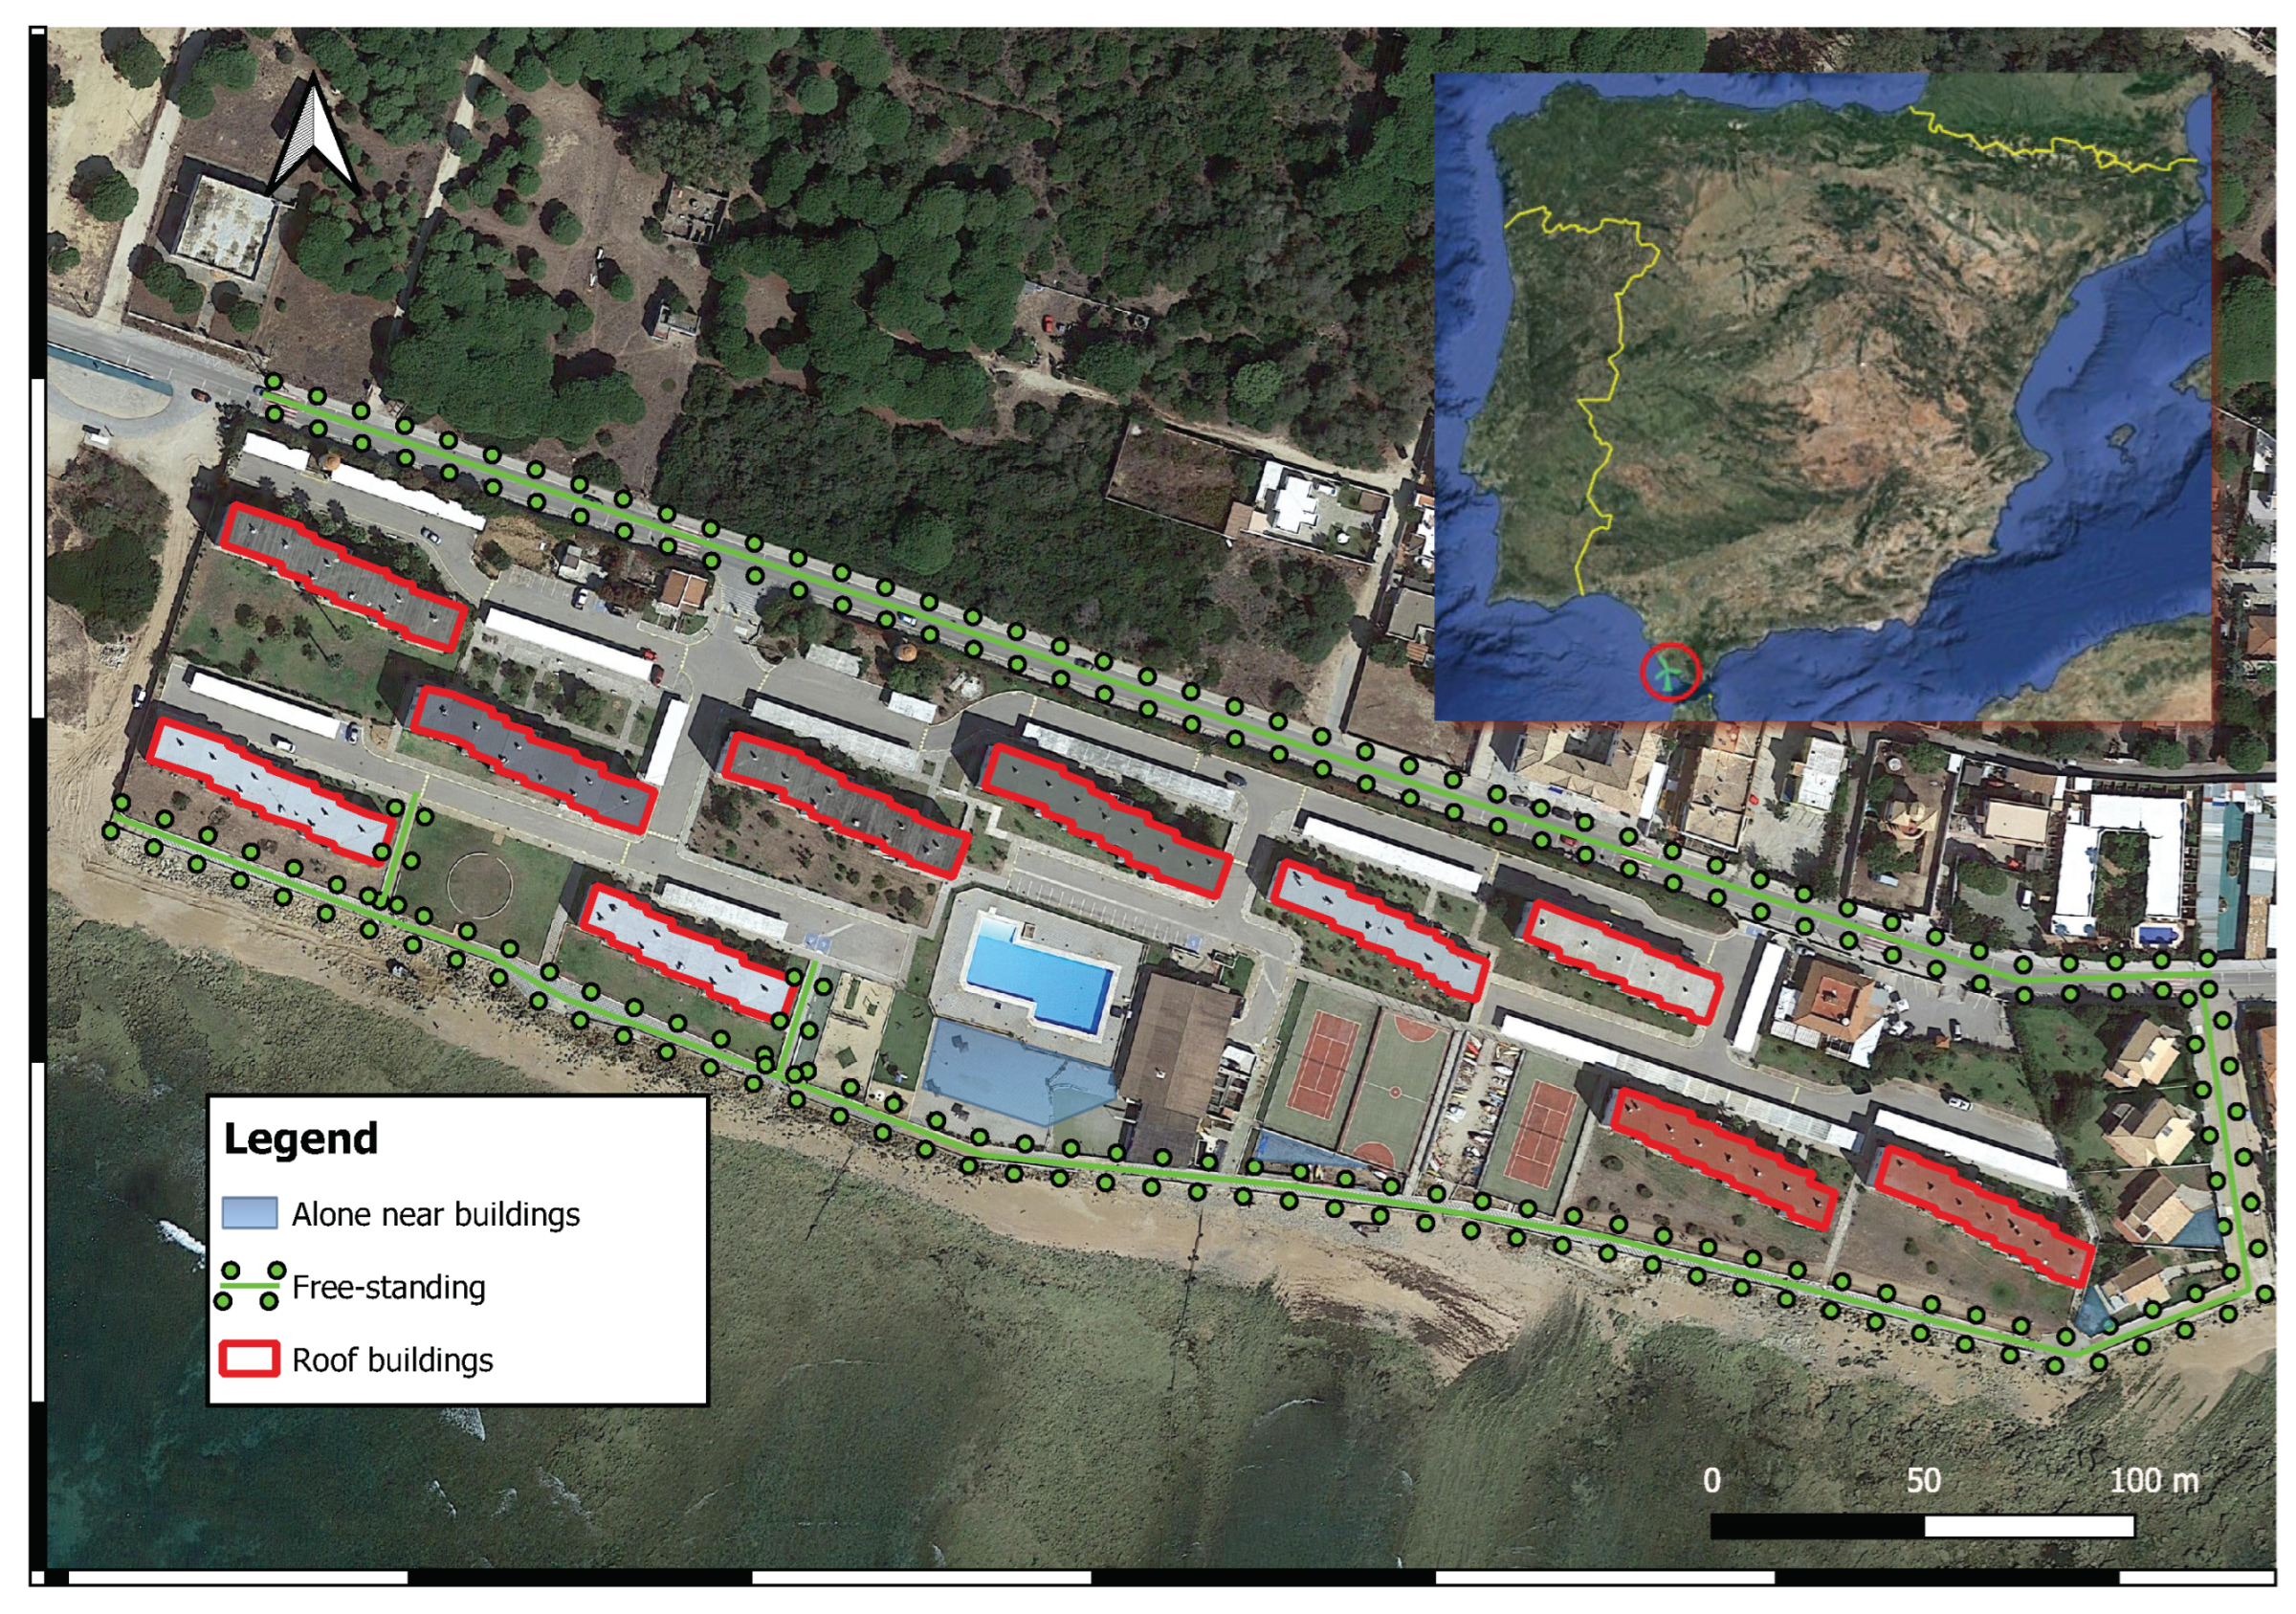
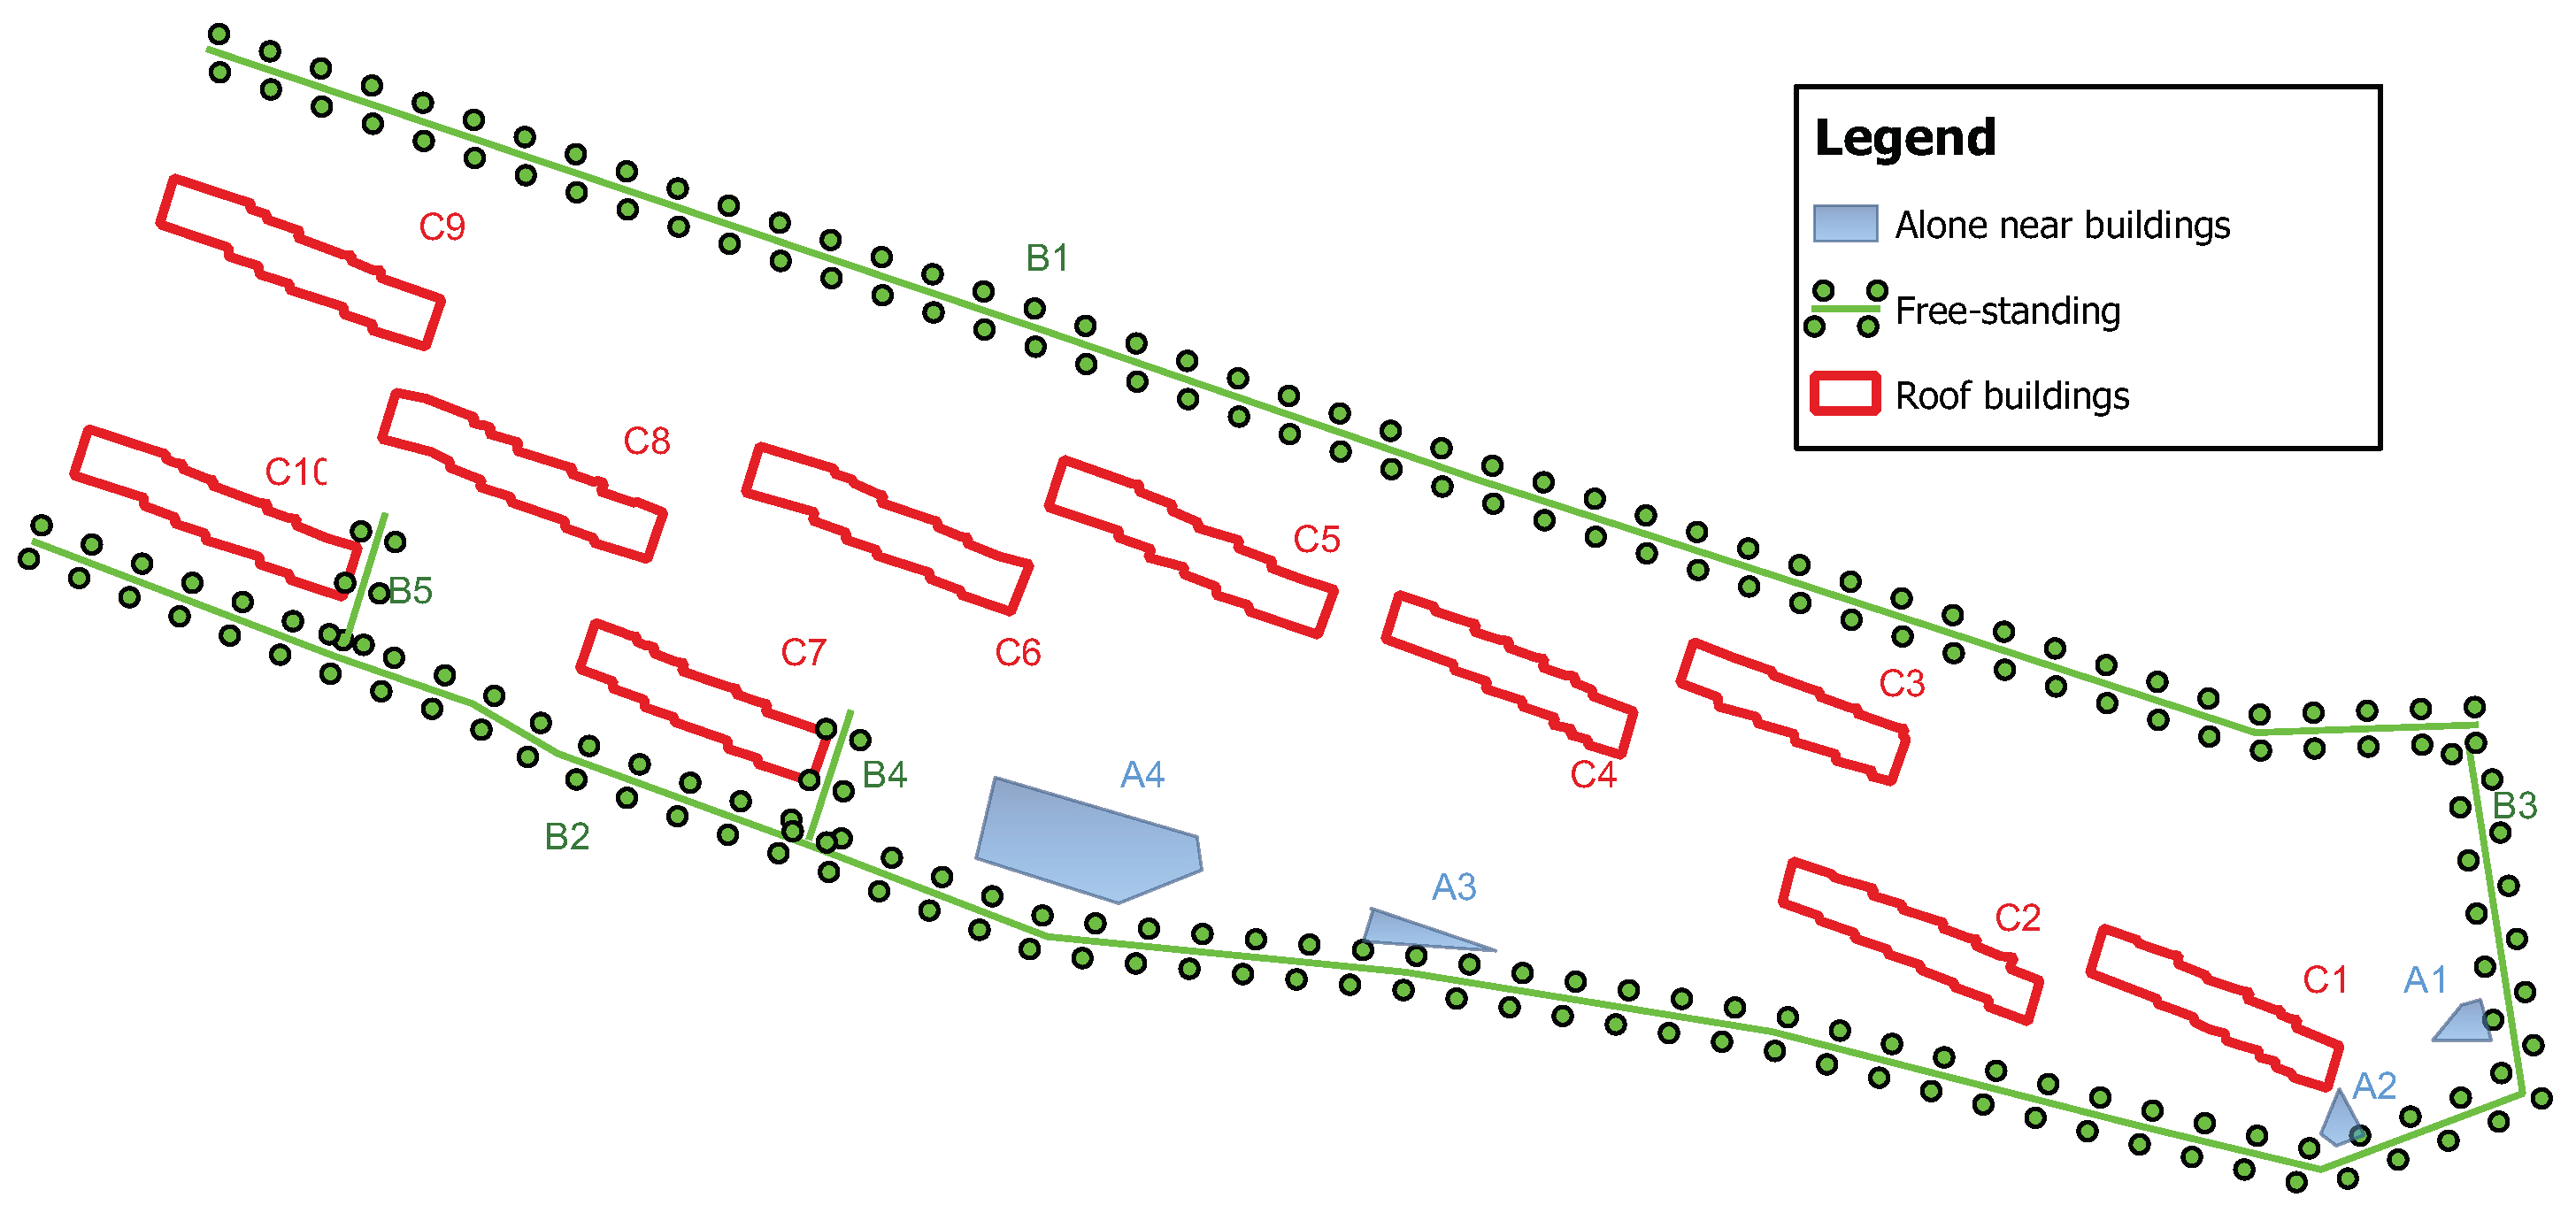
5. Case Study
- On the roofs of buildings: Ten possible alternatives, represented by polygons with a red border.
- Free standing: Five urban streets, represented by a green line and circle.
- Alone near buildings: Four alternatives, represented by blue polygons.
6. Results and Discussion
7. Conclusions
Author Contributions
Funding
Institutional Review Board Statement
Informed Consent Statement
Data Availability Statement
Conflicts of Interest
Abbreviations
| AEP | Annual energy production |
| BWTC | Bahrain World Trade Center |
| CFD | Computational fluid dynamics |
| HAWT | Horizontal-axis wind turbine |
| LCOE | Levelized cost of electricity |
| NREL | National Renewable Energy Laboratory |
| SWT | Small-scale wind turbines |
| UWE | Urban wind energy |
| VAWT | Vertical-axis wind turbine |
References
- Gil-García, I. Integración del Recurso Eólico Marino en los Sectores del Transporte y Climatización: Estudio de Transición Energética en la Costa Este de EEUU. Ph.D. Thesis, Polytechnic University of Cartagena, Cartagena, Spain, 2020. (In Spanish). [Google Scholar]
- World Energy Transitions Outlook: 1.5 °C Pathway; Technical Report; International Renewable Energy Agency (IRENA): Abu Dhabi, United Arab Emirates, 2021; Available online: https://www.irena.org/publications (accessed on 5 May 2022).
- Global Wind Report 2020; Technical Report; Global Wind Energy Council (GWEC): Brussels, Belgium, 2021; Available online: https://www.gwec.net (accessed on 5 May 2022).
- Rise of Renewables in Cities: Energy Solutions for the Urban Future; Technical Report; International Renewable Energy Agency (IRENA): Abu Dhabi, United Arab Emirates, 2021; Available online: https://www.irena.org/publications (accessed on 5 May 2022).
- Mithraratne, N. Roof-top wind turbines for microgeneration in urban houses in New Zealand. Energy Build. 2009, 41, 1013–1018. [Google Scholar] [CrossRef]
- Chong, W.; Naghavi, M.; Poh, S.; Mahlia, T.; Pan, K. Techno-economic analysis of a wind–solar hybrid renewable energy system with rainwater collection feature for urban high-rise application. Appl. Energy 2011, 88, 4067–4077. [Google Scholar] [CrossRef]
- Balduzzi, F.; Bianchini, A.; Carnevale, E.A.; Ferrari, L.; Magnani, S. Feasibility analysis of a Darrieus vertical-axis wind turbine installation in the rooftop of a building. Appl. Energy 2012, 97, 921–929. [Google Scholar] [CrossRef]
- Toja-Silva, F.; Colmenar-Santos, A.; Castro-Gil, M. Urban wind energy exploitation systems: Behaviour under multidirectional flow conditions—Opportunities and challenges. Renew. Sustain. Energy Rev. 2013, 24, 364–378. [Google Scholar] [CrossRef]
- Hsieh, C.M.; Fu, C.K. Evaluation of Locations for Small Wind Turbines in Costal Urban Areas Based on a Wind Energy Potential Map. Env. Model Assess 2013, 18, 593–604. [Google Scholar] [CrossRef]
- Millward-Hopkins, J.; Tomlin, A.; Ma, L.; Ingham, D.; Pourkashanian, M. Mapping the wind resource over UK cities. Renew. Energy 2013, 55, 202–211. [Google Scholar] [CrossRef] [Green Version]
- Romanić, D.; Rasouli, A.; Hangan, H. Wind Resource Assessment in Complex Urban Environment. Wind Eng. 2015, 39, 193–212. [Google Scholar] [CrossRef]
- Toja-Silva, F.; Peralta, C.; Lopez-Garcia, O.; Navarro, J.; Cruz, I. Roof region dependent wind potential assessment with different RANS turbulence models. J. Wind Eng. Ind. Aerodyn. 2015, 142, 258–271. [Google Scholar] [CrossRef] [Green Version]
- Wang, B.; Cot, L.; Adolphe, L.; Geoffroy, S.; Morchain, J. Estimation of wind energy over roof of two perpendicular buildings. Energy Build. 2015, 88, 57–67. [Google Scholar] [CrossRef]
- Al-Quraan, A.; Stathopoulos, T.; Pillay, P. Comparison of wind tunnel and on site measurements for urban wind energy estimation of potential yield. J. Wind Eng. Ind. Aerodyn. 2016, 158, 1–10. [Google Scholar] [CrossRef] [Green Version]
- Simões, T.; Estanqueiro, A. A new methodology for urban wind resource assessment. Renew. Energy 2016, 89, 598–605. [Google Scholar] [CrossRef] [Green Version]
- Yang, A.S.; Su, Y.M.; Wen, C.Y.; Juan, Y.H.; Wang, W.S.; Cheng, C.H. Estimation of wind power generation in dense urban area. Appl. Energy 2016, 171, 213–230. [Google Scholar] [CrossRef]
- Aquino, A.I.; Calautit, J.K.; Hughes, B.R. Integration of aero-elastic belt into the built environment for low-energy wind harnessing: Current status and a case study. Energy Convers. Manag. 2017, 149, 830–850. [Google Scholar] [CrossRef]
- Wang, B.; Cot, L.; Adolphe, L.; Geoffroy, S.; Sun, S. Cross indicator analysis between wind energy potential and urban morphology. Renew. Energy 2017, 113, 989–1006. [Google Scholar] [CrossRef]
- Dilimulati, A.; Stathopoulos, T.; Paraschivoiu, M. Wind turbine designs for urban applications: A case study of shrouded diffuser casing for turbines. J. Wind Eng. Ind. Aerodyn. 2018, 175, 179–192. [Google Scholar] [CrossRef] [Green Version]
- Kumar, R.; Raahemifar, K.; Fung, A.S. A critical review of vertical axis wind turbines for urban applications. Renew. Sustain. Energy Rev. 2018, 89, 281–291. [Google Scholar] [CrossRef]
- KC, A.; Whale, J.; Urmee, T. Urban wind conditions and small wind turbines in the built environment: A review. Renew. Energy 2019, 131, 268–283. [Google Scholar] [CrossRef]
- Gough, M.; Lotfi, M.; Castro, R.; Madhlopa, A.; Khan, A.; Catalão, J.P.S. Urban Wind Resource Assessment: A Case Study on Cape Town. Energies 2019, 12, 1479. [Google Scholar] [CrossRef] [Green Version]
- Ottosen, T.B.; Ketzel, M.; Skov, H.; Hertel, O.; Brandt, J.; Kakosimos, K.E. Micro-scale modelling of the urban wind speed for air pollution applications. Sci. Rep. 2019, 9, 14279. [Google Scholar] [CrossRef] [Green Version]
- Zhang, Y.; He, S.; Gu, Z.; Wei, N.; Yu, C.W.; Li, X.; Zhang, R.; Sun, X.; Zhou, D. Measurement, normalisation and mapping of urban-scale wind environment in Xi’an, China. Indoor Built Environ. 2019, 28, 1171–1180. [Google Scholar] [CrossRef]
- Droste, A.M.; Heusinkveld, B.G.; Fenner, D.; Steeneveld, G.J. Assessing the potential and application of crowdsourced urban wind data. R. Meteorol. Soc. 2020, 146, 2671–2688. [Google Scholar] [CrossRef]
- Liu, M.; Wang, X. Three-Dimensional Wind Field Construction and Wind Turbine Siting in an Urban Environment. Fluids 2020, 5, 137. [Google Scholar] [CrossRef]
- Wang, J.W.; Yang, H.J.; Kim, J.J. Wind speed estimation in urban areas based on the relationships between background wind speeds and morphological parameters. J. Wind Eng. Ind. Aerodyn. 2020, 205, 104324. [Google Scholar] [CrossRef]
- Ge, M.; Zhang, S.; Meng, H.; Ma, H. Study on interaction between the wind-turbine wake and the urban district model by large eddy simulation. Renew. Energy 2020, 157, 941–950. [Google Scholar] [CrossRef]
- Škvorc, P.; Kozmar, H. Wind energy harnessing on tall buildings in urban environments. Renew. Sustain. Energy Rev. 2021, 152, 111662. [Google Scholar] [CrossRef]
- Li, S.; Li, Y.; Yang, C.; Wang, Q.; Zhao, B.; Li, D.; Zhao, R.; Ren, T.; Zheng, X.; Gao, Z.; et al. Experimental investigation of solidity and other characteristics on dual vertical axis wind turbines in an urban environment. Energy Convers. Manag. 2021, 229, 113689. [Google Scholar] [CrossRef]
- Yu, J.; Li, M.; Stathopoulos, T.; Zhou, Q.; Yu, X. Urban exposure upstream fetch and its influence on the formulation of wind load provisions. Build. Environ. 2021, 203, 108072. [Google Scholar] [CrossRef]
- Xu, W.; Li, G.; Zheng, X.; Li, Y.; Li, S.; Zhang, C.; Wang, F. High-resolution numerical simulation of the performance of vertical axis wind turbines in urban area: Part I, wind turbines on the side of single building. Renew. Energy 2021, 177, 461–474. [Google Scholar] [CrossRef]
- Goal 11. Sustainable Cities and Communities. Available online: https://sdgs.un.org/es/goals/goal11/ (accessed on 5 May 2022).
- Goal 13. Climate Action. Available online: https://sdgs.un.org/es/goals/goal13/ (accessed on 5 May 2022).
- Sustain Recruitment. Available online: https://www.sustain-recruitment.com/ (accessed on 5 May 2022).
- Sustainable Architecture & Interior Design Firm (ZGF). Available online: https://www.zgf.com/ (accessed on 5 May 2022).
- Universidad Politécnica de Cartagena. Available online: https://www.upct.es/ (accessed on 5 May 2022).
- Beller, C. Urban Wind Energy. Ph.D. Thesis, Danmarks Tekniske Universitet, Lyngby, Denmark, Risø Nationallaboratoriet for Bæredygtig Energi, Roskilde, Denmark, 2011. [Google Scholar]
- Saeidi, D.; Sedaghat, A.; Alamdari, P.; Alemrajabi, A.A. Aerodynamic design and economical evaluation of site specific small vertical axis wind turbines. Appl. Energy 2013, 101, 765–775. [Google Scholar] [CrossRef]
- Fortis Wind Energy: Home. Available online: https://www.fortiswindenergy.com (accessed on 5 May 2022).
- Renugen. Small Wind Turbines. Available online: https://www.renugen.co.uk/small-wind-turbines (accessed on 5 May 2022).
- Wind Turbines Database. Available online: https://en.wind-turbine-models.com/turbines (accessed on 5 May 2022).
- Millward-Hopkins, J.; Tomlin, A.; Ma, L.; Ingham, D.; Pourkashanian, M. Assessing the potential of urban wind energy in a major UK city using an analytical model. Renew. Energy 2013, 60, 701–710. [Google Scholar] [CrossRef] [Green Version]
- Urban Wind Turbines Guidelines for Small Wind Turbines in the Built Environment. Available online: http://www.urbanwind.net/pdf/SMALL_WIND_TURBINES_GUIDE_final.pdf (accessed on 5 May 2022).
- Global Wind Atlas. Available online: http://https://globalwindatlas.info/ (accessed on 5 May 2022).
- Google Earth. Available online: https://earth.google.com/web (accessed on 5 May 2022).
- Skyscraperpage. Available online: http://www.skyscraperpage.com (accessed on 5 May 2022).
- World Buildings Emporis. Available online: http://www.emporis.com/buildings (accessed on 5 May 2022).
- National Renewable Energy Laboratory. Available online: https://maps.nrel.gov/wind-prospector (accessed on 5 May 2022).
- VORTEX. Available online: https://interface.vortexfdc.com/ (accessed on 5 May 2022).
- Carrillo, C.; Cidrás, J.; Díaz-Dorado, E.; Obando-Montaño, A.F. An Approach to Determine the Weibull Parameters for Wind Energy Analysis: The Case of Galicia (Spain). Energies 2014, 7, 2676–2700. [Google Scholar] [CrossRef] [Green Version]
- Intenational Electrotechinical Comission—IEC. Available online: http://www.iec.ch (accessed on 5 May 2022).
- Small Wind Certification Council. Available online: https://smallwindcertification.org/for-applicants/standards (accessed on 5 May 2022).
- MCS Certificate. Available online: https://mcscertified.com (accessed on 5 May 2022).
- Japan Small Wind Turbines Association. Available online: https://www.jswta.jp (accessed on 5 May 2022).
- Vortex FDC. Wind Resource Data for wind Farm Developments. 2020. Available online: https://vortexfdc.com/ (accessed on 5 May 2022).
- Vertical Axis Wind Turbines the QR6 Helical VAWT. 2022. Available online: https://www.quietrevolution.com/ (accessed on 5 May 2022).
- Small Wind Turbines Bornay. 2022. Available online: https://www.bornay.com/en/products/small-wind-turbines (accessed on 5 May 2022).
- Wind Turbines DS300 Etneo. 2022. Available online: https://www.etneo.com/turbina-ds3000/ (accessed on 5 May 2022).
- Ozier, K.R. Estimating the Power Produced by a Roof Mounted Wind Turbine in an Urban Setting. Ph.D. Thesis, Southern Illinois University, Carbondale, UL, USA, 2021. [Google Scholar]
- Georges, S.; Slaoui, F. Case Study of Hybrid Wind-Solar Power Systems for Street Lighting. In Proceedings of the 2011 21st International Conference on Systems Engineering, Las Vegas, NV, USA, 16–18 August 2011; pp. 82–85. [Google Scholar] [CrossRef]
- Wadi, M.; Shobole, A.; Tur, M.R.; Baysal, M. Smart hybrid wind-solar street lighting system fuzzy based approach: Case study Istanbul-Turkey. In Proceedings of the 2018 6th International Istanbul Smart Grids and Cities Congress and Fair (ICSG), Istanbul, Turkey, 25–26 April 2018; pp. 71–75. [Google Scholar] [CrossRef]
- Xu, X.; Wang, W.; Fan, P.P. Finite Element Analysis of a Wind-Solar Hybrid Powered Street Light. Appl. Mech. Mater. 2013, 365, 201–205. [Google Scholar] [CrossRef]
- Sharif Zulkepele, S.A.; Saud Al–Humairi, S.N.; Chandrasekaran, J.S.; Ahmad, A.S.; Daud, R.J. Towards A Clean Energy: Design A Wind-Solar Hybrid Power Generation System for Highway Streetlights. In Proceedings of the 2021 IEEE 9th Conference on Systems, Process and Control (ICSPC 2021), Malacca, Malaysia, 10–11 December 2021; pp. 98–102. [Google Scholar] [CrossRef]
- Greenhouse Gases Equivalencies Calculator—Calculations and References. 2022. Available online: https://www.epa.gov/energy/greenhouse-gases-equivalencies-calculator-calculations-and-references#wind (accessed on 5 May 2022).


| Barriers | |||||
|---|---|---|---|---|---|
| Ref. | Year | Technological | Socio-Environmental | Wind Resource Analysis | Economic |
| [5] | 2009 | X | X | ||
| [6] | 2011 | X | X | X | |
| [7] | 2012 | X | |||
| [8] | X | X | |||
| [9] | 2013 | X | |||
| [10] | X | ||||
| [11] | X | ||||
| [12] | 2015 | X | |||
| [13] | X | ||||
| [14] | X | ||||
| [15] | 2016 | X | |||
| [16] | X | ||||
| [17] | 2017 | X | X | X | |
| [18] | X | ||||
| [19] | 2018 | X | |||
| [20] | X | ||||
| [21] | 2019 | X | |||
| [22] | X | X | X | ||
| [23] | X | ||||
| [24] | X | ||||
| [25] | 2020 | X | |||
| [26] | X | X | |||
| [27] | X | ||||
| [28] | X | X | |||
| [29] | 2021 | X | X | ||
| [30] | X | X | |||
| [31] | X | ||||
| [32] | X | X | |||
| Turbine Type | Advantages | Disadvantages |
|---|---|---|
| HAWTs | Economic | Dependent on wind direction |
| Efficient | Does not cope well with buffeting | |
| Commercial variety | ||
| Proven technology in high-power wind farms | ||
| Lift VAWTs | At a given wind speed, | More sensitive to turbulence |
| it is equal in efficiency to HAWT | than drag-based VAWTS | |
| Independent of wind direction and turbulence | ||
| Less vibration | ||
| Shocks and little noise | ||
| Drag VAWTs | Proven product | Not efficient |
| Less acoustic emission | Comparatively uneconomic | |
| Independent of wind direction and turbulence | ||
| Less vibration | ||
| Potential benefit from turbulence |
| Alternatives | Nearby Obstacles | Height (m) | Horizontal Distance (m) | Distance to Connection (m) |
|---|---|---|---|---|
| A | Yes | 3 | 20 | <14 |
| A | No | <12 | ||
| A | Yes | 15 | 108 | <25 |
| A | Yes | 3 | 48 | <52 |
| Alternatives | Nearby Obstacles | Height (m) | Horizontal Distance (m) |
|---|---|---|---|
| B | Yes | 3–5 | 10–12 |
| B | Yes | 15 | 40–45 |
| B | Yes | 3 | 70–75 |
| B and B are roads or paths that are close to the predominant orientation of the wind. | |||
| Alternatives | Nearby Obstacles | Height (m) | Horizontal Distance (m) | Height Building (m) | Roof Area (m) |
|---|---|---|---|---|---|
| C | Yes | 3–5 | <5 | 15 | 495 |
| C | Yes | 15 | 6 | 15 | 495 |
| C | Yes | 3–5 | 14 | 15 | 495 |
| C | Yes | 15 | <5 | 15 | 495 |
| C | Yes | <3 | 15 | 15 | 495 |
| C | Yes | 15 | <10 | 15 | 495 |
| C | Yes | 3 | <60 | 15 | 495 |
| C | Yes | 15 | <15 | 15 | 495 |
| C | Yes | <3 | <5 | 15 | 495 |
| C | Yes | 15 | <50 | 15 | 495 |
| Feature | QR6 | Bornay | Turby | DS300 |
|---|---|---|---|---|
| Type | VAWTs | HAWTs | VAWTs | Hybrid (VAWTs+solar) |
| Nominal Power (kW) | 6–7 | 6 | 2.5 | 0.3 |
| Start Wind Speed (m/s) | 1.5 | 3.5 | 3.5 | 3 |
| Stop Wind Speed (m/s) | 20 | 14 | 14 | 15.5 |
| Number of blades | 2 | 3 | 3 | 3 |
| Life expectancy | 30 years + | 20 years + | 20 years + | 20 years + |
| Standards | MCS, ISO 9001 | ISO 9001 | IEC61400-2, NEN 1014 | IEC61400-2 |
| AEP (kWh) | |||
|---|---|---|---|
| Wind Speed Bins (m/s) | Frequency (%) | QR6-A, A, A | Bornay-A |
| 0–1.5 | 4.812 | ||
| 1.5–2 | 4.415 | 193.38 | 0 |
| 2–3 | 10.913 | 1338.37 | 0 |
| 3–4 | 13.48 | 3071.12 | 1181.20 |
| 4–5 | 13.61 | 4292.05 | 1788.35 |
| 5–6 | 13.927 | 5246.02 | 2440.01 |
| 6–7 | 9.635 | 4051.32 | 2447.68 |
| 7–8 | 7.835 | 3637.63 | 2608.12 |
| 8–9 | 5.174 | 2674.13 | 1994.27 |
| 9–10 | 6.103 | 3207.74 | 2673.11 |
| 10–11 | 4.643 | 2562.38 | 2236.99 |
| 11–12 | 3.521 | 2004.86 | 1850.64 |
| 12–13 | 1.257 | 737.76 | 660.68 |
| 13–14 | 0.532 | 321.57 | 279.62 |
| 14–16 | 0.136 | 83.39 | 71.48 |
| 100 | 33,421.71 | 20,232.15 | |
| AEP (kWh) C–C | |||
|---|---|---|---|
| Wind Speed Bins (m/s) | Frequency (%) | QR6 | Turby |
| 0–1.5 | 4.37 | 0 | 0 |
| 1.5–2 | 3.35 | 146.77 | 0 |
| 1.5–3 | 10.48 | 1285.76 | 0 |
| 3–4 | 12.04 | 2741.32 | 52.72 |
| 4–5 | 13.88 | 4377.51 | 243.19 |
| 5–6 | 12.72 | 4789.49 | 278.46 |
| 6–7 | 10.08 | 4237.18 | 353.09 |
| 7–8 | 8.40 | 3900.42 | 441.56 |
| 8–9 | 5.88 | 3036.95 | 386.05 |
| 9–10 | 5.63 | 2957.55 | 492.93 |
| 10–11 | 5.09 | 2811.83 | 557.90 |
| 11–12 | 4.21 | 2398.31 | 553.46 |
| 12–13 | 2.37 | 1388.65 | 414.52 |
| 13–14 | 0.98 | 595.37 | 215.72 |
| 14–15 | 0.41 | 250.18 | 0 |
| 15–16 | 0.05 | 27.60 | 0 |
| 16–17 | 0.07 | 41.70 | 0 |
| 100 | 34,986.59 | 3989.60 | |
| Wind Speed Bins (m/s) | Frequency (%) | AEP (kWh) B, B |
|---|---|---|
| 0–3 | 24 | 0 |
| 3–4 | 15.25 | 20.04 |
| 4–5 | 15.34 | 33.60 |
| 5–6 | 12.28 | 42.84 |
| 6–7 | 9.44 | 41.36 |
| 7–8 | 6.59 | 43.30 |
| 8–9 | 6.54 | 57.33 |
| 9–10 | 5.26 | 69.18 |
| 10–11 | 3.52 | 61.69 |
| 11–12 | 1.2 | 26.28 |
| 12–13 | 0.42 | 12.85 |
| 13–14 | 0.08 | 2.25 |
| 14–15 | 0.04 | 1.97 |
| 100 | 412.68 |
Publisher’s Note: MDPI stays neutral with regard to jurisdictional claims in published maps and institutional affiliations. |
© 2022 by the authors. Licensee MDPI, Basel, Switzerland. This article is an open access article distributed under the terms and conditions of the Creative Commons Attribution (CC BY) license (https://creativecommons.org/licenses/by/4.0/).
Share and Cite
Gil-García, I.C.; García-Cascales, M.S.; Molina-García, A. Urban Wind: An Alternative for Sustainable Cities. Energies 2022, 15, 4759. https://doi.org/10.3390/en15134759
Gil-García IC, García-Cascales MS, Molina-García A. Urban Wind: An Alternative for Sustainable Cities. Energies. 2022; 15(13):4759. https://doi.org/10.3390/en15134759
Chicago/Turabian StyleGil-García, Isabel Cristina, María Socorro García-Cascales, and Angel Molina-García. 2022. "Urban Wind: An Alternative for Sustainable Cities" Energies 15, no. 13: 4759. https://doi.org/10.3390/en15134759
APA StyleGil-García, I. C., García-Cascales, M. S., & Molina-García, A. (2022). Urban Wind: An Alternative for Sustainable Cities. Energies, 15(13), 4759. https://doi.org/10.3390/en15134759