Article

Variable Weight-Projection Gray Target Evaluation Model of Degree of Protection of Protective Layer Mining

1
Institute of Mechanics and Engineering, Liaoning Technical University, Fuxin 123000, China
2
Institute of Mining, Liaoning Technical University, Fuxin 123000, China
3
Liaoning Academy of Mineral Resources Development and Utilization Technical and Equipment Research Institute, Liaoning Technical University, Fuxin 123000, China
*
Author to whom correspondence should be addressed.
Energies 2022, 15(13), 4654; https://doi.org/10.3390/en15134654
Submission received: 22 May 2022 / Revised: 14 June 2022 / Accepted: 22 June 2022 / Published: 25 June 2022
(This article belongs to the Topic Mining Safety and Sustainability)

Abstract

:
In order to quantitatively evaluate the degree of protection in protective layer mining and provide guidance for the design of a secondary outburst elimination scheme, a variable weight-projection gray target dynamic evaluation model for the effectiveness of protective layer mining is established. The improved order relation analysis method was used to determine the subjective weight of each index toward the decision-making goal based on numerical diversity characteristics, and the initial fixed-weight calculation for mixed multi-attribute metrics was processed through the degree of index action. The variable weight function was used to dynamically adjust the fixed weight through the penalty and incentive index methods. Four indexes (gas content, gas pressure, coal seam permeability coefficient, and expansion deformation) were selected, the outburst elimination and anti-reflection were taken as the guide, and the critical value of each index for eliminating burst and the critical value of pressure relief were taken as the positive and negative bullseyes. Based on the variable weight-projection gray target decision model, the distance between the two target centers of each scheme was calculated; at the same time, the variable weight vector changed dynamically with the evaluation scheme to achieve the dynamic quantitative evaluation of the degree of protection. Additionally, compared with the calculation results of fixed weights, it was found that the variable weight-projection bullseye distance can more accurately reflect the dynamic control effect of differences in numerical combinations of multi-attribute indexes in different decision schemes based on the degree of protection of protective layer mining. Taking a mine in PingMei as the engineering background, Ding protected the Wu area, and the degree of protection in the Wu group coal seam reached 116.29%, eliminating the outburst risk of the coal seam. The Wu protected the Ji group coal seam, with the degree of outburst risk in the Ji group being reduced by 14.27, and the Ding + Wu group protected the Ji group coal seam, with the degree of outburst risk of the Ji group being reduced by 20.71%, but not eliminated. The evaluation model quantifies the degree of protection of protective layer mining, and provides a theoretical basis for further assessing whether the working face should strengthen the enhancing permeability or whether it needs to be used in tandem with high-strength outburst elimination methods.

1. Introduction

The outburst risk must be eliminated before the mining of a dangerous coal seam. However, protective layer mining is the most economical and effective regional measure to prevent coal and gas outburst [1,2] (pp. 21–36). The purpose of protective layer mining is to relieve the pressure in the coal seam and increase the permeability, and the gas extraction method is used to control the gas and prevent dangerous outbursts with a protective layer [3,4]. At present, the basis for judging the mining effect of the protective layer is mainly the provisions of the (AQ 1050–2008) Technical Specification for Protective Layer Mining [5] (pp. 2–3). The specification states that the index for judging the protection effect of the protected layer includes gas pressure, gas content, and gas extraction volume. The specification gives the specific value of the inspection index for determining whether to eliminate the burst, but does not specify the degree of pressure relief protection derived from the protective layer mining. At present, most of the research on evaluating the protection effect of protective layer mining only examines whether the outburst is eliminated [6]; however, there is currently no in-depth analysis of the situation in which the protected layer does not eliminate the outburst, but has a certain protective effect, quantifying that the degree of protection can accurately guide the formulation of secondary outburst elimination plans, improve outburst coal seam governance efficiency, and save production costs.
In terms of research on the evaluation of protective effects, Chen [7] and Kang [8] analyzed the effectiveness of upper protective layer mining by monitoring the gas pressure, the coal seam relative expansion and deformation, the gas flow, and the gas permeability changes in the protected coal seam. Yuan [9] proposed a technology to quickly and accurately measure the gas content in coal seams on site, and based on the gas content of the protected coal seam to determine the coal seam outburst elimination range of the protective layer. Liu [10] used the analytic hierarchy process to establish a reliability evaluation system for protective layer mining and proposed 28 evaluation indexes. Du [11] calculated the reliability of the gas content, expansion deformation, and gas pressure in the protected layer, obtained the index weight by fuzzy AHP algorithm, put forward a comprehensive quantitative index of the mining pressure relief effect, and judged the pressure relief effects and boundaries.
At the same time, when the protection effect evaluation index value for the protection layer is obtained, the evaluation index value is no longer a single exact number due to the incompleteness of coal mine site information acquisition and the particularity of the index; the index value may be a mixed number of exact numbers, interval numbers, or triangular fuzzy numbers. In order to solve the scheme evaluation of various data form indexes, SUN [12] realized the measurement of exact numbers, interval numbers, and triangular fuzzy numbers by constructing an interval attribute framework. Ma [13] proposed a mixed-attribute generalized gray target decision-making method, and used the vector method to deal with the mixed multi-attribute problem of deterministic and indeterminate numbers. Ma [14,15] used the two-element connection number to form a vector to deal with attributes and weights, in which both attributes contribute to the decision problem of mixed-interval grey numbers. The above methods can provide a reference for the treatment of index values in evaluating the degree of protection.
Due to differences in geological conditions, gas content and gas pressure are different in the same coal seam. When testing the same working face or the same coal seam, the data present a certain discreteness. This feature must be taken into account in the analysis of the outburst elimination range of protective layer mining [4]. When assigning index weights, traditional evaluation methods do not consider the impact of different index values on evaluation goals. In fact, the index value takes different values in different schemes and cannot be calculated according to the fixed weight [16]. Aiming to address the problem that a change in the index value will cause a dynamic change in the evaluation results, and that the fixed weight is not applicable in the evaluation, Wang [17] proposed the variable weight theory. Based on the variable weight theory, Wu [18] perfected the method for determining the threshold value of variable weight interval and weight adjustment parameters, and used the variable weight function to solve the evaluation problem of water inrush from the coal seam floor. Xu [19] proposed dynamic evaluation from the perspective of time, and proposed the dynamic evaluation method of grey target theory. This method can compare the evaluation values and ranking results of each scheme at each moment and overall, in a certain period of time. In addition, there are methods that combine subjective weights and objective weights for decision evaluation [20], and that can evaluate the synergy of coal and gas co-mining through fuzzy mathematics (objective) and analytic hierarchy process (subjective) -combined weighting. Chen [21] fused AHP (subjective) and the entropy weight method (objective) and built an optimization model based on the Lagrange function. The weight of the index combination was obtained, and the coal mine rock burst evaluation model was constructed. The above methods can provide a reference for the treatment of weights when evaluating the degree of protection.
The existing quantitative evaluation for the degree of protection in the protected coal seam that has not been eliminated remains to be solved, and the subjective fixed weights of the index cannot take into account the control effect of the various changes in the mixed multi-attribute index value on the protective effect. To address these issues, this paper proposes a dynamic evaluation model of protective layer mining effectiveness based on a variable weight-projection gray target. Aimed at the different types of indexes, the calculation of the mixed multi-attribute index is realized by using the index action degree, the improved order relation analysis method is used to calculate the subjective constant weight of the index, and the variable weight function is used to dynamically correct the subjective constant weight of the index. Two evaluation objectives of outburst elimination and increased permeability are designed, and the variable weight theory and the gray target theory are integrated, in order to eliminate the critical value of outburst risk and the critical value of increased permeability as the bullseye. Field data were selected before and after the protective layer mining of a mine in Pingdingshan, and the measurement for the degree of protection in protective layer mining was conducted according to the established variable weight-projection gray target model.

2. Quantitative Evaluation Index for Protection Degree of Protective Layer Mining

The aim of protective layer mining is to eliminate the danger of a coal seam outburst, relieve the pressure and increase the permeability of a coal seam, and promote gas drainage. Therefore, the four indexes of gas content, gas pressure, coal seam permeability coefficient, and expansion deformation were selected to establish a systematic evaluation index system.

2.1. Coal and Gas Outburst Risk Evaluation Index

The “Technical Specifications for Mining of Protective Layers” [5] (pp. 2–3) requires that the gas content or gas pressure in the protected layer be reduced to below the value of the initial outburst depth. If there are no data, the gas content of the coal seam must be reduced to below 8 m3/t, or the gas pressure reduced to below 0.74 MPa, in order for it to be judged that the purpose of eliminating bursts has been achieved.
Coal seam gas content and pressure are important indexes for evaluating the risk of coal seam outburst. After the protected layer is depressurized, the gas content and pressure decrease significantly. According to the “Detailed Rules for Prevention and Control of Coal and Gas Outburst” [22] (pp. 22–23), for the elimination of the outburst risk, the coal seam gas content/pressure needs to be less than 8 m3/t or 0.74 MPa.

2.2. Evaluation Index of Coal Seam Pressure Relief and Permeability Enhancement Effect

2.2.1. Coal Seam Expansion Value

During the protective layer mining, a goaf is generated, and during the movement of the roof and floor coal strata, due to the change in stress, the adjacent upper and lower coal seams will undergo vertical deformation. In the pressure relief area, the coal seam will expand and deform, and the deformation also reflects the stress change in the coal seam. When the coal seam expands, it indicates that pressure in the coal seam is relieved, and the larger the expansion value, the better the pressure relief. According to the “Regulations on the Prevention and Control of Coal and Gas Outbursts”, the area where the maximum expansion value in the protected layer reaches 3‰ is the effective pressure relief range.

2.2.2. Coal Seam Permeability Coefficient

The coal seam permeability coefficient is a sign of the difficulty in coal seam gas flow, and it is also one of the important indexes in the degree of pressure relief. The classification of the coal seam permeability coefficient is shown in Table 1 [1]. The permeability of the coal seam is closely related to the stress state and fracture development characteristics in the coal seam. Under the action of the protective layer, the gas pressure in the protected layer reduction, expansion deformation and fracture development in the protected layer jointly promote a significant increase in the permeability; the permeability coefficient of the coal seam can increase from 100 to 1000-times. According to statistical analysis, when the relative value in the protected layer can reach more than 3‰, the permeability coefficient in the protected layer can increase by more than 300-times.

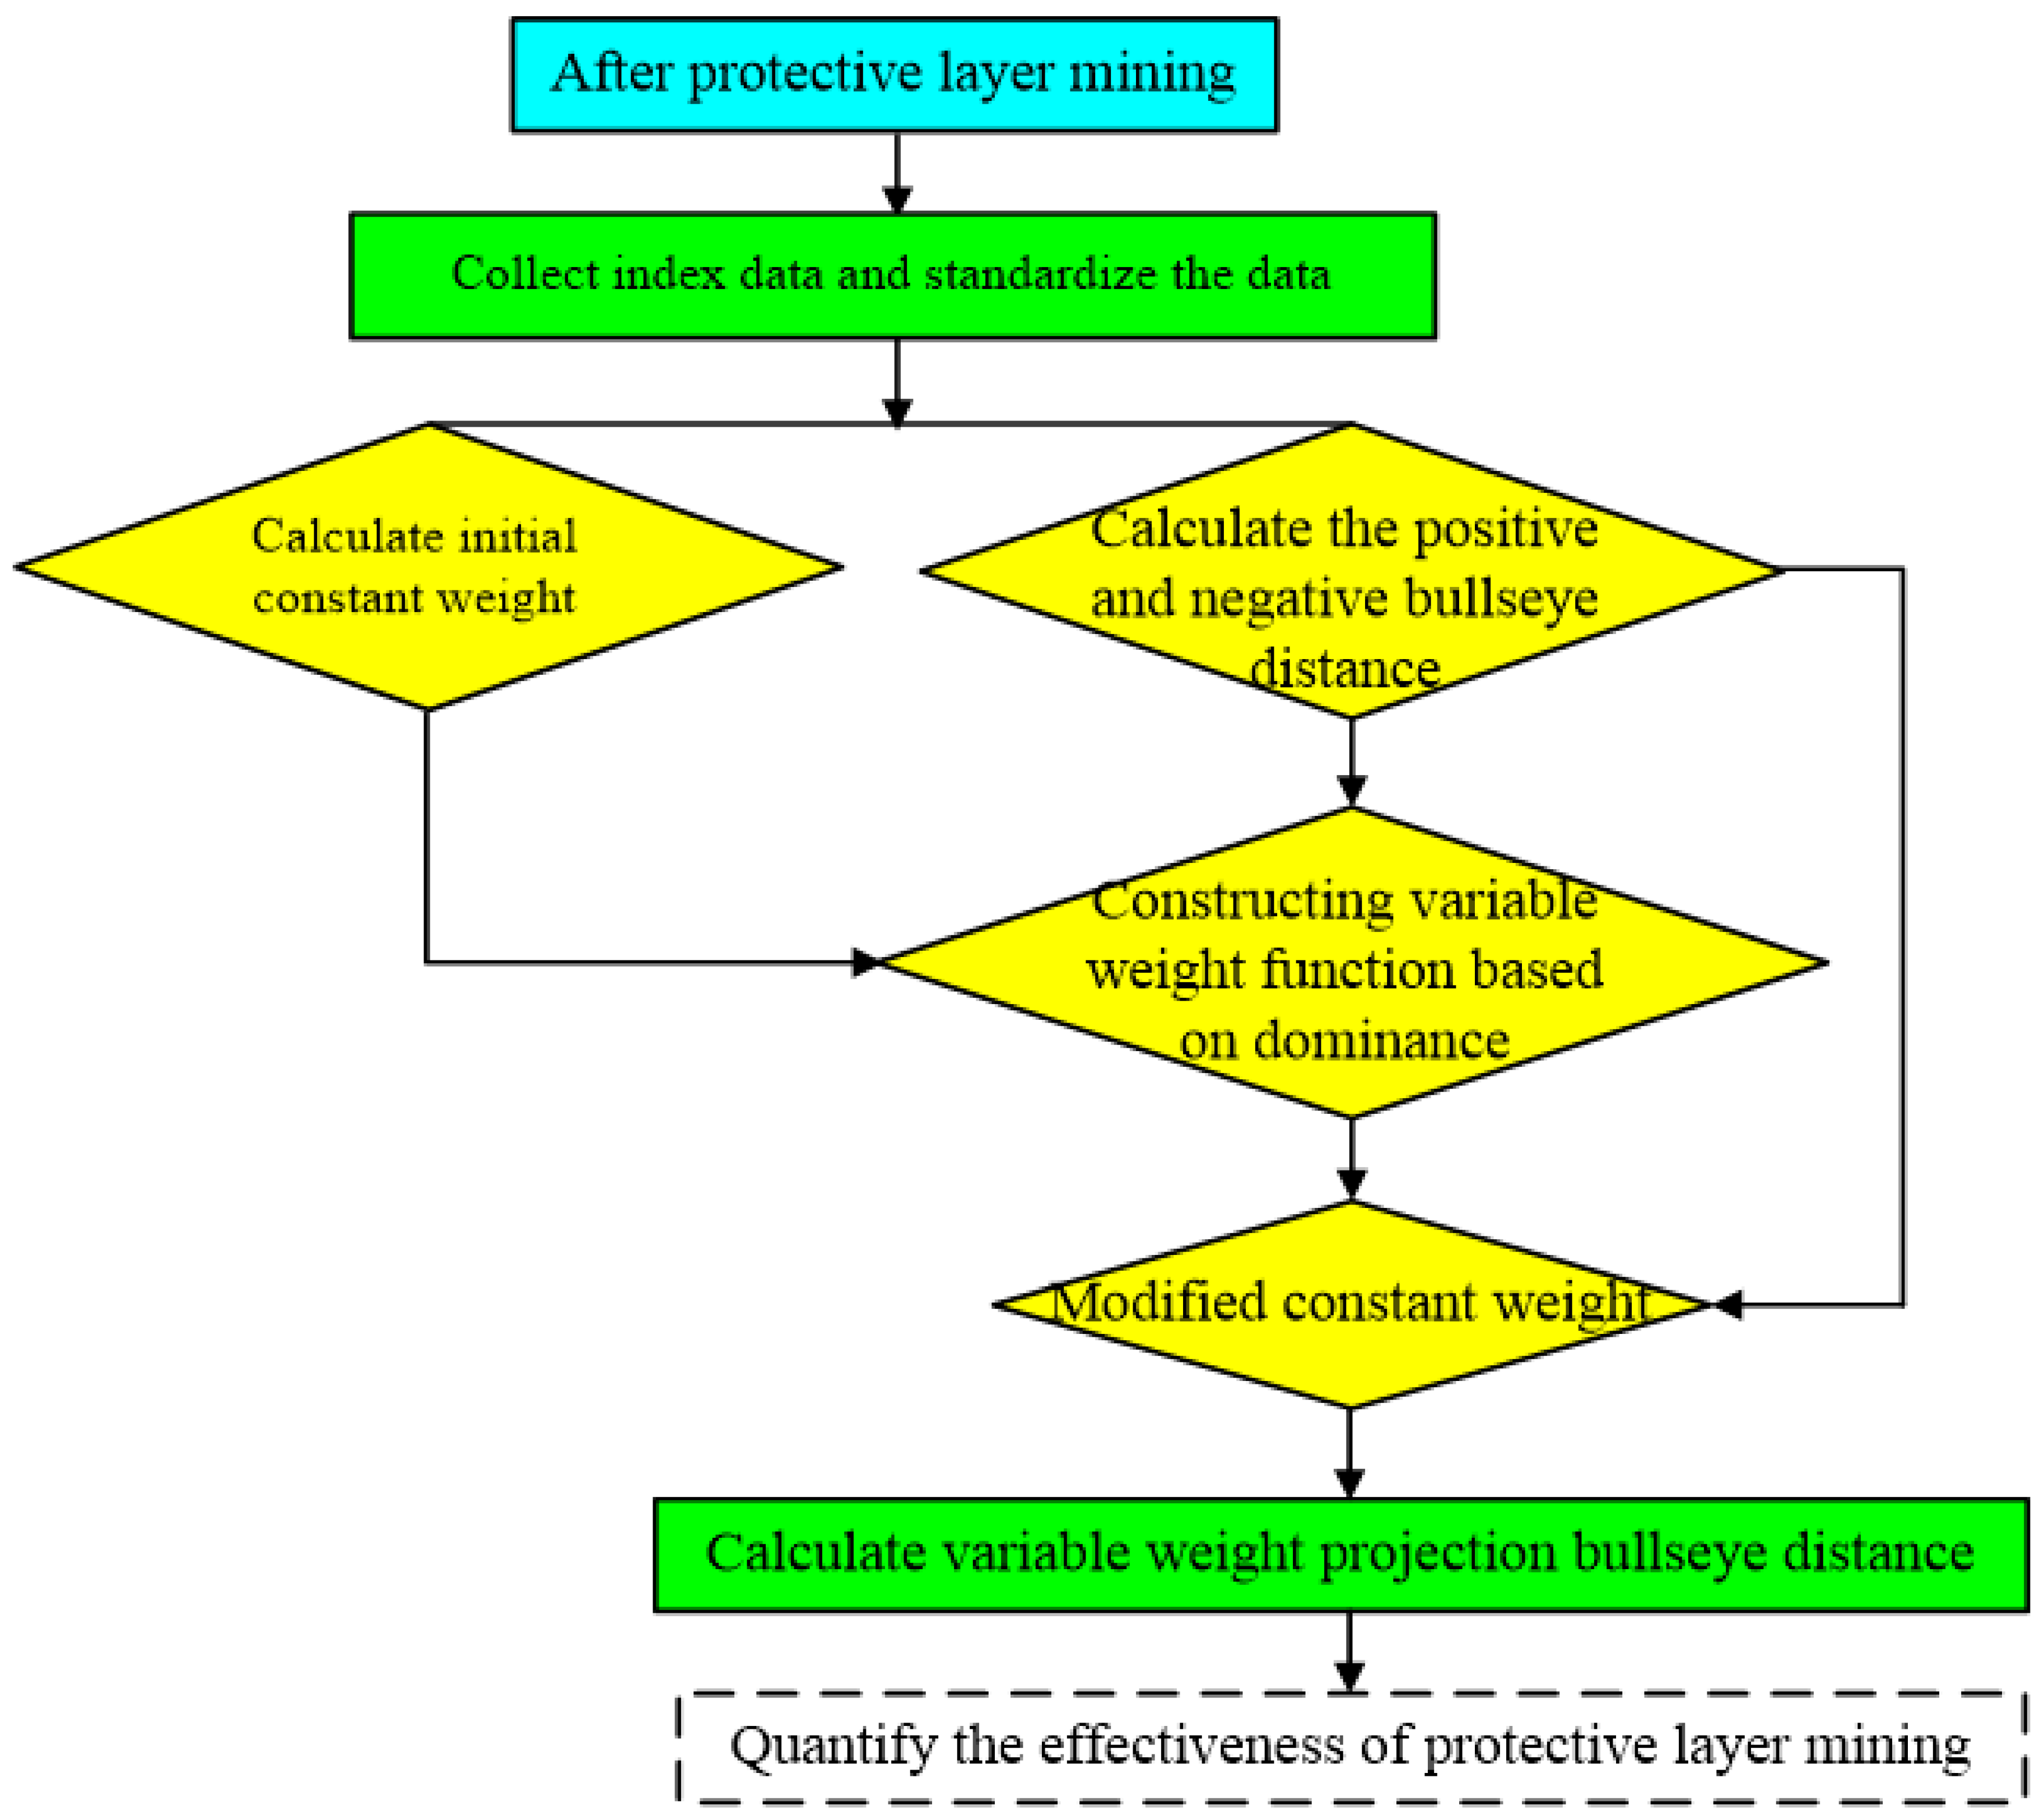
3. Dynamic Performance Evaluation Method of Protective Layer Mining Based on Variable Weight-Projection Gray Target

In order to solve the problem of inconsistency in the form of index evaluation values, and the difficulty in comparing the relative importance, the improved order relation analysis method (GI method) was used to determine the initial constant weight of the index, and then the index’s advantage information and disadvantage information were synthesized. Referring to the grey target theory, taking the relative distance between the index evaluation value and the positive and negative bullseye as a variable, a new dominance function was defined. Combined with variable weight theory, a local state variable weight vector was constructed based on the punishment–reward mechanism, and the initial constant weight of the index was dynamically revised to solve the variable weight of the index. Finally, the projection gray target method was used, and the variable weight projection bullseye distance was used as the metric to determine the comprehensive efficiency and ranking of the evaluation objects [7].

3.1. Data Normalization

It was assumed that set E = (e1, e2, …, em) consists of m objects, which are waiting to be evaluated, and that m refers to the quantity. The set X = (x1, x2, …, xn) consists of n indexes, which are under the same criterion layer; n refers to the quantity. The values of each index form an evaluation matrix V = (vij)mxn. Among them, vij can be given in three forms: exact number, interval number, and triangular fuzzy number. The data form of the same index in different evaluation schemes is the same. Because the dimensions of each index are different, they need to be standardized [16]. The index normalization matrix is G = (gij)mxn, gij represents the standardized evaluation value of the index xj under the evaluation scheme ei, and Xb and XC represent the subscript sets of benefit-type and cost-type index in X, respectively.
The exact number vij = vij can be normalized to:
g i j = { v i j / v max j , j X b 1 v i j / v max j , j X c
where v max j = max { v i j | i = 1 , 2 , , m } .
The interval number v i j = [ v i j L , v i j U ] can be normalized to:
g i j = { [ v i j L / v max j U , v i j U / v max j U ] , j X b [ 1 v i j U / v max j U , 1 v i j L / v max j U ] , j X c
where v max j U = max { v i j U | i = 1 , 2 , , m } .
The triangular fuzzy number v i j = ( v i j L , v i j M , v i j U ) can be normalized to:
g i j = { [ v i j L v max j U , v i j M v max j U , v i j U v max j U ] , j X b [ 1 v i j L v max j U , 1 v i j M v max j U , 1 v i j U v max j U ] , j X c
where v max j U = max { v i j | i = 1 , 2 , , m } .

3.2. Measurement of Index Relative Distance

Definition 1. 
Assuming that α = [ α L , α U ] , β = [ β L , β U ] is two interval numbers, the D ( α , β ) distance between α and β is calculated as
D ( α , β ) = 1 2 ( α L β L ) 2 + ( α U β U ) 2
When α L = α U , β L = β U , α and β are exact numbers, the distance is
D ( α , β ) = | α β |
Definition 2. 
Assuming that α = [ α L , α M , α U ] and β = [ β L , β M , β U ] is two triangular fuzzy numbers, the D ( α , β ) distance between α and β is calculated as
D ( α , β ) = 1 3 ( α L β L ) 2 + ( α M β M ) 2 + ( α U β U ) 2

3.3. Subjective Constant Weight Determined

The GI method (improved order relation analysis method) is a subjective weighting assignment method, which is based on the ranking of the degree of influence in the index on decision-making goals given by experts, and which calculates the relative importance of the index. The index action degree is introduced to solve the fixed subjective weight determination of different index forms [16].
A total of l experts are invited to rank the importance of n index affecting the evaluation target.
The Spearman coefficients of ranking given by the ith and vth experts are:
ρ i v = 1 [ 6 j = 1 n ( x ^ i j x ^ v j ) 2 ] / [ n ( n 2 1 ) ]
where x ^ i j and x ^ v j represent the ranking of the jth index given by the ith and vth experts, respectively. When the coefficient is greater than or equal to 0.5, the consistency test is passed; otherwise, the expert is eliminated.
The qualified ranking is converted into the corresponding score Gij, and the average score G ¯ j is calculated as follows:
G ¯ j = 1 l i = 1 l G i j = 1 l i = 1 l ( n x ^ i j + 1 )
Ranking the index secondary based on average score, the relative distance of the index is calculated according to Section 3.2, and the sum of the distances used to represent the degree of action sj; that is,
s j = i = 1 m k = 1 m D ( g i j , g k j )
If the means of the ranking scores of the two indexes are the same, the index with the largest effect will be ranked first. The ratio for the importance of adjacent index x j 1 and x j is
r j = { s j 1 / s j , ( j > 1 , s j 1 s j ) 1 , ( j > 1 , s j 1 < s j )
The combined weight ω j 0 of the nth index is calculated according to r j , and ω j 0 is a fixed subjective weight, expressed as
ω j 0 = ( 1 + j = 2 n i = j n r i ) 1

3.4. Establish Variable Weight Function to Correct Fixed Subjective Weight

The variable weight function is used to dynamically adjust the fixed subjective weight of the index according to the specific value of the evaluation program index. When the dominance of an index is very low, even if the subjective weight of the index is relatively large, the overall effect of the scheme will be correspondingly reduced, and the index weight will be penalized. When an index has a high degree of dominance, even if its subjective weight is small, the overall effect of the scheme will be correspondingly improved, and the index weight will be encouraged. The penalty and incentive of the dynamic variable weight should correspond to the size of the constant weight, and the incentive amplitude of the variable weight function is smaller than the penalty amplitude.

3.4.1. Positive and Negative Bullseye

g i j is the standardized evaluation value of the index. The mixed grey targets of different data form indexes can be expressed as follows:
Positive bullseye:
{ max { g i j | j C 1 , i = 1 , 2 , , m } max { g i j L + g i j U 2 | j C 2 , i = 1 , 2 , , m } max { g i j M | j C 3 , i = 1 , 2 , , m }
Negative bullseye:
{ min { g i j | j C 1 , i = 1 , 2 , , m } min { g i j L + g i j U 2 | j C 2 , i = 1 , 2 , , m } min { g i j M | j C 3 , i = 1 , 2 , , m }
C1, C2 and C3 are the subscript sets of exact number, interval number, and triangular fuzzy number. Gas pressure and gas content are cost-type indexes; that is, the smaller the index value, the better. The coal seam permeability coefficient and expansion value are benefit-type indexes, and the larger the index value, the better. Among them, the gas pressure and gas content select the critical value of the outburst index in the “Detailed Rules for Prevention and Control of Coal and Gas Outburst” as the negative bullseye, and the critical value of the index formulated by each coal mine is the positive bullseye. The expansion value of the coal seam is 0 before the mining of the protective layer, which is used as the negative bullseye in this index, and the critical expansion value of 3‰ that needs to be reached in the protective layer mining is taken as the positive bullseye. The permeability coefficient takes the initial value of 0.1 for normal draw as the negative bullseye, and the intermediate value of 5 for normal draw as the positive bullseye. The selection of positive and negative bullseyes is shown in Table 2.

3.4.2. Index Dominance Calculation

The dominance of xj under the evaluation object ei is Rij, which is expressed as
R i j = 1 exp ( β d i j + ( g i j , a j + ) d i j ( g i j , a j ) d i j ± )
where d i j + ( g i j , a j + ) , d i j ( g i j , a j ) and d i j ± represent the distance between the index evaluation value and the positive bullseye, the distance between the index evaluation value and the negative bullseye, and the distance between the positive and negative bullseye, respectively, calculated according to the indexes’ relative distance in Section 3.2. β is the dominance adjustment coefficient, which takes a positive value; the larger the value, the greater the adjustment degree of the index dominance.
The matrix for the dominance of each index under each evaluation scheme can be given as R = [ R ( g i j ) ] m × n .

3.4.3. Variable Weight Function

The index weights are dynamically adjusted with the index status of each scheme. The penalty–incentive local state variable weight function based on index dominance is as follows:
S i j ( R i j ) = { ( 1 / e ) m v j 0 ( R i j R L ) , R i j < R L 1 , R L R i j R U e δ m v j 0 ( R i j R U ) , R i j > R U
where, according to the index dominance, the indexes are clustered into three categories. R L and R U denote the critical values of punishment and incentive, respectively. The value is determined by the K-means algorithm [18].
Combining the constant weight calculation, Equation (11), and the dominance degree calculation, Equation (14), the variable weight in the jth index of the ith evaluation scheme is obtained, which is expressed as
ω i j = ω j 0 S i j ( R i j ) j = 1 n [ ω j 0 S i j ( R i j ) ]

3.5. Weighted Projection Grey Target Decision Method to Determine the Advantages and Disadvantages of the Scheme

From the variable weight ω i j and the positive and negative bullseye distances, the weighted positive bullseye distance λi+, the weighted negative bullseye distance λi, and the average distance between the positive bullseye and the negative bullseye λ0 are calculated for each evaluation object [16]; that is:
{ λ i + = j = 1 n d i j + ω i j λ i = j = 1 n d i j ω i j λ 0 = 1 n j = 1 n d i j ±
The projected bullseye distance in the ith evaluation scheme is:
η i = λ i λ i + = ( λ i ) 2 ( λ i + ) 2 λ 0
The calculation flow chart for the variable weight projection target center distance is shown in Figure 1.

4. Dynamic Evaluation of Degree of Protection by the Protective Layer

4.1. Evaluation Area Overview

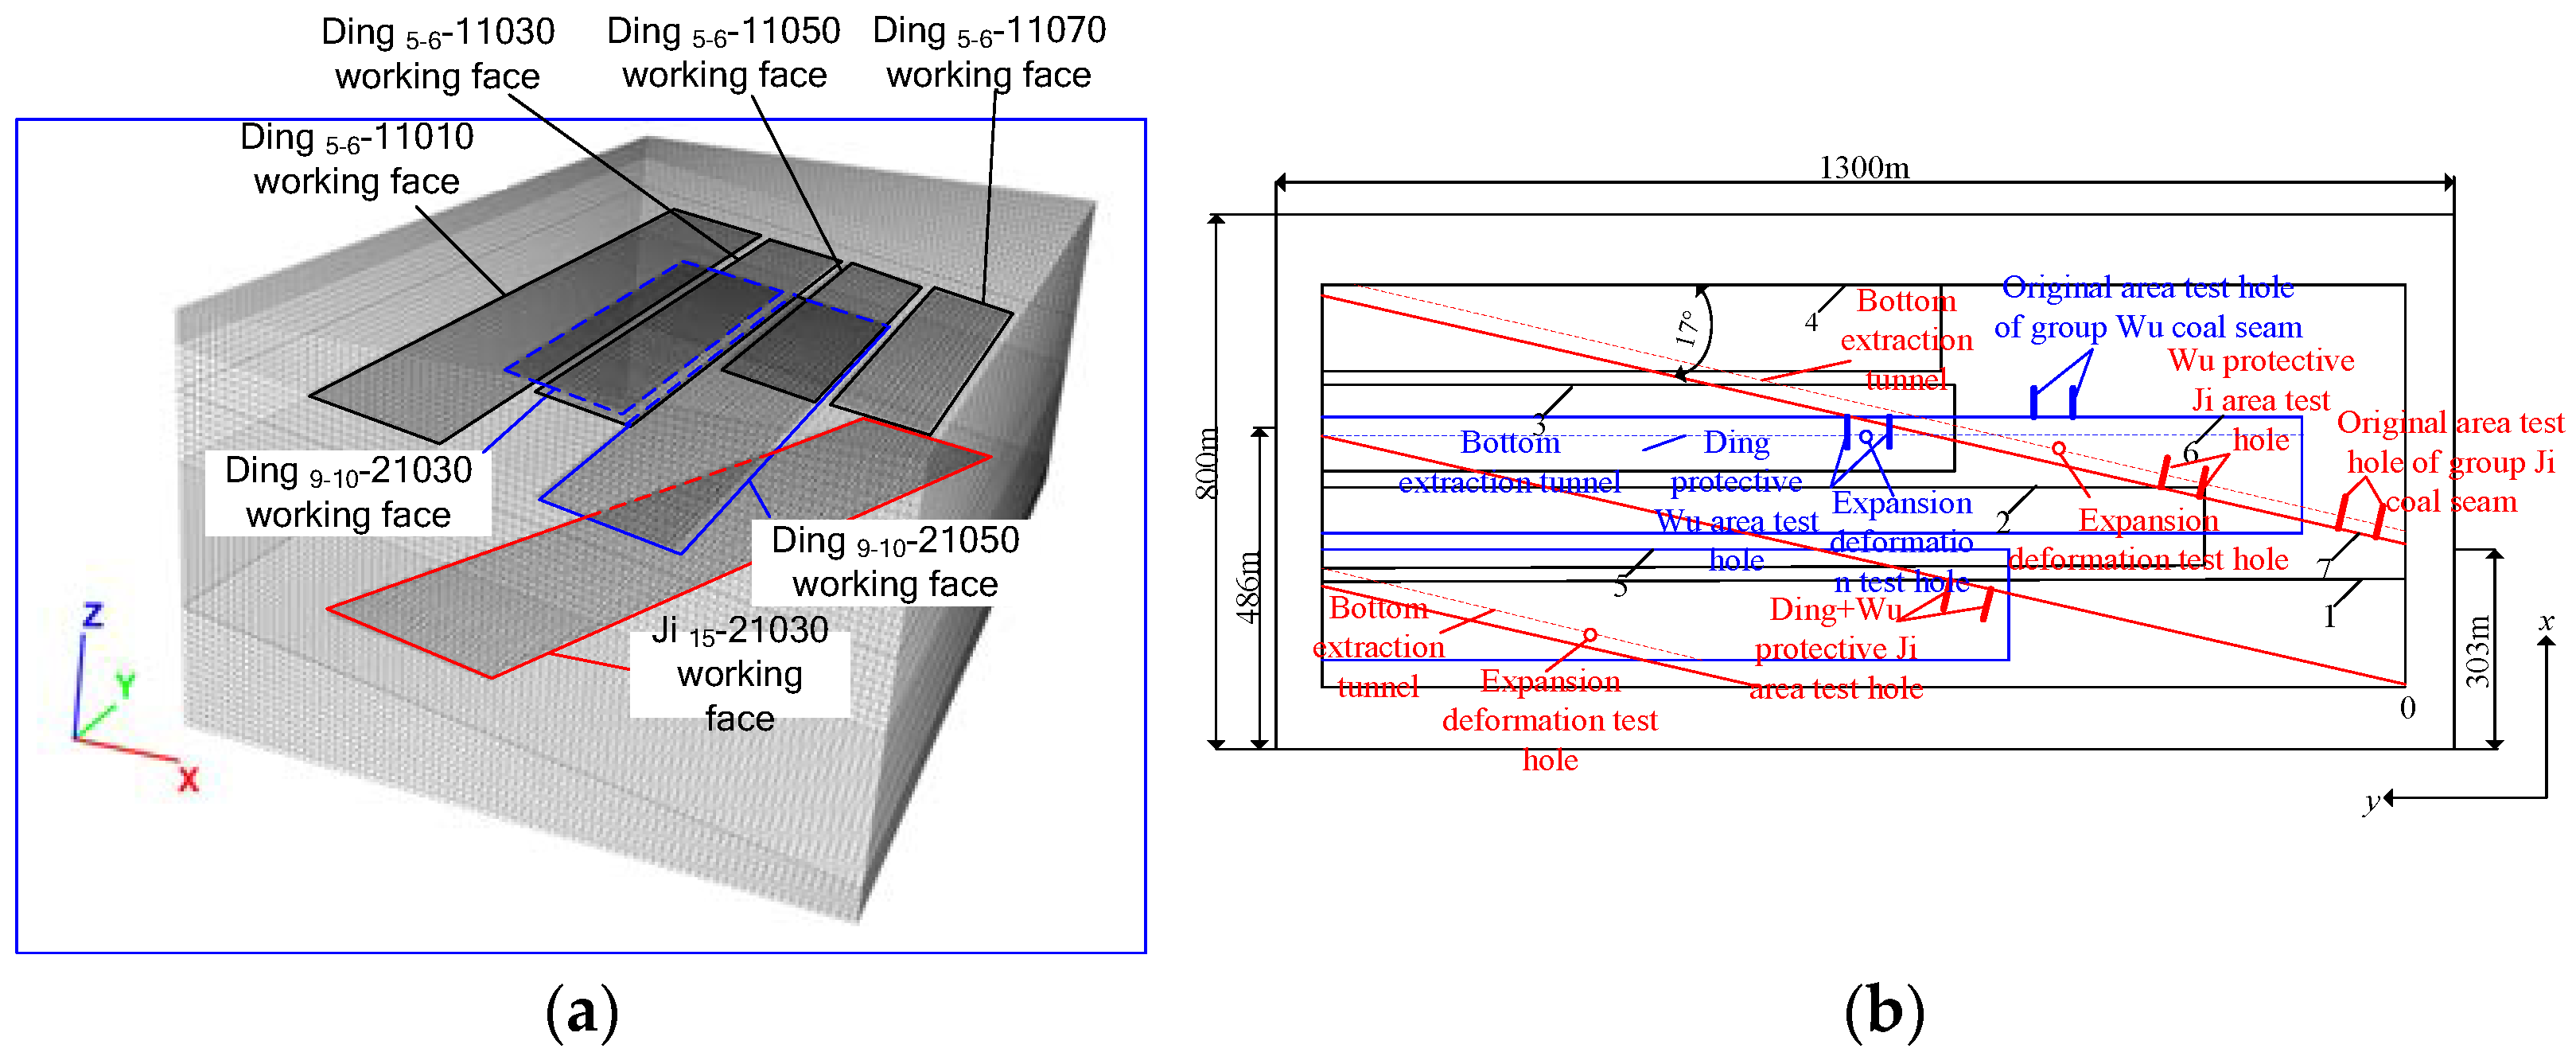
4.1.1. Spatial Distribution Relationship of Working Face

The main coal seams in a mine of the Pingmei Group are the coal seams in group Ding, group Wu, and group Ji, in ascending order of buried depth. Protective layer mining is the preferred method for outburst prevention measures in this mining area. The location of the studied working face in the evaluation area is shown in Figure 2. Due to the staggered layout of the working face, there are mainly three types of protective seam mining in the current stage of mining: group Ding coal seam mining to protect the group Wu coal seam, group Wu coal seam mining to protect the group Ji coal seam, and group Ding + Wu coal seam mining to protect the group Ji coal seam.

4.1.2. Parameter Test Scheme of Evaluation Area

According to various protection forms in the layout of the working face, the test points are selected, as shown in Figure 2b. Among them, the gas content W, gas pressure P, and coal seam permeability coefficient λ are measured through the short-line measuring holes shown in the figure. During the measurement, the coal seam measuring holes are drilled along the short-line direction. First, the coal powder is taken to test the gas content, and then the hole is enlarged to observe the gas pressure. After the pressure observation, the valve is opened to release the gas. The gas permeability coefficient is calculated by testing the emission law. The expansion deformation is measured through the circle measuring hole in the figure. During the measurement, the deep base point displacement meter is constructed from the bottom extraction roadway in the working face of the coal seam Wu and Ji, and the expansion deformation is obtained by observing the displacement changes before and after mining.

4.1.3. Experimental Observation Data

  • Gas content
Two test holes are designed for each protection condition and the maximum test result is taken based on safety considerations. The gas content test results are shown in Table 3.
2.
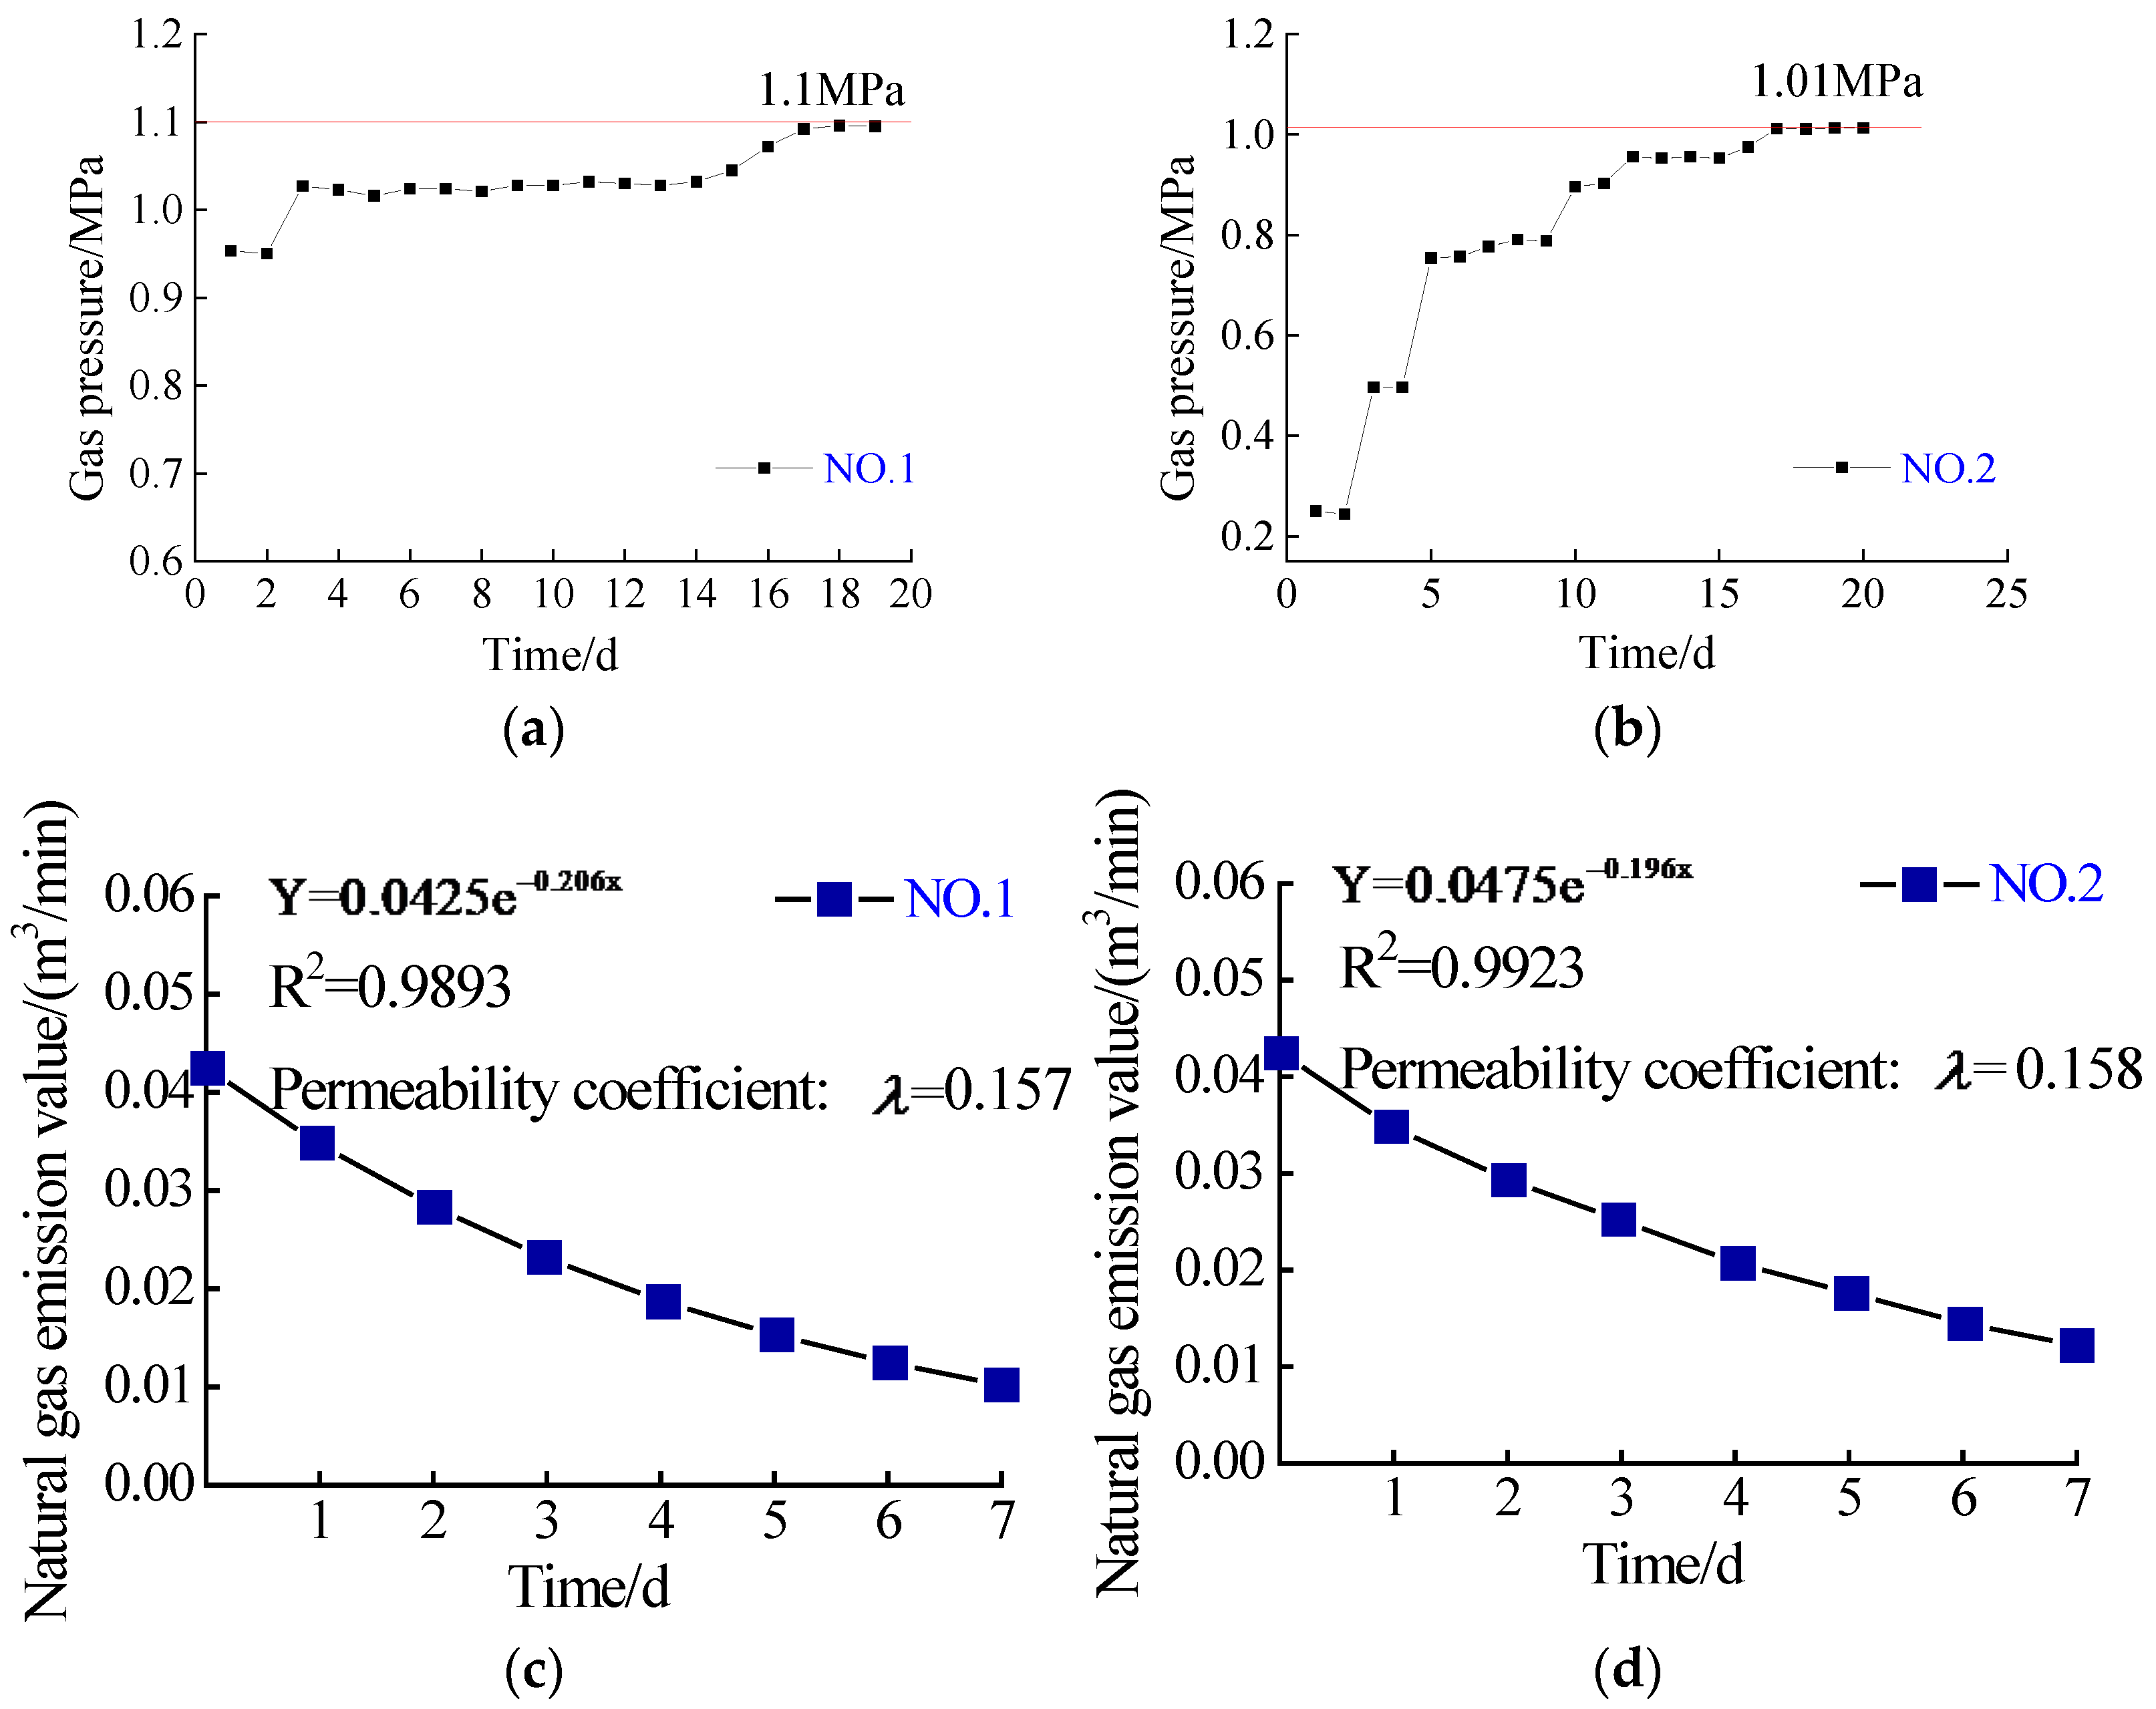
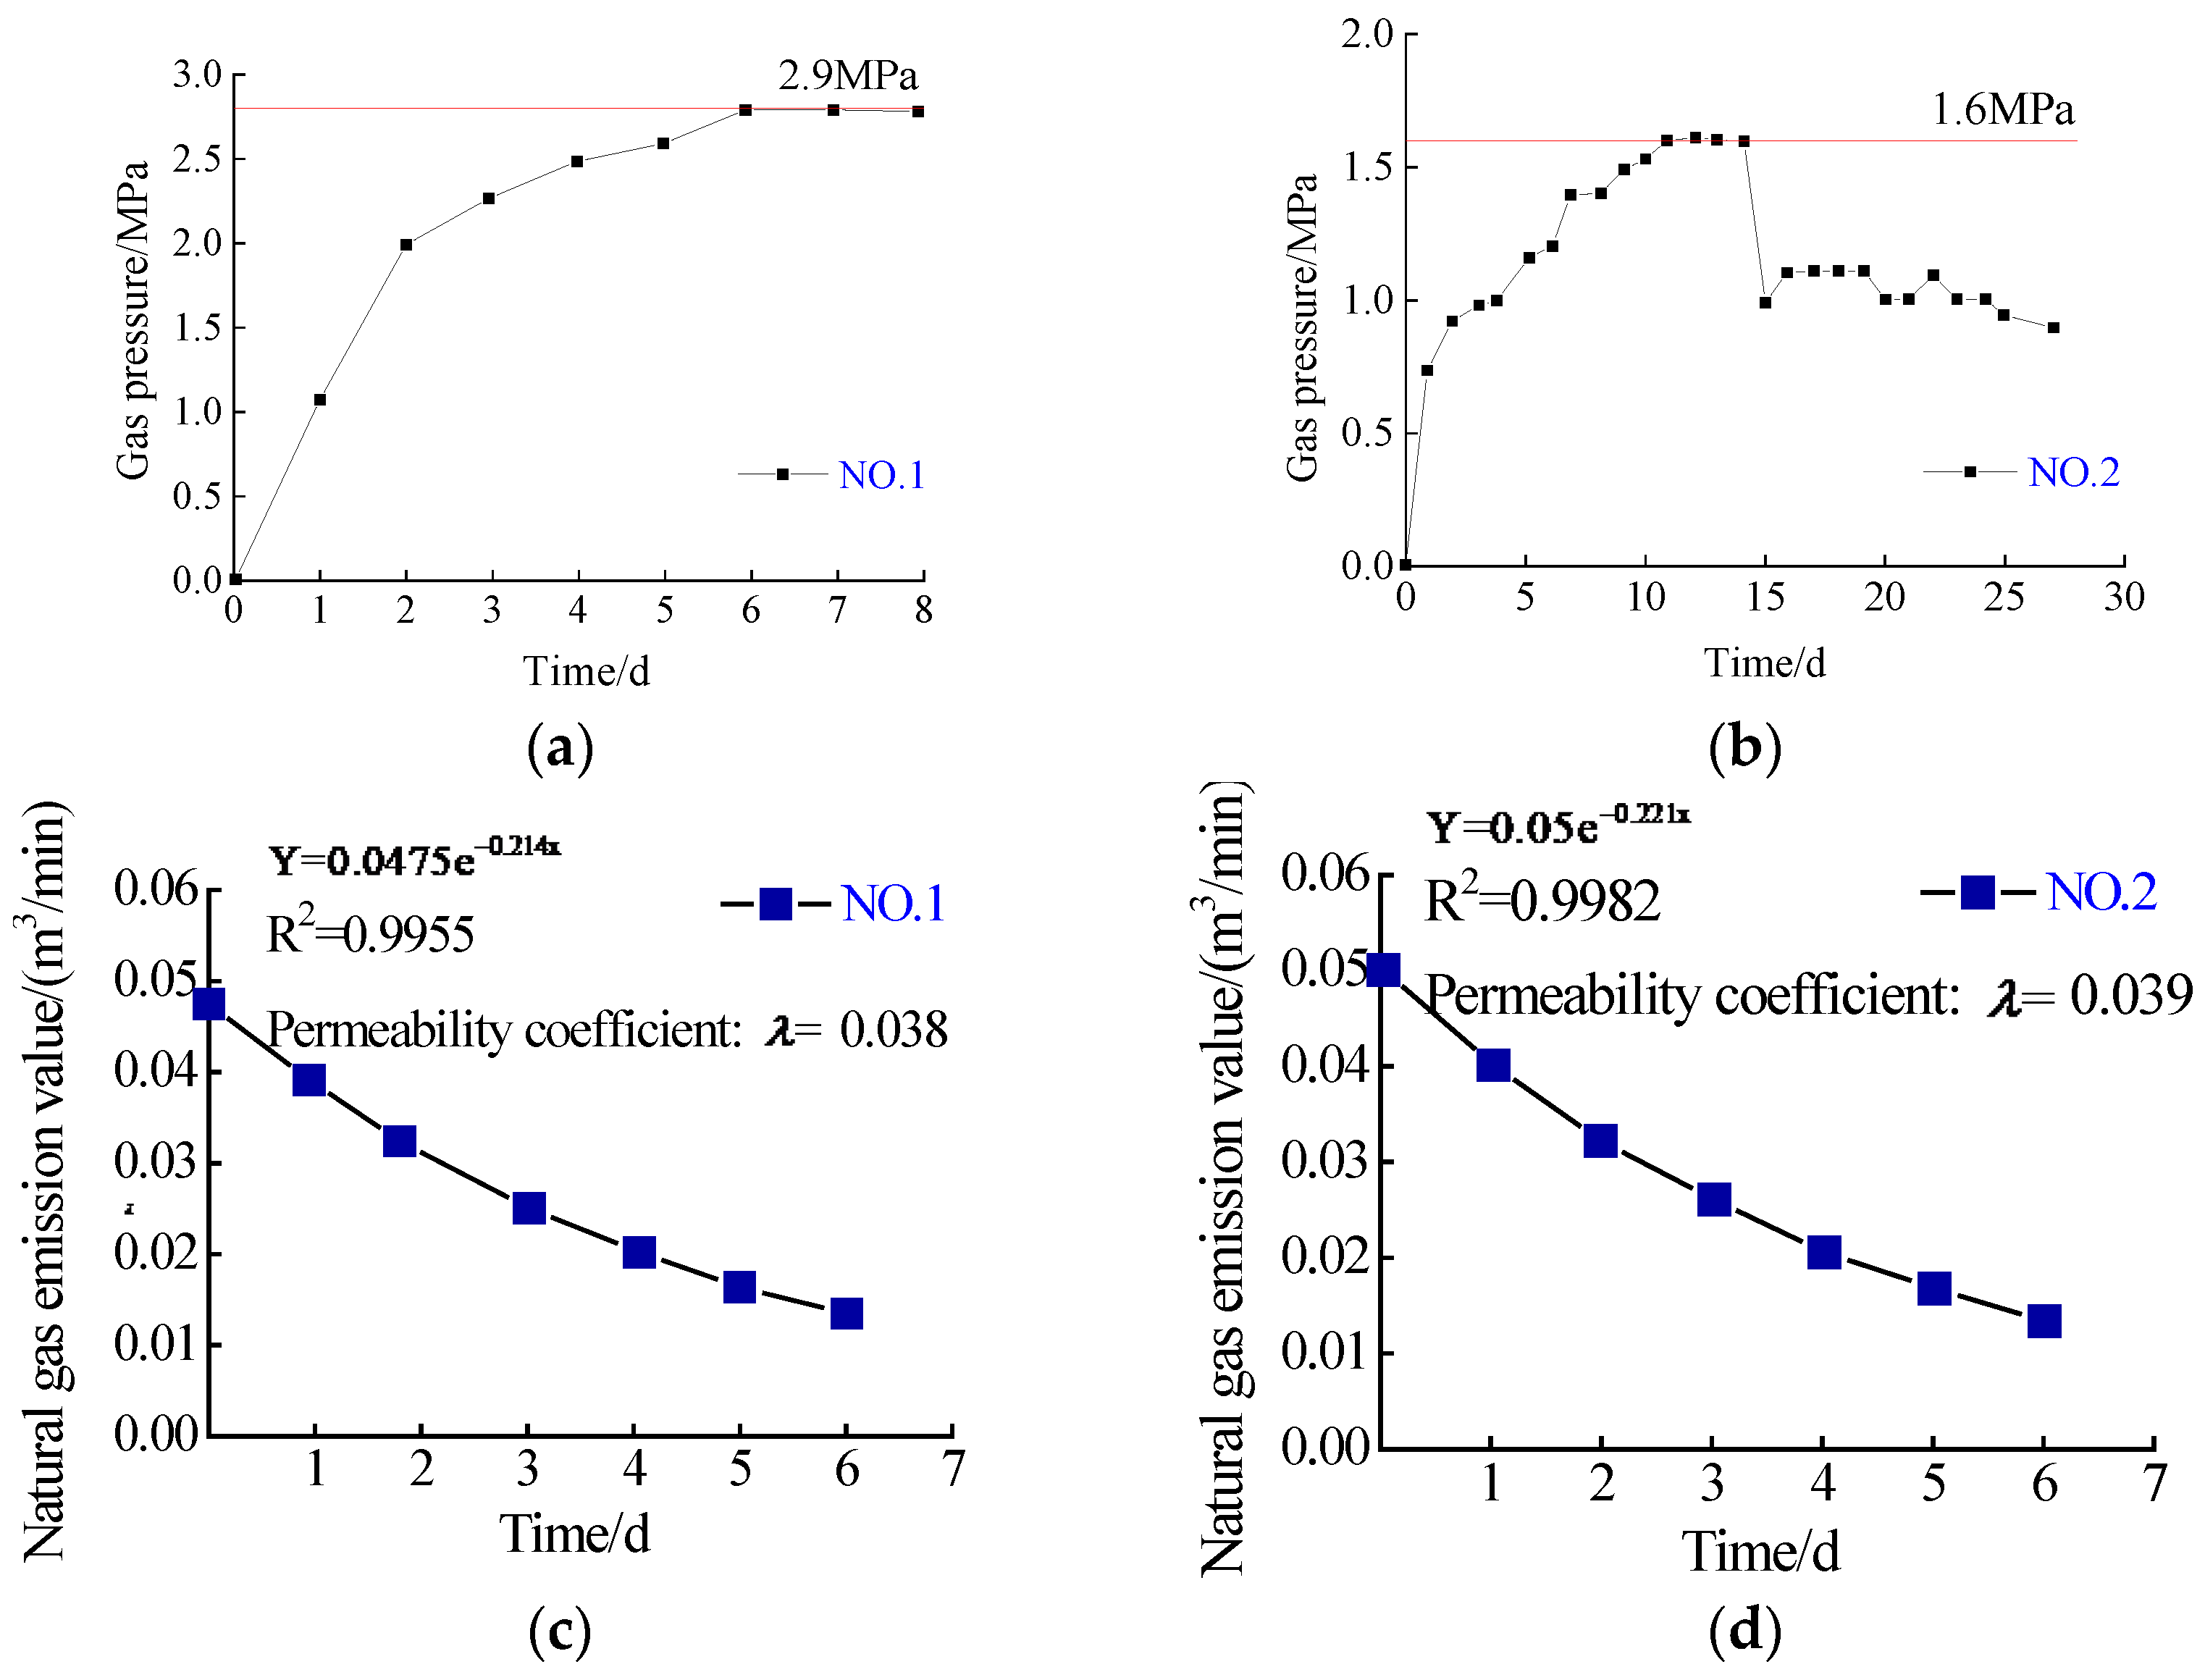
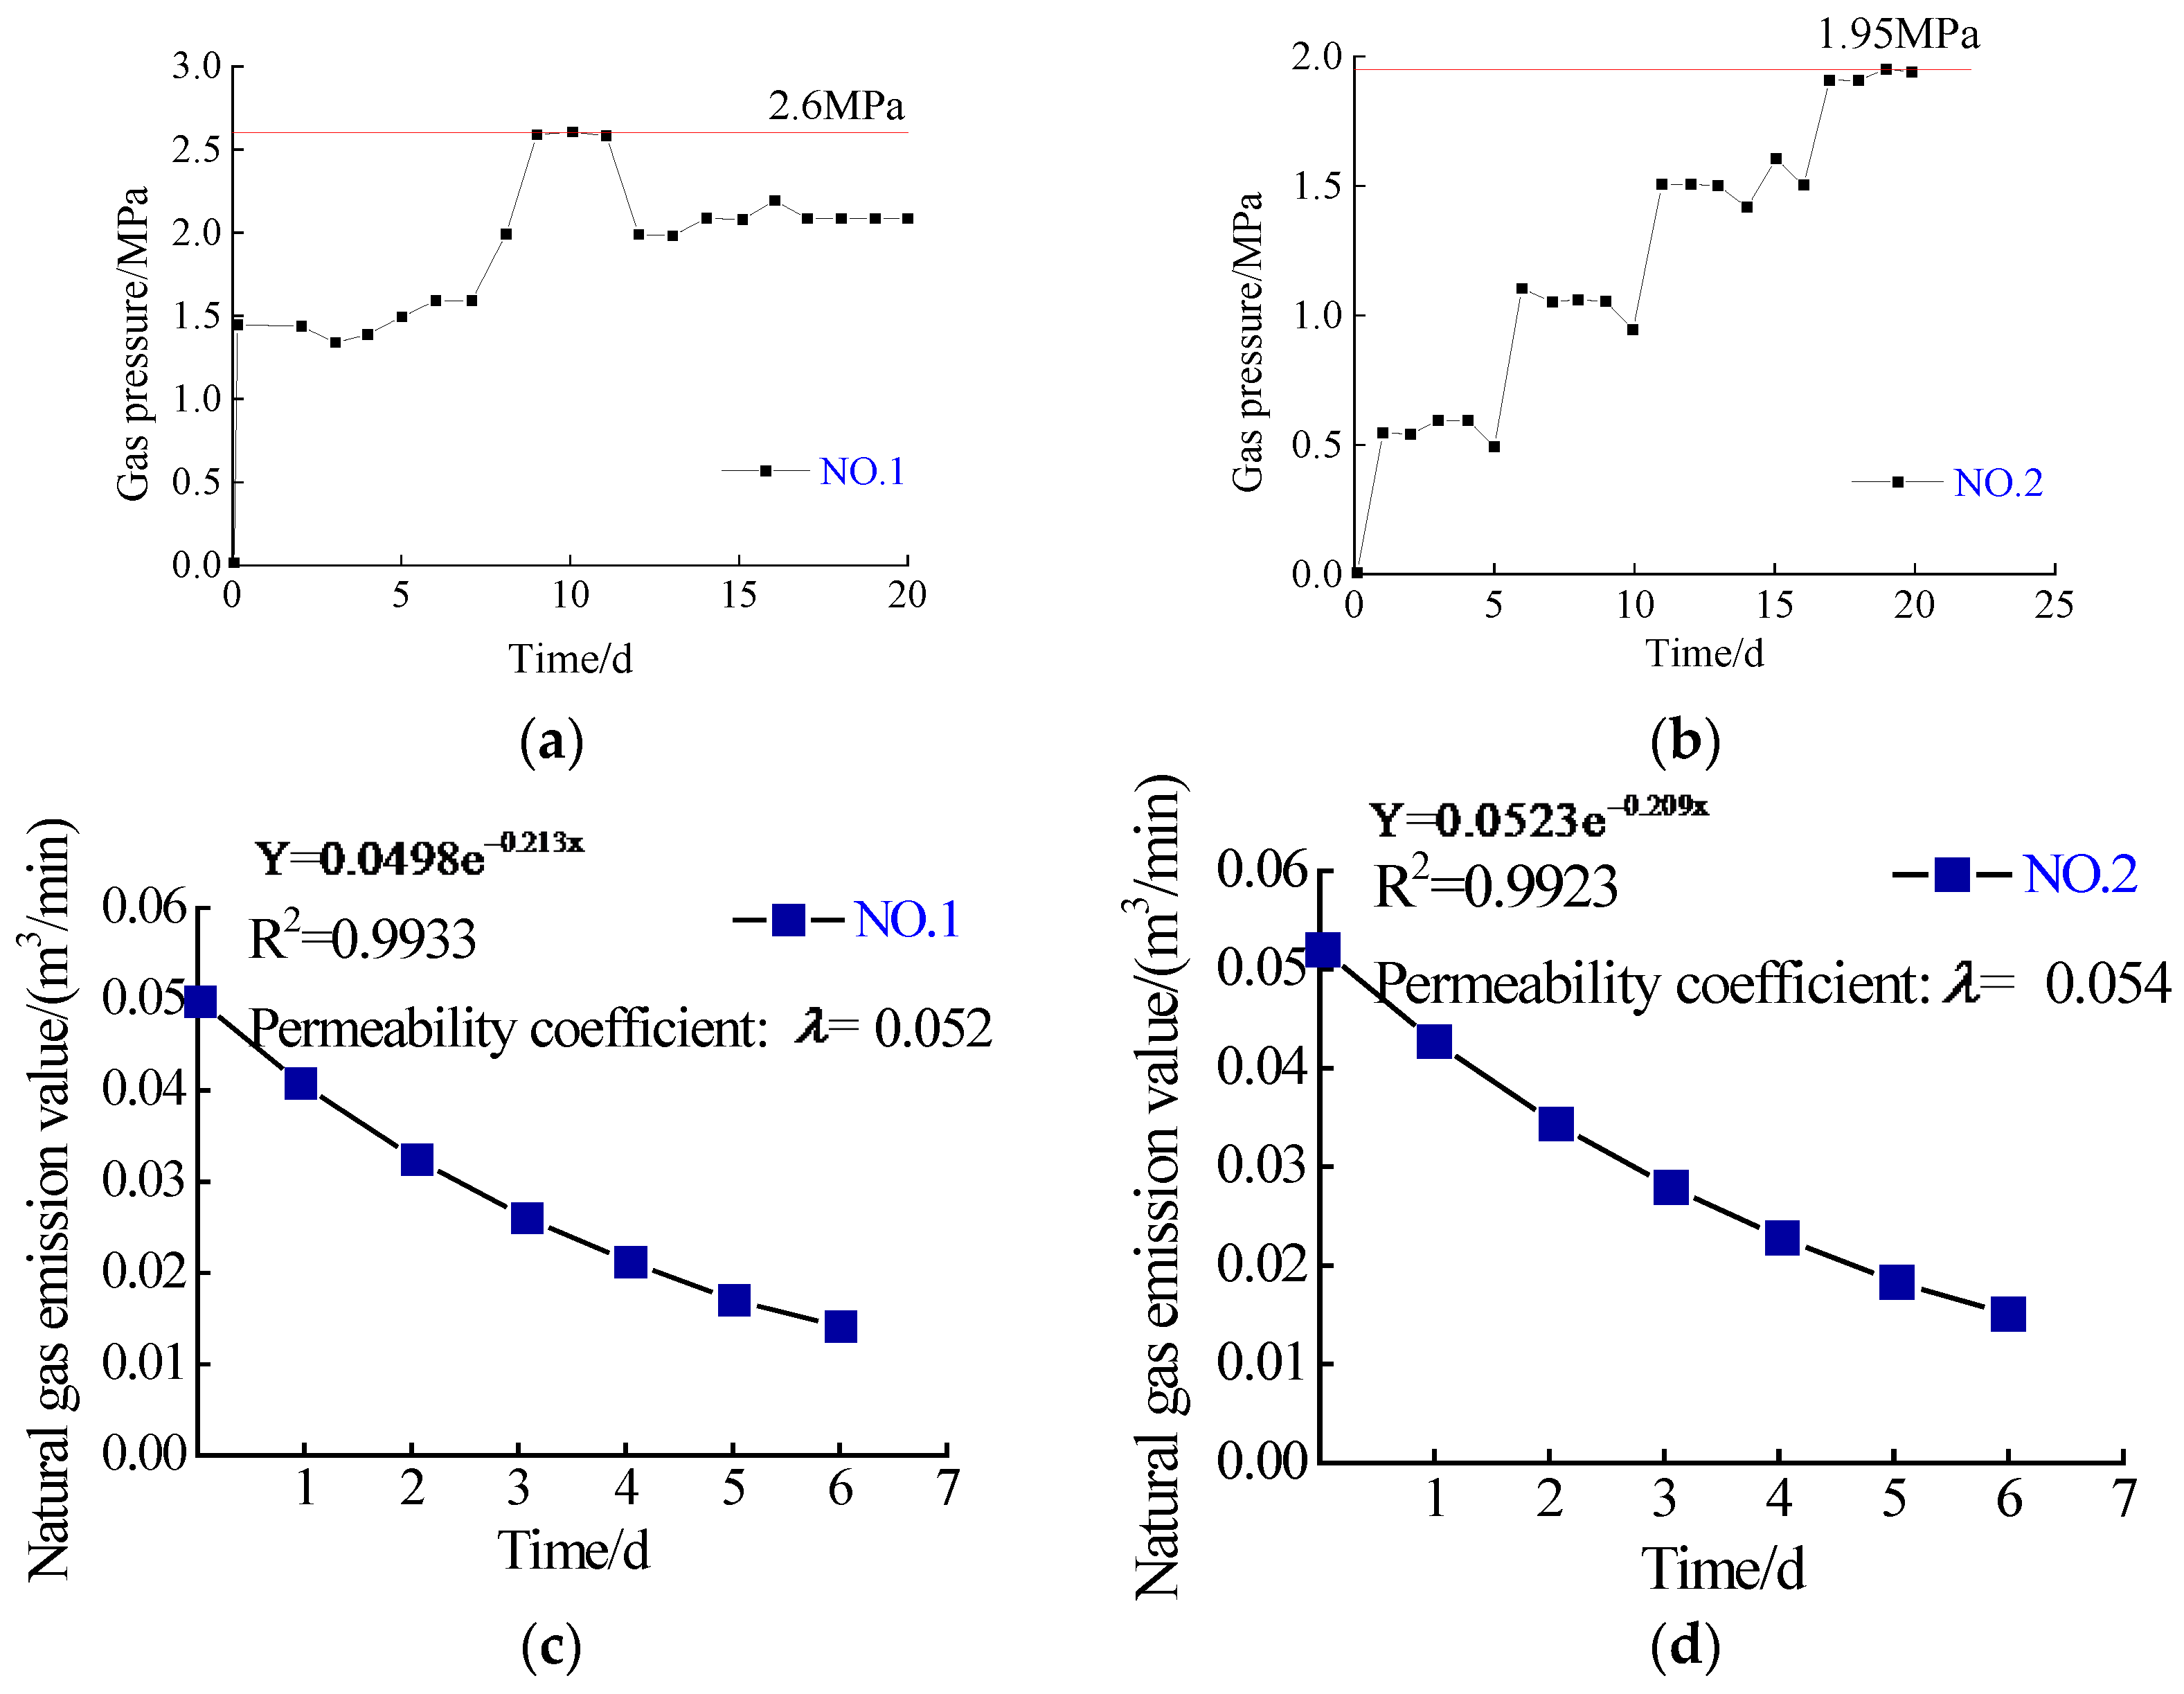
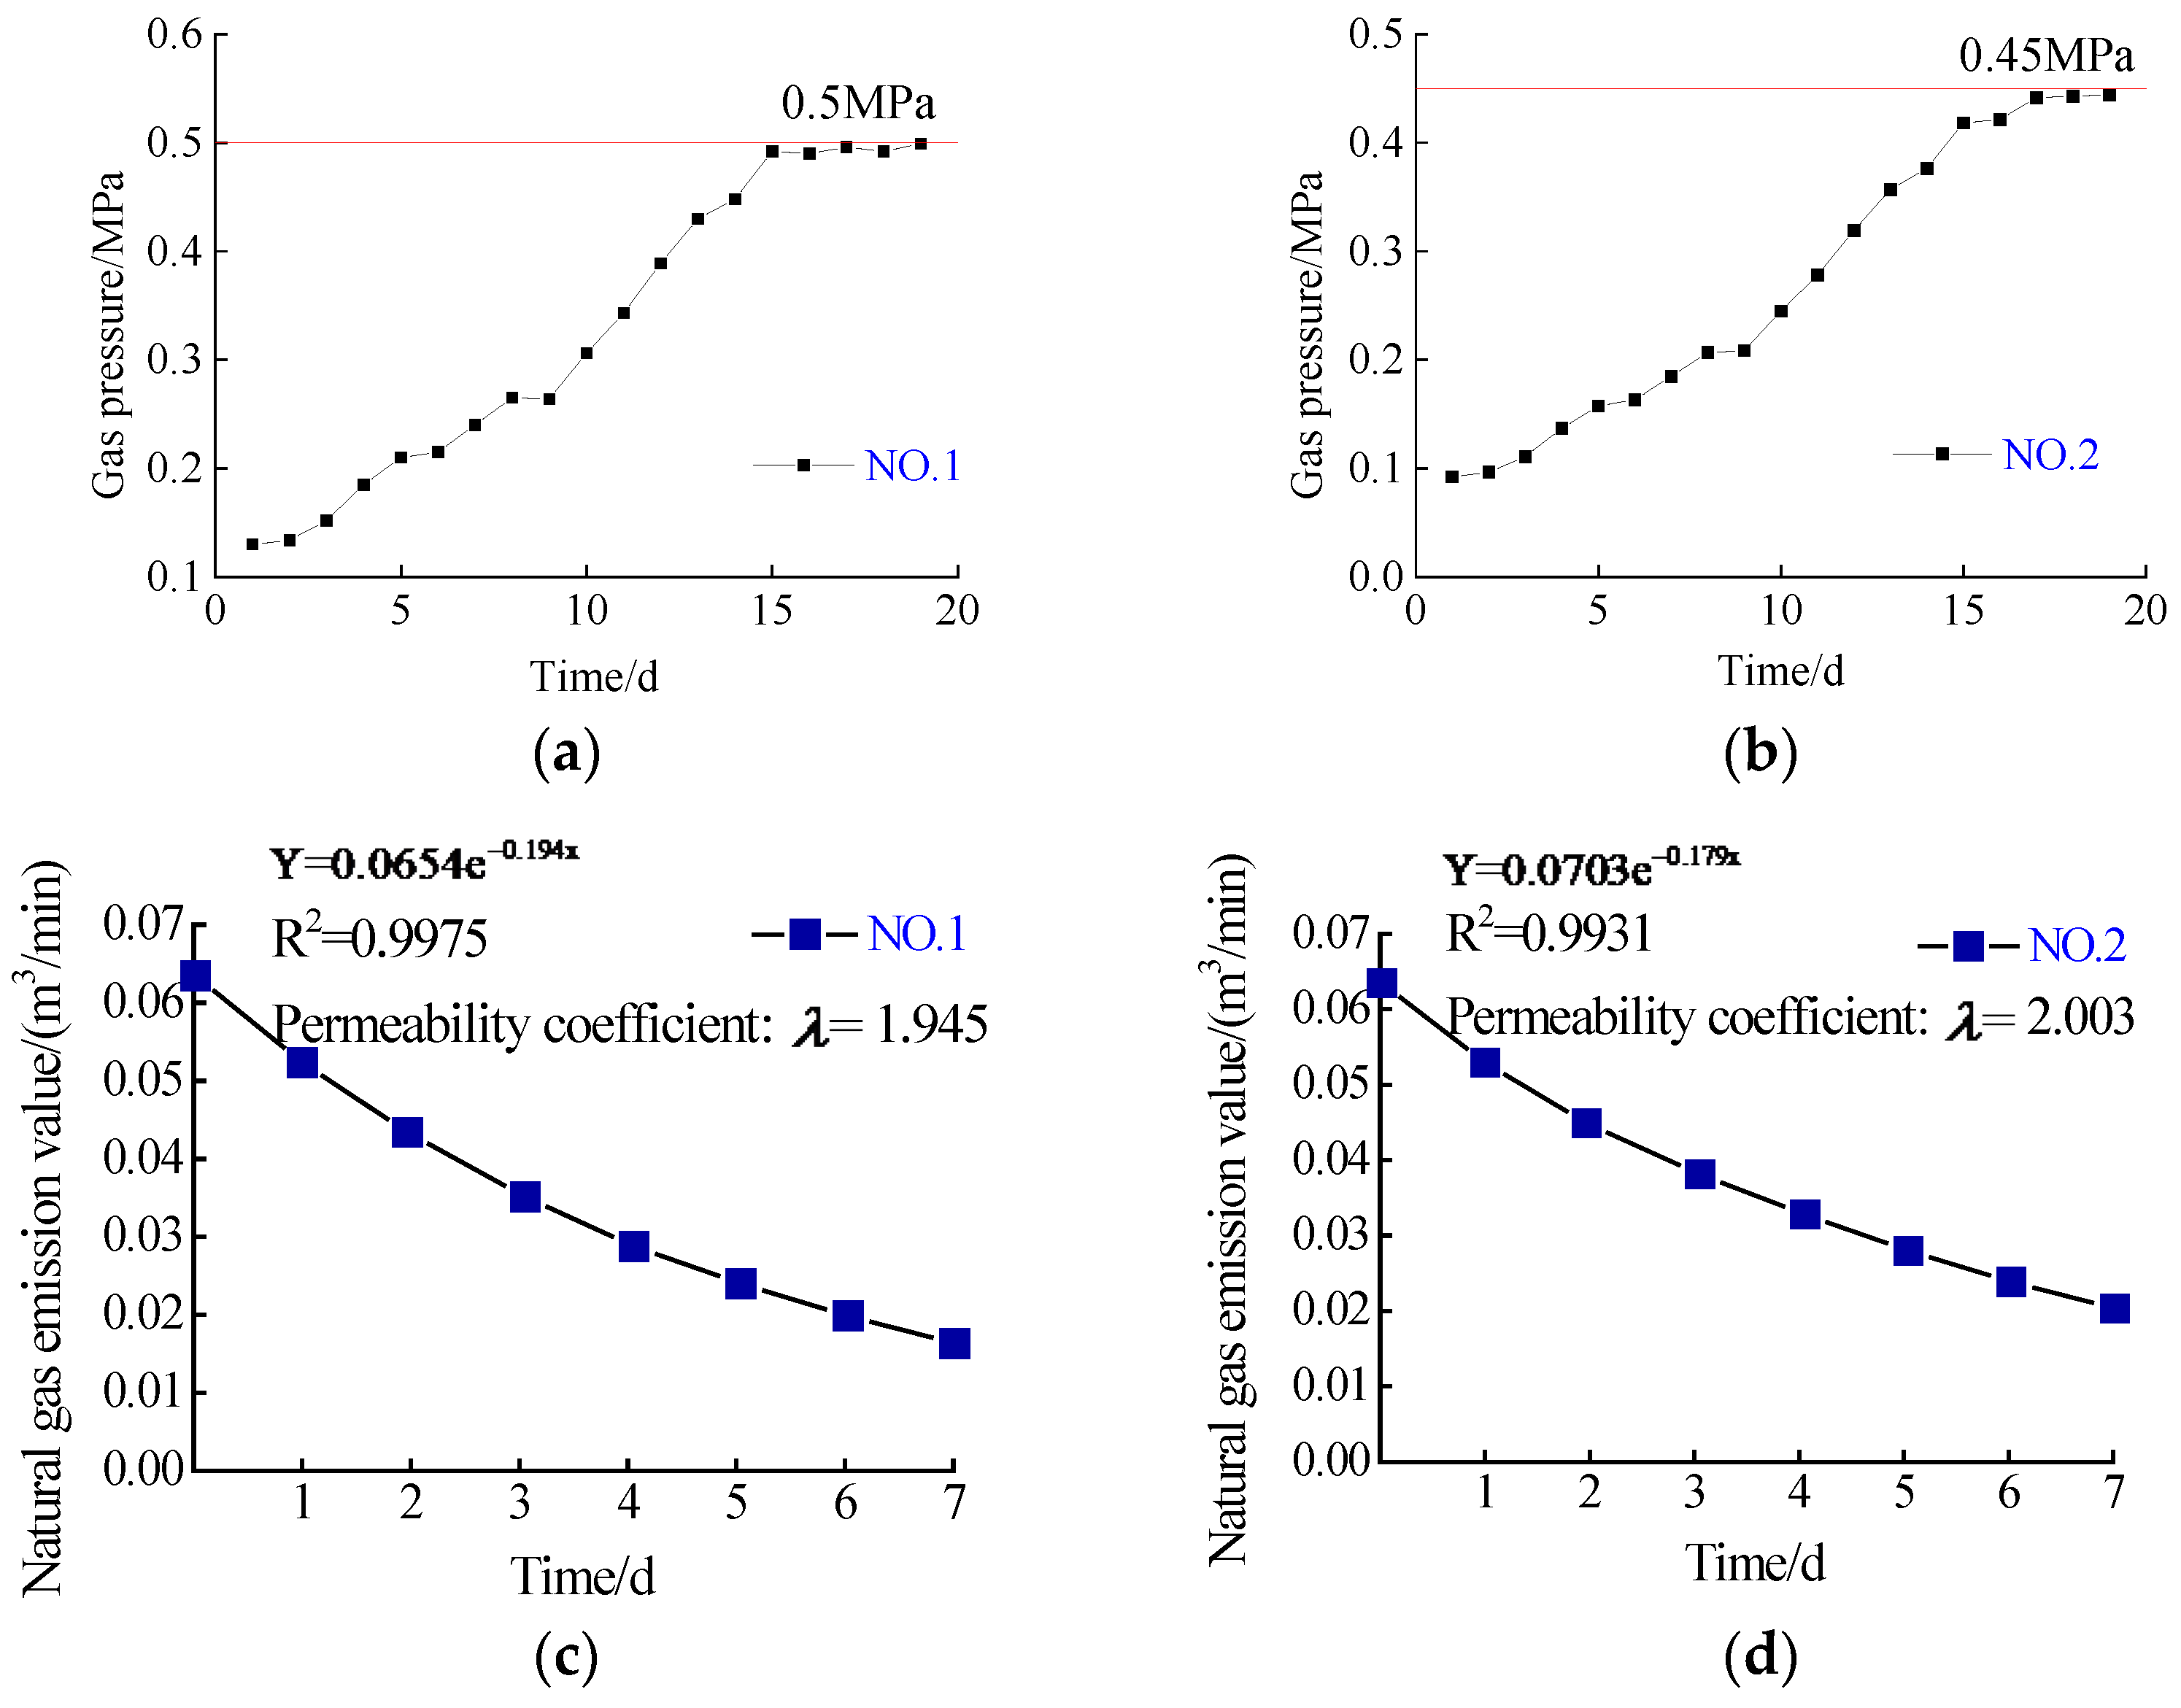
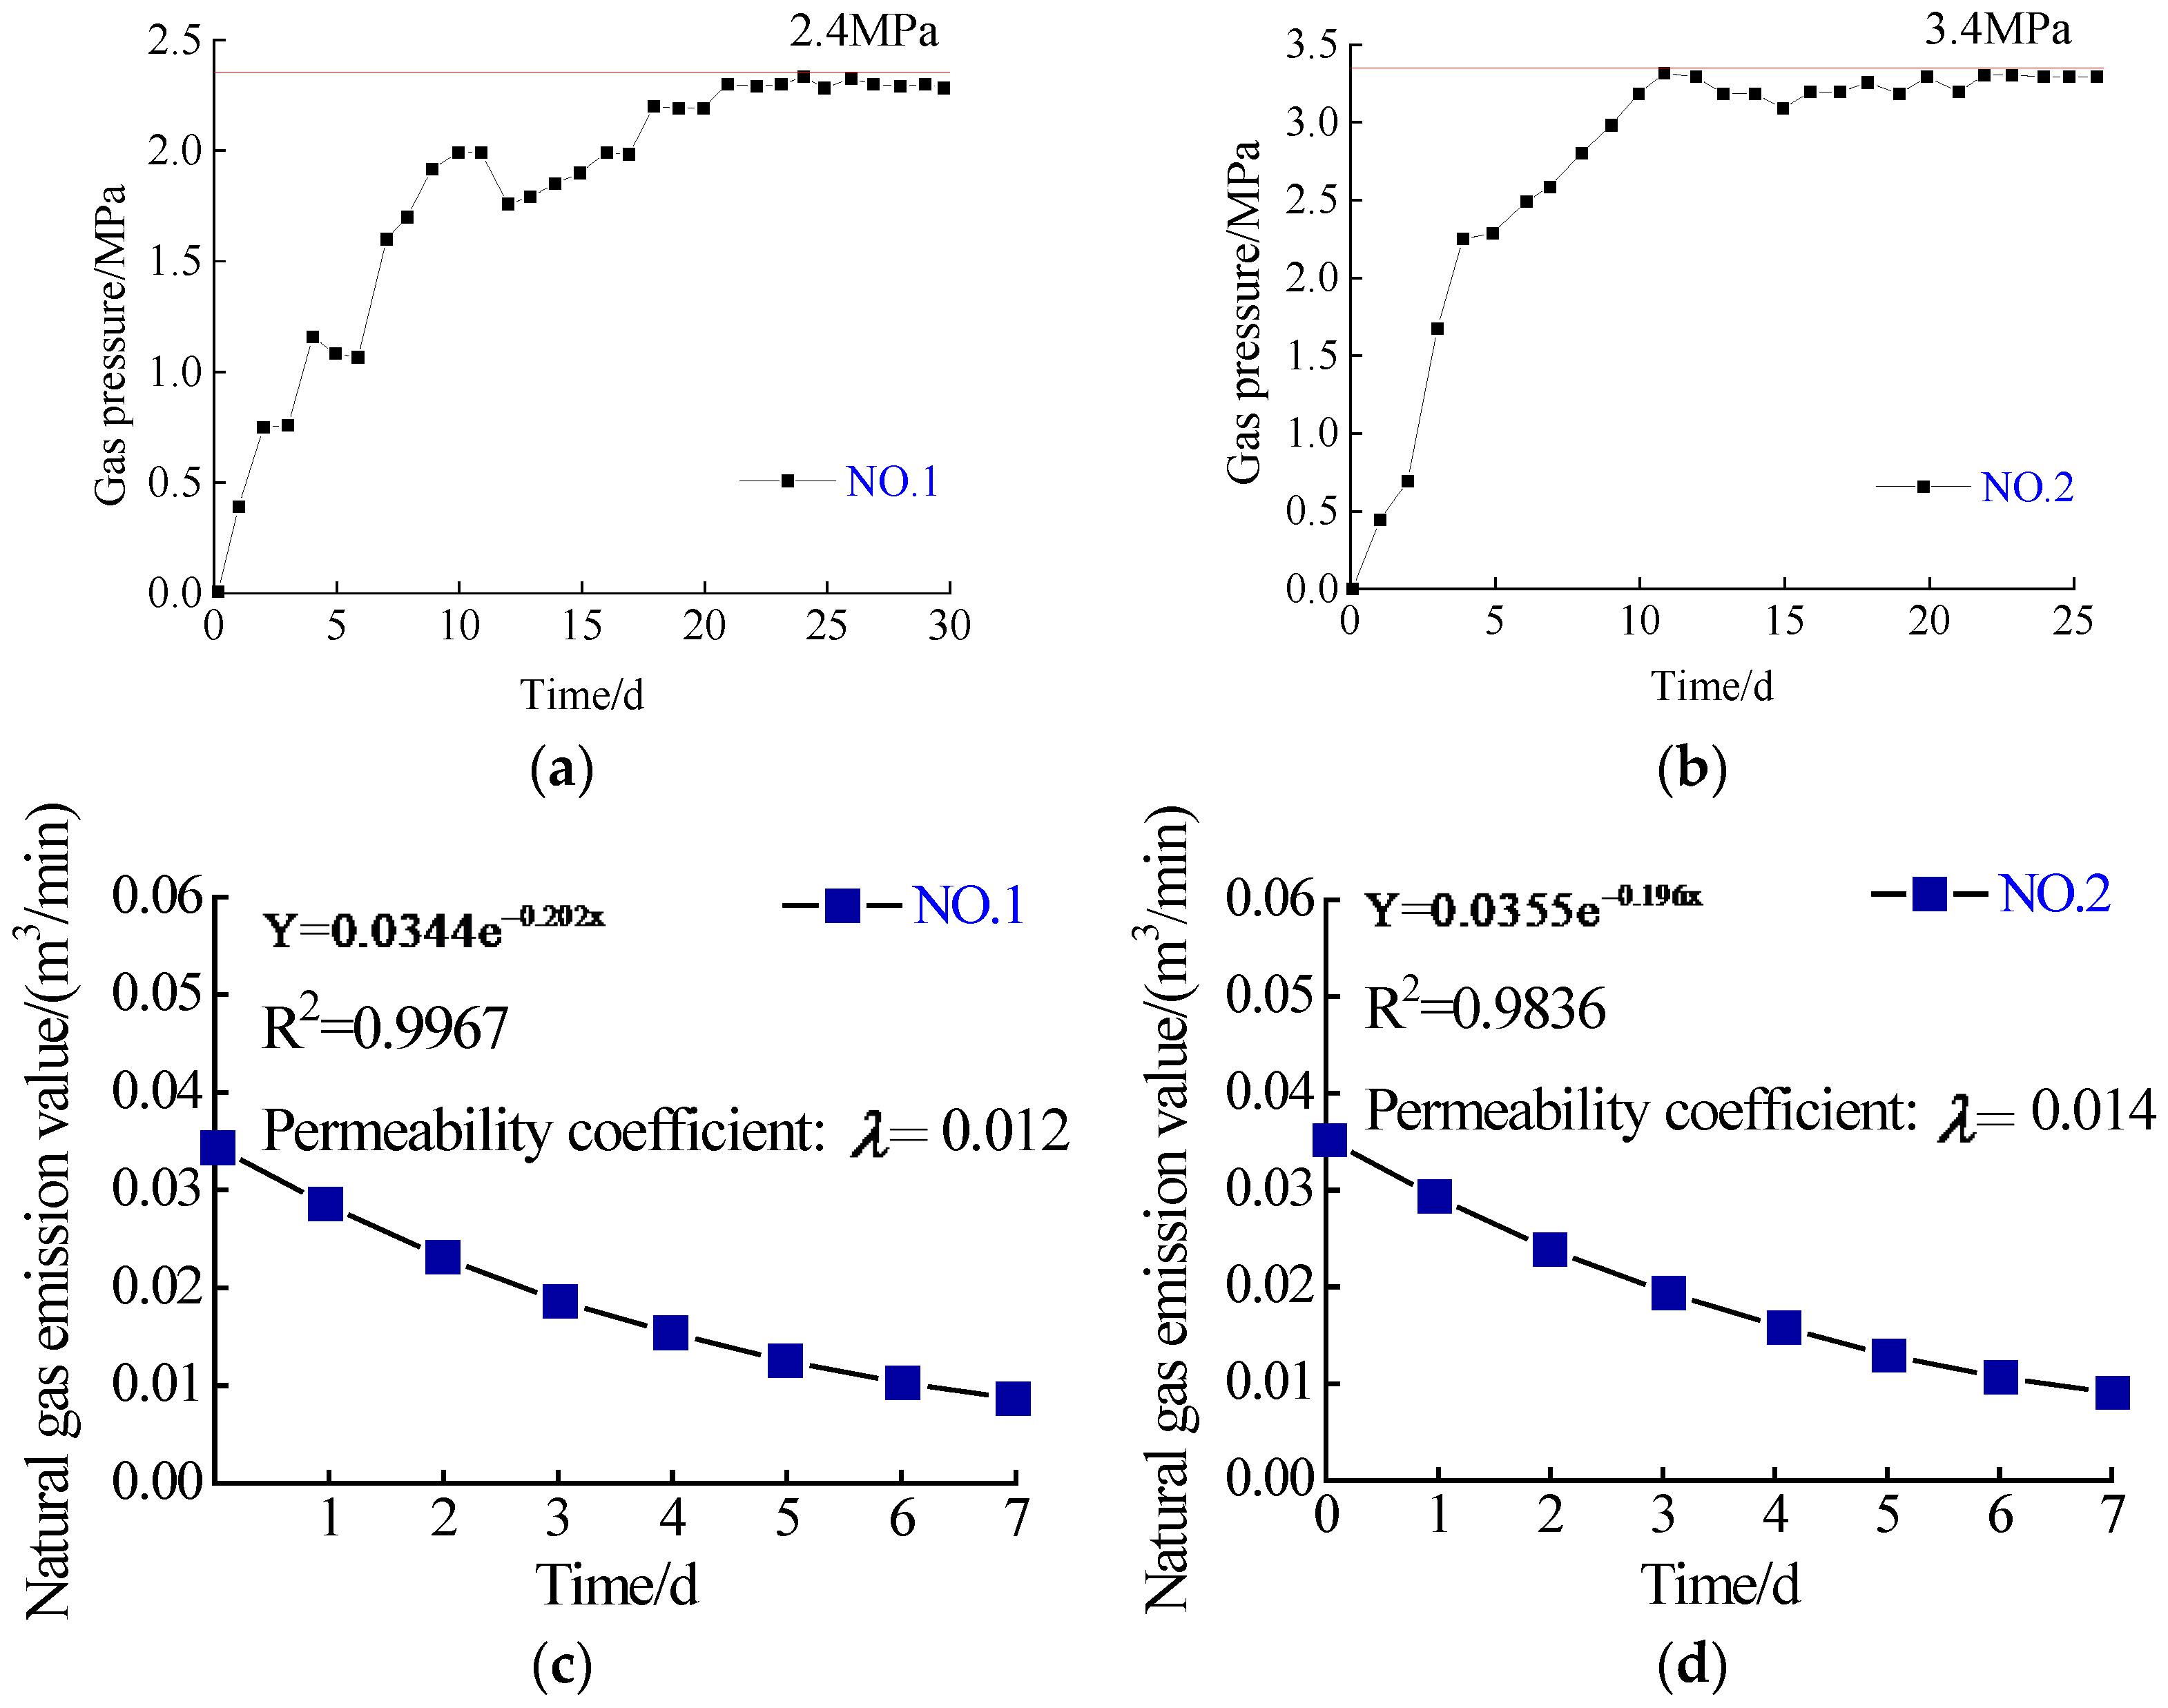
Gas pressure and coal seam permeability coefficient
Two test holes are designed for each protection condition and the maximum test result is taken based on safety considerations. The permeability coefficient is obtained according to the gas emission law of the borehole and the interval number is taken. The test results are shown in Figure 3, Figure 4, Figure 5, Figure 6 and Figure 7.
3.
Expansion deformation
The expansion deformation is tested with the device, as shown in Figure 8. Fixed points are set on the roof of the coal seam. The expansion deformation of the coal seam is measured by the change in the length of the steel wire in the hole.

4.2. Model Calculation

The field test obtained the original index parameters in the Wu group coal seam and Ji group coal seam in a mine of the Pingmei Group and the index parameters in the protective layer area after it was mined, as expressed in Table 4.
The four indexes are represented by x1, x2, x3, and x4, respectively. The gas content and gas pressure in the collected index are exact numbers. The coal seam permeability coefficient and borehole natural flow attenuation coefficient belong to interval numbers. The index values are standardized according to Equations (1) and (3), respectively, and are dimensionless. Due to space reasons, this paper does not show the standardized results. Three experts were invited to provide their assessments of the order of importance of the indexes, and the Spearman coefficients for calculating the scores of the three experts are ρ 1 = 0.967 , ρ 2 = 0.967 , and ρ 3 = 0.933 , all of which are greater than 0.5, thus, passing the consistency check. The average scores given in Table 5 are calculated according to Equation (8) in Section 3.3, and then the indexes are sorted according to the index action calculated by Equation (9). The relative importance of adjacent indexes is calculated according to Equation (10), and the subjective constant weight of the effect of each index on the protective layer mining is calculated according to Equation (11).
According to Section 3.3, to correct the index subjective weights, the dominance degree Rij of the four indexes is calculated by Equation (14) and formed into a matrix R:
R = [ 0.0049 0.0957 0.0098 0.1648 0.0099 0.0206 0.0101 0.1648 0.0038 0.0058 0.0101 0.1483 0.0072 0.0110 0.0101 0.1484 0.0097 0.1636 0.0025 0.0344 ]
According to Equation (15), the independent variable in the variable weight function is divided into three regions. Therefore, the number of clusters is three, and the cluster centers are f1 = −0.0020, f2 = 0.0527, and f3 = 0.1566, respectively. The penalty threshold and incentive threshold are obtained as follows:
{ R L = f 1 + f 2 2 = 0.0254 R U = f 2 + f 3 2 = 0.1047
According to Equation (16), the variable weight is calculated based on the subjective weight ω i j , as shown in Table 6.
The evaluation target in this paper is Henan Province, China, and the critical value [23] set by the locality is selected as the positive bullseye. The weighted positive bullseye distance, negative bullseye distance, and positive and negative bullseye distances of each scheme are calculated by Equation (17). The results can be substituted into Equation (18) to calculate the bullseye distance of variable weight projection, as shown in Table 7.

4.3. Results Analysis

The degree of deviation in each scheme from the “optimal combination” can be determined according to the projected distance between the calculation result and the bullseye. If the bullseye distance is between (0, 1), the degree of protection is not significant, and mining is still dangerous. Corresponding to the danger intensity, the larger the value, the more serious the risk, and the smaller the value, the less dangerous; if the bullseye distance is between (−1, 0), there is effective protection, and the larger the absolute value is, that is, the farther the distance from 0, the higher the degree of protection, and vice versa.
From the calculation in Table 7, it can be seen that the distance between the test results and the bullseye in the original coal seam area, and the distance between the test results and the bullseye in the protected area, can be calculated by using this model, quantifying the degree of danger and the degree of protection, which can intuitively and accurately represent the protective layer mining effect. The variable weight-projected bullseye distance and the protective degree are reflected in Figure 9.
  • The projected bullseye distance of the original area in the group Wu coal seam calculated by the model is 0.2321, which is dangerous (greater than zero). After mining the Ding group coal seam of the upper protective layer, the bullseye distance is reduced to −0.0378, which is effective for protection (less than zero). The degree of protection in the original area in the group Wu coal seam reaches 116.29%, which has a good protection effect. In terms of individual indexes, by comparing the gas parameters of the original area in group Wu and the area of Ding protected by group Wu, as shown in Table 4, it can be seen that the safety of coal seam mining is improved, the gas content is reduced by 40.6%, the gas pressure is reduced from 1.1 MPa to 0.5 MPa, the gas pressure is reduced by 54.5%, the permeability coefficient increased by 12.38-times, and the expansion value reaches 17.8‰. The gas content and gas pressure decrease significantly, and the values decrease to within the safe range of the outburst prevention index. At the same time, the permeability of the coal seam increases by 12.4-times. The effect of group Wu being protected by group Ding alone is more obvious.
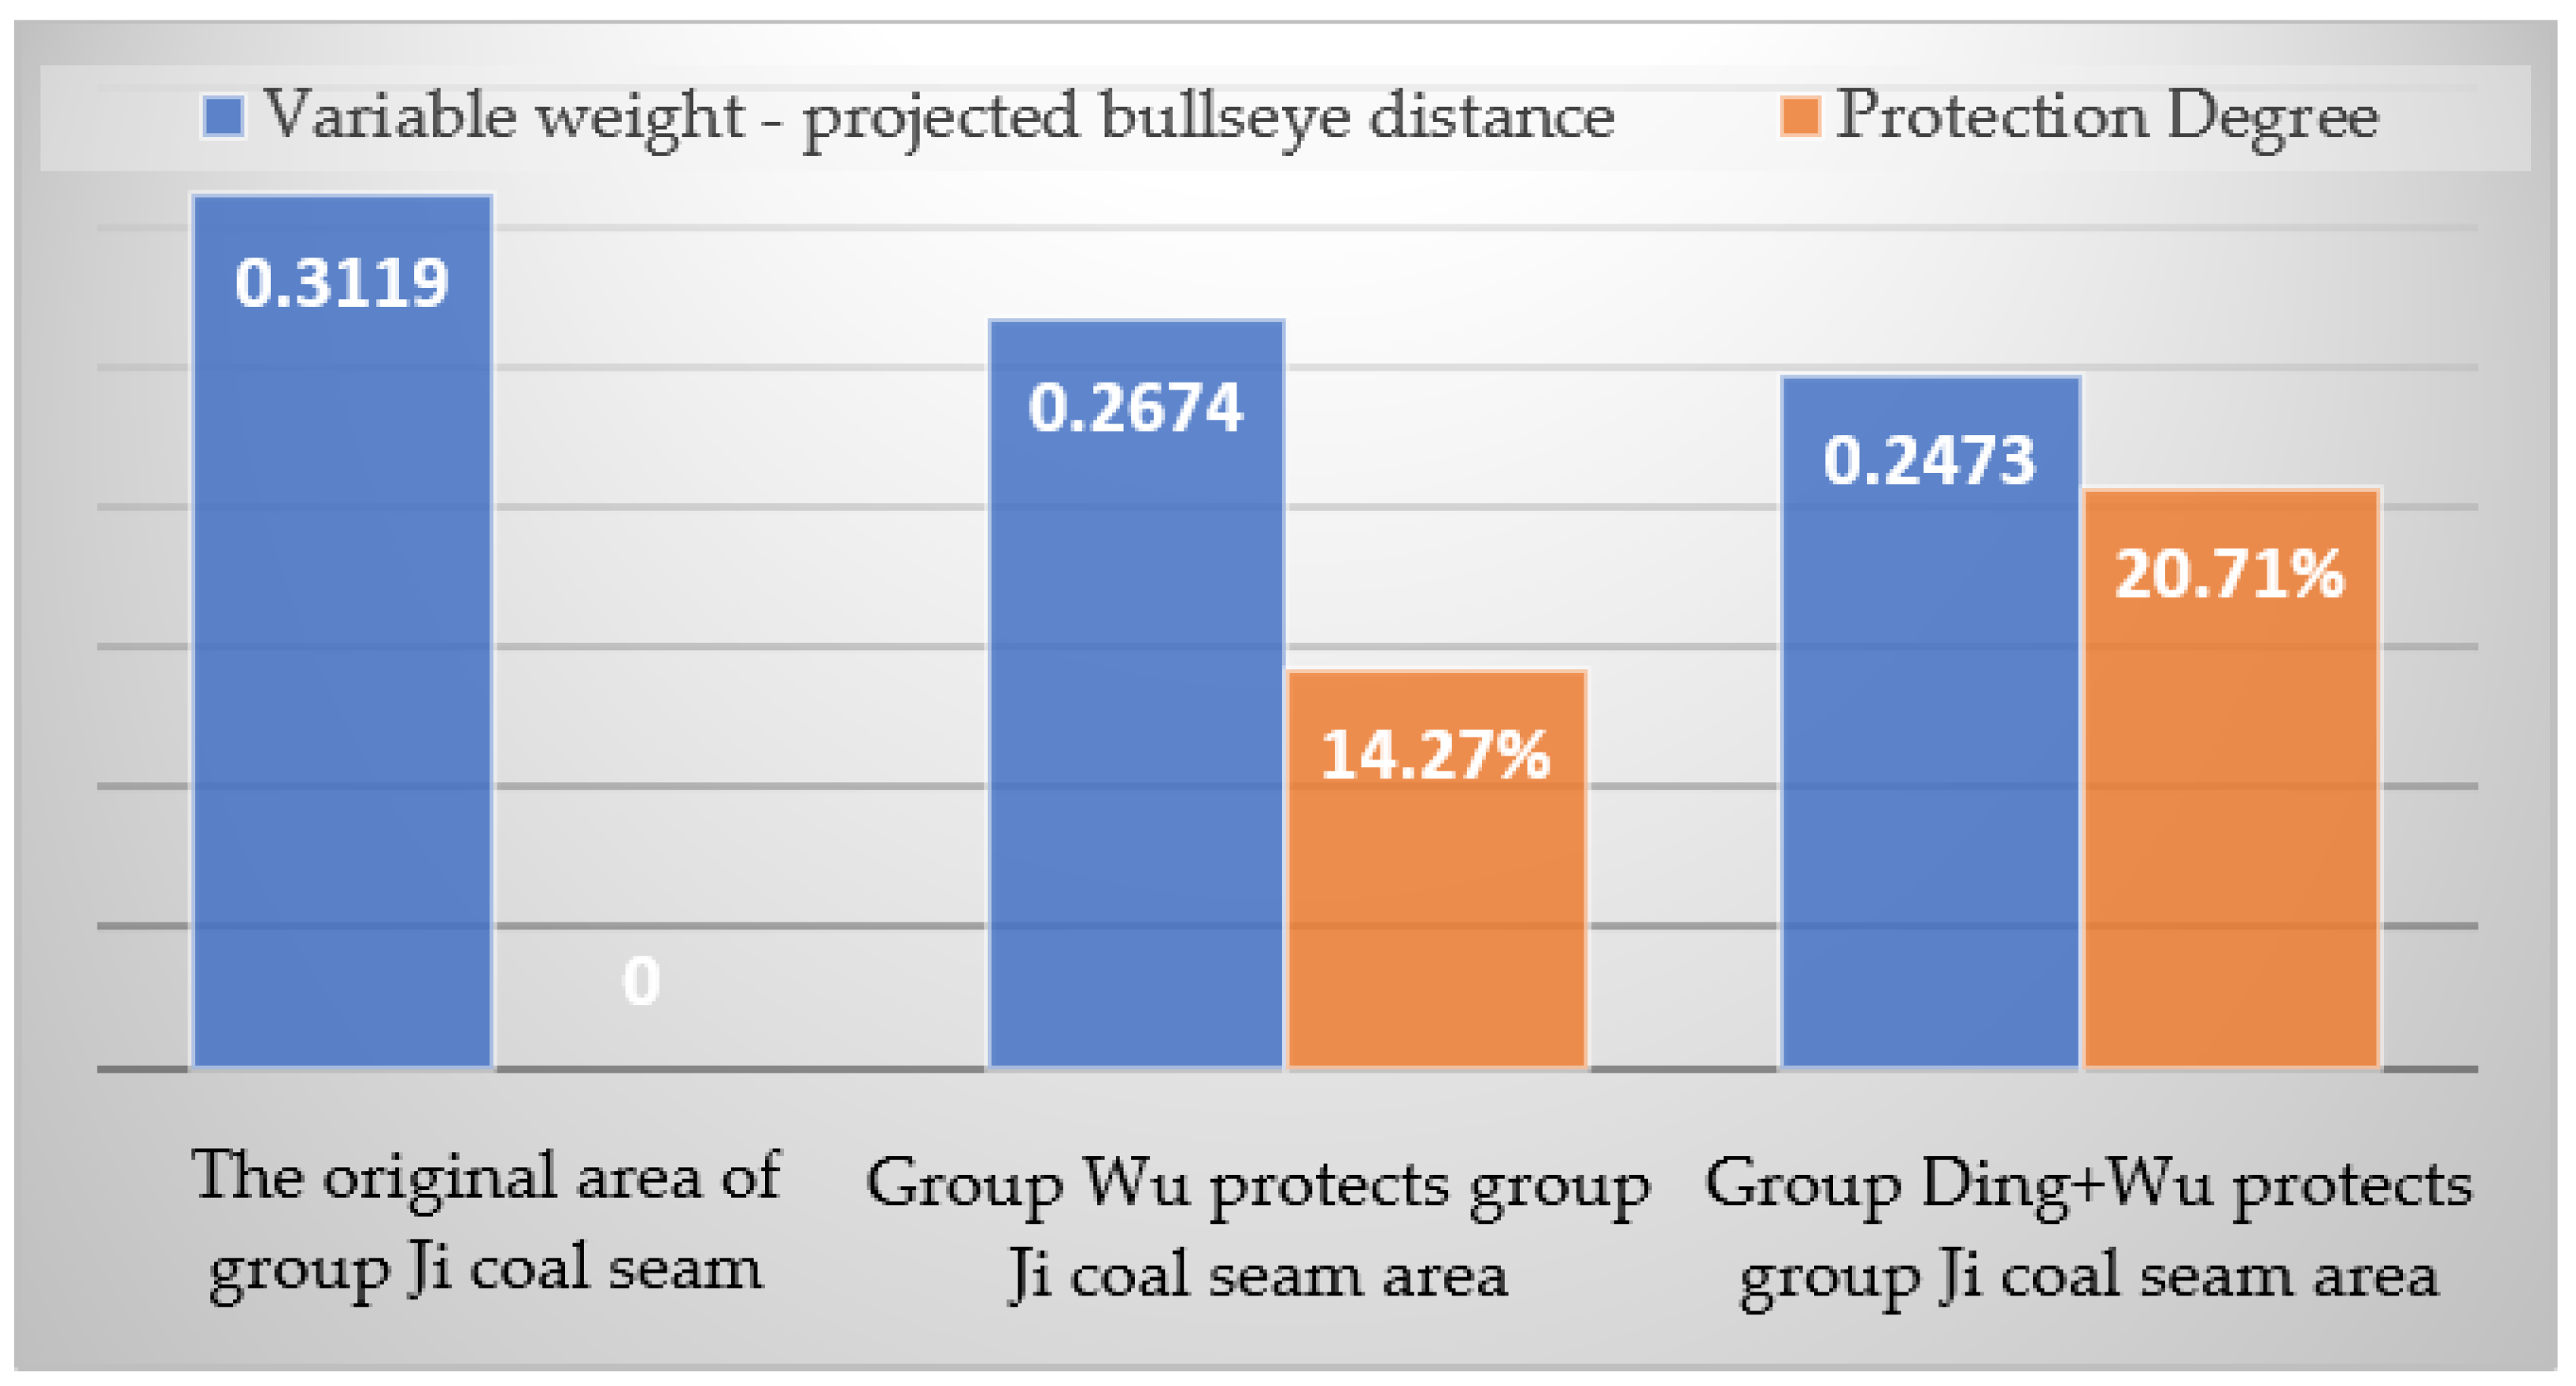
  • The projected bullseye distance of the original area in the group Ji coal seam is 0.3119, which is dangerous (greater than zero). After mining the upper protective layer in the group Wu coal seam, the bullseye distance is reduced to 0.2674, which is still dangerous (greater than zero). The degree of protection in the original area in the group Ji coal seam reached 14.27%, which reduced the degree of danger of the original area of the group Ji coal seam by 14.27%. Comparing the gas parameters of the original area in the group Ji coal seam and the area where the group Ji coal seam is protected by the Wu group coal seam, as shown in Table 4, it can be seen that the gas content decreased from 9.71 m3/t to 8.91 m3/t, the gas content decreased by 8.2%, the gas pressure decreased from 3.4 MPa to 2.9 MPa, and the gas pressure decreased by 14.7%. The permeability of the coal seam increased by 3.2-times, and the expansion value reached 2.14‰, but it was still lower than the critical value of 3‰, as shown in Table 2. Only mining the protective layer in group Wu has a certain protective effect on group Ji.
  • After mining the upper protective layer in the Ding + Wu coal seam, the bullseye distance was reduced to 0.2473 (greater than zero), and the degree of protection in the original coal seam area reached 20.71%, which reduced the danger level in the original coal seam area by 20.71%. Comparing the gas parameters of the original area in the group Ji coal seam and the area where the group Ji coal seam is protected by the Ding + Wu group coal seam, as shown in Table 4, it can be seen that the gas content decreased from 9.71 m3/t to 6.34 m3/t, the gas content decreased by 34.7%, the gas pressure decreased from 3.4 MPa to 2.6 MPa, and the gas pressure decreased by 23.5%. The permeability of the coal seam increased by 4.3-times, and the expansion value reached 2.13‰, which was also lower than 3‰, as shown in Table 2. From the results, it can be seen that the effect of the Ding + Wu protective layer on the group Ji coal seam is better than the effect of the separate mining in the group Wu coal seam to protect the group Ji coal seam.
The evaluation results for the working face are shown in Figure 10, showing the protective effect of the working face with outstanding danger before and after protective layer mining is carried out. In Figure 10, red indicates that there is a prominent danger that needs to be eliminated. The evaluation value is a positive value. The darker the color, the higher the risk. The larger the value, the lower the degree of protection, and the stronger the secondary means of eliminating the outburst degree must be. Green means that the outburst degree can be eliminated without secondary outburst elimination. The evaluation value is negative. The greater the absolute value, the higher the safety and the higher the degree of protection.

4.4. Gas Control Data Analysis

After the protection layer was mined in this area of the Pingmei Group, the gas drainage volume of the working face where the protected layer was located increased significantly. The test data for the gas drainage parameters in the protected layer were statistically analyzed, and the changes in the gas drainage parameters in the protected layer working face were compared before and after the mining of the protective layer:
  • After group Wu protective layer mining, the gas drainage rate for the group Ji protected layer increased from 19% to 50.1% and increased by 163.68%. There were still outstanding dangers.
  • After group Ding + Wu upper protective layer mining, the gas drainage rate for the group Ji protected layer increased from 25.4% to 68.8% and increased by 170.87%. There were still outstanding dangers.
  • After group Ding upper protective layer mining, the index for the group Wu protected layer was below the outburst critical value; the wind flow gas concentration in the protected layer working face increased from 0.15% to 0.41% and increased by 173.33%; and the gas extraction rate increased from 25.4% to 78.3% and increased by 208.27%.

5. Discussion

5.1. Comparative Analysis with the Calculation Results of the Constant Weight-Projection Gray Target

The projection bullseye distance obtained by using constant weight is shown in the first row in Table 8 and Table 9, and the bullseye distance obtained by variable weight is shown in the second row in Table 8 and Table 9. Through the evaluation of variable weight projection bullseye distance, the calculation results changed, the degree of protection of group Ding + Wu, protecting the group Ji area, decreased to a small extent, and other decision-making schemes improved compared with the constant-weight results. In the process of variable weight, the incentive advantage index penalizes the inferior index, so that the overall evaluation results can be balanced.
The variable weight function is used to dynamically adjust the weight according to the index dominance of each scheme. In the scheme of group Ding protecting the group Wu coal seam area, the index dominance of x1 is high; however, the constant weight of this index is low, and the overall evaluation value is significantly improved by variable weight. The index dominance of x3 is low in this scheme; however, the constant weight of this index is high, and the overall evaluation value is reduced by variable weight. In the scheme of group Wu protecting the group Ji coal seam, the index dominance of x2 is low; however, the constant weight of this index is high, and the overall evaluation value is reduced by variable weight. The index dominance of x3 is high, and the constant weight of this index is high, but the improvement in the overall evaluation value is not obvious, satisfying the principle that the incentive range should be smaller than the penalty range. The variable weight calculation can better reflect the weight dynamic change caused by the test value’s discreteness in the same coal seam or the same working face.

5.2. Comparison with Related Literature

Reference [10] established a reliability evaluation method for protective layer mining from a macro perspective, and calculated the index weights by the analytic hierarchy process. From a macro perspective, the evaluation indexes were more comprehensive, but only the subjective constant weights were considered in the weight calculation, and the main basis was the expert-scoring method. In this paper, a variable weight function is established to correct the subjective weight, and the combination of subjective and objective measures is more reasonable. According to the gray target projection model, the bullseye distance is calculated for the targets of eliminated outbursts and the permeability is increased in each scheme. Given the quantitative results concerning the degree of protection in protective layer mining, it is possible to judge whether secondary outburst elimination is necessary and to provide a reference for formulating the most appropriate outburst elimination scheme, so that the quantification of the degree of protection is more precise and targeted.
Reference [11] proposed an evaluation model for the reliability of protective layer mining, which predicts the pressure relief boundary, quantitatively examines the pressure relief effect, uses the fuzzy-analytic hierarchy process to calculate the weight, and only calculates the subjective constant weight. The index value only considers exact numbers and is not compared with the data for the original coal seam and, thus, does not quantify the degree of protection. This paper solves the multi-attribute decision-making problem of exact numbers, interval numbers, and triangular fuzzy numbers, revises the subjective constant weights based on the variable weight function, and quantitatively analyzes the degree of protection in the protective layer mining. The method in this paper can better reflect the multi-attribute characteristics of the evaluation indexes; there are differences in the combination of multi-attribute index values in each decision-making scheme. The method can also reflect the control effect of this difference on the degree of protection.
There is no other report in the literature on the quantification of the degree of protection in protective layer mining. The variable weight-projection gray target model for the effectiveness of protective layer mining quantifies the degree of protection. It provides a theoretical basis for further judging whether the working face needs to add high-strength outburst elimination means, and guides the formulation of a secondary outburst elimination plan for outburst coal seams.

6. Conclusions

  • In the dynamic evaluation model of the variable weight projection bullseye, the subjective constant weight is corrected by the variable weight function to adjust the evaluation result, and the evaluation model reflects the dynamic changes in the evaluation index. Based on the punishment–incentive mechanism, the local state variable weight function is constructed, and the weight dynamic correction model is established. A weak index will affect the overall evaluation results. The penalty mechanism is used to reduce the weight of these indexes, so that the overall evaluation value is reduced after the weight adjustment. For the advantage index, the reward mechanism is used to increase the index weight and the overall evaluation value is increased.
  • The research object is the outburst elimination effect in the protected layer in the engineering of protective layer mining. Taking the critical value of the evaluation index for outburst elimination and increasing permeability as the bullseye, the bullseye distance was calculated for each scheme, and the variable weight function was used to balance the evaluation results, quantifying the degree of protection. If the bullseye distance is a negative value, this indicates that there is no outburst risk, and the larger the absolute value, the higher the degree of protection. If the bullseye distance is a positive value, this indicates that there is an outburst risk, and the larger the value, the lower the degree of protection.
  • Through the quantitative results, the protective layer mining of this mine was found to have a certain protective effect. Group Ding protects the group Wu coal seam area, with the degree of protection in the original coal seam reaching 116.29%, a good protective effect. After the mining of the protective layer, all indexes are within the safe value. Inside, the coal seam collapses. The group Wu coal seams protecting the group Ji coal seams area, and the group Ding + Wu coal seams protecting the group Ji coal seams, did not eliminate outbursts. In the area where the group Ji coal seam is protected by the Wu group coal seam, compared with the original area, the degree of risk in the group Ji coal seam was reduced by 14.27%. In the area where the group Ji coal seam is protected by the Ding + Wu group coal seam, the degree of risk in the group Ji coal seam was reduced by 20.71%. The degree of protection in group Ding + Wu to protect the group Ji coal seam scheme was slightly greater than that in group Wu to protect the group Ji coal seam scheme, and it can be increased by a small increase in permeability measures or by an improvement in gas drainage drilling design.
  • This study obtains the variable weight-projection gray target model for evaluating the effectiveness of protective layer mining, and quantifies the degree of protection, provides a theoretical basis for judging whether the working face should be strengthened with enhanced permeability, and guides the formulation of a secondary outburst elimination scheme for an incompletely eliminated outburst coal seam.

Author Contributions

Conceptualization, B.Q. and Z.S.; Methodology, B.Q. and B.L.; Validation, W.S. and J.H.; Investigation, Z.S.; Data curation, B.Q. and F.H.; Writing—original draft preparation, B.Q.; Writing—review and editing, B.Q.; Visualization, J.H.; Supervision, W.S.; Project administration, B.Q.; Funding acquisition, Z.S.; Investigation, J.H.; Resources, F.H. All authors have read and agreed to the published version of the manuscript.

Funding

This research was funded by the National Natural Science Foundation of China, grant numbers 52004118 and 51874166; Liaoning Technical University, grant number LNTU20TD-11; and the Department of Education of Liaoning Province, grant number LJ2020QNL009.

Institutional Review Board Statement

Not applicable.

Informed Consent Statement

Not applicable.

Data Availability Statement

Data are contained within the article.

Conflicts of Interest

The authors declare no conflict of interest.

References

  1. Cheng, Y.G. Theory and Engineering Application of Coal Mine Gas Prevention and Control, 1st ed.; China University of Mining and Technology Press: Beijing, China, 2010; pp. 21–36. [Google Scholar]
  2. Zhang, H.T.; Wen, Z.H.; Yao, B.H.; Chen, X.Q. Numerical simulation on stress evolution and deformation of overlying coal seam in lower protective layer mining. Alexandria Eng. J. 2020, 59, 3623–3633. [Google Scholar] [CrossRef]
  3. He, A.P.; Fu, H.; Huo, B.J.; Fan, C.J. Permeability Enhancement of Coal Seam by Lower Protective Layer Mining for Gas Outburst Prevention. Shock Vib. 2020, 2020, 8878873. [Google Scholar] [CrossRef]
  4. Zou, Q.L.; Liu, H.; Zhang, Y.J.; Li, Q.M.; Fu, J.W.; Hu, Q.T. Rationality evaluation of production deployment of outburst-prone coal mines: A case study of nantong coal mine in Chongqing. Saf. Sci. 2020, 122, 104515. [Google Scholar] [CrossRef]
  5. China University of Mining and Technology, National Engineering Research Center for Coal Mine Gas Control. Technical Criterion of Protective Coal Seam Exploitation, 1st ed.; China State Administration of Work Safety: Beijing, China, 2008; pp. 2–3.
  6. Liang, B.; Qin, B.; Sun, W.J.; Wang, S.Y.; Shi, Y.S. The application of intelligent weighting grey target decision model in the assessment of coal-gas outburst. J. China. Coal. Soc. 2013, 38, 1611–1615. [Google Scholar]
  7. Chen, C.X.; Su, J.; Li, W.B. Investigation on regional outburst prevention effect with mining of upper protective seam extraction. Saf. Coal. Min. 2017, 43, 110–112. [Google Scholar]
  8. Kang, J.D. Study on the Influence of Coal Pillar on the Pressure Relief and Outburst Elimination of the Upper Protective Layer Mining. Min. Saf. Environ. Prot. 2018, 45, 17–21. [Google Scholar]
  9. Yuan, L.; Xue, S. Defining outburst-free zones in protective mining with seam gas content-method and application. J. China Coal Soc. 2014, 39, 1786–1791. [Google Scholar]
  10. Liu, Y.W.; Li, G.F. Reliability research of protective layer mining and pressure-relief gas drainage. J. Min. Saf. Eng. 2013, 30, 426–431. [Google Scholar]
  11. Du, Z.S.; Qin, B.T.; Fan, Y.C. A reliability evaluation model of exploitation efficiency of the protective layer and its application. J. Min. Saf. 2017, 34, 186–191. [Google Scholar]
  12. Sun, G.D.; Guan, X. Research on hybrid multi-attribute decision-making. In Proceedings of the 2016 International Conference on Cyber-Enabled Distributed Computing and Knowledge Discovery (CyberC), Chengdu, China, 13–15 October 2016; Computer Society: Washington, DC, USA; pp. 272–277. [Google Scholar]
  13. Ma, J.S. Generalised grey target decision method for mixed attributes with index weights containing uncertain numbers. J. Intell. Fuzzy Syst. 2018, 34, 625–632. [Google Scholar] [CrossRef]
  14. Ma, J.S. A generalized grey target decision method with mixes data type of index and weight. Stat. Decis. 2018, 7, 58–61. [Google Scholar]
  15. Ma, J.S. Generalised grey target decision method with Index and weight both containing mixed attribute values based on improved gini-simpson index. J. Stat. Inf. 2019, 34, 28–34. [Google Scholar]
  16. Zhang, Z.; Li, L.L.; Wei, Z.H.; Yu, H.F. Dynamic effectiveness evaluation of command control system based on variable weight-projection gray target. Syst. Eng. Electron. 2019, 4, 801–809. [Google Scholar]
  17. Zou, R.H.; Wang, Y.C.; Deng, Y.J. Condition assessment method for transmission line with multiple outputs based on variable weight principle and fuzzy comprehensive evaluation. High Volt. Eng. 2017, 43, 1289–1295. [Google Scholar]
  18. Li, S.Q.; Wu, Q.; Li, Z.; Zeng, Y.F.; Yuan, Q.D.; Yu, Y.L. Vulnerability evaluation and application of floor water inrush in mining area with multiple coal seams and single aquifer based on variable weight. J. China Univ. Min. Technol. 2021, 50, 587–597. [Google Scholar]
  19. Xu, L.M.; Li, M.J.; Dai, Q.Z. Dynamic evaluation method based on grey target. J. Syst. Sci. Math. Sci. 2017, 37, 112–124. [Google Scholar]
  20. Bing, L.; Qin, B.; Sun, F.Y.; Wang, Y.; Sun, Y.N.; Phuclo, K. Application of evaluation index system of coal and gas co-extraction and evaluation model. J. China Coal Soc. 2015, 40, 728–735. [Google Scholar]
  21. Chen, G.B.; Teng, P.C.; Li, T.; Wang, C.Y.; Chen, S.J.; Zhang, G.H. Evaluation model of rock burst in coal mine and its application. J. Taiyuan Univ. Technol. 2021, 52, 966–973. [Google Scholar]
  22. China State Administration of Coal Mine Safety. Detailed Rules for Prevention and Control of Coal and Gas Outburst, 1st ed.; Coal Industry Press: Beijing, China, 2019; pp. 22–23.
  23. Henan Provincial People’s Government. Available online: http://yjglt.henan.gov.cn/2014/10-25/987526.html (accessed on 25 October 2014).
Figure 1. Calculation process.
Energies 15 04654 g001
Figure 2. Spatial position relationship of working faces in the evaluation area: (a) working face space position; (b) working face plane projection. 1. Ding5-6-11010 working face; 2. Ding5-6-11030 working face; 3. Ding5-6-11050 working face; 4. Ding5-6-11070 working face; 5. Wu9-10-21030 working face; 6. Wu9-10-21050 working face; 7. Ji15-21030 working face. The black lines show the working face and measuring point located in coal seam Ding5-6, the blue lines show the working face and measuring point located in coal seam Wu9-10, and the red line shows the working face and measuring point located in coal seam Ji15.
Energies 15 04654 g002
Figure 3. Original area of group Wu coal seam: (a) NO. 1 measuring point gas pressure test data; (b) NO. 2 measuring gas pressure point test data; (c) NO. 1 measuring point permeability coefficient test data; (d) NO. 2 measuring point permeability coefficient test data.
Energies 15 04654 g003
Figure 4. Original area of group Ji coal seam: (a) NO. 1 measuring point gas pressure test data; (b) NO. 2 measuring gas pressure point test data; (c) NO. 1 measuring point permeability coefficient test data; (d) NO. 2 measuring point permeability coefficient test data.
Energies 15 04654 g004
Figure 5. Wu protects Ji area: (a) NO. 1 measuring point gas pressure test data; (b) NO. 2 measuring gas pressure point test data; (c) NO. 1 measuring point permeability coefficient test data; (d) NO. 2 measuring point permeability coefficient test data.
Energies 15 04654 g005
Figure 6. Ding + Wu protects Ji area: (a) NO. 1 measuring point gas pressure test data; (b) NO. 2 measuring gas pressure point test data; (c) NO. 1 measuring point permeability coefficient test data; (d) NO. 2 measuring point permeability coefficient test data.
Energies 15 04654 g006
Figure 7. Ding protects Wu area: (a) NO. 1 measuring point gas pressure test data; (b) NO. 2 measuring gas pressure point test data; (c) NO. 1 measuring point permeability coefficient test data; (d) NO. 2 measuring point permeability coefficient test data.
Energies 15 04654 g007
Figure 8. Expansion deformation test data: (a) test device; (b) test data.
Energies 15 04654 g008
Figure 9. The degree of protection in the evaluation area.
Energies 15 04654 g009
Figure 10. Quantitative results before and after mining of the protective layer in the evaluation area: (a) before the protective layer mining; (b) group Ding protects group Wu coal seam region; (c) group Wu protects group Ji coal seam region; (d) group Ding + Wu protects group Ji coal seam region.
Energies 15 04654 g010
Table 1. Coal seam permeability coefficient classification.
ClassificationCoal Seam Permeability Coefficient (m2·MPa−2·d−1)
easy draw>10
normal draw0.1~10
hard draw<0.1
Table 2. Positive and negative bullseye values.
CategoryGas Pressure (MPa)Gas Content
(m3·t−1)
Coal Seam Permeability Coefficient (m2·MPa−1·d−1)Expansion Value
(‰)
Positive bullseyecritical valuecritical value53
Negative bullseye0.7480.10
Table 3. Gas content test results.
Investigation ContentsBorehole NumberCoal Sample Quality (g)Loss Amount W1
(m3/t)
Natural Desorption Amount W2
(m3/t)
Crushing Desorption Amount W3
(m3/t)
Non-Desorbable Amount
Wc
(m3/t)
Gas Content W
(m3/t)
Original area of group WuNO. 1693.41.061.591.532.236.41
NO. 2588.02.742.082.852.239.90
Original area of group JiNO. 1575.51.513.093.251.289.13
NO. 2586.21.673.353.411.289.71
Group Wu protect group Ji areaNO. 1494.20.782.192.131.286.38
NO. 2498.91.273.003.361.288.91
Group Ding+Wu protect group Ji areaNO. 1614.00.572.222.151.286.22
NO. 2519.70.722.601.741.286.34
Group Ding protect group Wu areaNO. 1531.70.622.311.671.285.88
NO. 2522.30.662.281.301.285.52
Table 4. Original test data of evaluation area.
Evaluation SchemeGas Content
W/m3·t−1
Gas Pressure
P/MPa
Permeability Coefficient
λ/m2·MPa−1·d−1
Expansion Value/‰
Group Wu coal seam original area9.901.10.157~0.1580.000
Group Ji coal seam original area9.713.40.012~0.0140.000
The area where the group Ji coal seam is protected by the Wu group coal seam8.912.90.038~0.0392.140
The area where the group Ji coal seam is protected by the Ding + Wu group coal seam6.342.60.052~0.0542.130
The area where the group Wu coal seam is protected by the Ding group coal seam5.880.51.945~2.00317.80
Table 5. Determining the subjective constant weight of index by the improved order relation analysis method.
IndexExpert 1Expert 2Expert 3Average ScoreIdeal OrderingIndex ActionRelative ImportanceSubjective Constant Weight
x13441.333x24\0.333
x21123.667x4210.250
x34331.667x340.50.217
x42213.333x1220.200
Table 6. Index variable weight.
Indexx1x2x3x4
Scheme
10.19490.32290.20810.2742
20.19200.31950.20990.2767
30.19460.32360.20950.2724
40.19660.32180.20940.2722
50.19330.36060.20690.2391
Table 7. Quantification of the coal seams’ degree of protection before and after protective layer mining.
Evaluation SchemeThe Original Area of the Ji Group Coal SeamThe Area Where the Group Ji Coal Seam Is Protected by the Wu Group Coal SeamThe Area Where the Group Ji Coal Seam Is Protected by the Ding + Wu Group Coal Seam
Variable weight—projected bullseye distance0.31190.26740.2473
Evaluation schemeThe original area of Wu group coal seamThe area where the group Wu coal seam is protected by the Ding group coal seam\
Variable weight—projected bullseye distance0.2321−0.0378\
Table 8. Comparison of variable weight and constant weight projection bullseye distance for the group Wu protection effect.
Calculation ResultsGroup Wu Coal Seam Original AreaThe Area Where the Group Wu Coal Seam is Protected by the Group Ding Coal Seam
Constant weight bullseye distance0.2182−0.0015
Variable weight bullseye distance0.2321−0.0378
Table 9. Comparison of variable weight and constant weight projection bullseye distance for the group Ji protection effect.
Calculation ResultsGroup Ji Coal Seam Original AreaThe Area Where the Group Ji Coal Seam Is Protected by the Wu Group Coal SeamThe Area Where the Group Ji Coal Seam Is Protected by the Ding + Wu Group Coal Seam
Constant weight bullseye distance0.29480.26300.2559
Variable weight bullseye distance0.31190.26730.2473
Publisher’s Note: MDPI stays neutral with regard to jurisdictional claims in published maps and institutional affiliations.

