1. Introduction
In 2019, according to data from the PNAD (National Household Sample Survey), access to electric power in Brazilian households had reached nearly universal coverage, with 99.8% of households having this service [
1]. Due to the growing need for electricity and the greater demand from consumers and regulatory agencies, it is of fundamental importance that an electric power distributor delivers a quality service, paying attention to the safety of its employees, continuity, and efficiency of the service.
Among the various issues monitored by regulators, the quality of service indicators plays a significant role in monitoring the performance of the power distribution concession, ensuring continuous and reliable delivery. The quality of the services provided comprises the evaluation of interruptions in the electricity supply and planning of adequate future investments to guarantee compliance with the limits established by the regulator.
For this purpose, we can highlight the collective continuity indicators DEC (equivalent duration of interruption per consumption unit) and FEC (equivalent frequency of interruption per consumption unit) and the individual continuity indicators DIC (individual interruption duration per consumption unit or connection point), FIC (frequency of individual interruption per consumption unit or connection point), DMIC (maximum continuous interruption duration per consumption unit or connection point) and DICRI (duration of individual interruption occurred on a critical day per consumption unit or connection point) all defined in Module 8 of PRODIST (Procedures for Distribution of Electric Energy of the National Electric System) [
2].
To ensure compliance with the various quality indicators of service, the distributor continually invests in technologies to optimize the network’s performance, making continuity more efficient. Indicators such as DEC and FEC receive greater emphasis in the monitoring and analysis of the distributor. Therefore, it is essential to understand the causes of interruption for better effectiveness in targeting actions to prevent faults [
3].
In the planning of distribution network projects, part of the investment budget is allocated to actions for dealing with outages in the network, which has a positive impact on the results of continuity indicators [
4]. From the point of view of the quality of electricity supply in Brazil, continuity indicators improved significantly from 2021 to 2020, with the duration of interruptions reduced by about 38% and the frequency by 46% in this period [
5].
Therefore, a subject that is often evaluated and discussed by energy distributors is the estimated reduction in the quality of service indicators, i.e., what is the expected reduction in DEC and FEC that a particular project will provide. The way this benefit is estimated presents several opportunities for improvement, such as creating a methodology that considers the analysis of variables related to the performance of the project in the results of the indicators [
6].
For the planning of benefits in service quality, it is necessary to perform a preliminary analysis after the completion of the project to estimate the benefit associated with that specific intervention. With this, it is possible to predict the performance of future projects with greater assertiveness, ensuring more concise decision-making by those responsible for managing the investments and indicators.
Ferreira et al. [
7] developed a methodology for analyzing the impacts of investments in maintenance in the electric power distribution network on the continuity indicators (DEC, FEC, and Compensations) based on machine learning and regression with panel data models for the energy distributor Light, located in Rio de Janeiro. This work was divided into two parts; in the first step, the technical characteristics of the electrical networks were used to group the lines by similarity using the k-means clustering algorithm. In the second step, based on the previously defined groupings, a panel data regression of the network maintenance actions was performed using the fixed effect model. The results achieved proved to be effective because of the low estimation errors of the DEC, FEC, and financial compensation indexes.
Therefore, this work aims to develop a methodology for evaluating projects to improve the quality of service. For this purpose, techniques of Artificial Neural Networks and Evolutionary Algorithms were applied to assist in evaluating projects that best contribute to reducing the indicators of quality of service, meeting the limits set by the regulatory agency, and ensuring consumers a supply of electricity with higher quality. Simulation results will be presented using databases of a Brazilian energy distribution utility.
Among the main contributions of this work, the following can be highlighted:
- (a)
Facing a scenario of the regulation of service quality indicators and budget restrictions, this work aims to improve the forecast of gain that investment projects will bring to continuity indicators.
- (b)
It is proposed to identify variables that best contribute to the models that will assist the decision making of more assertive investment projects that best contribute to the indicators of quality of service, meeting the limits set by the regulatory agency, and ensuring consumers a supply of electricity with higher quality, i.e., less time and frequency of interruptions.
2. Related Works
Louback [
8] presented the development of a methodology for estimating power continuity indicators using artificial neural networks (ANN). He used actual data from the distributor EDP Espírito Santo to evaluate a specific electric set’s daily DEC and FEC indicators. The author used the database of interruptions of the distributor for the period from 1 January 2010 to 31 December 2017, and to improve the performance of the ANN, the data were treated concerning their outliers, normalized, interpolated, and MODWT (maximal overlap discrete wavelet transform) was applied. Besides this, the analysis was segmented for each day of the week, and with this, the author estimated future DEC and FEC values for the set studied through a time series forecast. No other input variable was considered, and the impact that structuring projects cause on the estimation of the indicators was not analyzed. The author concludes that the development of the models presented very significant results in predicting DEC and FEC. The total accumulated errors in the prediction of the DEC indicator at the end of January and February 2016 were 1.71% and 0.87%, respectively. In FEC forecasting, the total accumulated errors at the end of January and February 2016 were 7.45 and 10.96%, respectively. The author also highlighted that to obtain these results, the treatment of outliers, signal oscillation with the application of the square root, the decomposition of the signal into subseries with the Wavelet transform, and the normalization of the data were necessary for the ANN’s learning.
Magalhães [
6] proposed the development of predictive models for DEC and FEC, using multiple linear regression techniques and ANNs to serve as subsidies to the distributor for decision making. For the study, the author used data from a set of consumers of an energy utility in the Northeast region. With the history of failures occurring in the feeders that supply this set of consumers, the causes and frequency of interruption in the supply of electricity were analyzed, and how much these data contribute to the increase in the DEC and FEC values. The models for predicting the indicators have the quantity and duration of interruptions for each interruption caused. The outputs were the predicted DEC and FEC values obtained from a feedforward ANN with three layers. By applying the models developed, the author evaluated the influence of specific causes on the DEC and FEC, but without predicting the indicators considering the impact of investment projects carried out in the circuits of the set under study. The models brought a very significant result for predicting DEC and FEC. The results presented consistency because having the inherent characteristics of the distribution system analyzed, the models can reliably predict the indicators. The author concludes that the models that best represented the characteristics of DEC and FEC indicators were those developed by ANN techniques.
Junior [
3] used a multiple linear regression analysis framework (MRLA) and developed two empirical MISO (multiple input, single output) models, one to estimate the DEC and another to evaluate the FEC. For the application of the MRLA framework, the data were organized into 180 samples/measurements corresponding to the eight feeders of an electric set of consumers selected for the study of a distributor, considering the 24 occurrences relative to the months elapsed in the period from 2013 to 2014. Each sample/measurement has 57 inputs related to the causes of interruption and one output corresponding to DEC or FEC.
DIAS [
9] presented a methodology to quantify engineering actions’ impact on continuity indicators. In this work, the author analyzed the influence that certain types of projects exert on each block of the circuit. From the values realized in DEC and FEC for the region, reduction percentages that each action will represent in each block are considered, and the expected benefit of the project is estimated. This methodology considers that the gains for the continuity indicators will have the same reduction percentage according to each type of engineering action (project).
With the accomplishment of the state of the art study, it was verified that there was only a limited amount of research work that had analyzed the influence of the structuring of investment projects in the prediction of the indicators and the segregation of the portion that each project contributed to the composition of the indicators, and how much future projects can contribute for the reduction of the continuity indicators of the electric power distribution service. Ferreira et al. [
7], together with the distributor Light, developed a research and development project on the theme and evaluated the influence of maintenance actions on continuity indicators.
Ferreira et al. [
7] elaborated a methodology for analyzing the impacts of investments in maintenance in the distribution network on the continuity indicators (DEC, FEC, and Compensations) based on machine learning and regression with panel data models for the energy distributor Light, located in Rio de Janeiro. The work was divided into two parts; in the first stage, the technical characteristics of the electrical networks were used to group the lines by similarity using the k-means clustering algorithm. In the second stage, based on the previously defined groupings, a regression was performed with panel data of the network maintenance actions using the fixed effect model. The algorithm developed used multivariate regression for each group in the first stage, using panel data (observations over time). The databases used to build the regression were made available by the analyzed distributor and contemplated the three-year horizon from 2016 to 2018. The databases under study were: Database of inspections and pruning; Database of protection and network sectioning; Database of capacity increase; Actions aimed at network robustness; and the List of structuring projects.
According to the state of the art, the importance of research on the optimization of benefits that investment projects bring to the electric power distribution system was verified because it directs the investments more assertively, helping in the decision-making process.
3. Materials and Methods
In this section, the main definitions relating to the power quality theme will be presented, the explanation of the variables contained in the database used, and the proposed methodology for evaluating projects aimed at quality of service using artificial intelligence techniques.
3.1. Quality Indicators of the Electric Power Distribution Service
The continuity indicators of sets of consumer units group the results for a certain region of the electric power distribution concession, or for the entire concession, and represent the average duration and frequency of interruptions perceived by the consumers [
10,
11]. The main indicators are
DEC and
FEC:
DEC: equivalent interruption duration per consumer unit, expressed in hours and hundredths of an hour.
FEC: equivalent frequency of interruption per consumer unit, expressed in the number of interruptions and hundredths of the number of interruptions.
where:
i = index of consumer units served;
Cc = total number of consumer units billed of the set in the period of verification;
DIC(i) = duration of Individual Interruption per consumption unit;
FIC(i) = frequency of Individual Interruption per consumption unit;
3.2. Budget Planning
Module 2 of PRODIST establishes the guidelines and steps for planning the expansion of the distribution system. The electric power distribution system is evaluated annually, according to the technical criteria established by the regulator, and then projects are proposed to solve the problems identified. Many project alternatives have been studied, but due to budget restrictions and technical execution capacity, a methodology is required to evaluate and choose the best project alternatives that generate the best benefits to the system [
12].
Regarding the projects aimed at improving the quality of service, the choice of the best alternatives is made by evaluating the benefits estimated to contribute to the reduction of the collective continuity indicators [
13,
14].
In this context, we present below the main databases and proposed methodology for estimating the DEC and FEC reduction of the structuring project alternatives and the use of ANN and Evolutionary Algorithm techniques to calculate the expected benefit.
3.3. Database Construction
The energy distributor understudy has a large amount of data collected in the field, interruption records, or registry. All this information is recorded in the area and available in the distributor’s systems. The base of interruption records contains the data used to calculate the quality of service indicators and electric planning analyses.
In general, the calculation of the benefit in DEC and FEC is done by applying a reduction percentage (multiplicative factor) to the total values of the indicators in the region covered by the project according to the type of project, without considering the causes of the interruptions. The first investigation was to analyze the capacity of benefits associated with the projects on interruptions according to the causes of the outages [
15].
The list of recorded causes, according to the distribution company understudy, is presented in
Table 1. For example, a reconductoring project can considerably reduce occurrences related to a tree in the network and broken cable but not be effective in occurrences such as equipment failure.
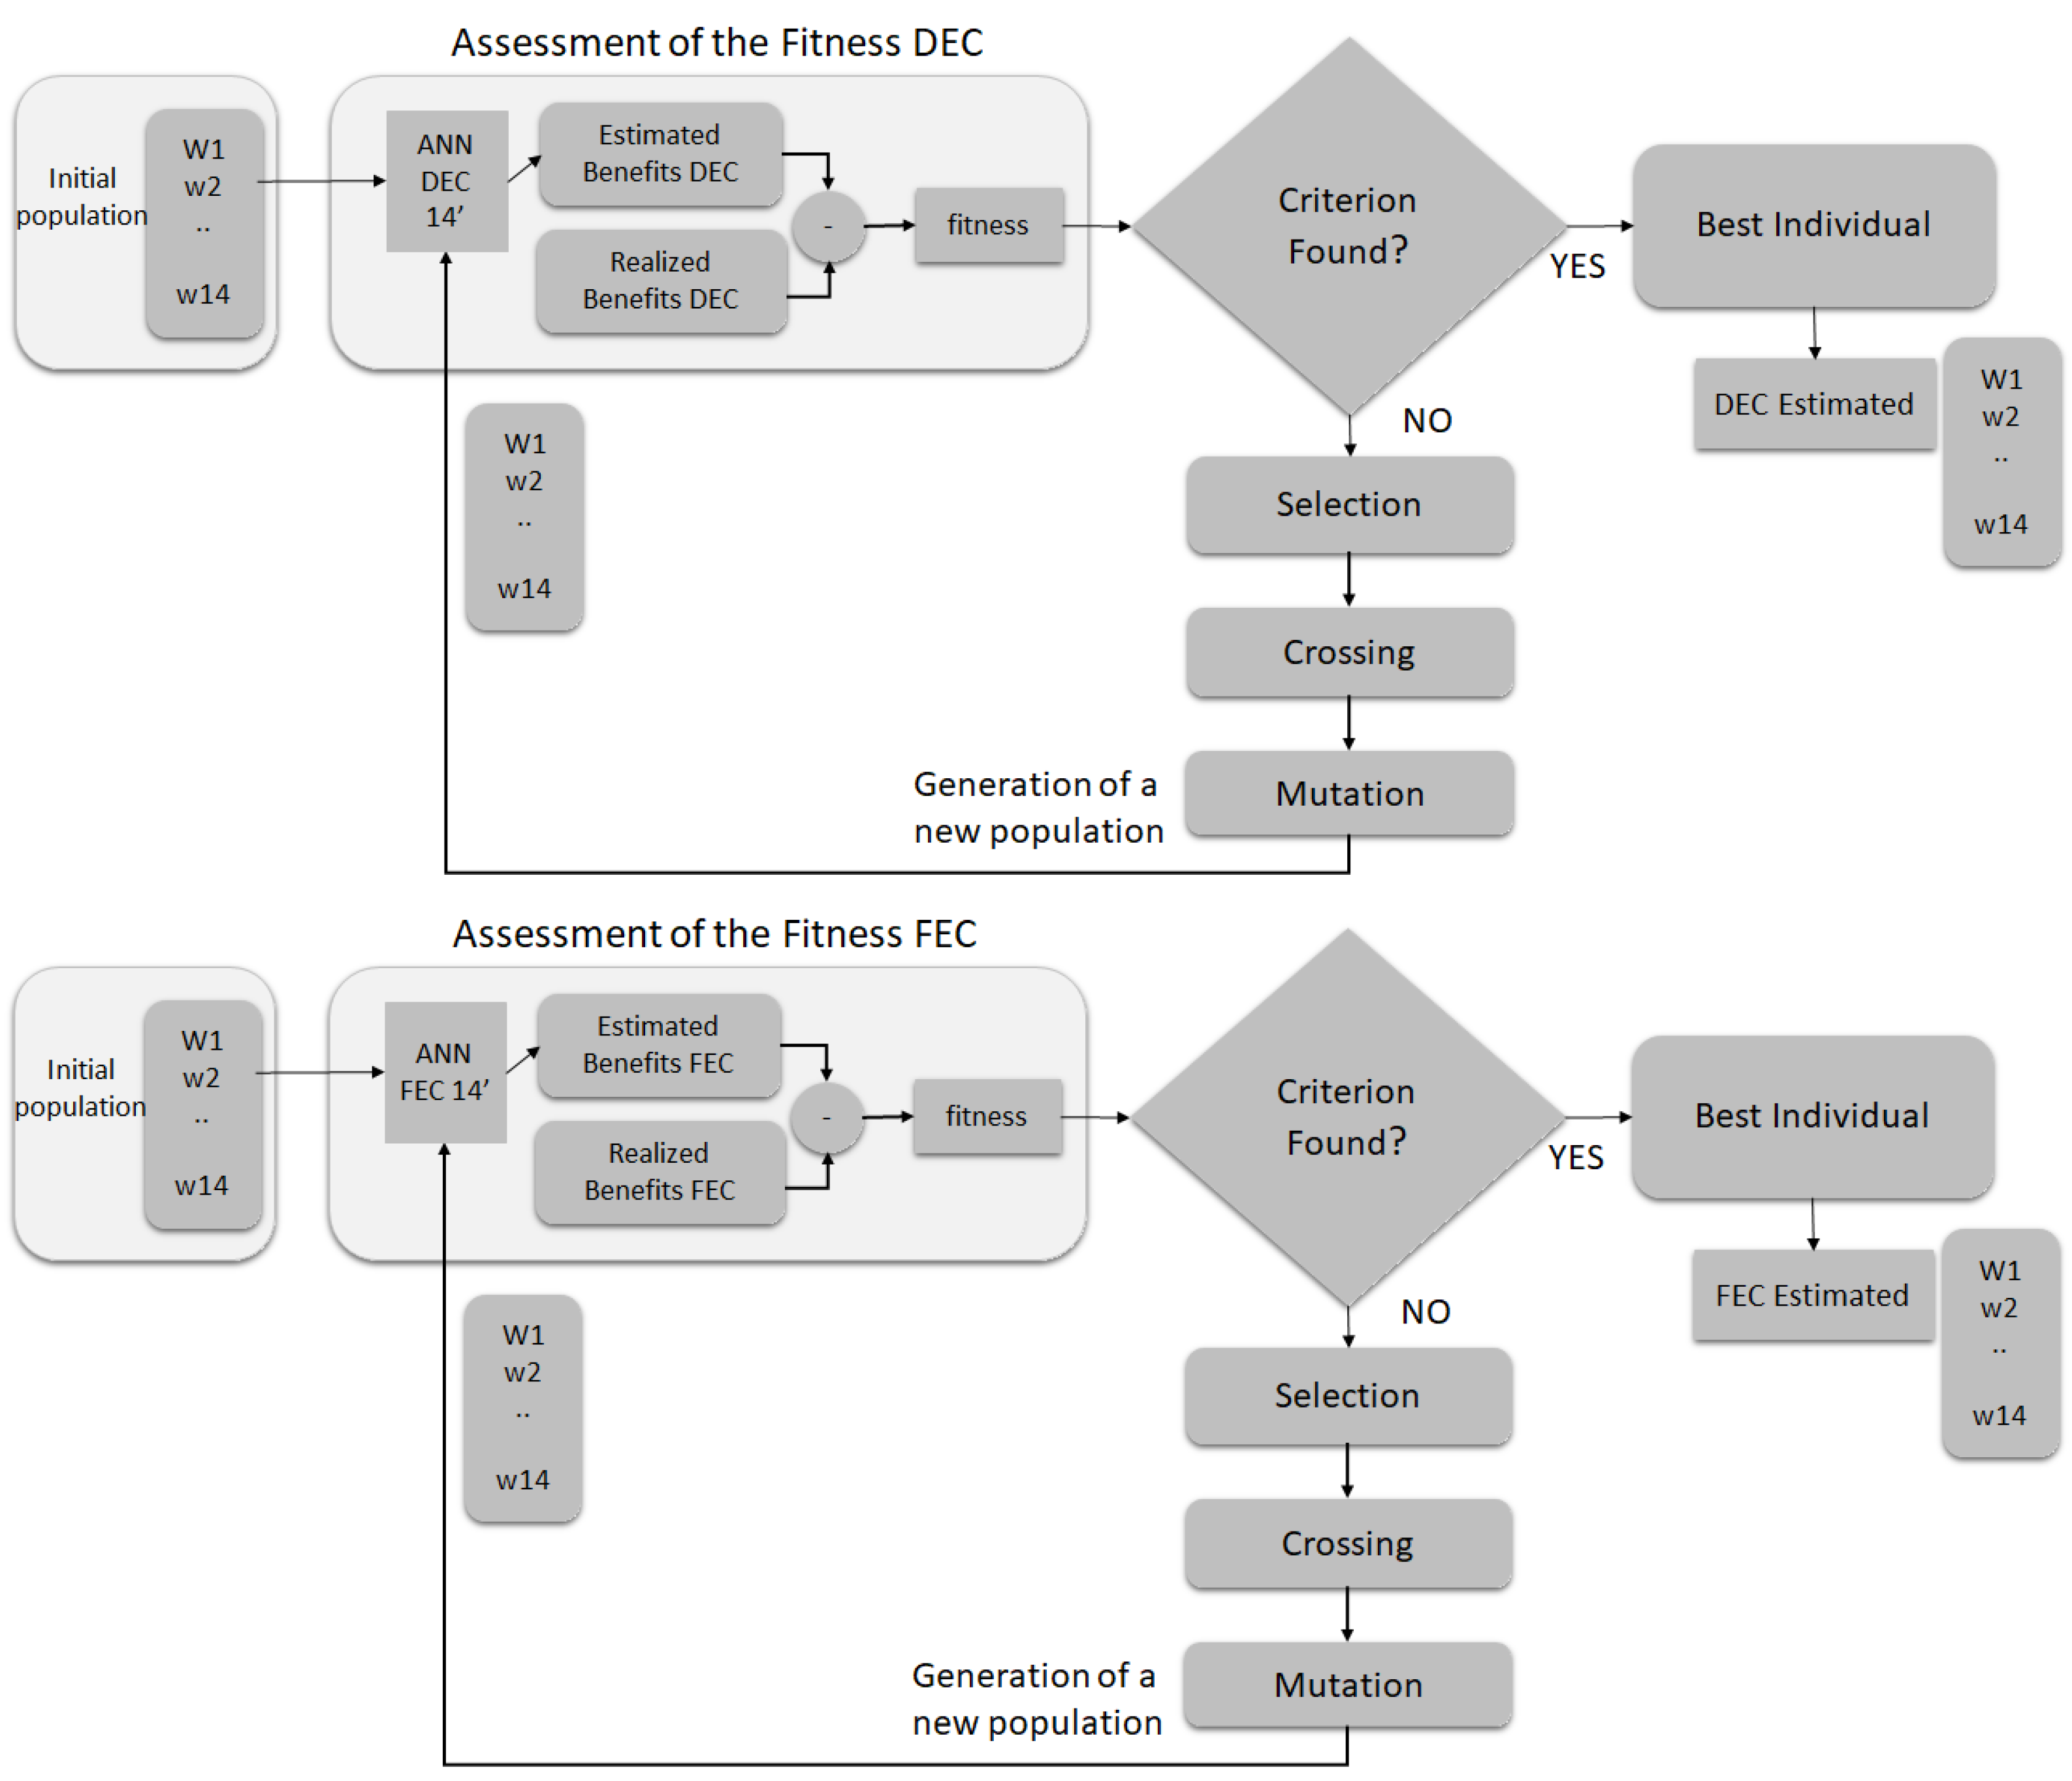
3.4. Structure of the Proposed Methodology
Knowing the problem of planning the benefits of service quality and knowing the databases available for study, the choice of variables and structuring of the proposed methodology that uses artificial neural networks and evolutionary algorithms to predict such benefits began. The proposal presented in this paper follows a structure according to
Figure 1.
The proposed methodology was divided into three stages. This separation was done to present all the steps developed and the results obtained in each phase of the work. The flow chart of the proposed methodology is presented in
Figure 1.
Stage 1 concerns the calculation of the benefit in DEC and FEC realized in the projects. With the base of realized interruptions, the base with the relation of studies of alternatives and interrupting elements, and the base of executed projects, the real gain of the projects in DEC and FEC was determined according to the causes of interruptions.
In Stage 2, an ANN model was evaluated to estimate the benefits associated with the projects according to the causes of interruptions [
16]. The data referring only to the reconductoring projects were analyzed, and due to the small number of projects of this type (6 projects), 1000 random scenarios of multiplicative factors per cause were generated and multiplied by the interruption values of the regions associated with the reconductoring projects understudy to diversify the training base of the ANN model.
Step 3 presents the method for minimizing the error between the realized and estimated values to close the loop and presents the final results of the estimated DEC and FEC values and the multiplicative factors used in new project proposals to obtain the estimated values, as shown in
Figure 1. Evolutionary algorithm techniques were used due to the complexity and non-linearity of the problem.
3.5. Project Benefits Realized
Usually, the distributor does not monitor what the benefit is for the indicators of quality of service delivered after the completion of the project. Therefore, the first analysis made with the available bases was a survey to determine the actual benefit delivered by the projects carried out in recent years. For this, two other bases were used to help this calculation: the electric planning base, with information about the coverage region of the proposed projects according to the 2018 electric planning; and the base with information about the execution and conclusion of the proposed projects for the year 2019 (execution year of the proposed projects in 2018).
Aiming to reduce the uncertainty of the bases and variations in circuit and consumer scenarios over time, it was used throughout the study and the proposed methodology the base of 12 months before the entry of the projects to evaluate the estimated values, since the original base of earnings estimation, from 2017, used in the initial project planning may not reflect the most current scenario of the region of operation of the evaluated projects.
3.6. Application of Artificial Neural Networks
The variables used were the realized DEC and FEC values by causes of interruptions for the 12 months before the entry of the project under study, reconductoring. The inputs were evaluated, and which causes of interruptions are relevant for determining the DEC and FEC outputs. The algorithm for benefit prediction was developed through artificial neural networks, where the choice of parameters was based on the reference [
17].
The artificial neural network topology used was multilayer perceptron (MLP), with the following configurations:
Neural network training with Levenberg–Marquardt;
Overfitting detector;
Number of hidden layers: 2;
Number of neurons in the first hidden layer: 10;
Number of neurons in the second hidden layer: 5;
Maximum number of epochs: 1000;
Target training error: 10−6;
Learning rate: 0.01;
Output normalization factor: 1000;
Activation Function: Logsig.
Starting from the model for calculating benefits in the continuity indicators used by the distributor, in which multiplicative factors are associated with the realized DEC and FEC, 1000 scenarios were created for each project. As illustrated in
Figure 1, in Stage 2, 14 multiplicative factors were defined, each associated with an interruption cause, for the same type of project, reconductoring. The number of scenarios was chosen to represent several DEC and FEC multiplication factors possibilities. The model has 14 inputs, according to the causes, and DEC and FEC as outputs in which the values already include the contribution portions of each cause. With the base composed of 1000 scenarios, 700 scenarios were randomly reserved for model creation and training, while the remaining 300 scenarios were reserved for validation.
3.7. Application of Evolutionary Algorithms
After building the model to estimate the benefits, an optimization technique based on evolutionary algorithms was applied to minimize the mean square error between the realized and estimated benefits in the output of the ANN, as illustrated in
Figure 1—Stage 3. The evolutionary algorithm was used to obtain optimal estimated values for DEC, FEC, and multiplicative factors to be used in the new planning of reconductoring projects.
Each chromosome of the algorithm is formed by a vector with 14 elements, representing the different multiplicative factors for each cause of power supply interruption. Each gene represents the individual value of a multiplicative factor for a specific cause, and the gene value can vary between 0 and 1.
The algorithm was divided into two separate parts, one for DEC values and another for FEC. The multiplicative factor values per cause for DEC and FEC were found separately, as illustrated in
Figure 2. Therefore, we have two fitness:
where C is a constant value. The value set was 10 for the purpose of solving a maximization problem due to the use of the roulette wheel method for selection.
The estimated DEC and FEC values used in the fitness function are the results of the ANN output, where the input was the chromosome of the evolutionary strategy composed of the 14 multiplicative factors. All values generated by the output of each ANN according to each input are evaluated, and the individuals with the best fitness function values receive a more significant weight in the reproduction steps and, therefore, the generation of a new population.
There are two stopping criteria in this proposal: (a) fitness value equal to 10; or (b) a maximum number of generations. The best individual with the best result in the fitness function is chosen at the end of the generation. This individual, both for DEC and FEC, represents the vector of multiplicative factor values used in new project planning.
The evolutionary algorithm was developed with the following parameters based on the reference [
18]:
Number of generations DEC: 100;
Number of FEC generations: 100;
Crossover probability: 0.9;
Mutation probability: 0.25;
Gaussian mutation operator with standard deviation = 0.01;
Population size: 20;
Pair selection: Roulette wheel method;
Population update: Elitism;
For the proposed model, one hundred versions were simulated to obtain average results, considering the random character of the evolutionary algorithm results [
19,
20]. For each simulated version, the average values of the generations of convergence were determined in the estimation of DEC and FEC. The proposed methodology was tested on a larger base of works from an electric power distributor.
4. Results
This section presents the results for each of the three stages as presented in the methodology proposed in
Figure 1. The computational results used a database of interruptions of the energy utility for 2018 and 2019. Initially, a detail of the procedure developed for ascertaining the DEC and FEC benefits realized is carried out, taking into account the case study of the reconductoring projects. Next, two models developed using ANN will be described. Finally, the final results of the proposed methodology, using evolutionary strategy techniques, for new DEC and FEC estimates.
4.1. Calculation of the Benefits Realized from the Projects
Table 2 and
Table 3 present the calculated benefit values of DEC and FEC 12 months before the entry of the projects and 12 months after the execution of the reconductoring projects. Values are subdivided according to interruption causes. All occurrences of the interruption base were accounted for to compose the numbers presented, and the DEC and FEC values refer to the total base of consumers of the company.
The meaning of each result is shown below:
Benefit DEC = DEC Before − DEC After;
DEC Multiplicative Factor = DEC After/DEC Before;
DEC Reduction = 1 − DEC Multiplication Factor
After the reconductoring projects started, we can observe that the DEC reduced by 0.02334145 h and the FEC by 0.06882774, corresponding to a percentage reduction of 54.95 and 40.28%, respectively.
The reduction percentage is constant for DEC and FEC in the current methodology, 70%. In comparison with the realized values, the estimation error by the present method was 33% for DEC and 50% for FEC, considering only the total values.
4.2. Applying ANNs to Build the Benefit Estimation Model (Stage 2)
Fourteen causes of interruptions in the supply of electricity were identified. Regarding the classification of investment projects, there are 12 types of projects. For the base of occurrences of interruptions, there was data corresponding to the interval from 1 January 2018 to 31 December 2020.
Starting from the model for calculating benefits in the continuity indicators in force by the distributor, in which multiplicative factors are associated with the DEC and FEC, 1000 scenarios were created, in which for each scenario, 14 multiplicative factors are defined, each one associated with an interruption cause, for the same project type, reconductoring. The number of scenarios was chosen to represent several DEC and FEC multiplication factors possibilities. The model had 14 inputs, according to the causes, and DEC and FEC as outputs, in which the values already included the contribution portions of each cause, as shown in
Figure 3.
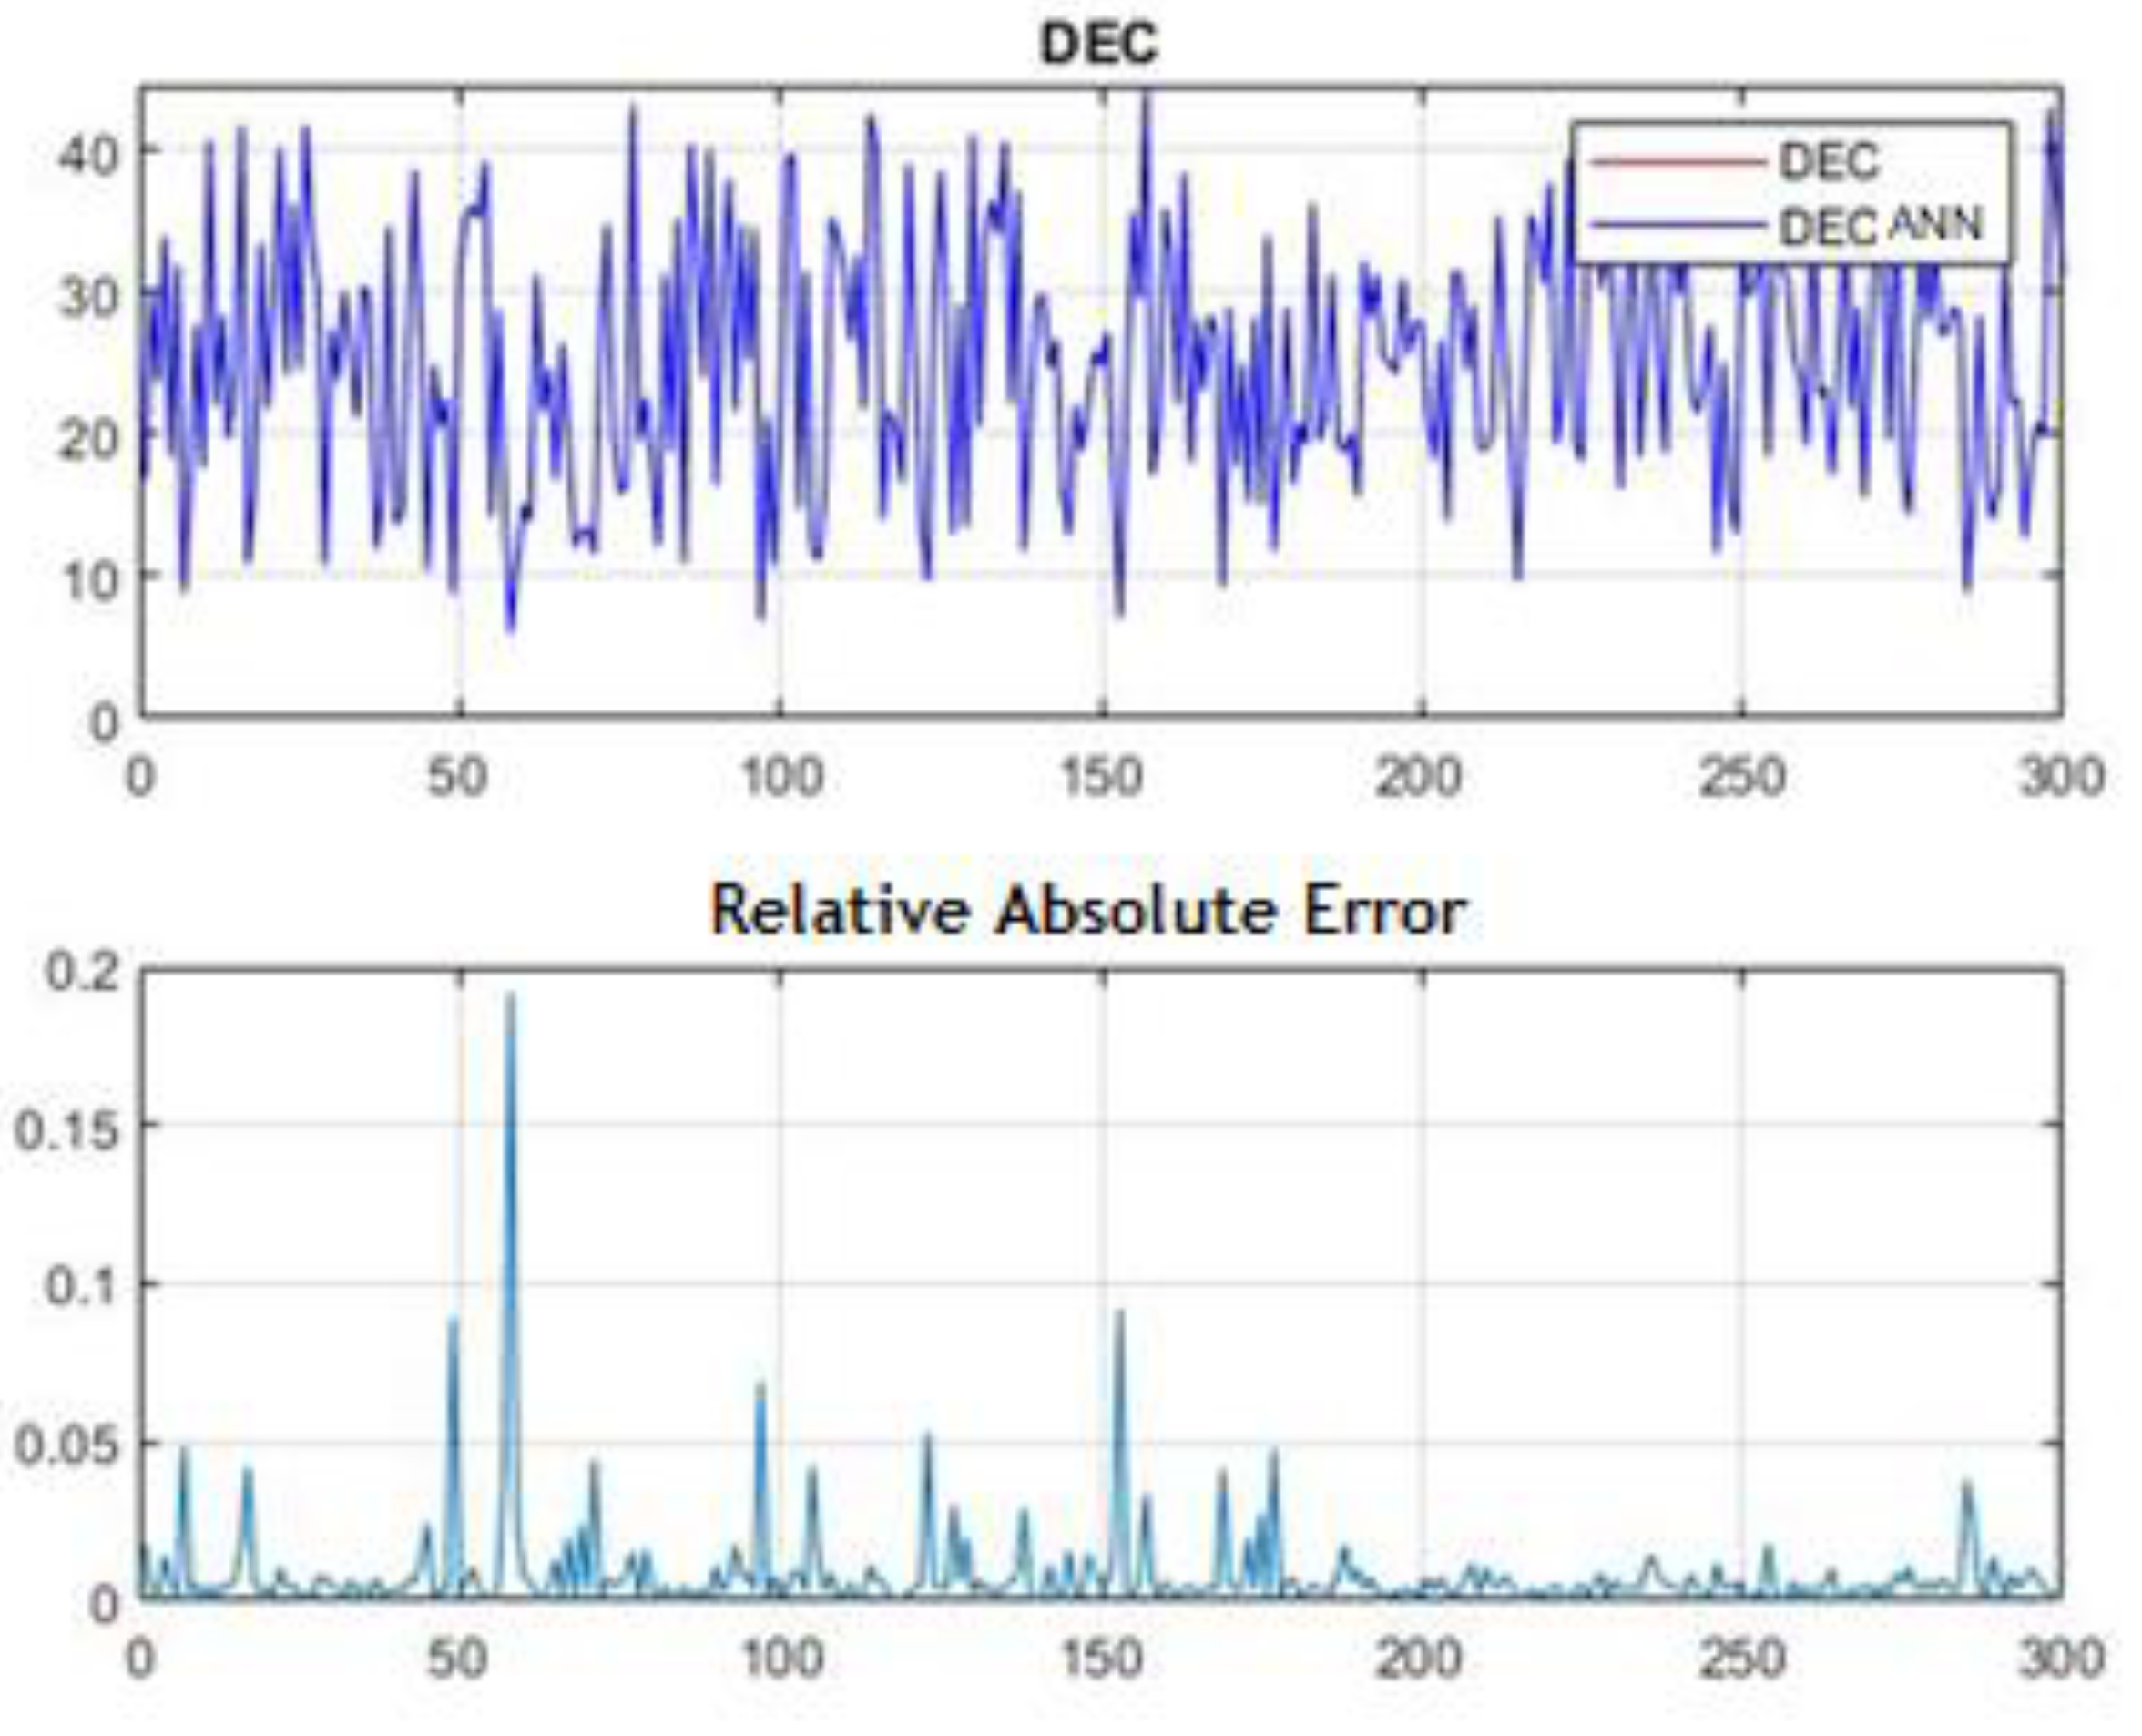
For each output of the ANN model, to compare the actual value and predicted value for the 300 validation scenarios, the MAPE (mean absolute percentage of error) and the MRAE (maximum relative absolute error) were evaluated.
Figure 4 shows the values for the DEC output, the result of the ANN validation and testing, comparing the predicted values with the actual values. The MAPE was 0.0081%, and the MRAE was 0.1919%. This indicates that the ANN model learned satisfactorily, considering the low learning error, considering the test samples for the DEC indicator.
Similarly, for the FEC, the results can be seen in
Figure 5. The MAPE was 0.0074% and the MRAE was 0.1611%. Analogous to the DEC, the FEC learning results showed relative absolute errors close to zero, considered satisfactory for the type of quality of service problem.
The heat map in
Table 4, constructed from the analysis of the correlation coefficient between the inputs (causes) and the outputs (DEC and FEC), shows that for the DEC result, the inputs connection defect, programmed distribution, equipment failure, and others represent a higher index of the correlation coefficient. The same inputs have a high correlation for the FEC. An analysis observed is that entry 9 (cause Other) presented values realized for the last 12 months, and shows a strong correlation for DEC and FEC determination, explained by the significant number of occurrences associated with this cause, a practice that needs to be avoided.
4.3. Applying Evolutionary Algorithms for Benefit Optimization (Stage 3)
For the model, one hundred simulations were performed to obtain average results, given the random effects of the evolutionary strategy.
For each simulated version, the average generations of convergence of the results were determined through the derivative of the estimated DEC and FEC curve when the derivative approached zero.
Figure 6 illustrates the structure of the simulations, where for the ANN model, the evolutionary algorithms are applied separately for DEC and FEC and the multiplication factors are determined. Then the best multiplicative factors found are multiplied with the DEC and FEC values 12 months before the entry of the projects to determine the estimated benefits. Then, the absolute errors are calculated with respect to the realized values of benefits identified in Step 1 of the work. In this diagram, the “*” operator performs element-by-element multiplication.
4.3.1. Results for DEC
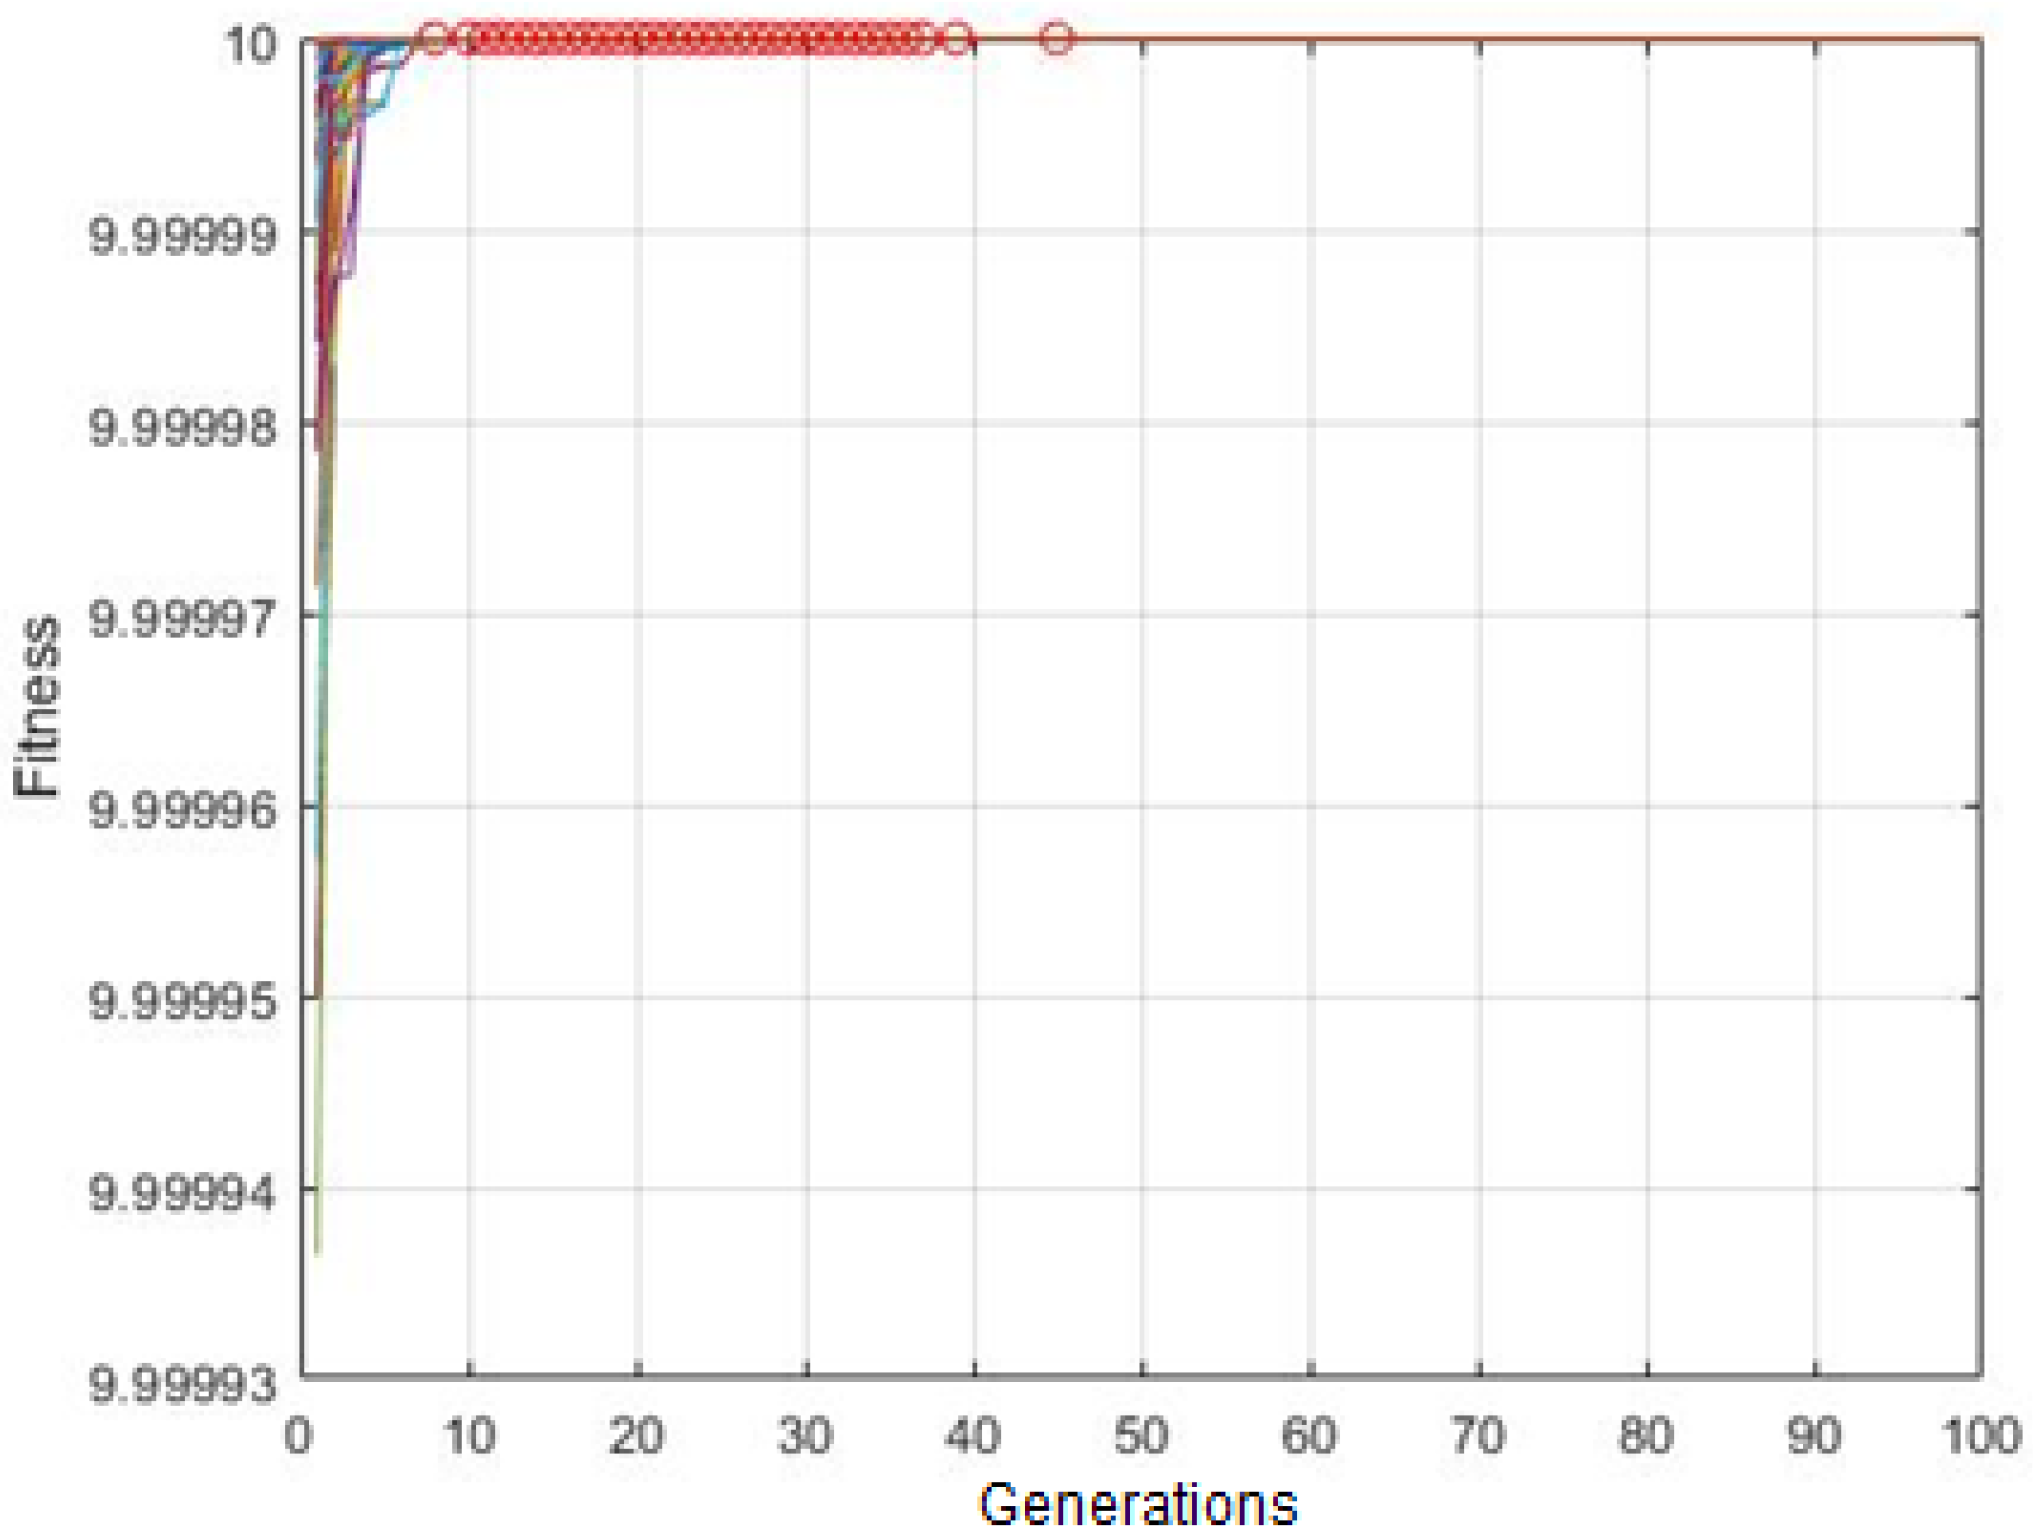
Figure 7 shows the results of the fitness functions for each generation of the evolutionary strategy. Each curve represents the result for each of the 100 simulated versions, illustrated with a different color for each simulation. The markings in the red circle indicate the generation of stability of the result, that is, the point where no matter how many generations were created, the result was stable (converged), around a constant fitness value (value very close to 10, but not exactly). None of the versions did the fitness value exactly match the stopping criterion equal to 10, so the end of each simulation occurred at the end of the total number of generations defined.
After the 100 versions, the average stability generation of the fitness for the evolutionary DEC estimation algorithm was 20.
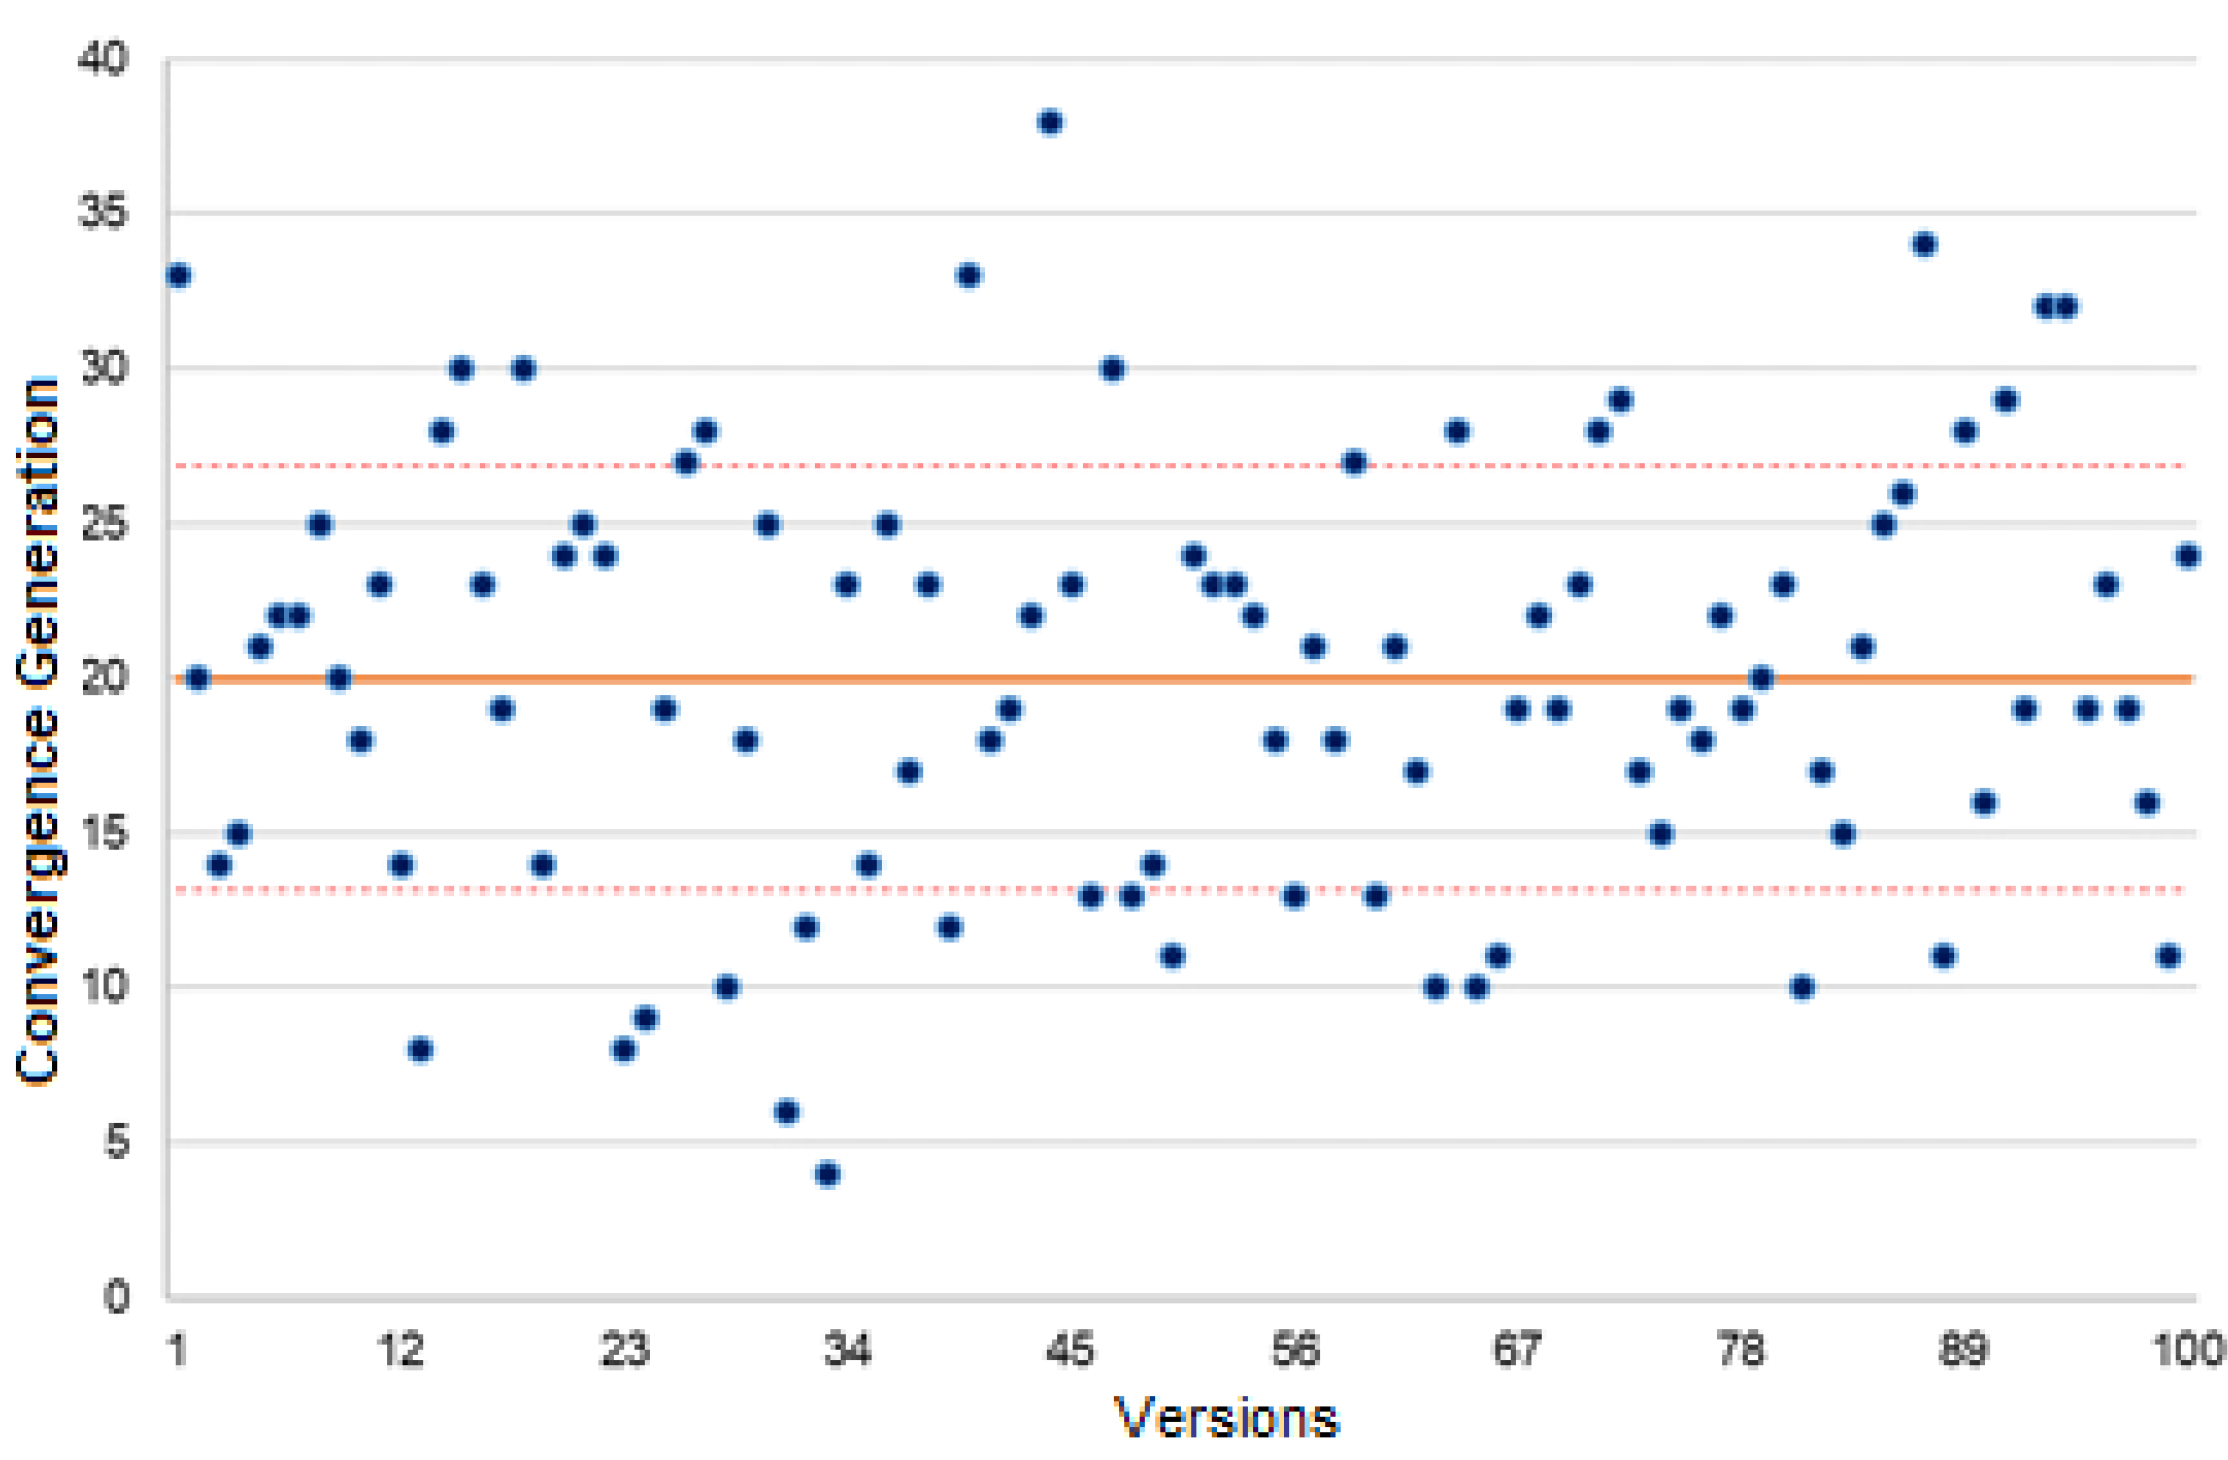
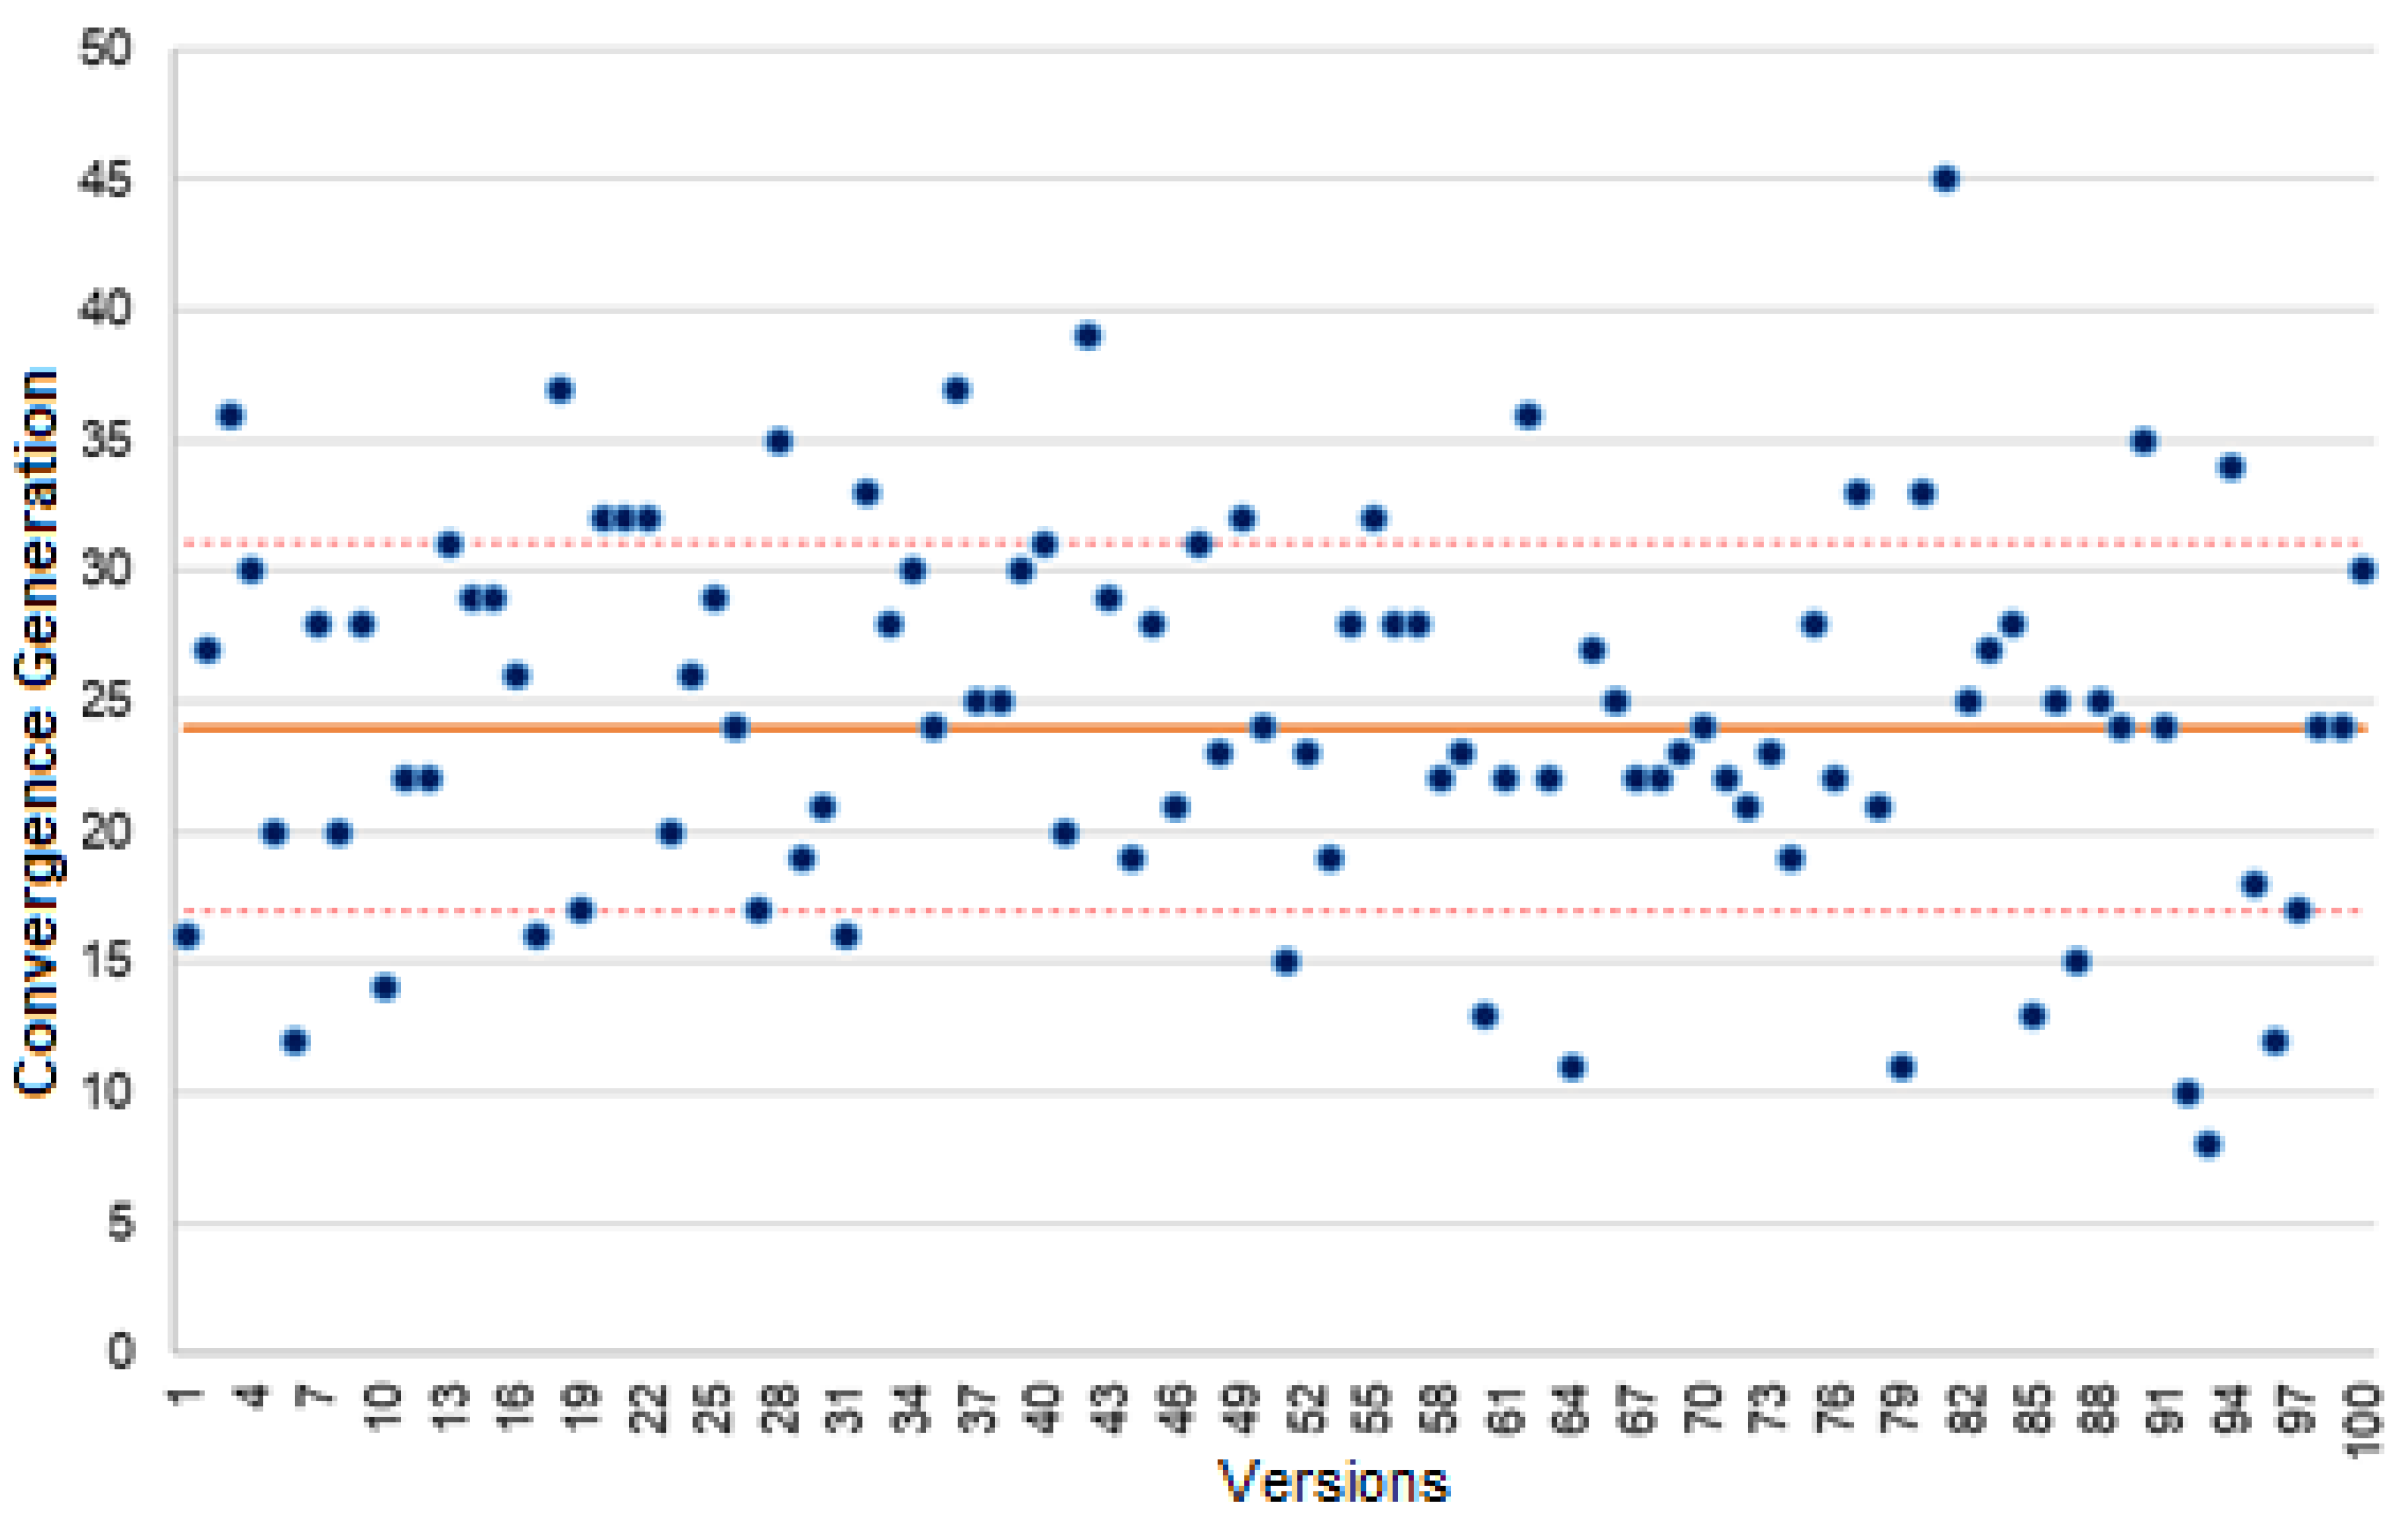
Figure 8 presents a scatter plot where each blue dot represents the convergence generation of each simulated version. The dashed red lines indicate the values of the mean plus or minus the standard deviation of convergence, the range in which 70% of the versions are concentrated.
Figure 9 shows the estimated DEC values for each generation and for each simulated version, illustrated with a different color for each simulation. As can be seen, the DEC values estimated by the genetic algorithm oscillate around the value realized in the first generations of calculation, stabilizing and converging to the value expected as the solution.
Figure 10 shows the values at the end of each simulation of the estimated DEC results. For this model, after each simulation version of the genetic algorithm, the estimated average DEC value was 0.023343559 h.
The relative absolute error for each estimation version is presented in
Figure 11, where the average relative absolute error was 0.0256%, and the maximum relative absolute error identified was 0.3211%. The smallest error was 0.0023%, associated with an estimated DEC value of 0.023341999 h.
4.3.2. Results for FEC
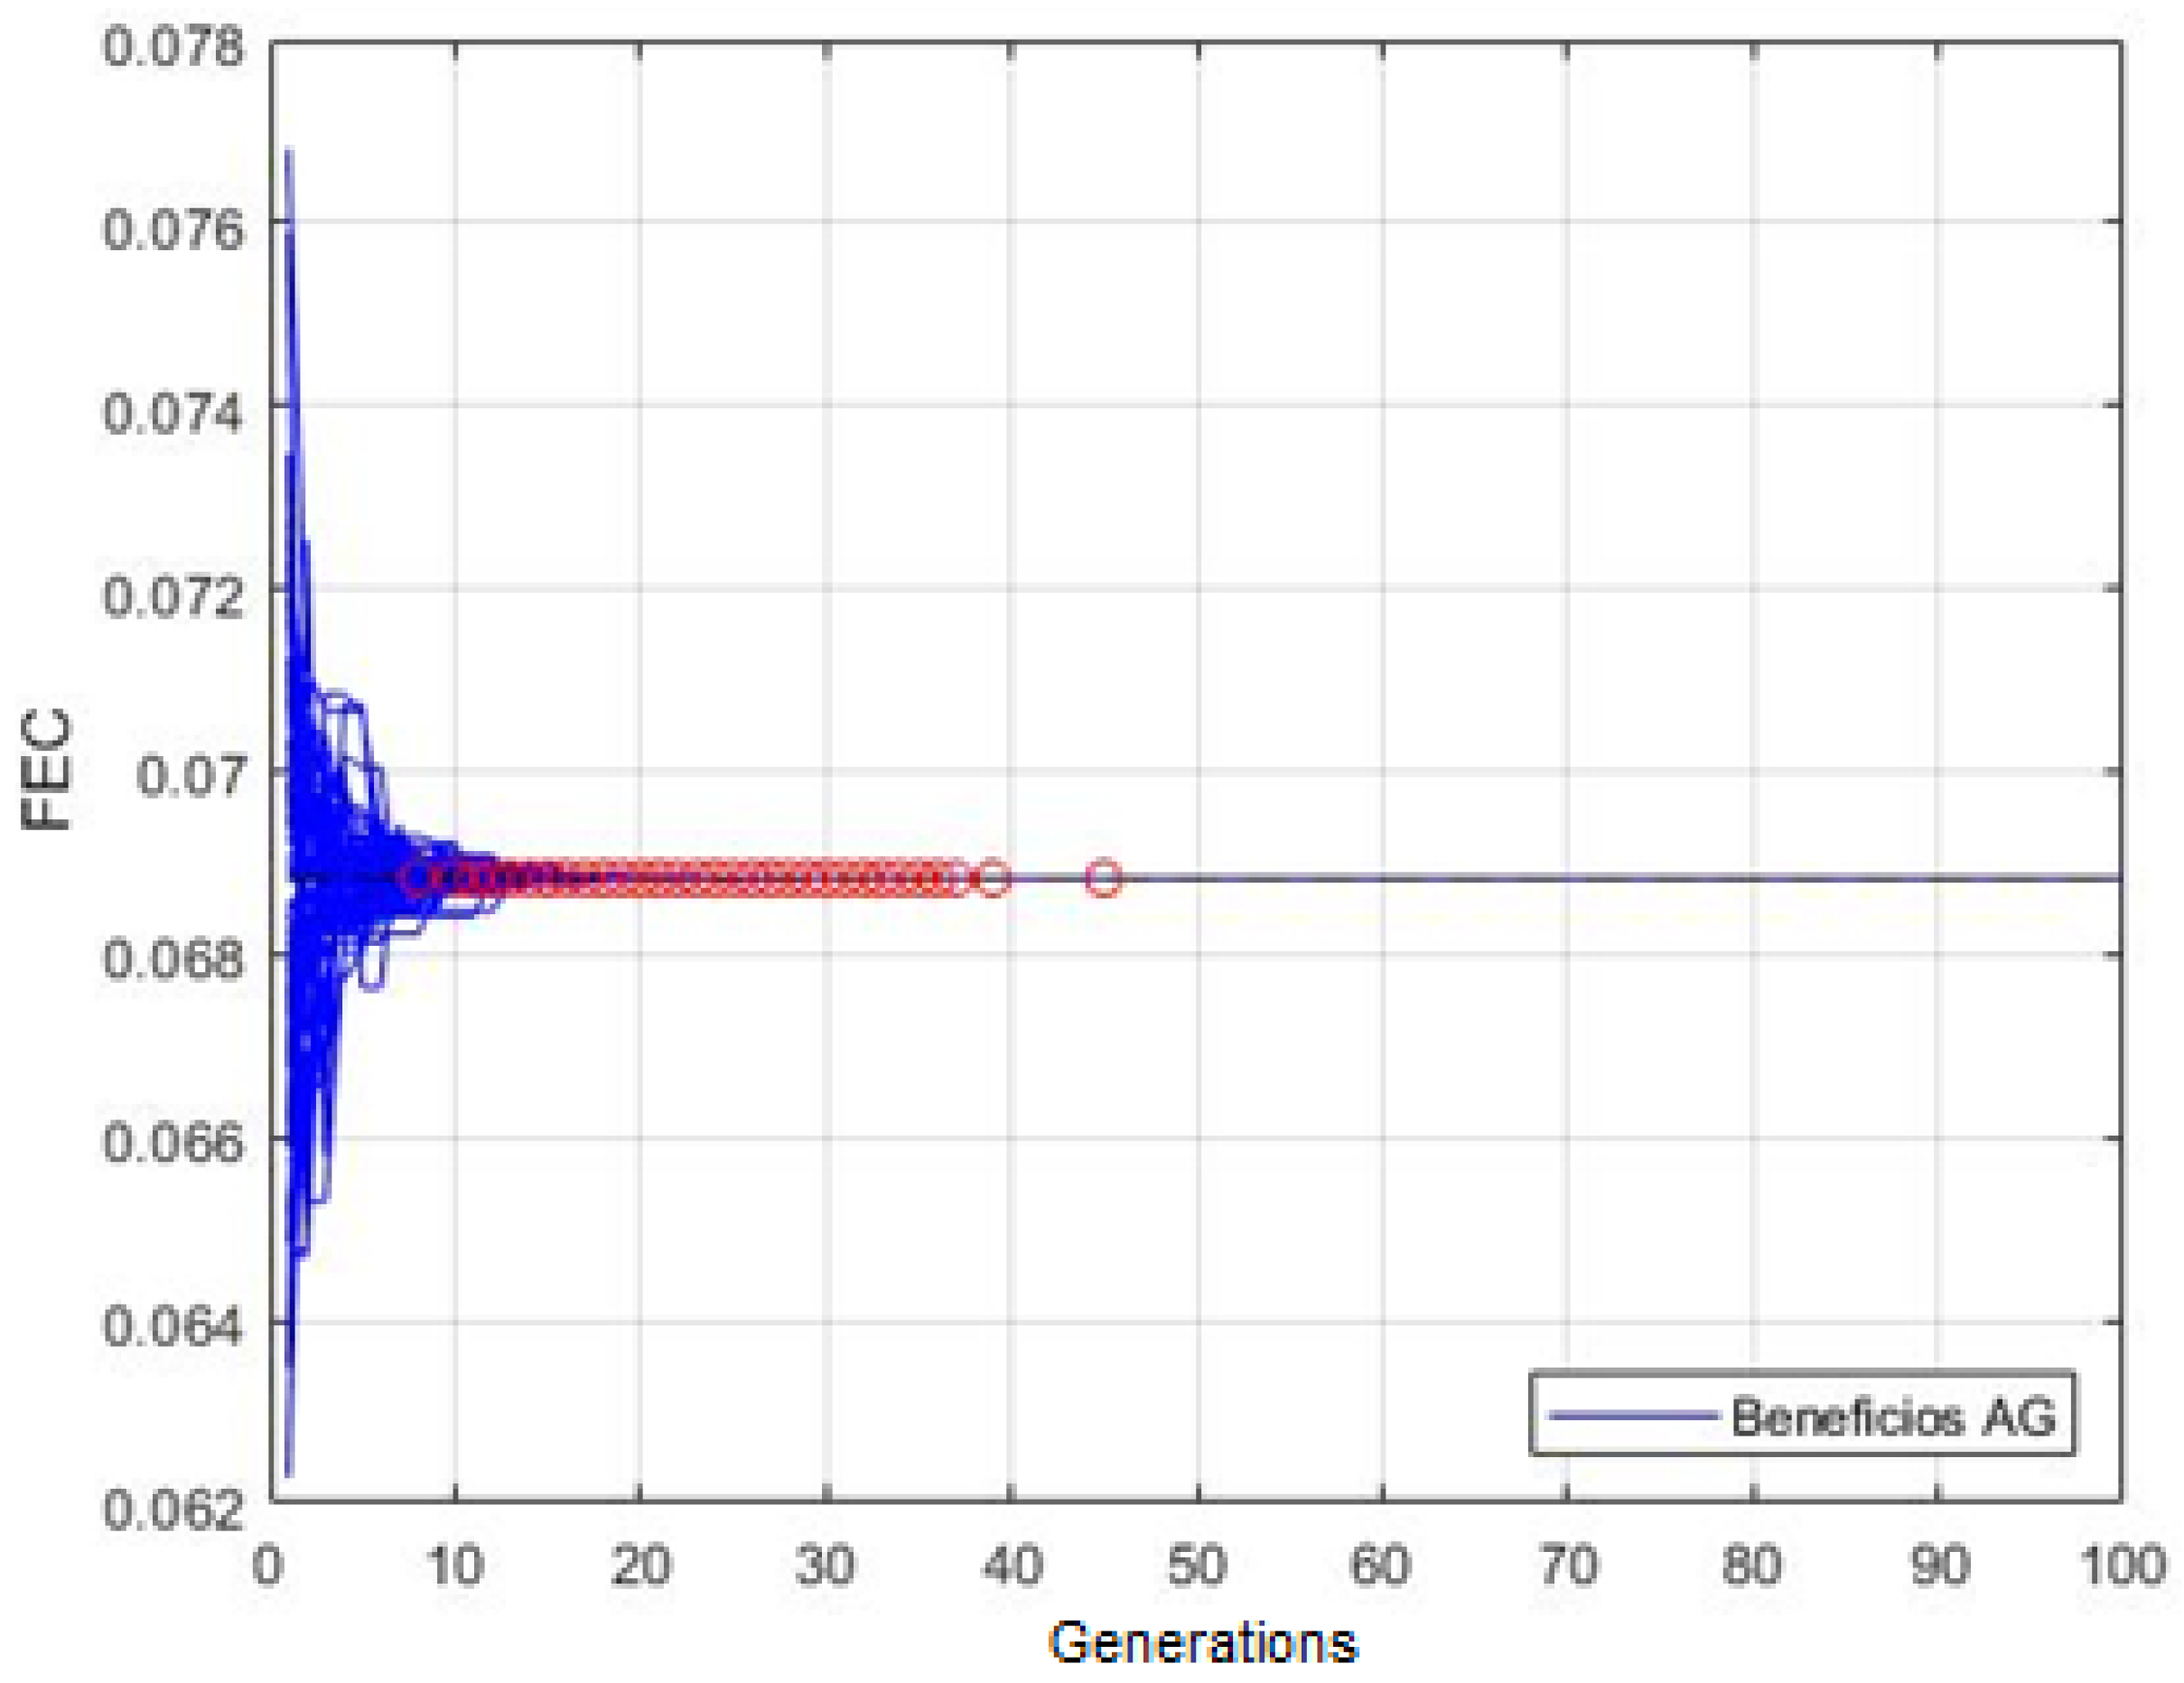
As for the DEC, the estimation of the FEC through the FEC presented results with lower errors compared to the error values determined using the current methodology for calculating benefits. In
Figure 12, the fitness curves converge to constant values with fewer generations, illustrated with a different color for each simulation.
As shown in
Figure 13, the average convergence generation after the 100 simulation versions was generation 24, with the maximum generation being generation 45 (the blue color). The dashed red lines indicate the values of the mean plus or minus the standard deviation of convergence, the range in which 70% of the versions are concentrated. This indicates that the genetic algorithm converges quickly, regardless of the simulation version, even though each version starts from a different initial random population and with various randomnesses in the process.
The curve of estimated FEC values by generation and version presents a behavior similar to the DEC curve, as shown in
Figure 14, illustrated with a different color for each simulation. Again the result oscillates around the actual value until converging to values close to the real FEC value.
Figure 15 shows the values at the end of each simulation of the estimated FEC results. For this model, the average estimated FEC value was 0.068828860 times.
The relative absolute error for each estimation version is presented in
Figure 16, where the average relative absolute error was 0.0089%, and the maximum relative absolute error identified was 0.1704%. The smallest error was 0.0023%, associated with an estimated FEC value of 0.068827217 times.
Table 5 presents the consolidated results after the 100 simulations using the evolutionary algorithms for estimating the DEC and FEC benefits for the reconductoring projects. For the results for the MAPE and MRAE, the minimum errors were well below the errors identified using the current DEC and FEC benefit calculation method (33% for DEC and 50% for FEC).
As a result of the methodology, the multiplication factors associated with each cause of interruption were identified, which multiplied by the realized DEC and FEC values before the entry of the project will result in the estimated DEC and FEC benefit values.
At the end of the simulations and the estimated DEC and FEC results, the multiplication factors by cause values were also extracted, which is the best individual of the last population at the end of each simulation. The multiplicative factors associated with DEC and FEC were selected for the simulation version that generated the lowest error.
For the results presented in
Table 6 and
Table 7, the multiplication factors found were applied to the realized DEC and FEC values in the input region of the projects to obtain the estimated DEC and FEC benefit values and compared with the actual benefit to determine the errors.
In the columns DEC Error and FEC Error, the results obtained by this multiplication are compared with the actual values obtained after the project’s input, simulating the error of using the method in the distributor. The absolute relative error obtained for the DEC was 0.3170%, and for the FEC, 0.3678% values compared to the total realized values. The error obtained by the current method was 33% for DEC and 50% for FEC. Therefore, the results obtained by the methodology proposed in this work for estimating the DEC and FEC reduction of the reconductoring projects were, on average, 100 times smaller than the current methodology.
5. Conclusions
In this work, topics related to the electrical planning of the energy distribution network and service quality indicators were studied. The challenges of predicting the benefits that investment projects contribute to improving service quality indicators were also presented. With the accomplishment of the bibliographic review, it is possible to verify that, despite the advances in the use of artificial neural networks for planning DEC and FEC indicators, the results are not detailed. Little evaluation of real scenarios was verified for the determination of the values of the indicators.
The first contribution to be highlighted from this work is the organization and structuring of the distributor’s databases so that it is possible to estimate the actual gain that the investment projects contributed to the reduction of the continuity indicators DEC and FEC, comparing the result with the values that had been planned. Given the long observation time for estimating the projects’ realized gain, the results are subject to many disturbances, such as load variations in the circuits under analysis, weather conditions, etc.
The structuring of the methodology for calculating the benefits based on the causes of supply interruptions is a relevant contribution since the distributor understudy does not analyze the influence of the causes according to the type of project being studied. According to preliminary models’ preliminary results, different causes contribute to the predicted DEC and FEC results for every kind of project. Regarding reconductoring projects, the errors referring to the proposed methodology (0.3170% for DEC and 0.3678% for FEC) are 100 times smaller than the errors observed using the current method (33.0% for DEC and 50% for FEC).
As complementary contributions, one can highlight the study of artificial intelligence techniques, such as artificial neural networks and evolutionary strategy, to aid network planning and support decision making since they are methods that consider several input variables and how these inputs relate to determining the desired outputs.
In future work, the results of the multiplicative factors will be applied to a new planning base for the company, and estimates will be made for new projects so that it will be possible to follow the benefits realized results and validate the proposed benefits methodology. In addition, the method should be extended to other types of projects, enabling the prediction of benefits not only for reconductoring projects. It is also possible to perform cluster analysis to determine multiplicative factors for regions with similar circuit and load characteristics.
Author Contributions
Conceptualization, methodology, formal analysis, and writing—original draft preparation: B.J.S.d.S. and J.M.M.V. All authors have read and agreed to the published version of the manuscript.
Funding
Federal University of Paraiba. Internal call PROPESQ/UFPB No 01/2022. Support Program for Scientific Production in the Postgraduate Graduation of UFPB Pro-Publishing.
Institutional Review Board Statement
Not applicable.
Informed Consent Statement
Not applicable.
Data Availability Statement
Data sharing not applicable or no new data were created or analyzed in this study. Data sharing is not applicable to this article.
Acknowledgments
The authors would like to thank the Postgraduate Program in Electrical Engineering of UFPB and Applied Computational Intelligence Group (GICA), for the financial and material support in the development of this work.
Conflicts of Interest
The authors declare no conflict of interest.
Abbreviations
The following abbreviations are used in this manuscript:
| ANEEL | National Electric Energy Agency |
| ANN | artificial neural network |
| DEC | equivalent interruption duration per consumption unit |
| DIC | duration of individual interruption per consumption unit |
| DICRI | duration of individual interruption occurred on a critical day per consumption unit |
| DMIC | maximum duration of continuous interruption per consumption unit |
| MRAE | maximum relative absolute error |
| FEC | equivalent frequency of interruption per consumption unit |
| FIC | frequency of individual interruption per consumption unit |
| MAPE | mean absolute percentage of error |
| MISO | multiple input, single output |
| MLP | multilayer perceptron |
| MLR | multiple linear regression |
| MLRA | multiple linear regression analysis |
| MODWT | maximal overlap discrete wavelet transform |
| PRODIST | Procedures of Electric Energy Distribution in the National Electric System |
References
- IBGE. Households and Residents with Electricity, by Source of Electricity. 2019. Available online: https://sidra.ibge.gov.br/tabela/6737 (accessed on 1 June 2021).
- Aneel. Regulatory Agency. Normative Resolution No. 842, of December 26 2018. In Procedures for the Distribution of Electricity in the National Electric System (PRODIST), Module 1; Regulatory Agency: Brasília, Brazil, 2018. [Google Scholar]
- Junior, J.A.A. Model for Prediction of Continuity Indicators in an Electric Power Distribution System, an Application to Maintenance Management with the Perspective of the Use of Thermography. Master’s Thesis, Federal University of Bahia, Salvador, Brazil, 2017. [Google Scholar]
- Almeida, R.S.; Colares, A.C.V.; Lamounier, W.M.; Mário, P.C. Quality of service, consumer satisfaction and financial performance of Brazilian electricity distribution companies. In Proceedings of the XVII Brazilian Congress of Costs, Belo Horizonte, Brazil, 3–5 November 2010. [Google Scholar]
- Aneel. Service Quality. 2021. Available online: http://www.aneel.gov.br/qualidade-do-servico2 (accessed on 1 June 2021).
- Magalhães, E.F.A. Auxiliary Tool for Maintenance in Electricity Distribution Networks. Master’s Thesis, Federal University of Bahia, Escola Politécnica, Salvador, Brazil, 2017. [Google Scholar]
- Ferreira, V.H.; Oliveira, L.B.; Pinho, A.C.; Henriques, H.O.; Fortes, M.Z.; Nunes, F.A.; Pose, A.C.A.; Oliveira, R.B. Analysis of the Impact of Maintenance Actions on Continuity Indicators in Distribution Networks Using Machine Learning and Regression with Panel Data. Brazilian Symposium on Electrical Systems. 2020, Volume 1. Available online: www.sba.org.br/open_journal_systems/index.php/sbse/article/view/2160/1876 (accessed on 1 June 2021).
- Louback, F.O.; Mattos, J.B.; Louback, K.A.C.; Simonetti, D.S.L.; Batista, O.E. Forecasting Indicators of Continuity of Electricity from the Application of the Method of Artificial Neural Networks. Brazilian Congress of Automatica. 2018, Volume 1. Available online: www.sba.org.br/open_journal_systems/index.php/cba/article/view/430/393 (accessed on 1 June 2021).
- Dias, E.B. Assessment of Continuity Indicators and their Impact on Distribution Systems Planning. Master’s Thesis, University of São Paulo, Sao Paulo, Brazil, 2002. [Google Scholar]
- Castro, N.J.; Ferreira, D.; Castro, G.; Sampaio, A. Quality of Electricity Supply: Regulatory Aspects and Perspectives; Discussion Text of the Electricity Sector; n. 76; Study Group of the Electric Sector of the Federal University of Rio de Janeiro: Rio de Janeiro, Brazil, 2017. [Google Scholar]
- Detrich, V.; Skala, P.; Spaeek, Z.; Blazek, V. Regulation of the Electricity Supply Continuity and Decision Making of Distribution Companies about Measures to Be Undertaken in the Network. In Proceedings of the 2007 9th International Conference on Electrical Power Quality and Utilization, Barcelona, Spain, 9–11 October 2007; pp. 1–5. [Google Scholar] [CrossRef]
- Andrade, M.N.; Cossi, A.M. Integrated Planning of Electricity Distribution Networks, Brazilian Symposium on Electrical Systems. 2010. Available online: www.swge.inf.br/anais/sbse2012/PDFS/ARTIGOS/95897.PDF (accessed on 1 June 2021).
- Göynüer, h.; Dindar, B.; Gül, O. A Comparative Study on the Impact of Different Grid Structures in Case of Electricity Interruption on Supply Continuity Indicators. In Proceedings of the 2019 7th International Istanbul Smart Grids and Cities Congress and Fair (ICSG), Istanbul, Yurkey, 25–26 April 2019; pp. 61–65. [Google Scholar] [CrossRef]
- Messiah, R.; Pinto, S. Predictive assessment of power continuity indicators. In Proceedings of the 22nd International Conference and Exhibition on Electricity Distribution (CIRED 2013), Stockholm, Sweden, 10–13 June 2013; pp. 1–3. [Google Scholar] [CrossRef] [Green Version]
- Barros, A.F.A. Analysis of the Main Causes of Discontinuity in Electricity Supply and their Impacts on Quality Indicators. Bachelor’s Thesis, Electrical Engineering, Federal University of Rio de Janeiro, Rio de Janeiro, Brazil, 2020. [Google Scholar]
- Kopiler, A.A.; Silva, V.N.A.L.; Oliveira, L.A.A.; Linden, R.; Silva, L.R.A.A.; Fonseca, B.L.C. Artificial Neural Networks and their applications in the electrical sector. Rev. De. Eng. Da. Fac. Sales 2019, 9, 27–33. [Google Scholar]
- Haykin, S. Neural Networks: Principles and Practice; Bookman: Porto Alegre RS, Brazil, 2001. [Google Scholar]
- Michalewicz, Z. Genetic Algorithms + Data Structures = Evolution Programs, 3rd ed.; Springer: Berlin/Heidelberg, Germany, 1996. [Google Scholar]
- Cyrillo, I.O. Establishment of Electricity Distribution Quality Goals by Optimizing the Network and the Tariff Level. Master’s Thesis, Polytechnic School of the University of São Paulo, Sao Paulo, Brazil, 2011. [Google Scholar]
- Araújo, R.J.P.; Strauch, M.T.; Kagan, N. Optimization of distribution systems continuity indicators using immunological artificial algorithms. In Proceedings of the 2010 IEEE/PES Transmission and Distribution Conference and Exposition: Latin America (T&D-LA), Sao Paulo, Brazi, 8–10 November 2010; pp. 875–882. [Google Scholar] [CrossRef]
Figure 1.
Proposed methodology for evaluating the quality of service projects.
Figure 1.
Proposed methodology for evaluating the quality of service projects.
Figure 2.
Population and generations of the evolutionary strategy.
Figure 2.
Population and generations of the evolutionary strategy.
Figure 3.
Inputs and outputs of the ANN model.
Figure 3.
Inputs and outputs of the ANN model.
Figure 4.
ANN DEC model output.
Figure 4.
ANN DEC model output.
Figure 5.
ANN FEC model output.
Figure 5.
ANN FEC model output.
Figure 6.
Structure of the simulations and expected results.
Figure 6.
Structure of the simulations and expected results.
Figure 7.
Fitness for the DEC.
Figure 7.
Fitness for the DEC.
Figure 8.
Average generation convergence for DEC.
Figure 8.
Average generation convergence for DEC.
Figure 9.
Estimated DEC values per generation.
Figure 9.
Estimated DEC values per generation.
Figure 10.
Estimated final DEC values.
Figure 10.
Estimated final DEC values.
Figure 11.
Relative absolute error DEC.
Figure 11.
Relative absolute error DEC.
Figure 12.
Fitness for the FEC.
Figure 12.
Fitness for the FEC.
Figure 13.
Average generation convergence for FEC.
Figure 13.
Average generation convergence for FEC.
Figure 14.
Estimated FEC values per generation.
Figure 14.
Estimated FEC values per generation.
Figure 15.
Estimated final FEC values.
Figure 15.
Estimated final FEC values.
Figure 16.
Relative absolute error FEC.
Figure 16.
Relative absolute error FEC.
Table 1.
Causes of Interruptions.
Table 1.
Causes of Interruptions.
| Causes of Interruptions |
|---|
| Tree in the network |
| Broken or deteriorated cable |
| Connection defect |
| Insulator defect |
| Programmed distribution |
| Equipment failure (line/network) |
| Natural phenomena |
| Ignored |
| Others |
| Broken/damaged poles |
| Third parties |
| Unscheduled transmission |
| Transmission scheduled |
| Consuming unit |
Table 2.
Calculated benefits of DEC.
Table 2.
Calculated benefits of DEC.
| Causes of Interruptions | Realized |
|---|
| Benefits DEC | %Redution DEC | Fator Mult. DEC |
|---|
| Tree in the network | - | 0 | 0 |
| Broken or deteriorated cable | - | 0 | 0 |
| Connection defect | 0.005309 | 17.25% | 0.827426 |
| Insulator defect | 0.000929 | 0 | 1 |
| Programmed distribution | 0.006122 | 3.19% | 0.968097 |
| Equipment failure (line/network) | 0.003990 | 48.07% | 0.519224 |
| Natural phenomena | - | 0 | 0 |
| Ignored | - | 0 | 0 |
| Others | 0.003501 | 87.00% | 0.129995 |
| Broken/damaged poles | - | 0 | 1 |
| Third parties | - | 0 | 1 |
| Unscheduled transmission | 0.0030531 | 1.38% | 0.986143 |
| Transmission scheduled | 0.000436 | 0 | 1 |
| Consuming unit | - | 0 | 0 |
| Total | 0.023341 | 54.95% | 0.450465 |
Table 3.
Calculated benefits of FEC.
Table 3.
Calculated benefits of FEC.
| Causes of Interruptions | Realized |
|---|
| Benefits FEC | %Redution FEC | Mult. Factor FEC |
|---|
| Tree in the network | - | 0 | 0 |
| Broken or deteriorated cable | - | 0 | 0 |
| Connection defect | 0.003149 | 39.37% | 0.606288 |
| Insulator defect | 0.000880 | 0 | 1 |
| Programmed distribution | 0.003842 | 11.24% | 0.887540 |
| Equipment failure (line/network) | 0.008457 | 20.13% | 0.798657 |
| Natural phenomena | - | 0 | 0 |
| Ignored | - | 0 | 0 |
| Others | 0.038177 | 51.72% | 0.482724 |
| Broken/damaged poles | - | 0 | 0 |
| Third parties | - | 0 | 0 |
| Unscheduled transmission | 0.009085 | 8.62% | 0.913712 |
| Transmission scheduled | 0.005235 | 0 | 1 |
| Consuming unit | - | 0 | 0 |
| Total | 0.068827 | 40.28% | 0.597154 |
Table 4.
The heat map of DEC and FEC.
Table 4.
The heat map of DEC and FEC.
| Causes of Interruptions | DEC | FEC |
|---|
| Tree in the Network | 0.03223 | 0.02686 |
| Broken or deteriorated cable | 0.01732 | 0.02851 |
| Connection Defect | 0.19927 | 0.04838 |
| Insulator Defect | 0.00881 | 0.02379 |
| Programmed Distribution | 0.21831 | 0.05569 |
| Equipment Failure (Line/Network) | 0.25136 | 0.12741 |
| Natural Phenomena | 0.00243 | 0.00352 |
| Ignored | 0.02588 | 0.03728 |
| Others | 0.91255 | 0.97961 |
| Broken/Damaged Poles | 0.02449 | 0.02045 |
| Third Parties | 0.00897 | 0.00341 |
| Unscheduled Transmission | 0.10790 | 0.11694 |
| Transmission Scheduled | 0.01119 | 0.06209 |
| Consuming Unit | 0.01221 | 0.01541 |
Table 5.
Result of the proposed methodology for DEC and FEC.
Table 5.
Result of the proposed methodology for DEC and FEC.
| Evolutionary Algorithm | DEC | FEC |
|---|
| MAPE | 0.0256% | 0.0089% |
| EARM | 0.3211% | 0.1704% |
| Minimal error | 0.0023% | 0.0008% |
| Estimated value | 0.023341 | 0.068827 |
Table 6.
Result of the DEC Proposed Methodology.
Table 6.
Result of the DEC Proposed Methodology.
| Causes of Interruptions | Proposed Methodology |
|---|
| Mult. Factor DEC | Estimated Benefits DEC | Error DEC |
|---|
| Tree in the network | 0.734711 | 0 | |
| Broken or deteriorated cable | 0.284956 | 0 | |
| Connection defect | 0.820461 | 0.005264 | 1% |
| Insulator defect | 0.516553 | 0.000479 | 48% |
| Programmed distribution | 0.301531 | 0.001907 | 69% |
| Equipment failure (line/network) | 0.247555 | 0.001902 | 52% |
| Natural phenomena | 0.739324 | 0 | |
| Ignored | 0.248773 | 0 | |
| Others | 0.451032 | 0.012145 | −247% |
| Broken/damaged poles | 0.047346 | 0 | |
| Third parties | 0.210471 | 0 | |
| Unscheduled transmission | 0.409241 | 0.001267 | 59% |
| Transmission scheduled | 0.860469 | 0.000375 | 14% |
| Consuming unit | 0.454079 | 0 | |
| Total | 0.451893 | 0.023415 | 0.3169% |
Table 7.
Result of the FEC proposed methodology.
Table 7.
Result of the FEC proposed methodology.
| Causes of Interruptions | Proposed Methodology |
|---|
| Mult. Factor FEC | Estimated Benefits FEC | Error FEC |
|---|
| Tree in the network | 0.320745 | 0 | |
| Broken or deteriorated cable | 0.409348 | 0 | |
| Connection defect | 0.776821 | 0.004034 | −28% |
| Insulator defect | 0.771147 | 0.000678 | 23% |
| Programmed distribution | 0.642394 | 0.002781 | 28% |
| Equipment failure (line/network) | 0.739301 | 0.007828 | 7% |
| Natural phenomena | 0.447587 | 0 | |
| Ignored | 0.565798 | 0 | |
| Others | 0.522140 | 0.041294 | −8% |
| Broken/damaged poles | 0.552991 | 0 | |
| Third parties | 0.704078 | 0 | |
| Unscheduled transmission | 0.884771 | 0.008798 | 3% |
| Transmission scheduled | 0.651692 | 0.003412 | 35% |
| Consuming unit | 0.340594 | 0 | |
| Total | 0.594958 | 0.068574 | 0.3677% |
| Publisher’s Note: MDPI stays neutral with regard to jurisdictional claims in published maps and institutional affiliations. |
© 2022 by the authors. Licensee MDPI, Basel, Switzerland. This article is an open access article distributed under the terms and conditions of the Creative Commons Attribution (CC BY) license (https://creativecommons.org/licenses/by/4.0/).


