Article

Scenarios on the Impact of Electric Vehicles on Distribution Grids

1
School of Electrical Engineering, Aalto University, 02150 Espoo, Finland
2
KSS Verkko Oy, 45100 Kouvola, Finland
*
Author to whom correspondence should be addressed.
Energies 2022, 15(13), 4534; https://doi.org/10.3390/en15134534
Submission received: 9 May 2022 / Revised: 1 June 2022 / Accepted: 17 June 2022 / Published: 21 June 2022
(This article belongs to the Section F1: Electrical Power System)

Abstract

:
The electricity sector has a central role in the efforts to meet climate targets. Consequently, efforts are taking place to electrify industry, heating, and transportation. The Finnish government has set the target to halve carbon dioxide traffic emissions by 2030 and achieve carbon neutrality by 2045. Due to this target, the currently small proportion of electric vehicles (EVs) in Finland could expand in a manner that is difficult to forecast but could be exponential. Amid already strained investment budgets, anticipating the alternative scenarios and impacts of such a transport electrification evolution is of high importance to distribution system operators in order to optimize network planning and enhancements during the coming 15–25 years. The novelty and contribution of this paper is in utilizing a formal scenario planning process to envision what the alternative scenarios are (i.e., possible futures) for the evolution of the electric car fleet in Finland until 2040 and how these alternative scenarios could impact distribution grids. The impact analysis is performed in terms of additional energy and additional power in order to gain an understanding of the high-level impacts and investment needs. The analysis utilizes a real distribution grid in southern Finland as a case example that enables quantification. The results indicate the electric vehicles will, depending the scenario, pose an essential additional load in terms of both energy and power and that the required investment levels and investment types will be heavily dependent on the scenario.

1. Introduction

Many Finnish distribution system operators (DSOs) are struggling with the heavy investment load introduced by Finnish Energy Authority regulations. By 2036, these distribution grids must comply with the new regulations in ensuring that no outages shall occur for longer than 6 h in urban areas or 36 h in rural areas. Since most of the outages are due to extreme weather conditions such as falling trees during storms, overhead lines are extensively being replaced by underground cables, even in sparsely populated areas. At the same time, the Finnish government has set the target of halving carbon dioxide traffic emissions by 2030 and achieving traffic carbon neutrality by 2045. Meeting these targets could result in a dramatic increase in the number of electric cars in Finland which, though difficult to forecast, could be exponential.
By the end of 2020, the motor vehicle stock in Finland had risen to 3.19 million, of which passenger cars were by far the largest group (2.75 million), with the rest consisting of delivery vehicles (340,000), trucks (95,000), buses (10,000), and other special vehicles [1]. Of the passenger cars, about 10,000 (0.35%) were fully electric vehicles (i.e., battery electric vehicles (BEVs)), and about 45,000 (1.7%) were plugin hybrid electric vehicles (PHEVs) [1]. The average age of passenger cars was about 12 years [1]. The share of electric vehicles (EVs) is rapidly increasing, since at the end of 2021, the number of BEVs accounted for 0.83% (23,000) while PHEVs accounted for 2.8% (77,000) [2] of the passenger cars. The total number of new cars registered in 2021 amounted to 115,000, of which 98,500 were passenger cars. European Union regulation is probably a key factor behind the rapid increase in EVs in Finland and elsewhere in the EU. EU regulation is demonstrated by the incentive mechanism for zero- and low-emission vehicles (ZLEV) in particular, which sets annual, gradually tightening emission targets for each manufacturer on its car fleet within the EU [3].
To provide further background, Finland is a sparsely populated northern country with a population of 5.5 million inhabitants, of which nearly 1 million live in the capital region [4]. The population density is only 18 inhabitants per square kilometer due to the large land area (304,000 square kilometers) [5].
Amid the already strained investment budgets, anticipating alternative scenarios and the impacts of evolving transport electrification is of high importance for DSOs in order to optimize network planning and enhancements over the coming 15–25 years. The ability to accurately anticipate future trends is particularly crucial for those small- and medium-sized DSOs having their customer base residing in a relatively extensive geographical area consisting of both urban and rural parts and who also have to serve a large number of intermittent short- or medium-term visitors due to bypassing traffic.

1.1. State of the Art of the Research

Much research has focused on EVs and their impact, as well as the role that the proliferating number of EVs will have on power grids. Coignard et al. [6] studied the impacts on the distribution grid in the Pacific Gas and Electric Company (PG&E) area in California. Assuming one EV per household, they found that about 60% of the residential feeders might need some reinforcement. Anand et al. [7] proposed a probabilistic approach to evaluate the impact of electric vehicles on the reliability performance of power distribution systems. In their study, the simulation results for a modified version of the IEEE 33 bus system revealed that the system reliability of the distribution systems was adversely impacted by an increase in both the number and driving distances of EVs, as well as by increased use of EVs with higher battery capacities. This negative impact was primarily attributed to transformer overload issues or voltage limit violations. Garcia-Lopez et al. [8] addressed the unequal loading of secondary substations by proposing a multiterminal electrical vehicle charging station which would be connected to two or more secondary substations. Kabir et al. [9] presented a two-stage solution to provision and dimensionalize a direct current (DC) fast-charging station network for minimizing deployment costs while ensuring acceptable quality of experience, such as acceptable waiting times. Rahman et al. [10] studied PHEV charging and discharging schedules and proposed a method for utilizing vehicle-to-grid (V2G) technologies to optimize the usage of Saudi Arabia’s limited power grid infrastructure. Iqbal et al. [11] introduced a probabilistic approach to estimate the load introduced by EVs. Their model is based on commuters’ daily routines from a recent travel survey conducted in Finland. In their review article, Gonzalez Venegas et al. [12] analyzed the main barriers to exploiting EV flexibility in the power grid. The main barriers were assessed to be economic and institutional, largely due to an immature regulatory environment. In particular, the survey discusses grid codes, connection agreements, tariffs, and market platforms as a means to promote a more extensive role for EVs in providing flexibility services. Mo et al. [13] explored strategies to increase EV penetration in order to address air pollution issues in Hong Kong and other major cities. The authors identified obstacles for the proliferation of EVs (e.g., insufficient charging infrastructures and inadequate management of public charging facilities) as well as measures to promote EVs (e.g., incentives and bonuses for EVs and offering high-power quick-charging facilities). Alquthami et al. [14] studied the impact of EVs on the distribution grid in Saudi Arabia by utilizing probabilistic agent-based simulation methods and survey data on driving patterns. The results indicate that the impact of EVs is essential: as the penetration of EVSs reaches 20%, the peak demand increases by 3.4%.

1.2. The Research Question and Focus of This Paper
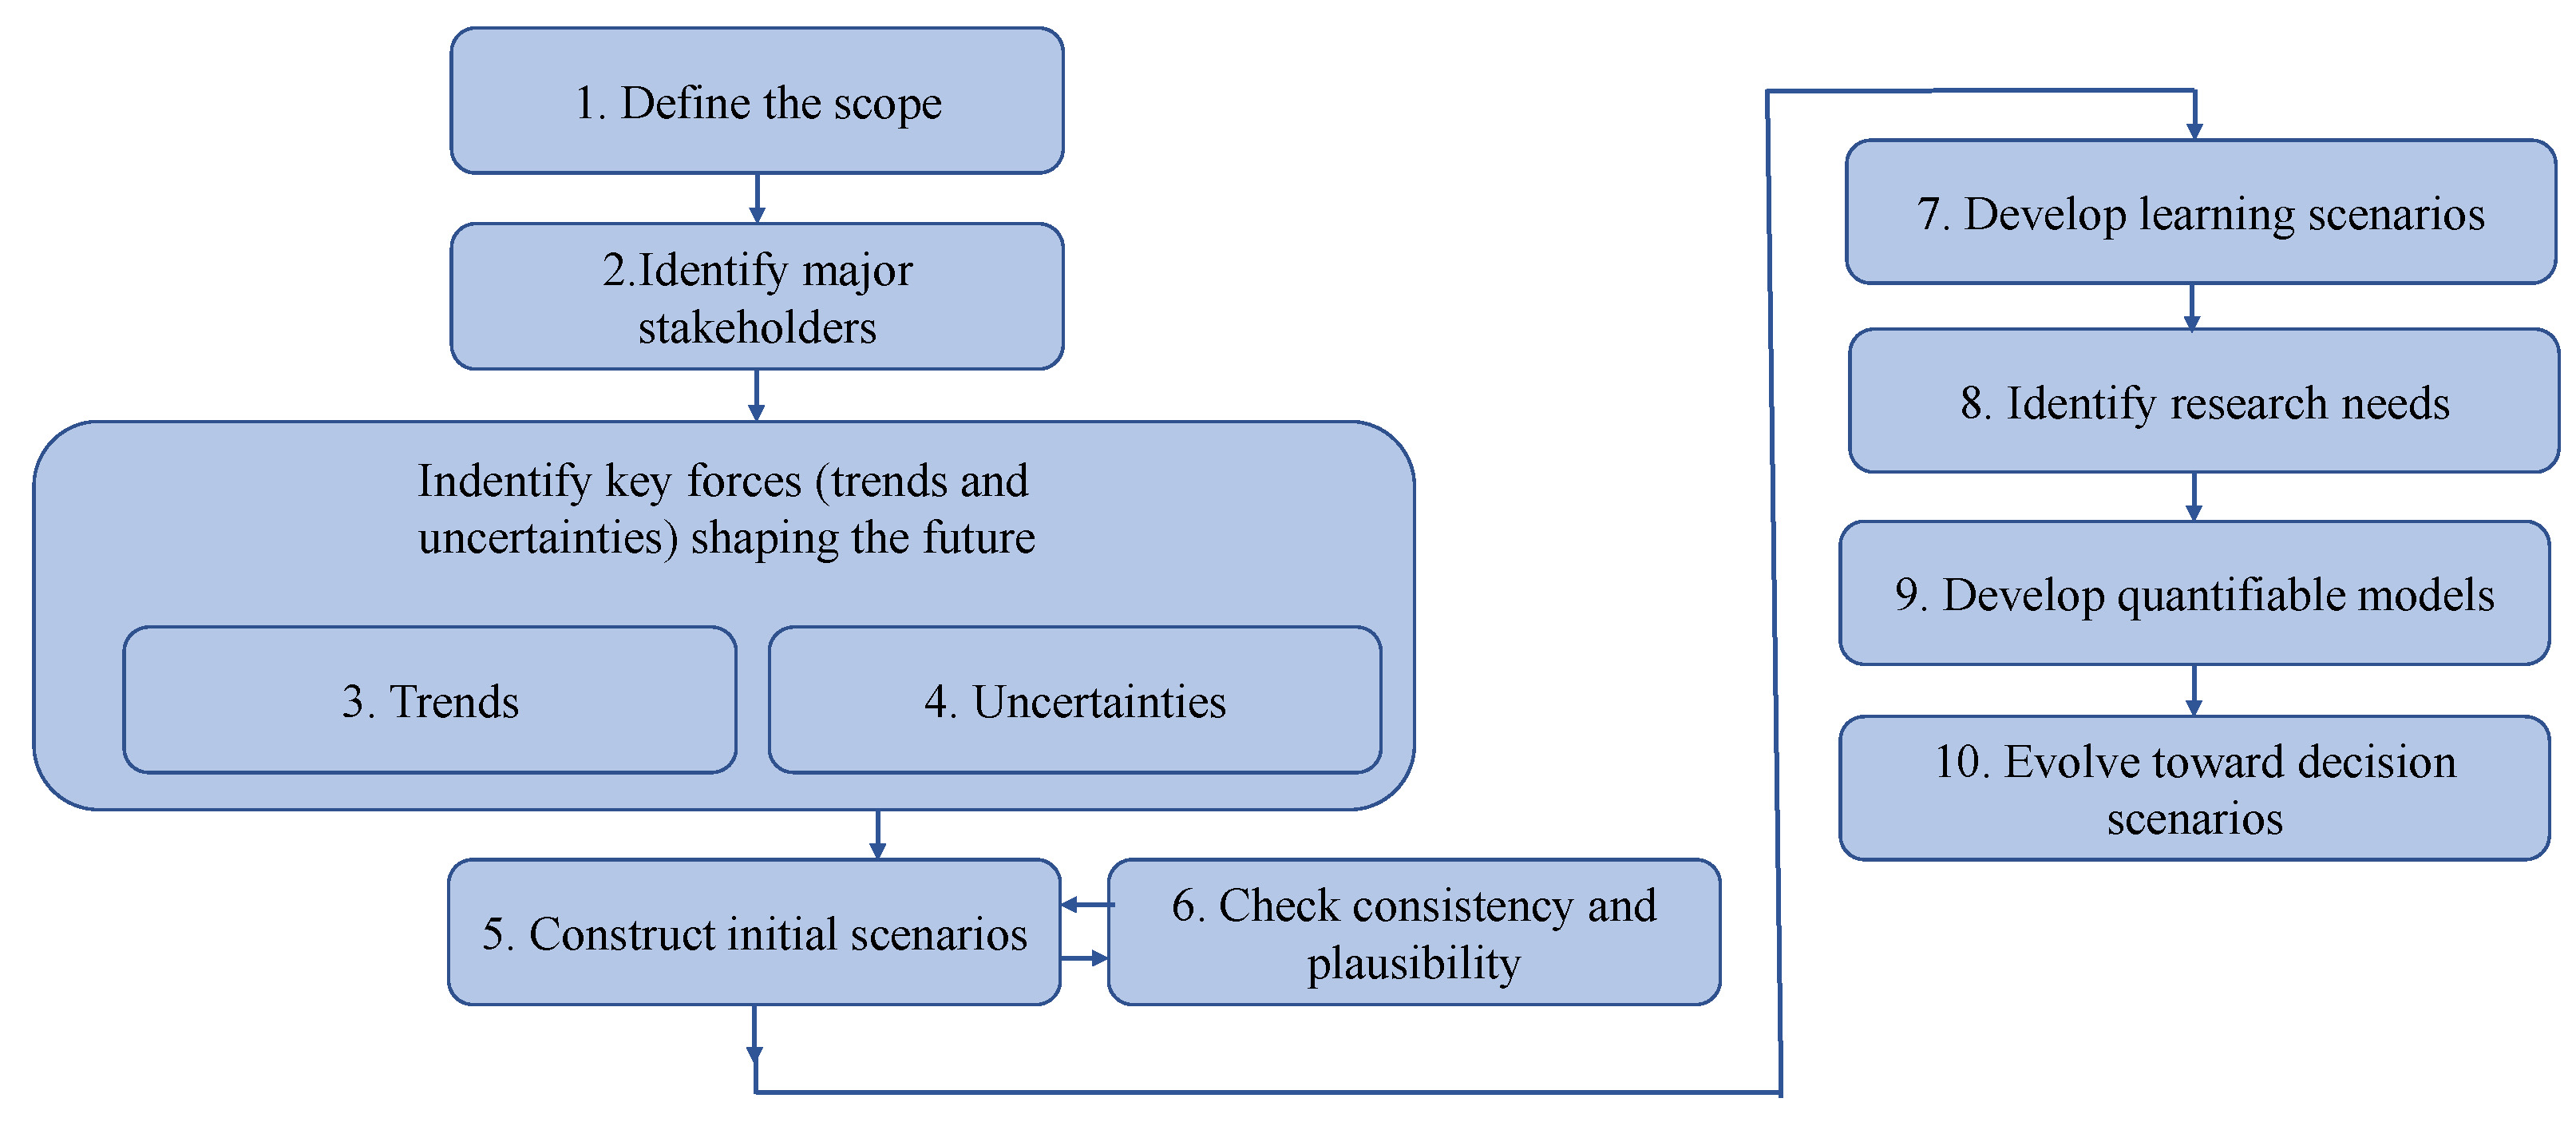
What, to our understanding, has received less focus is the different, alternative long-term evolutions associated with EVs and distribution grids. This anticipatory task is particularly challenging due to uncertainties in the development of automotive power sources and electric vehicle technologies, as well as potential changes in the sentiment of the citizens. As of today, the sentiment sees global warming as a severe, human-made problem, though this is also disputed by some political forces and parties. Therefore, the contribution and novelty of this paper is in using a formal scenario planning process to create different electric vehicle penetration and charging behavior scenarios and in analyzing their high-level impact, in terms of additional energy and additional power, on distribution grid development and investment needs for the potentially most challenged distribution system operators. The impact analysis utilizes a real distribution grid in southern Finland operated by the DSO company KSS Verkko Oy.
The primary research questions are what the alternative scenarios (i.e., possible futures) for the evolution of the EV fleet in Finland until 2040 are and how the electrification of transport would impact distribution grids. The scenarios and their likelihoods are, at least to some extent, dependent on country-specific issues such as regulatory policies and political goals. Thus, these issues must be taken into account when attempting to generalize to other contexts.
The rest of the paper is organized as follows. Section 2 describes the applied scenario planning method, while Section 3 provides background information on the case DSO, KSS Verkko Oy, and its power grid. Section 4 presents the identified trends and uncertainties. Based on the trends and uncertainties, scenarios are outlined in Section 5 and Section 6 from two different perspectives. Section 5 provides higher-level scenarios pertaining to the evolution of the car fleet and its power sources. Section 6 assumes that the trend of electrification is strong and outlines four different charging view scenarios. This is followed by the quantification of the charging view scenarios in Section 7, which analyzes the impact of each charging view scenario on our case DSO in terms of energy and power. Finally, Section 8 concludes the study by discussing the implications of the scenarios and the quantification.

2. Methods

Scenario planning is a formal method to imagine and explore alternative possible futures. This research utilizes Paul Schoemaker’s popular scenario planning process [15,16] in combination with the anticipatory action learning approach [17,18,19] to generate alternative possible futures (i.e., scenarios). Action learning focuses on conversations and workshops in which experts from various backgrounds generate and explore the scenarios. Figure 1 depicts the scenario planning process, which consists of 10 steps. This paper covers the scenario generation and high-level quantitative modeling until Step 9 of the scenario planning process. Detailed quantitative modeling of Steps 9–10 will be covered in further work.
This study seeks answers to two primary research questions which form the scope of the scenario planning process: what are the alternative scenarios (i.e., possible futures) for the evolution of the electric car fleet in Finland until 2040, and how could these alternative scenarios impact distribution grids? Trends and uncertainties are both forces shaping the future. When the majority of the experts agreed that the force was valid with a reasonable probability, a trend was considered to be identified. Thus, by definition, trends are present in all scenarios. Uncertainty was identified when experts were either uncertain or the outcome of the force was divisive. The forces were identified by using the so-called PEST framework, having four categories: (1) political and regulatory forces, (2) economic and industry forces, (3) social forces, and (4) technological forces. For each PEST category, a coordinate system having uncertainty and the importance of the forces as axes was utilized. The experts indicated the level of uncertainty and importance by individually placing the forces they had identified on appropriate positions in the coordinate system [15,20]. The scenarios were created by assuming different outcomes for the most significant uncertainties [15,20].
A total of 13 experts participated in the process through workshops and interviews. The experts represented the following stakeholder organizations: distribution system operators, electric vehicle charging service operators, retail business, gasoline business, the Parliament of Finland, Finnish municipalities, rental apartment companies, as well as power systems, communications, network economics, and chemistry research institutes and universities. The views expressed by the experts were their own and were not necessarily shared by their employers. The scenario planning process was carried out in a distributed manner during the fall of 2021. The expert group was divided into a core group of five persons and an extended group of an additional eight persons. The core group met regularly during the fall every second week, while the extended group was used to provide input and feedback in separate meetings.

3. Case Distribution System Operator

KSS Verkko Oy is a DSO operating in southern Finland. Its distribution area, depicted in Figure 2, covers 1900 square kilometers and encompasses both urban and rural areas in the municipalities of Kouvola and Iitti. The company has 52,000 customers. There are in total 77 DSOs in Finland, with KSS Verkko being the 20th largest company in terms of number of customers. KSS Verkko’s distribution grid consists of 4600 km of overhead lines and underground cables, 12 substations, about 1500 distribution transformers, and about 50 remotely controlled disconnector stations. The 20 kV/400 V distribution transformers are located close the consumers, and the consumers have three-phase connections, which is typical in Finnish distribution grids. In recent years, KSS Verkko has been investing heavily in the weather security of the electricity network as required by the security of supply regulations stipulated the Electricity Market Act [21].
The total electricity consumption in 2020 in KSS Verkko’s distribution network was 573 GWh. The highest consumption took place in housing (240 GWh, 42%), business (196 GWh, 34%), and industry (58 GWh, 10%). For comparison, the total electricity consumption in Finland in 2020 was 81 TWh. The peak power of the distribution network was 144 MW in 2021. The electricity consumption and peak power of the distribution network vary from year to year due to ambient temperature. The average electricity consumed in KSS Verkko’s distribution network for the period of 2019–2021 was 600 GWh. The average peak power in the corresponding period was 128 MW.

4. Trends and Uncertainties

Table 1 lists the most significant trends identified by the experts. The trends are listed in order of priority according to the experts’ judgement, with T1 having the highest priority. As defined in Section 2, a force being a trend means that the majority of the experts agreed that the force was valid with a reasonable probability. Consequently, trends are by definition present in all scenarios.
The experts consider that fossil fuels will be increasingly replaced by electricity not only in transportation (trend T2) but also more broadly in society, particularly in the housing and industrial sectors (trend T1). According to the experts’ observations, there is a widespread sentiment that climate change is impacting our daily lives, such as through the increased frequency and intensity of extreme weather events (trend T3). The experts also note that more recently, the loss of biodiversity has further contributed to growing concern about environmental issues (trend T3). With regard to electric energy systems, the experts believe that the past evolution in which the European Union prefers market-based solutions for the electricity sector [22] will continue (trend T4), and the power grids will continue to transform into dynamic smart grids integrating increasing amounts of intermittent, renewable generation and energy storage and involving consumers as active players (trend T5). In order to facilitate this integration, more extensive automation will be required. This will inevitably result in increasing dependency on information and communications technologies (ICT, trend T6).
Table 2 lists the identified uncertainties. As defined in Section 2, a force being an uncertainty means that the experts were either uncertain or the outcome of the force was divisive. The uncertainties are listed in order of priority according to the experts’ judgment, with U1 having the highest priority.
Despite the rapid development of EV technology, the range of BEVs is still far from that of a modern diesel passenger car, which can fairly easily have a range of 1000 km even during cold winter months. Currently, the best lithium-ion batteries have an energy density of 240 W/kg [23], which would provide a capacity of 120 kWh for a typical BEV battery weighing 500 kg. With an average consumption of 20 kWh/100 km, this would correspond to a range of 600 km. According to experts, future development of BEVs with an energy storage equivalent to that of combustion engine cars could greatly impact charging behavior (uncertainty U1). Extensive efforts are ongoing to improve the energy density of the current battery technology and research on potential new technologies. Currently, this looks challenging to reach battery energy densities of 500 W/kg by 2040 [24], which would roughly correspond a range of 1000 km.
Currently, EVs are predominantly charged at home using alternating current (AC) charging. AC charging is becoming increasingly accessible at workplaces and commercial buildings, such as supermarkets. DC-based fast-charging stations are being deployed along highways and in supermarket parking lots [25]. The experts pondered whether fast charging could evolve to become similar to filling gasoline into a combustion engine car (i.e., that a short stop at a “gas station” once per week would be adequate) (uncertainty U2). This would allow EV drivers to avoid frequent connection and disconnection of charging cables as well as investments in charging infrastructure at home.
The European Union, to which Finland also belongs, is currently pushing for electrification in its effort to reach zero net emissions of greenhouse gases by 2050 [26,27]. Experts anticipate that the potential rise in electricity prices and subsequent pressure by the electorate could force some member states to reconsider this target (uncertainty U3). There already exist signs of such hesitation in some member states [28].
The experts feel that a green transition might increase energy prices at least to some extent, primarily because of insufficient carbon-free, controllable energy sources to replace fossil fuels, significantly increasing electricity demand due to electrification of the heavy industry, as well as fossil fuels becoming purposely more expensive due to political actions such as taxation or emissions trading. More recently, we have seen that the war in Ukraine seems to be increasing energy prices during spring 2022, and efforts are taking place to accelerate the green transition. Furthermore, as discussed in Section 1, the renewal of the motor vehicle stock in Finland is relatively slow. Particularly in rural areas, one is dependent on cars to enable long-distance commuting throughout the cold winter season. To accelerate the introduction of EVs, the public would need to invest more in the purchase of new, high-performance EVs, leading to higher capital costs than those of using old, fully functioning combustion engine cars. Furthermore, a lack of battery raw materials could adversely impact the EV prices. Multiple elections will be held in Finland before 2040, and uncertainty remains whether the electorate will support such potentially higher costs of vehicle ownership (uncertainty U4 in Table 2).
Assuming that the electricity generation is carbon-neutral, BEVs can be considered a clean transportation technology. The experts discussed whether there are alternative green engine technologies that could mature during the coming 20-year period (uncertainty U5). Much effort has been devoted lately to green hydrogen [29,30]. Thus far, it still suffers from inefficiencies. Assuming that the research manages to resolve these issues, green hydrogen could potentially be used to power cars either through fuel cells or by converting hydrogen, together with carbon, into synthetic fuels for combustion engines.
The proliferation of EVs raised concerns among experts regarding the adequate supply of battery raw materials (uncertainty U6). Although lithium itself is not a scarce metal, opening totally new mines is a long, complex process which can be hindered by environmental issues [31,32]. Furthermore, the mining of battery materials, especially cathode materials such as cobalt, can involve ethical issues concerning child labor [31]. It should also be noted that lithium-ion batteries will also be extensively needed in major applications other than EVs, such as power grid battery installations essential for addressing power balance maintenance challenges introduced by the increasing share of intermittent generation [33].
Increasing the share of intermittent generation poses challenges to power balance maintenance [33,34,35]. Assuming a major electrification of transport, the batteries of EVs could essentially contribute to power balance maintenance by acting as a means for enabling flexible load peak shaving. As vehicle-to-grid technologies become more common, they could enable an even more active role in the EV fleet. The experts feel that although EV batteries could play an important role in power balance management, that evolution is uncertain (uncertainty U7), as there remain not only commercial obstacles, such as essential incentives for EV owners and the cost of such a highly distributed fast flexibility reserve, but also technical challenges, such as deploying the required low-latency communications infrastructure.

5. Car Fleet View Scenarios

The aim of the first part of the research question (“What are the alternative scenarios (i.e., possible futures) for the evolution of the electric car fleet in Finland until 2040?”) is to provide background to the scenarios concerning the impacts of transport electrification on the distribution grid. After several iterations together with the experts, this led to four car fleet scenarios (hereinafter, we use italics for the scenario names): (1) less BEVs, more PHEVs, (2) combustion engine vehicles rule, (3) more BEVs, less PHEVs, and (4) BEVs dominate. These four scenarios were created by crossing the outcomes of two important reasonably independent uncertainties [15]: U1 (“Will cost-efficient, light 1000-km range passenger car batteries emerge?”) and U3 (“Will EU regulation continue to strongly push for clean electrification?”) as indicated in Figure 3.
In the scenario BEVs dominate, electric vehicle battery technologies evolve rapidly, enabling a range which is comparable to modern diesel passenger cars (i.e., about 1000 km even during cold winter months). Furthermore, since BEVs are technically less complex than PHEVs and combustion engine vehicles, and since EU regulations push for clean electrification, BEVs are a very compelling choice to the consumer, leading to the dominance of BEVs among vehicle technologies.
An opposing view in terms of electrification is offered by the scenario combustion engine vehicles rule, where EV ranges will remain limited compared with modern combustion engine passenger cars and EU regulations will not push for clean electrification (e.g., due to the electorate opposing increases in fossil fuel prices). This scenario envisions greater electrification than that of today, though combustion engines powered by fossil fuels would still remain the main engine technology in the car fleet by 2040. Nevertheless, combustion engines would undergo further development to become even more energy efficient and cleaner, despite using fossil fuels. Additionally, wider deployment of natural or synthetic gas vehicles could be a possibility in this scenario. Currently, although the European Union is planning to ban the sale of new combustion engine cars from 2035 [36,37], it has recently classified natural gas as a green energy source, even though it produces carbon emissions [38].
Assuming that EV ranges will remain limited compared with the modern combustion engine passenger cars and EU regulations continue to push for clean electrification, the evolution during the coming 20 years could lead to co-existence of electric and combustion engine technologies. Such an evolution would result in the scenario less BEVs, more PHEVs, where those who frequently travel longer distances would use PHEVs while BEVs would satisfy the transportation needs for those who mostly move within a limited geographic area (e.g., a city and its surroundings). Finally, in the scenario more BEVs, less PHEVs, BEVs can provide long ranges, but EU regulations are not pushing for clean electrification (e.g., due to the electorate opposing essential rises in fossil fuel prices). This evolution would lead to the wider deployment of BEVs, assuming that they are financially competitive with combustion engine vehicles.
The trend of electrification (trend T2) is strongest in the scenario BEVs dominate, as well as more BEVs, less PHEVs, and more PHEVs, less BEVs, as indicated by the green color in Figure 3.

6. Charging View Scenarios

For the analysis of the second part of the research question, (“How would the alternative car fleet scenarios impact distribution grids?”) we selected those car fleet view scenarios in which electrification of transport would be most intense: BEVs dominate, more BEVs, less PHEVs, and more PHEVs, less BEVs. In this and the following section, these three scenarios set the scene as we outline and quantify scenarios describing the impact of extensive electrification on distribution grids.
The distribution grid impact scenarios were created by crossing the outcomes of two important reasonably independent uncertainties [15]: U2 (“Will high-power fast charging play a significant role?”) and U1, (“Will cost-efficient, light 1000-km range passenger car batteries emerge?”) which led to four charging view scenarios: (1) high-end gasoline rest stops, (2) home and destination charging, (3) home and shopping on-the-road charging, and (4) small gas station renaissance, as indicated in Figure 4.
In the first charging view scenario, high-end gasoline rest stops, electric vehicles have large batteries that are predominantly charged by high-power fast charging. Due to the large capacity of electric vehicle batteries, the network of charging stations does not have to be very dense. On longer-distance trips, the stops are determined, as is often the case with combustion engine cars, predominantly by reasons other than running out of electricity (or gasoline in the case of combustion engine cars), such as the need to have a break to stretch one’s legs, visit restrooms, or have a coffee. In this scenario, a stop of 10–30 min would be enough to provide sufficient energy for hundreds of kilometers or until the next break on a longer journey. The charging stations would be high-quality rest stops with versatile services, enabling passengers to have a short, pleasant break. Due to the well-developed fast charging and battery technologies, charging at home at a lower power is less important in this scenario.
Charging view scenario 3, home and shopping on the road, is the opposite to charging view scenario 1, high-end gasoline rest stops. The charging power used is relatively low, and the ranges of EVs are limited compared with combustion engine cars, leading to the need to plan charging occasions. Due to long charging times, charging at home is a necessity, requiring that longer journeys be carefully planned based on charging needs rather than when and where one needs to have a break to stretch one’s legs. For longer journeys, one needs to plan a longer break of at least 1 h or more for charging and to utilize the charging time for some other time-consuming activity, such as weekend grocery shopping. Overall, this scenario requires considerably more advance planning, daily efforts, and investments in home charging equipment compared with visiting a gasoline station for a short time once a week, as is typically the case with combustion engine cars. In charging view scenario 2, home and destination charging, the charging power is still relatively low, as is the case in charging view scenario 3, but battery capacities are high. In this scenario, the vehicles are predominantly charged at home, typically during the night, and as the battery capacities are high, one can even make longer journeys without the need to stop for recharging, thus allowing recharging to be postponed until arrival at a destination, such as a hotel, summer cottage, or leisure home, where overnight charging would be adequate. Consequently, charging view scenario 2 requires less advance planning than scenario 3.
Finally, in charging view scenario 4, small gas station renaissance, the charging power is high, but the battery capacities are limited. In this scenario, a shorter stop of about 10 min is enough to provide an essential range, though stops need to be more frequent than would be required in charging view scenario 1, high-end gasoline rest stops. This scenario would lead to the conversion of current, unmanned, “cold” gasoline stations, which have largely replaced small gas stations in Finland, into charging stations offering basic services such as restrooms and a cafeteria. These basic services would enable the driver to have a short break indoors during charging of the vehicle. In urban areas, home charging would be less common in this scenario, as one could easily go to the nearby charging station and utilize its fast charging capabilities in the same way as one does today with combustion engine cars.
As discussed earlier, electrification (trend T2) is a strong trend in all four charging view scenarios. When comparing the scenarios, electrification is very strong in charging view scenario 1 (high-end gasoline rest stop), where the performance of the technology is highest both in terms of battery capacity and charging power, followed by charging view scenarios 2 and 4.

7. Quantifying the Impacts of the Charging View Scenarios

Having outlined the charging view scenarios in the preceding section, we now move on to quantify their impacts in a typical Finnish distribution grid, represented by the grid of KSS Verkko Oy. For each of the scenarios, we estimate the impact of local, Kouvola-based vehicles and bypassing traffic from the three highways intersecting within the Kouvola region. The detailed analysis can be found in Appendix A, Appendix B, Appendix C and Appendix D.
For Kouvola-based vehicles, the basis of the estimation was the number of vehicles in Kouvola in 2021, which was 56,143 [1]. This number could be further subdivided into passenger cars (49,100), delivery cars (5275), trucks (1546), buses (163), and special cars (59). For our analysis, we grouped these into two categories: (1) non-trucks, consisting of passenger cars and delivery cars, and (2) trucks, comprising both trucks and buses. The small category of special vehicles was excluded from analysis. This led to 54,735 cars in the non-truck category and 1709 vehicles in the truck category. According to population forecasts, the population in Kouvola can be expected to decline by 15% by 2040 [39]. Assuming that the number of vehicles will decrease by a corresponding amount, this would yield 46,524 (0.85 × 54,735) non-trucks and 1452 (0.85 × 1709) trucks in Kouvola for 2040. Furthermore, basic statistics show that the average number of kilometers per year (kilometrage, or “mileage”) for non-trucks is about 13,800 km, and for trucks it is about 30,400 [40]. These figures are assumed to remain at the same level for the 20-year period extending to 2040.
As can be noted from Appendix A, Appendix B, Appendix C and Appendix D, the number of non-trucks and trucks, as well as their average yearly kilometers, were the basis used for quantifying Kouvola-based traffic. Next, depending on the characteristics of each scenario, we estimated the percentage of EVs and determined the average battery size, average percentage of battery capacity charged per charging occasion, and the charging power. Furthermore, it is estimated that the electricity consumption of passenger cars (non-trucks) will improve, to some extent, to 15 kWh/100 km from its current level of about 19.7 kWh/100 km [41]. Although heavy electric long-distance trucks are currently not a reality, there are indications that the order of magnitude of their consumption could be around 150 kWh/100 km [42]. Based on the number of EVs and their average yearly kilometers and electricity consumption, we could calculate the required additional energy as well as an indication of the additional power, as will be explained in more detail later. Hereafter, we use italics for these two terms to refer to the additional yearly electric energy and power needs introduced by EVs for 2040. The additional energy is further subdivided into seven user groups: home (detached houses), home (terrace houses), home (block of flats), shops or other commercial buildings, leisure homes and summer cottages, workplaces and offices, and rest stops and traffic stations. This subdivision of the additional energy into user groups is based on the current distribution of the number of KSS Verkko’s different type of users and on scenario specific characteristics, as will be described later.
The bypassing traffic category comprises both the bypassing traffic going through the Kouvola area as well as non-Kouvola-based vehicles coming to Kouvola (e.g., because of work, shopping, or leisure time). For the bypassing traffic, the basis for quantification is the average daily traffic volume (i.e., number of cars passing on the three highways intersecting in the Kouvola region). In 2020, Highways 6, 12, and 15 had daily traffic volumes of 6073, 7338, and 8077, respectively [43]. Although a portion of this traffic most likely consisted of Kouvola-based vehicles, there are no exact statistics for this. Local experts assume that about half of the traffic would be from locations outside the Kouvola region, which was used in this study as the basis for calculating the amount of bypassing traffic in Appendix A, Appendix B, Appendix C and Appendix D. These calculations were then used based on the characteristics of each scenario to estimate the percentage of EVs, the number of these stopping in the Kouvola region to charge, and the amount of energy charged per charging occasion. These scenario-specific estimations were then used to calculate the additional energy, as well as an indication of the additional power, as will be explained in more detail later. The required energy at the grid level was further subdivided into seven user groups: home (detached houses), home (terrace houses), home (block of flats), shops or other commercial buildings, leisure homes and summer cottages, workplaces and offices, and lastly rest stops and traffic stations. The subdivision of energy into user groups was based on the current distribution of the number of KSS Verkko’s different types of users and scenario-specific characteristics. It should be noted that the home user group, particularly home (leisure homes and summer cottages), was also relevant to the passing traffic, as some of this would be due to people living elsewhere but having their spare-time residence in the Kouvola region.
The parameters describing the car fleet in 2040 in different scenarios are summarized in Table 3. As discussed in Section 6, the electrification trend (trend T2) is strongest in scenario 1 (high-end gasoline rest stops), where the performance of the electric technology is highest both in terms of battery capacity and charging power, followed by scenario 2 (home and destination charging) and scenario 4 (small gas station renaissance). Consequently, in Scenario 1, 90% of all vehicles are assumed to be electric, while Scenarios 2 and 4 assume that 70% of non-trucks and 20% of trucks are electric. Finally, in scenario 3 (home and shopping on-the-road charging), it is concluded that the electric technology is not viable or optimal for heavy trucks, leading to the use of other energy sources such as fossil or hydrogen-based fuels. Thus, in scenario 3, zero percent of the trucks would be electrified. The electrification of passenger cars in scenario 3 is estimated to be 50%, which is moderate compared with the other three scenarios.
In scenarios 1 and 4, where the typical realized charging power in each charging occasion is high, it is estimated that charging powers would be 200 kW and 1 MW for non-trucks and trucks, respectively, in Table 3. In those scenarios where the charging power is low, the charging power is estimated to be, for Kouvola-based vehicles, 11 kW for non-trucks (scenarios 2 and 3), 500 kW for trucks (only scenario 2, since scenario 3 assumes that zero percent of trucks are electrified), 50 kW for passing non-trucks (scenarios 2 and 3), and 500 kW for passing trucks (scenario 2 only). In those scenarios where the batteries have a high capacity (scenarios 1 and 2), it is estimated to be 150 kWh for non-trucks and 1 MWh for trucks, whereas in those scenarios where it is small, it is estimated to be 80 kWh for non-trucks (scenarios 3 and 4) and 500 kWh for trucks (only scenario 4, since scenario 3 assumes that 0% of the trucks would be electrified). It is assumed that active load management is utilized at major charging locations to manage peak loads in order to limit the required grid investments.
As mentioned earlier, the subdivision of the additional energy into user groups is based on the current distribution of the number of different types of users of KSS Verkko and on scenario-specific characteristics. The number of users in KSS Verkko’s grid is currently distributed as follows among the seven user groups: home (detached houses) (35.7%), home (terrace houses) (15.1%), home (block of flats) (33.9%), shops or other commercial buildings (4.0%), leisure homes and summer cottages (7.8%), workplaces and offices (3.4%), and rest stops and traffic stations (0.1%). Each scenario defines where the majority of charging will take place. In scenarios 1 (high-end gasoline rest stops) and 4 (small gas stations renaissance), rest stops and traffic stations dominate, while in scenarios 2 (home and destination charging) and 3 (home and shopping on-the-road charging), homes, shops, and commercial building are emphasized. Combining the current distribution of users with the assessment of the scenario-based charging behavior led to an estimation how the additional energy is distributed among the user groups. The percentage share for each scenario and each user group is represented in Table 4.
Based on the parameters presented above (also detailed in Appendix A, Appendix B, Appendix C and Appendix D), the required additional energy can be calculated for each of the scenarios. As shown in Table 4 and Figure 5, the additional energy is 179 GWh for scenario 1 (high-end gasoline rest stops), 102 GWh for scenario 2 (home and destination charging), 63 GWh for scenario 3 (home and shopping on-the-road charging), and 104 GWh for scenario 4 (small gas station renaissance). Figure 5 also shows the additional energy requirement, divided according to traffic category. As can be seen from the figure, Kouvola-based non-trucks (passenger cars and delivery cars) require the highest amount of additional energy in all scenarios, with passing non-trucks comprising the second highest amount in scenarios 2–4. For scenario 1, Kouvola-based trucks have the second highest additional energy requirement due to their large number and the overall strong electrification trend in that scenario.
Figure 6 shows the additional energy requirement, divided according to user category. It can be clearly seen from the figure that charging at rest stops and traffic stations dominates in those scenarios requiring high charging power (i.e., scenarios 1 and 4), while charging at home is most prevalent in scenarios 2 and 3. Even though scenarios 2 and 4 have roughly the same additional energy requirement, it is distributed differently between the scenarios. In scenario 2, low-power home charging dominates, whereas high-power traffic station and rest stop charging is more prevalent in scenario 4.
Regarding the power, we first derived an additional power indication or high-level estimate by assuming that the additional energy was evenly distributed over a 12-h period for each day of the year. As can be seen from Table 4, this yielded an additional power indication of 41 MW, 23 MW, 14 MW, and 24 MW for scenarios 1–4, respectively.
In order to analyze the additional power in more detail, the parameters for the distribution of the additional energy to the hours of the day and months of the year were assessed based on the traffic and user category. The results of the assessment are presented in Table 5. A weighting factor is a weight given to a data point to represent a lighter or heavier charging habit in different user groups. With these factors, the additional power for charging was calculated hour by hour at different times of the year. The year was divided into for four intervals: wintertime, summertime, May, and other (April, September, and October). The primary period is the time when most of the charging occurs during the day. For example, it is estimated that in homes, 80% of recharged energy is used between 5:00 p.m. and 8:00 a.m., as can be seen in Table 5. Secondary periods consist of the rest of the hours of the day after the primary period. Nighttime is defined as the period between 10:00 p.m. and 6:00 a.m.
Wintertime is defined as the 5-month period extending from November to the end of March, during which the weight factor for winter is set to 20% due to additional EV energy consumption attributable to lower battery efficiency and heating. Summertime is defined as the 3 months between June and August (i.e., the Nordic holiday season). During summertime, energy consumption can be expected to rise due to passing car traffic rising by 10% but, on other hand, a decrease of 30% for passenger cars at workplaces. The decrease in energy consumption during summertime is highly dependent on companies’ policies for when holidays can be used and for how long. In some cases, all employees might have a holiday at the same time for up to 4 weeks in total. This could be possible in the industry sector due to annual shutdowns and maintenance work. In some companies, policies might not allow employees taking more than a 3-week holiday in a row. Even without such policies, energy consumption can decrease if people increase commuting by bicycle in the summer or use motorcycles when they travel from home to work. Since people already start to spend more time at their leisure homes in May before the actual summertime (Nordic holiday season), the energy consumption at leisure homes starts to increase consequently in May. Due to this, May is a separate interval of the year, leaving April, September, and October for the remaining interval named “other”. Regarding the days of the week, the weekend is defined as Saturday and Sunday for the Kouvola-based traffic and from Friday to Sunday for the bypassing traffic. The energy consumption during the weekend is higher than during weekdays due to increased leisure home and rest stop visits and shopping. In leisure homes and bypassing traffic, the increase is set to 70% higher than on an average day if energy is evenly distributed to every hour. For local Kouvola-based cars and all kinds of trucks, the increase is estimated to be 20% higher than an average day. Trucks at workplaces are mainly charged at nighttime when most deliveries are not made, and this is estimated to be 80% of the primary period’s energy.
Applying the parameters of Table 5 to the additional energy summarized in Table 4 resulted in the additional peak power levels (summarized in Table 6) for each scenario and each interval of the year. As can be seen by comparing Table 4 and Table 6, the additional power indication of 41 MW, 23 MW, 14 MW, and 24 MW for scenarios 1–4, respectively, was relatively close the results of the more detailed analysis (i.e., 38.8 MW, 23.6 MW, 16.1 MW and 25.3 MW, respectively). Scenarios 2 and 4 showed similar levels of additional charging power (i.e., 23.6 MW and 25.3 MW, respectively) during the weekends, primarily due to the similar EV penetration level (70% for non-trucks and 20% for trucks, as indicated in Table 3), while the additional charging power level was highest in Scenario 1 due to the highest EV penetration level (90%) and lowest in scenario 3 due to the relatively modest electrification (50% for non-trucks and 0% for trucks).
The daily distribution of the additional power in each scenario is depicted in Figure 7, Figure 8, Figure 9 and Figure 10 for each interval of the year. As expected, the load during the wintertime was the highest due to increased EV electricity consumption in the cold climate. From Figure 7, Figure 8, Figure 9 and Figure 10, it can be seen that in all scenarios, some additional power peaks occurred between 6:00 p.m. and 8:00 p.m. on weekends. The reason behind this is that people start to arrive to their homes and charge their cars while the daily activities at commercial facilities and rest stops still remain.
For scenarios 1 and 4 (Figure 7 and Figure 10, respectively), the charging power curve is fairly stable (flat) and similar during the daytime, while scenarios 2 and 3 (Figure 8 and Figure 9, respectively) show similar additional charging power curve shapes, having a clear peak moment from 6:00 p.m. to 8:00 p.m. The reason behind this is that in scenarios 1 and 4, charging at public charging stations such as rest stops, which is relatively evenly spread over the daytime hours, dominates, while in scenarios 2 and 3, charging is more focused on the evening hours due to home charging. A small drop in charging occurs in all scenarios in the morning between 6:00 a.m. and 8:00 a.m. due to the decreased charging of trucks at the workplace. In May, power levels slightly increase with the advent of the holiday season and increased use of leisure homes. In scenario 1, workplace and rest stop charging rises by about 15 MW at 8:00 a.m., as can be seen by the corresponding overall increase from about 15 MW to about 30 MW in Figure 7. Especially in home-focused scenario 2, the afternoon peak at 5:00 p.m. is caused by charging at home, despite the overall charging at workplaces starting to decrease at the same time. In scenario 3, charging at home and at shops is the main factor affecting the charging power curve.

8. Discussion and Conclusions

The novelty and contribution of this paper is in utilizing a formal scenario planning process and a group of experts to envision what the alternative scenarios are (i.e., possible futures) for the evolution of the electric car fleet in Finland until 2040 and how these alternative scenarios could impact distribution grids. We first developed alternative scenarios for describing the evolution of the electric car fleet in Finland until 2040. Next, we selected for further analysis those car fleet view scenarios where electrification of transport would be most intense, leading to the creation of four charging view scenarios. We then quantified the distribution grid impacts of these scenarios in terms of energy and power using a case DSO.
The purpose of scenario planning is to explore what could be possible in the future. Its purpose is to “challenge the prevailing mindset” and to “identify extreme worlds” [15]. Scenario planning does not try to estimate the likelihood of the scenarios or forecast some middle-of-the-road view based on the “extreme worlds”. Nevertheless, all outlined scenarios indicate that electrification in transport will have a significant impact on Finnish distribution grids. In our study, KSS Verkko represented a typical Finnish distribution system operator. Depending on the scenario, the additional energy delivered through KSS Verkko’s grid would vary between 63 GWh and 179 GWh per year. As the current total electricity consumption in KSS Verkko’s distribution network is about 600 GWh, this additional energy would correspond to an increase of between 11% and 30%, despite an expected simultaneous 15% decrease in the population of the Kouvola region. With regard to peak power, the required additional power would vary between 16.1 MW and 38.8 MW. This corresponds roughly to the capacity of the case DSO’s bigger substations, which typically have two 25-MVA transformers. However, the evening time peaks of the additional power can probably be evened out to some extent by introducing dynamic load management at home. As the average peak power in KSS Verkko’s distribution network is about 128 MW (c.f. Section 3), the additional hourly power would thus correspond to an increase of between 13% and 30%. Figure 11 shows the average hourly power in KSS Verkko’s distribution network on 16 January 2021 (blue line), which was the date when the peak power of 144 MW occurred (c.f. Section 3). The red line in the figure describes a situation where additional power from charging electric cars according to scenario 1 has been added to the actual average power.
The division of the additional energy and additional power varied considerably among the user groups and between the scenarios. Charging at rest stops and traffic stations dominates in the scenarios with the highest charging power requirements (i.e., scenario 1 (high-end gasoline rest stops) and scenario 4 (small gas station renaissance)), while charging at home is prevalent in scenario 2 (home and destination charging) and scenario 3 (home and shopping on-the-road charging). Scenarios 1 and 4 can be considered to present a centralized charging approach, while scenarios 2 and 3 are distributed charging solutions.
Scenario 1 (high-end gasoline rest stops) clearly showed the highest additional energy level at 179 GWh, while scenario 2 (home and destination charging) and scenario 4 (small gas station renaissance) showed roughly similar additional energy requirements of 102 GWh and 104 GWh, respectively. The essential difference between these two scenarios is that scenario 2 (home and destination charging) distributes the additional load to existing load points (i.e., homes), whereas scenario 4 (small gas station renaissance) would imply the need to establish new essential load points (i.e., major high-power charging stations offering dozens of 200-kW chargers). Thus, the nature of the required investments would differ between the scenarios. For example, scenario 1 (high-end gasoline rest stops) would require not only essentially new investments for supplying the required additional energy and additional power to new high-power charging stations but also replacement investments for supplying the required additional energy and additional power to existing users at home. Scenario 4 (small gas station renaissance) would primarily require new investments for supplying the required additional energy and additional power to new high-power charging stations, whereas scenario 2 (home and destination charging) would require mostly replacement investments for supplying the required additional energy and additional power to existing users at home. In the scenarios with the highest charging power requirements (i.e., scenario 1 (high-end gasoline rest stops) and scenario 4 (small gas station renaissance)), the new investments could include not only grid reinforcements but also battery storage at the charging stations to even out the load and thus limit the need for grid enforcements. The evolution of regulation would determine to which extent the battery storage could be owned by DSOs. In scenario 3 (home and shopping on-the-road charging), the investment needs are overall more limited, as the required additional energy and additional power represent a modest increase of only 11–13% in the current levels. Due to the large size of the distribution grid and large number of homes, the replacement investments might be more challenging than focused investments for a handful of high-power charging stations.
The scenarios and their likelihood are dependent on country-specific issues, such as regulatory policies and political goals. With regard to quantification of the scenarios, DSOs differ from each other to some extent (e.g., depending on the level of urbanization and amount of bypassing traffic). These issues must be taken into account when generalizing the results to other contexts. It should also be noted that scenario planning is about envisioning different futures and not about forecasting. Thus, for example, while performing detailed grid planning, the case DSO has to ponder the likelihood of the scenarios, closely follow the car fleet and charging behavior evolution, and readjust their plans if needed.
This paper focused on scenarios related to charging behavior and estimating the high-level impacts in terms of additional energy and additional power. More detailed analysis of the transformer and feeder loads in each of the scenarios is a logical next step for the case DSO. Another topic of interest for more detailed analysis would be the sensitivity and impact of varying charging powers and battery sizes. Battery and charging technologies are currently developing relatively fast, and the car fleet renewal rate might increase in the future. For at least some of the scenarios, it would be of interest to proceed with a more fine-grained analysis by unbundling personnel cars and delivery vehicles as well as trucks and busses into four separate categories in order to study the impact of their specific charging behaviors. At a strategic level, the uncertainties identified in Section 4 offer a basis for future work by selecting a different set of uncertainties as the basis for the scenarios in order to explore other technical aspects or business aspects (e.g., for studying the potentially changing role of the DSOs and impact of regulations). These are all of interest for further work and future research.

Author Contributions

Conceptualization, S.B., P.T. and J.T.; methodology, S.B., P.T., H.H. and J.T.; validation, J.M.; formal analysis, S.B., P.T., J.T. and J.M., investigation, S.B., P.T., J.T. and J.M.; resources, R.K. and P.T.; data curation, S.B. and J.M.; writing—original draft preparation, S.B., J.M., P.T. and J.T.; writing—review and editing, M.L., H.H. and R.K.; visualization, J.M., S.B. and P.T.; supervision, M.L., H.H. and R.K.; project administration, S.B.; funding acquisition, R.K. and S.B. All authors have read and agreed to the published version of the manuscript.

Funding

This work was funded in part by the Finnish public funding agency for research Business Finland under the projects “5G VIIMA” (grant number 6430/31/2018) and “IFORGE” (grant number 7127/31/2021).

Institutional Review Board Statement

Not applicable.

Informed Consent Statement

Not applicable.

Data Availability Statement

The data are contained within the article.

Conflicts of Interest

The authors declare no conflict of interest.

Appendix A. Quantification of Scenario 1: High-End Gasoline Rest Stop

Table A1. Summary of Kouvola-based and passing traffic (including detailed quantification of the Kouvola-based traffic). Blue cells indicate results and green input parameters.
SCENARIO 1:
High-End Gasoline Rest Stop
Number of VehiclesElectric Vehicles Out of All VehiclesElectric Vehicles Out of All VehiclesAverage Kilometers per YearElectricity ConsumptionEnergy per Year and per CarEnergy on Grid Level per YearIndication of Power Level Assuming even Split of Energy to 12 h during a DayAverage Battery SizeAverage Percentage of Battery Capacity Charged per Charging OccasionAverage Energy per Charging OccasionCharging PowerAmount of Charging Occasions per YearDuration of Charging
nbr%nbrkmkWh/100 kmMWhGWhMWkWh%kWhKW min
Vehicles in Kouvola47,976
other than trucks46,52490%41,87213,800152872015040%602003518
trucks145290%130730,400150466014100050%50010009130
Passing traffic, other than trucks 266
   details furthest down
Passing traffic, trucks 72
   details furthest down
TOTAL 17941
Table A2. Kouvola-based and passing traffic: subdivision of additional energy into user groups. Percentages indicate the share of consumption points.
SCENARIO 1:
High-End Gasoline Rest Stop
Home-Detached HouseHome-Terraced House, Row HouseHome-Block of FlatsShop, Commercial BuildingLeisure Home, Summer CottageWorkplace, OfficeRest Stop, Traffic StationsEnergy on Grid Level per Year
%, GWh%, GWh%, GWh%, GWh%, GWh%, GWh%, GWhGWh
Vehicles in Kouvola
other than trucks12%6%12%10%5%5%50%
10.45.210.48.74.34.343.387
trucks0%0%0%0%0%40%60%
0.00.00.00.00.023.835.860
Passing traffic, other than trucks0%0%0%30%0%0%70%
   details furthest down0.00.00.07.70.00.018.026
Passing traffic, trucks0%0%0%5%0%0%95%
   details furthest down0.00.00.00.40.00.07.07
TOTAL10.45.210.416.74.328.2104.1179
Table A3. Detailed quantification of passing traffic (the derived additional energy is consolidated into the summary (Table A1) and subdivided into user groups in Table A2).
SCENARIO 1:
High-End Gasoline Rest Stop
Share of TrucksNumber of VehiclesShare of Electric VehiclesNon-Kouvola Based ShareNumber of Electric VehiclesNumber of Passing Cars Stopping to Charge (Every x’th)Average Battery SizeAverage Percentage of Battery Capacity Charged per Charging OccasionAmount of Energy Charge per Charging OccasionCharging PowerDuration of ChargingEnergy per Day on Grid LevelEnergy on Grid Level per YearNumber of Hours per Day for Charging (Evenly Distributed)Indication of Grid Level Power
%nbr%%nbrnbrkWh%kWhKWminMWh/dGWhhoursMW
Passing VT6 traffic per day 6073
   of which other than trucks 589190%50%26511015050%752002319.97.3121.7
   of which trucks3.0%18290%50%8210100070%7001000425.72.1120.5
Passing KT12 traffic per day 7338
   of which other than trucks 711890%50%32031015050%752002324.08.8122.0
   of which trucks3.0%22090%50%9910100070%7001000426.92.5120.6
Passing KT15 traffic per day 8077
   of which other than trucks 783590%50%35261015050%752002326.49.7122.2
   of which trucks3.0%24290%50%10910100070%7001000427.62.8120.6
Passing traffic, other than trucks 70.325.7 5.9
Passing traffic, trucks 20.37.4 1.7
TOTAL 161.033.1 7.6

Appendix B. Quantification of Scenario 2: Home and Destination Charging

Table A4. Summary of Kouvola-based and passing traffic (including detailed quantification of the Kouvola-based traffic). Blue cells indicate results and green input parameters.
SCENARIO 2:
Home and Destination Charging
Number of VehiclesElectric Vehicles Out of All VehiclesElectric Vehicles Out of All VehiclesAverage Kilometers per YearElectricity ConsumptionEnergy per Year and per CarEnergy on Grid Level per YearIndication of Power Level Assuming even Split of Energy to 12 h during a DayAverage Battery SizeAverage Percentage of Battery Capacity Charged per Charging OccasionAverage Energy per Charging OccasionCharging PowerAmount of Charging Occasions per YearDuration of Charging
nbr%nbrkmkWh/100 kmMWhGWhMWkWh%kWhKW min
Vehicles in Kouvola47,976
other than trucks46,52470%32,56713,800152671515040%601135327
trucks145220%29030,40015046133100050%5005009160
Passing traffic, other than trucks 205
   details furthest down
Passing traffic, trucks 20
   details furthest down
TOTAL 10223
Table A5. Kouvola-based and passing traffic: subdivision of additional energy into user groups. Percentages indicate the share of consumption points.
SCENARIO 2:
Home and Destination Charging
Home-Detached HouseHome-Terraced House, Row HouseHome-Block of FlatsShop, Commercial BuildingLeisure Home, Summer CottageWorkplace, OfficeRest Stop, Traffic StationsEnergy on Grid Level per Year
%, GWh%, GWh%, GWh%, GWh%, GWh%, GWh%, GWhGWh
Vehicles in Kouvola
other than trucks28%13%28%10%5%6%10%
18.98.818.96.73.44.06.767
trucks5%0%0%0%0%85%10%
0.70.00.00.00.011.31.313
Passing traffic, other than trucks0%0%0%40%5%0%55%
   details furthest down0.00.00.08.01.00.011.020
Passing traffic, trucks 0%0%0%15%0%20%65%
   details furthest down0.00.00.00.20.00.31.12
TOTAL19.58.818.915.04.415.620.1102
Table A6. Detailed quantification of passing traffic (the derived additional energy is consolidated into the summary (Table A4) and subdivided into user groups in Table A5).
SCENARIO 2:
Home and Destination Charging
Share of TrucksNumber of VehiclesShare of Electric VehiclesNon-Kouvola Based ShareNumber of Electric VehiclesNumber of Passing Cars Stopping to Charge (Every x’th)Average Battery SizeAverage Percentage of Battery Capacity Charged per Charging OccasionAmount of Energy Charge per Charging OccasionCharging PowerDuration of ChargingEnergy per Day on Grid LevelEnergy on Grid Level per YearNumber of Hours per Day for Charging (Evenly Distributed)Indication of Grid Level Power
%nbr%%nbrnbrkWh%kWhKWminMWh/dGWhhoursMW
Passing VT6 traffic per day 6073
   of which other than trucks 589170%50%20621015050%75509015.55.6121.3
   of which trucks3.0%18220%50%1810100070%700500841.30.5120.1
Passing KT12 traffic per day 7338
   of which other than trucks 711870%50%24911015050%75509018.76.8121.6
   of which trucks3.0%22020%50%2210100070%700500841.50.6120.1
Passing KT15 traffic per day 8077
   of which other than trucks 783570%50%27421015050%75509020.67.5121.7
   of which trucks3.0%24220%50%2410100070%700500841.70.6120.1
Passing traffic, other than trucks 54.720.0 4.6
Passing traffic, trucks 4.51.6 0.4
TOTAL 113.921.6 4.9

Appendix C. Quantification of Scenario 3: Home and Shopping on the Road Charging

Table A7. Summary of Kouvola-based and passing traffic (including detailed quantification of the Kouvola-based traffic). Blue cells indicate results and green input parameters.
SCENARIO 3:
Home and Shopping on the Road Charging
Number of VehiclesElectric Vehicles Out of All VehiclesElectric Vehicles Out of All VehiclesAverage Kilometers per YearElectricity ConsumptionEnergy per Year and per CarEnergy on Grid Level per Yearindication of Power Level Assuming Even Split of Energy to 12 h during a DayAverage Battery SizeAverage Percentage of Battery Capacity Charged per Charging OccasionAverage Energy per Charging OccasionCharging PowerAmount of Charging Occasions per YearDuration of Charging
nbr%nbrkmkWh/100 kmMWhGWhMWkWh%kWhKW min
Vehicles in Kouvola47,976
other than trucks46,52450%23,26213,80015248118020%161112987
trucks14520%030,4001504600050%050000
Passing traffic, other than trucks 153
   details furthest down
Passing traffic, trucks 00
   details furthest down
TOTAL 6314
Table A8. Kouvola-based and passing traffic: subdivision of additional energy into user groups. Percentages indicate the share of consumption points.
SCENARIO 3:
Home and Shopping on the Road Charging
Home-Detached HouseHome-Terraced House, Row HouseHome-Block of FlatsShop, Commercial BuildingLeisure Home, Summer CottageWorkplace, OfficeRest Stop, Traffic StationsEnergy on Grid Level per Year
%, GWh%, GWh%, GWh%, GWh%, GWh%, GWh%, GWhGWh
Vehicles in Kouvola
other than trucks25%12%25%21%5%7%5%
12.05.812.010.12.43.42.448
trucks0%0%0%0%0%0%0%
0.00.00.00.00.00.00.00
Passing traffic, other than trucks0%0%0%55%10%5%30%
   details furthest down0.00.00.08.41.50.84.615
Passing traffic, trucks 0%0%0%0%0%0%0%
   details furthest down0.00.00.00.00.00.00.00
TOTAL12.05.812.018.53.94.17.063
Table A9. Detailed quantification of passing traffic (the derived additional energy is consolidated into the summary (Table A7) and subdivided into user groups in Table A8).
SCENARIO 3:
Home and Shopping on the Road Charging
Share of TrucksNumber of VehiclesShare of Electric VehiclesNon-Kouvola Based ShareNumber of Electric VehiclesNumber of Passing Cars Stopping to Charge (Every x’th)Average Battery SizeAverage Percentage of Battery Capacity Charged per Charging OccasionAmount of Energy Charge per Charging OccasionCharging PowerDuration of ChargingEnergy per Day on Grid LevelEnergy on Grid Level per YearNumber of Hours per day for Charging (Evenly Distributed)Indication of Grid Level Power
%nbr%%nbrnbrkWh%kWhKWminMWh/dGWhhoursMW
Passing VT6 traffic per day 6073
   of which other than trucks 589150%50%147358050%40504811.84.3121.0
   of which trucks3.0%1820%50%0500%00 0.00.0120.0
Passing KT12 traffic per day 7338
   of which other than trucks 711850%50%177958050%40504814.25.2121.2
   of which trucks3.0%2200%50%0500%00 0.00.0120.0
Passing KT15 traffic per day 8077
   of which other than trucks 783550%50%195958050%40504815.75.7121.3
   of which trucks3.0%2420%50%0500%00 0.00.0120.0
Passing traffic, other than trucks 41.715.2 3.5
Passing traffic, trucks 0.00.0 0.0
TOTAL 83.415.2 3.5

Appendix D. Quantification of Scenario 4: Small Gas Station Renaissance

Table A10. Summary of Kouvola-based and passing traffic (including detailed quantification of the Kouvola-based traffic). Blue cells indicate results and green input parameters.
SCENARIO 4:
Small Gas Station Renaissance
Number of VehiclesElectric Vehicles Out of All VehiclesElectric Vehicles Out of All VehiclesAverage Kilometers per YearElectricity ConsumptionEnergy per Year and per CarEnergy on Grid Level per YearIndication of Power Level Assuming even Split of Energy to 12 h during a DayAverage Battery SizeAverage Percentage of Battery Capacity Charged per Charging OccasionAverage Energy per Charging OccasionCharging PowerAmount of Charging Occasions per YearDuration of Charging
nbr%nbrkmkWh/100 kmMWhGWhMWkWh%kWhKW min
Vehicles in Kouvola47,976
other than trucks46,52470%32,56713,80015267158040%322006510
trucks145220%29030,4001504613350050%250100018215
Passing traffic, other than trucks 215
   details furthest down
Passing traffic, trucks 20
   details furthest down
TOTAL 10424
Table A11. Kouvola-based and passing traffic: subdivision of additional energy into user groups. Percentages indicate the share of consumption points.
SCENARIO 4:
Small Gas Station Renaissance
Home-Detached HouseHome-Terraced House, Row HouseHome-Block of FlatsShop, Commercial BuildingLeisure Home, Summer CottageWorkplace, OfficeRest Stop, Traffic StationsEnergy on Grid Level per Year
%, GWh%, GWh%, GWh%, GWh%, GWh%, GWh%, GWhGWh
Vehicles in Kouvola
other than trucks12%6%12%10%5%5%50%
8.14.08.16.73.43.433.767
trucks0%0%0%0%0%40%60%
0.00.00.00.00.05.37.913
Passing traffic, other than trucks0%0%0%30%5%0%65%
   details furthest down0.00.00.06.41.10.013.821
Passing traffic, trucks 0%0%0%10%0%15%75%
   details furthest down0.00.00.00.20.00.21.22
TOTAL8.14.08.113.34.48.956.7104
Table A12. Detailed quantification of passing traffic (the derived additional energy is consolidated into the summary (Table A10) on the top and subdivided into user groups in Table A11).
SCENARIO 4:
Small Gas Station Renaissance
Share of TrucksNumber of VehiclesShare of Electric VehiclesNon-Kouvola Based ShareNumber of Electric VehiclesNumber of Passing Cars Stopping to Charge (Every x’th)Average Battery SizeAverage Percentage of Battery Capacity Charged per Charging OccasionAmount of Energy Charge per Charging OccasionCharging PowerDuration of ChargingEnergy per day on Grid LevelEnergy on Grid Level per YearNumber of Hours per day for Charging (Evenly Distributed)Indication of Grid Level Power
%nbr%%nbrnbrkWh%kWhKWminMWh/dGWhhoursMW
Passing VT6 traffic per day 6073
   of which other than trucks 589170%50%206258050%402001216.56.0121.4
   of which trucks3.0%18220%50%18550070%3501000211.30.5120.1
Passing KT12 traffic per day 7338
   of which other than trucks 711870%50%249158050%402001219.97.3121.7
   of which trucks3.0%22020%50%22550070%3501000211.50.6120.1
Passing KT15 traffic per day 8077
   of which other than trucks 783570%50%274258050%402001221.98.0121.8
   of which trucks3.0%24220%50%24550070%3501000211.70.6120.1
Passing traffic, other than trucks 58.421.3 4.9
Passing traffic, trucks 4.51.6 0.4
TOTAL 121.222.9 5.2

References

  1. Finnish Transport and Communications Agency (Traficom). Ajoneuvokannan Tilastot (“Statistics on Motor Vehicles”). Available online: https://www.traficom.fi/fi/tilastot/ajoneuvokannan-tilastot?toggle=K%C3%A4ytt%C3%B6voimat (accessed on 4 January 2022).
  2. The Finnish Information Centre of Automobile Sector. Yearly New Registrations. Available online: https://www.aut.fi/en/statistics/new_registrations/yearly_new_registrations (accessed on 7 January 2022).
  3. The European Commission. CO₂ Emission Performance Standards for Cars and Vans. Available online: https://ec.europa.eu/clima/eu-action/transport-emissions/road-transport-reducing-co2-emissions-vehicles/co2-emission-performance-standards-cars-and-vans_en (accessed on 30 May 2022).
  4. Statistics Finland. Foreign-Language Speakers Helped Maintain Population Increase. Available online: https://tilastokeskus.fi/til/vaerak/2020/vaerak_2020_2021-03-31_tie_001_en.html (accessed on 4 January 2022).
  5. Statista. Total Land Area of Finland as of 2020, by Region. Available online: https://www.statista.com/statistics/526998/total-area-of-finland-by-region/ (accessed on 4 January 2022).
  6. Coignard, J.; MacDougall, P.; Stadtmueller, F.; Vrettos, E. Will Electric Vehicles Drive Distribution Grid Upgrades? The case of California. IEEE Electrif. Mag. 2019, 7, 46–56. [Google Scholar] [CrossRef]
  7. Anand, M.; Bagena, B.; Rajapakse, A. Probabilistic reliability evaluation of distribution systems considering the spatial and temporal distribution of electric vehicles. Electr. Power Energy Syst. 2019, 117, 105609. [Google Scholar] [CrossRef]
  8. García-López, F.; Barragán-Villarejo, M.; Maza-Ortega, J. Grid-friendly integration of electric vehicle fast charging station based on multiterminal DC link. Int. J. Electr. Power Energy Syst. 2020, 114, 105341. [Google Scholar] [CrossRef]
  9. Kabir, M.; Assi, C.; Alameddine, H.; Antoun, J.; Yan, J. Demand-Aware Provisioning of Electric Vehicles Fast Charging Infrastructure. IEEE Trans. Veh. Technol. 2020, 69, 6952–6963. [Google Scholar] [CrossRef]
  10. Rahman, M.; Al-Ammar, W.; Shekhar Das, H.; Ko, W. Comprehensive impact analysis of electric vehicle charging scheduling on load-duration curve. Comput. Electr. Eng. 2020, 85, 106673. [Google Scholar] [CrossRef]
  11. Iqbal, M.; Kütt, L.; Lehtonen, M.; Millar, R.; Püvi, V.; Rassõlkin, A.; Demidova, G. Travel Activity Based Stochastic Modelling of Load and Charging State of Electric Vehicles. Sustainability 2021, 13, 1550. [Google Scholar] [CrossRef]
  12. Gonzalez Venegas, F.; Petit, M.; Perez, Y. Active integration of electric vehicles into distribution grids: Barriers and frameworks for flexibility services. Renew. Sustain. Energy Rev. 2021, 145, 111060. [Google Scholar] [CrossRef]
  13. Mo, T.; Lau, K.-T.; Li, Y.; Poon, C.-K.; Wu, Y.; Chu, P.K.; Luo, Y. Commercialization of Electric Vehicles in Hong Kong. Energies 2022, 15, 942. [Google Scholar] [CrossRef]
  14. Alquthami, T.; Alsubaie, A.; Alkhraijah, M.; Alqahtani, K.; Alshahrani, S.; Anwar, M. Investigating the Impact of Electric Vehicles Demand on the Distribution Network. Energies 2022, 15, 1180. [Google Scholar] [CrossRef]
  15. Schoemaker, P. Scenario planning: A tool for strategic thinking. Sloan Manag. Rev. 1995, 36, 25–50. [Google Scholar]
  16. Amer, M.; Daim, T.; Jetter, A. A review of scenario planning. Futures 2012, 46, 23–40. [Google Scholar] [CrossRef]
  17. Stevenson, T. Anticipatory action learning: Conversations about the future. Futures 2012, 34, 417–425. [Google Scholar] [CrossRef]
  18. Inayatullah, S. Causal layered analysis. Poststructuralism as method. Futures 1998, 30, 815–829. [Google Scholar] [CrossRef]
  19. Inayatullah, S. Anticipatory action learning: Theory and practice. Futures 2005, 38, 656–666. [Google Scholar] [CrossRef]
  20. Borenius, S.; Hämmäinen, H.; Lehtonen, M.; Ahokangas, P. Smart grid evolution and mobile communications—Scenarios on the Finnish power grid. Electr. Power Syst. Res. 2021, 199, 107367. [Google Scholar] [CrossRef]
  21. Ministry of Trade and Industry. Electricity Market Act. 1172/2004; Ministry of Trade and Industry: Helsinki, Finland, 2004.
  22. The European Parliament. Internal Energy Market. Available online: https://www.europarl.europa.eu/factsheets/en/sheet/45/internal-energy-market (accessed on 7 January 2022).
  23. CleanTechnica. New, Really New EV Battery News. It’s New. Really! Available online: https://cleantechnica.com/2021/09/14/new-really-new-ev-battery-news-its-new-really/ (accessed on 12 January 2022).
  24. Battery 30+. Inventing the Sustainable Batteries of the Future, Research Needs and Future Actions. Available online: https://battery2030.eu/wp-content/uploads/2021/08/c_860904-l_1-k_roadmap-27-march.pdf (accessed on 12 January 2021).
  25. ABC-Lataus. ABC-Latausasema on Kaikille Ladattaville Autoille (“ABC Charging Station is for All Electric Vehicles”). Available online: https://www.abcasemat.fi/fi/abc-lataus/abc-latausasema-on-kaikille-ladattaville-autoille?gclid=CjwKCAiAlfqOBhAeEiwAYi43F0htK477hWrEn1f6Cz-h_CKdR7YcjXoeTYfu7usIcq9_AVhXaMPylRoCpuIQAvD_BwE (accessed on 12 January 2022).
  26. The European Commission. Delivering the European Green Deal. Available online: https://ec.europa.eu/info/strategy/priorities-2019-2024/european-green-deal/delivering-european-green-deal_en (accessed on 13 January 2022).
  27. EU Science Hub. Global Energy and Climate Outlook 2021: 2 °C Target Is within Reach but More Ambitious Pledges Needed for 1.5 °C. Available online: https://ec.europa.eu/jrc/en/news/global-energy-and-climate-outlook-2021-2-c-target-within-reach-more-ambitious-pledges-needed-15-c (accessed on 13 January 2022).
  28. Reuters. Poland Seeks EU Climate Policy Rethink Amid High Energy Prices. Available online: https://www.reuters.com/world/europe/poland-seeks-eu-climate-policy-rethink-amid-high-energy-prices-2021-10-18/ (accessed on 13 January 2022).
  29. Siemens Gasema. Green Hydrogen—Fuel for the Future. Available online: https://www.siemensgamesa.com/products-and-services/hybrid-and-storage/green-hydrogen (accessed on 8 January 2022).
  30. Wärtsilä. Can Green Hydrogen Fuel the Future? Available online: https://www.wartsila.com/insights/article/can-green-hydrogen-fuel-the-future (accessed on 8 January 2022).
  31. Nature. Electric Cars and Batteries: How Will the World Produce Enough. Available online: https://www.nature.com/articles/d41586-021-02222-1 (accessed on 13 January 2020).
  32. Helsingin Sanomat. Akkuteollisuuden Suurvallaksi Pyrkii Suomikin (“Also Finland Aims at Being a Super Power in Battery Industry”); Helsingin Sanomat: Helsinki, Finland, 13 August 2021. [Google Scholar]
  33. Tekniikka&Talous. Fingridin Jukka Ruusunen Pitää Suomen Valot Päällä, Talvipakkasilla Pohjoismaat Voivat Tarvita 5000 megawattia Lisää Sähköä (“Fingrid’s Jukka Ruusunen Keeps Lights on in Finland, During Winter the Nordic Countries Could Need 5000 MW More Electricity”). Available online: https://www.tekniikkatalous.fi/uutiset/fingridin-jukka-ruusunen-pitaa-suomen-valot-paalla-talvipakkasilla-pohjoismaat-voivat-tarvita-5000-megawattia-lisaa-sahkoa/8fe58108-7347-4fe6-9a9f-890e7d395082 (accessed on 12 January 2022).
  34. Fingrid. Record Low Inertia in the Nordic Power System. Available online: https://www.fingrid.fi/en/pages/news/news/2021/record-low-inertia-in-the-nordic-power-system/ (accessed on 12 January 2022).
  35. The Finnish Energy Authority. Sähkön Toimitusvarmuus 2021 (“Security and Delivery Reliability of Electricity in 2021”). Available online: https://energiavirasto.fi/documents/11120570/12722768/S%C3%A4hk%C3%B6n+toimitusvarmuus+vuonna+2021.pdf/6f44505f-e004-25a4-78b7-1ff1a1610e8e/S%C3%A4hk%C3%B6n+toimitusvarmuus+vuonna+2021.pdf?t=1638513974909 (accessed on 2 December 2021).
  36. Reuters. EU Proposes Effective Ban for New Fossil-Fuel Cars from 2035. Available online: https://www.reuters.com/business/retail-consumer/eu-proposes-effective-ban-new-fossil-fuel-car-sales-2035-2021-07-14/ (accessed on 14 January 2022).
  37. The Verge. EU Proposes Phasing Out New Internal Combustion Cars by 2035. Available online: https://www.theverge.com/2021/7/14/22576994/european-union-gas-vehicle-ice-ban-2035-electric-cars (accessed on 14 January 2022).
  38. Reuters. EU Drafts Plan to Label Gas and Nuclear Investments as Green. Available online: https://www.reuters.com/markets/commodities/eu-drafts-plan-label-gas-nuclear-investments-green-2022-01-01/ (accessed on 14 January 2022).
  39. Yleisradio (YLE). Tuore Väestöennuste: Kymenlaakson Väkiluku Laskee 15 Prosentilla Vuoteen 2040 Mennessä. (“New Population Forecast: The Population in Kymenlaakso Region Will be Reducing by 15% by 2040”). Available online: https://yle.fi/uutiset/3-12121908 (accessed on 16 January 2022).
  40. Statistics Finland. Tieliikenteen Suoritelaskenta 2018. (“Kilometrage in 2018”). Available online: https://vayla.fi/documents/25230764/0/Raportti_tieliikenteen_suoritelaskenta_2018.pdf/4079997f-549e-4f99-b2cd-e697681a371c (accessed on 9 April 2019).
  41. The Electric Vehicle Database. Energy Consumption of Full Electric Vehicles. Available online: https://ev-database.org/cheatsheet/energy-consumption-electric-car (accessed on 19 January 2022).
  42. Liimatainen, H.; van Vliet, O.; Aplyn, D. The potential of electric trucks—An international commodity-level analysis. Appl. Energy 2019, 236, 804–814. [Google Scholar] [CrossRef]
  43. The Finnish Transport Infrastructure Agency. Tieliikenteen Liikennemäärät 2012–2020 (“Traffic Volumes on Roads in 2012–2020. Available online: https://paikkatieto.vaylapilvi.fi/arcgis/apps/webappviewer/index.html?id=9303658f44134d5bb82d7e7d55e11644 (accessed on 18 January 2022).
Figure 1. The scenario planning process [15,20].
Energies 15 04534 g001
Figure 2. Geographical area of KSS Verkko’s distribution area.
Energies 15 04534 g002
Figure 3. Car fleet view scenarios. BEV = battery electric vehicle (fully electric vehicle) and PHEV = plugin hybrid electric vehicle.
Energies 15 04534 g003
Figure 4. Charging view scenarios.
Energies 15 04534 g004
Figure 5. Summary of additional energy in different scenarios, divided according to the traffic category.
Energies 15 04534 g005
Figure 6. Additional energy requirement divided according to user category.
Energies 15 04534 g006
Figure 7. Additional load curve for scenario 1 (high-end gasoline rest stops). Winter = November–March, summer = June–August, and Other = April, September, and October.
Energies 15 04534 g007
Figure 8. Additional load curve for scenario 2 (home and destination charging). Winter = November–March, summer = June–August, and other = April, September, and October.
Energies 15 04534 g008
Figure 9. Additional load curve for scenario 3 (home and shopping on-the-road charging). Winter = November–March, summer = June–August, and other = April, September, and October.
Energies 15 04534 g009
Figure 10. Additional load curve for scenario 4 (small gas station renaissance). Winter = November–March, summer = June–August, and other = April, September, and October.
Energies 15 04534 g010
Figure 11. Impact of the additional power on the peak power date. The blue line is the average hourly power in KSS Verkko’s distribution network on the peak power date, and the red line is the average hourly power in KSS Verkko’s distribution network after the additional power from charging electric cars according to Scenario 1 has been added.
Energies 15 04534 g011
Table 1. Trends identified by experts in this study.
IdentificationTrend
T1The role of electric energy in the energy system is increasing
T2Transport is increasingly being electrified
T3There is growing concern about environmental issues
T4The role of electricity markets is increasing
T5Distribution grids are evolving to dynamic meshed networks
T6Increasing the role of information and communications technologies in distribution grids
Table 2. Uncertainties identified by experts in this study.
IdentificationUncertainty
U1Will cost-efficient, light 1000-km range passenger car batteries emerge?
U2Will high-power fast charging play a significant role?
U3Will EU regulation continue to strongly push for electrification?
U4Will the public accept higher costs for vehicle ownership?
U5Will non-BEV clean technologies mature?
U6Will there be an essential lack of raw materials?
U7Will EV batteries play an essential role in grid level power balance maintenance?
Table 3. Parameters describing the car fleet in different scenarios.
Scenarios and Vehicle CategoriesEVs out of All Vehicles (%)Average Battery Size (kWh)Typical Charging Power (kW)
1. High-end gasoline rest stops
   Kouvola, other than trucks90150200
   Kouvola, trucks9010001000
   Passing, other than trucks90150200
   Passing, trucks9010001000
2. Home and destination charging
   Kouvola, other than trucks7015011
   Kouvola, trucks201000500
   Passing, other than trucks7015050
   Passing, trucks201000500
3. Home and shopping on-the-road charging
   Kouvola, other than trucks508011
   Kouvola, trucks000
   Passing, other than trucks508050
   Passing, trucks000
4. Home and destination charging
   Kouvola, other than trucks7080200
   Kouvola, trucks205001000
   Passing, other than trucks7080200
   Passing, trucks205001000
Table 4. Additional energy required by different user categories in the four scenarios.
Scenario and Vehicle CategoryAnnual Energy (GWh)Indication of Power Level (MW)Home (Detached House)Home (Terrace House, Row House)Home (Block of Flats)Shops, Commercial BuildingsLeisure Home, Summer CottageWorkplace, OfficeRest Stop, Traffic Station
1. High-end gasoline rest stops17941
   Kouvola, other than trucks(%) 12612105550
(GWh)87 10.45.210.48.74.34.343.3
   Kouvola, trucks(%) 000004060
(GWh)60 0.00.00.00.00.023.835.8
   Passing, other than trucks(%) 000300070
(GWh)26 0.00.00.07.70.00.018.0
   Passing, trucks(%) 00050095
(GWh)7 0.00.00.00.40.00.07.0
2. Home and destination charging10223
   Kouvola, other than trucks(%] 281328105610
(GWh)67 18.98.818.96.73.44.06.7
   Kouvola, trucks(%) 500008510
(GWh)13 0.70.00.00.00.011.31.3
   Passing, other than trucks(%) 000405055
(GWh)20 0.00.00.08.01.00.011.0
   Passing, trucks(%) 0001502065
(GWh)2 0.00.00.00.20.00.31.1
3. Home and shopping on-the-road charging6314
   Kouvola, other than trucks(%) 25122521575
(GWh)48 12.05.812.010.12.43.42.4
   Kouvola, trucks(%) 0000000
(GWh)0 0.00.00.00.00.00.00.0
   Passing, other than trucks(%) 0005510530
(GWh)15 0.00.00.08.41.50.84.6
   Passing, trucks(%) 0000000
(GWh)0 0.00.00.00.00.00.00.0
4. Small gas station renaissance10424
   Kouvola, other than trucks(%) 12612105550
(GWh)67 8.14.08.16.73.43.433.7
   Kouvola, trucks(%) 000004060
(GWh)13 0.00.00.00.00.05.37.9
   Passing, other than trucks(%) 000305065
(GWh)21 0.00.00.06.41.10.013.8
   Passing, trucks(%) 0001001575
(GWh)2 0.00.00.00.20.00.21.2
Table 5. Parameters used to divide the additional energy according to the hours of the day and months of the year.
Distribution of
Energy
Weighting Factor
Group of UsersPrimary Period (24 h)Primary PeriodSecondary PeriodWinterSummerWeekendNighttimeMay–AugustSeptember–April
Local carsHome (detached house)17–0880%20%20% 20%
Home (terrace house)17–0880%20%20% 20%
Home (block of flats)17–0880%20%20% 20%
Shop and commercial10–2090%10%20%
Leisure homes12–08 70% 80%20%
Workplace08–17100% 20%−30%
Rest stops08–22100% 20%
Passing carsLeisure homes12–08 70% 80%20%
Shop and commercial10–2090%10%20%10%70%
Workplace08–17100% 20%−30%
Rest stops08–22100% 20%10%70%
All trucksShop and commercial06–20100% 20% 20%
Workplace17–0880%20%20% 20%80%
Rest stops00–24100% 20% 20%
Table 6. Additional peak power (MW) in scenarios.
Scenario WinterSummerMayOther
Scenario 1 High-end gasoline rest stopsWeekend38.830.927.425.5
Weekday27.320.822.021.2
Scenario 2 Home and destination chargingWeekend23.619.917.115.2
Weekday14.811.712.511.8
Scenario 3 Home and shopping on-the-road chargingWeekend16.114.011.810.0
Weekday10.28.28.98.6
Scenario 4 Small gas station renaissanceWeekend25.321.118.116.1
Weekday17.413.614.513.8
Publisher’s Note: MDPI stays neutral with regard to jurisdictional claims in published maps and institutional affiliations.

