Abstract
Effective sorting and extraction of tiny plastic objects is becoming increasingly important for manufacturing high-quality recycled plastics. Herein, we designed a manipulation device for tiny objects that can drive multiple target objects individually. This type of device has a potential to sort tiny pieces of a wide variety of materials, not strongly depending on their physical properties, by combining different detection meanings. In this study, two types of devices were tested as the basic components of the proposed device. One of them had a single object-holding point and the other had two of them. These holding points consisted of strip-shaped electrodes facing each other. The high voltage applied to the facing electrodes created forces heading toward the object-holding points caused by the heterogeneity of the electric field in the devices. The forces created in these devices were determined from the motion analysis of a glass sphere, which is a model for target objects, and a numerical simulation. The results indicate that dielectrophoretic forces are dominant at locations that are sufficiently remote from the holding point, and the Coulombic force caused by dielectric barrier discharge is dominant near the high-voltage electrodes with the holding point. Moreover, the transfer of a glass sphere from one holding point to an adjacent point was successfully demonstrated.
1. Introduction
The magnitude of the electromagnetic force is roughly proportional to the cube of the size of the object on which the force is exerted, whereas the magnitude of the electrostatic force, which is caused by the charge that emerges on the surface, is proportional to the square of the object size. Therefore, the electrostatic force becomes more dominant when the size of the target object decreases.
Increasing the plastic recycling rate is significant for saving fossil energy consumption and addressing the problem of microplastics in oceans. However, the quality of recycled plastics is degraded by mixing them with different materials and colors. Representative plastic sorting processes include a pneumatic process with detection of colors using a CCD (charge-coupled device) camera and the identification of materials by infrared absorption. However, these processes usually can treat objects whose sizes are larger than at least a few millimeters. Therefore, sorting technologies for smaller objects are necessary to obtain recycled plastics of higher quality. The smaller the targets, the more effective the electrostatic processes.
A technique that utilizes contact charging to identify and sort plastic pieces [1] has been studied. However, it is necessary to determine the charge-to-mass ratio of the sorted objects in advance for the technique. In general, sorting by electrical processes can be complex because electrical properties depend on the material and its size. Moreover, they cannot sort pieces by color. Therefore, we need to develop a technique that is not sensitive to physical properties. If we develop a technique that can manipulate multiple target pieces individually and combine them with identification meanings (e.g., by visible and infrared light), most of the complexities involving sorting by physical properties can be removed.
Applications of electrostatic forces other than plastic sorting include dust control on solar panels on the earth [2,3,4] and lunar surface [5], trapping plenty of particles onto insulator surfaces [6], sorting, trapping, traveling of living cells, and microparticles in the liquid phase [7,8,9,10,11,12,13,14,15,16,17,18,19]. Representative device structures are (a) a plane substrate with interdigitated electrodes on it [3,4,5,6,8,14,16,18], (b) a micro channel with multiple electrodes along it [7,9], and (c) a micro chamber surrounded by a set of electrodes on a plane [19]. They apply phase-controlled AC voltage to treat target pieces not individually but as a mass. The sorting requires differences in electrical properties, such as dielectric constant and conductivity, among the targets. Therefore, they are not techniques that the authors aim. Although a manipulating technique that treats single particles has been studied [20], it does not meet our goal where the manipulation of multiple pieces is required.
Therefore, we have been investigating a device that has a basic structure with two groups of electrodes, each consisting of many parallel strip-shaped electrodes. These groups of electrodes are placed to form a space between them, where target objects such as tiny plastic pieces, are driven (Figure 1). The width and pitch of the strip-shaped electrodes should be smaller compared to those of the target. Applying a voltage to specific combinations of the upper and lower electrodes creates a highly heterogenic electric field at multiple positions. This heterogeneity may induce electrostatic forces toward the selected lattice points caused by the induced electrical multipoles or electrical discharge. The on/off control for each electrode enables the manipulation of multiple pieces in a plane. This technique can simplify the sorting process because it only requires knowledge whether the dielectric constants of target pieces is higher or lower than the surrounding media. Therefore, in case of sorting in air, practically all the target pieces can be controlled in the same way. This study investigates the characteristics of the most basic components (the number of electrodes for the upper and lower groups were one and two, respectively) through experiments and numerical simulations.
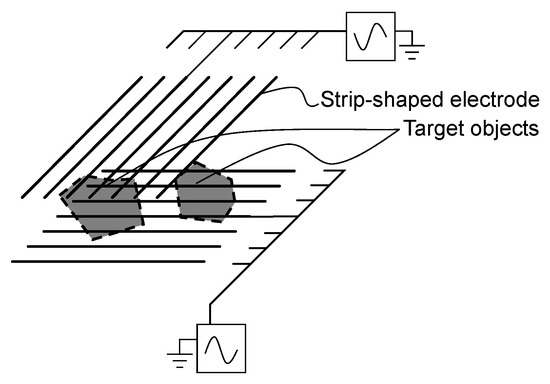
Figure 1.
Conceptual illustration of the manipulation technique in this study.
2. Materials and Methods
2.1. Experimental Apparatus and Methods
Figure 2a,b show the manipulation devices used in the experiments. They consisted of upper and lower electrode plates. Both the electrode plates consist of a borosilicate glass plate with dimensions of 76 mm × 26 mm × 0.9t mm and 1-mm-wide electrodes placed on it. One of the electrodes was placed on the lower side of the glass plate (referred to as “lower electrode” in this study). The lower electrode was covered with epoxy resin. Similarly, the other electrode was placed on the upper side of the upper glass plate so that it is perpendicular to the lower electrode (referred to as “upper electrode” in this study). The upper electrode is covered with a 0.9-mm-thick glass plate except its terminal. Figure 2b shows the upper electrode plate with two upper electrodes. The electrodes were made of conducting paint (Silver Paint 2001-AB, Structure Probe, Inc., West Chester, PA, USA). The electrode plates faced each other with a gap of 1.5 mm to form a space where the target object was driven. Electrical insulation between target objects and the electrodes will enable the manipulation of conducting particles in the future.
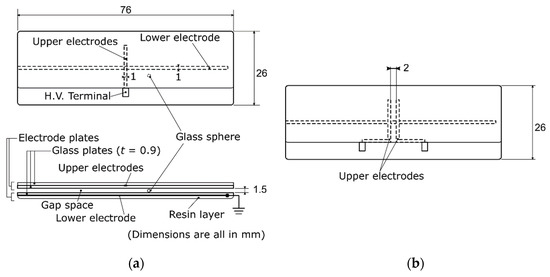
Figure 2.
Manipulation device tested: (a) Top and side views of a set of electrode plates of single-cross-point type; (b) Top view of an electrode plate of dual-cross-point type.
Applying high voltage to the upper electrodes with the lower electrode set to the ground creates high electric field around the point where the distance between the upper and the lower electrodes is the smallest (referred to as “cross point”). Although the potential of the lower electrode can be a voltage with a phase opposite to that of the upper electrode, its potential is set to the ground to simplify the experiment. Actual target objects would have various shapes, but a glass sphere with a diameter of 1.21 mm and a mass of 2.3 mg was used as a model to determine a general feature of the induced forces. The glass sphere was painted with non-conducting black paint to simplify motion analysis.
Figure 3 shows apparatus for measuring the forces exerted on the glass sphere. A high-speed camera (k7-usb made by Katokoken Co., Ltd., Isehara, Japan) was placed 700 mm above the manipulation device and it recorded the motion of the sphere with a resolution of 1024 × 768 and a frame rate of 300 fps. The voltage waveform from a function generator (FGX-295 made by Texio Technology Corp., Yokohama, Japan) was amplified 2000 times with a high-voltage amplifier (Model 20/20C-HS made by Advanced Energy Industries, Inc., Denver, CO, USA) to be applied to the upper electrode of the manipulation device. The voltage was measured using a high-voltage probe (P6015A made by Tektronix Inc., Beaverton, OR, USA) and a digital oscilloscope. The applied voltage is a sinusoidal wave with an amplitude of 6 kV and a frequency of 1 kHz. Frequencies under 100 Hz yielded unstable trajectories partially because their periods were comparable to the timescale of the sphere motion, although the reason of the instability was not fully understood. Higher frequencies than 1 kHz did not yield obvious difference from this experiment. The amplitude of 6 kV was chosen because it is approximately the lowest voltage with which force information were able to be obtained up to a 10 mm square with its center at the cross point.
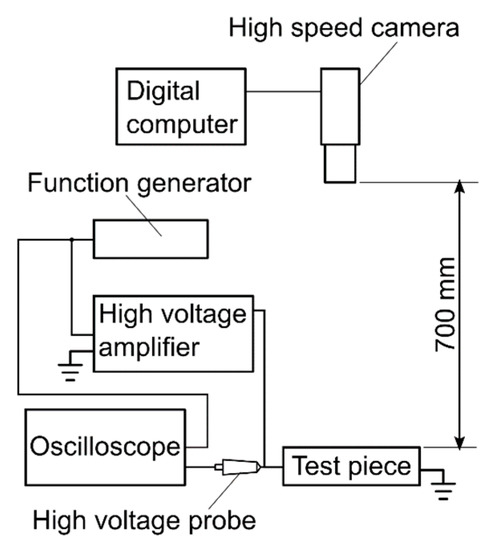
Figure 3.
Apparatus for the measurement of electrostatic forces.
First, the glass sphere was placed arbitrarily on the lower electrode plate. Subsequently, a high voltage was applied to make the sphere to start moving with electrostatic forces. Analysis of its motion provides the driving force experienced by the glass sphere along the trajectories. Because the sphere is considered to move rolling without slipping, as mentioned in the results section, the following equations hold:
where M is the mass of the sphere, v is the translation velocity, F is the sum of the electrostatic force exerted on the sphere, Fd is the frictional force exerted by the glass plate at the contact point, Ω is the rotational angle velocity of the sphere, T is the torque created by the electrostatic forces, R is the radius of the sphere, k is the unit vector of vertical upward, and I is the momentum of inertia of the sphere. The force that transfers objects is the translational for, hence F should be determined. Equation (5) can be deduced from Equations (1)–(4)
Because the torque cannot be determined only from motion analysis, F was determined by neglecting the second term of Equation (5). This analysis was repeated at more than 20 initial positions to cover a broad area.
An experiment on a device with dual upper electrodes (Figure 2b) is described below. The most basic operation of this device is the transfer of an object from the initial holding point to an adjacent point. Consequently, the voltage applied to the electrode at the initial point must be stopped instead of applying voltage to the adjacent electrode. During this situation, the potential of the initial electrode becomes a floating potential that may disturb the transfer of the object. Here, the question arises whether the electrode of the initial point should be grounded (as indicated in Figure 4). Grounding may help the transfer by completely cutting off the attractive force to the initial point. The experiment consisted of two steps. A comparison of the phenomena between a grounded case and a case of floating potential was performed for both cases.
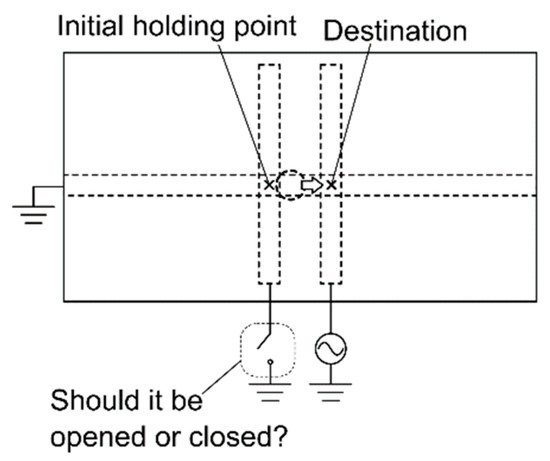
Figure 4.
Options for transferring an object from one holding point to another.
- (1)
- To determine whether the transfer from one initial holding point to an adjacent point is possible.
- (2)
- To investigate the distribution of the electrostatic force when only one of the two electrodes was supplied with high voltage.
2.2. Methods for Numerical Simulation
Figure 5a,b show the calculation region. It consists of a 1.5 mm-thick air layer, two 1.8 mm-thick glass layers that sandwich the air layer, 1.0 mm-wide electrodes placed in the glass, and a glass sphere with a diameter of 1.207 mm. The diameter was identical to that used in this experiment. An xy-plane was defined such that it coincided with the upper surface of the lower glass layer. The centerlines of the upper and lower electrodes were at x = 0 and y = 0, respectively. A gap of 0.1 mm is created between the sphere and the glass surface to avoid extremely deformed calculation lattices. The relative permittivity of glass was set to be 6.0. The distribution of potential V can be calculated by solving the Laplace equation (Equation (6)) with the boundary conditions between glass and air, (7) and (8) because no free charge and conductivity are considered.
where subscripts a and g indicate air and glass, respectively, and n indicates the normal vector of the interfaces. V was determined for each different position of the glass sphere by 0.5 mm. Subsequently, the net force exerted on the glass sphere at every position is determined by integrating the Maxwell stress tensor at sphere surface S, as described by Equation (9) [12]
where Fi is the i-component of the force exerted on the glass sphere and Teij is the ij-component of the Maxwell stress tensor. Theoretically, F is the sum of the forces exerted on 2n-th multipole F(n) (n = 1, 2, …), as described by Equation (10). F(n) is the dielectrophoretic force and it is represented by Equation (11) using an effective scalar constant K(n) if the electric field is irrotational and the materials are isotropic.
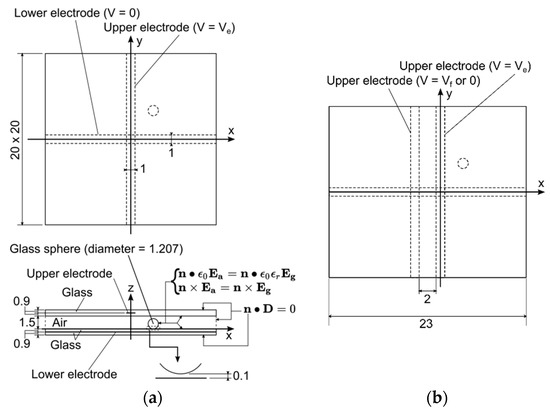
Figure 5.
Calculation region (dimensions are all in mm): (a) Top and side views of the region for single-cross-point type; (b) Top view of the region for dual-cross-point type.
Because this equation indicates that F is proportional to the magnitude of the electric field squared, the time-average of the force can be determined by the rms (root mean square) of the applied voltage. To find the time-average of F, a dc voltage, Ve, of 4.243 kV, which is the rms of the 6-kV sinusoidal wave, is given for the upper electrode, as indicated by Equation (12)
This is justified because the time taken by the sphere to transfer is sufficiently longer than the period of the applied voltage in the experiment (1 ms). At the lower electrode,
At the outer boundaries, the condition under which no displacement flux leaks out of the calculation region is as follows:
The floating potential, Vf, of the upper electrode adjacent to the high-voltage electrode is determined using the condition that no true charge exists inside a closed cylindrical surface Sc, which includes the electrode with the floating potential
The calculation was performed without the glass sphere; the value of Vf was obtained as 0.684 times Ve, that is, 2.903 kV. This value is commonly used for all cases with the glass sphere.
Considering the symmetry, calculations were conducted with the positions of the sphere: 0 ≤ x ≤ 5 mm and 0 ≤ y ≤ 5 mm for the case of a single upper electrode as well as −8 ≤ x ≤ 5 mm and 0 ≤ y ≤ 5 mm for the case of dual upper electrodes.
3. Results and Discussion
3.1. Case of an Isolated Cross Point
Figure 6 shows the experimentally obtained forces exerted on the glass sphere with arrows and colors. The magnitude of the forces indicated by colors means . The vectors (Fx, Fy) were determined by averaging the forces within the 0.5 mm square whose center is at the grid points. Because the glass sphere right under the upper electrode cannot be observed, only the forces at locations that are more than 0.5 mm away from the edges of the upper electrode are displayed. Forces other than at x = ±1 mm head to the cross point and decrease in magnitude with increasing distance from the cross point. In contrast, forces at x = ±1 mm are significantly larger, and their directions are more parallel to the x-axis and almost constant in magnitude with increasing distance from the cross point in the range of y from 0 to ±4 mm.
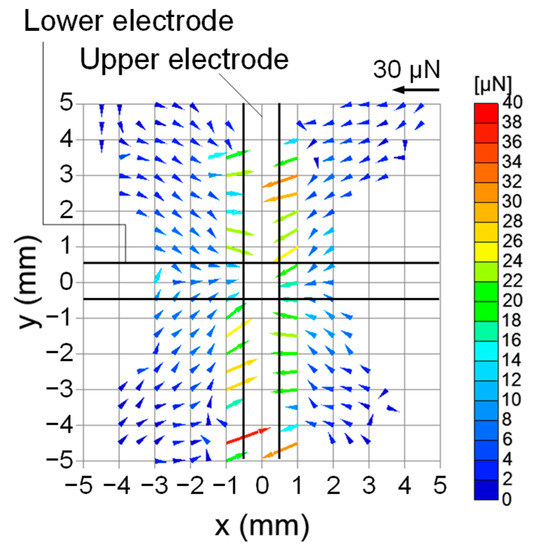
Figure 6.
Experimentally obtained electrostatic forces experienced by the glass sphere.
Figure 7 shows the x-component of the forces, Fx, at each y ranging from 0 to 5 mm obtained in the experiment. Significantly large forces at x = ±1 mm range from 10 to 20 µN, which are comparable to the weight of the sphere, 22.5 µN, and show no correlation with the y values in the range of y from 0 to ±4 mm. However, at remote locations ( ≥ 1.5 mm), the magnitude of Fx clearly decreases with increasing y and .
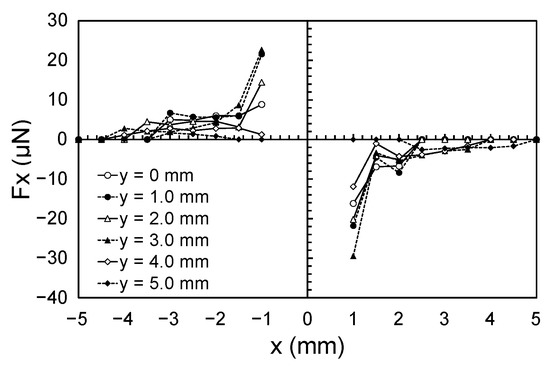
Figure 7.
x-Component of the forces, Fx at y = 0–5.0 mm.
Figure 8a,b show the forces determined by the experiment and the numerical simulation, respectively. To make the scales identical between (a) and (b), Figure 8a shows four times magnified arrows and color scale in Figure 6. The arrows at x = ±1 mm were removed to simplify the comparison. Figure 8b shows that all forces in the numerical simulation head to the cross point and the magnitudes increase when the distance from the cross-point decreases. The highest magnitude obtained was approximately 7 µN. The fact that the experimentally obtained force vectors appear to meet with those from the simulation in terms of direction and magnitude suggests that dielectrophoretic forces are dominant in the experiment, except at the locations of x = ±1 mm. The authors believe that some irregular forces (e.g., at approximately (x, y) = (−3.0, 0) and (−1.5, 3.5)) were created by the blurring of the trajectories caused by the roughness of the sphere surface and not by electrostatic forces.
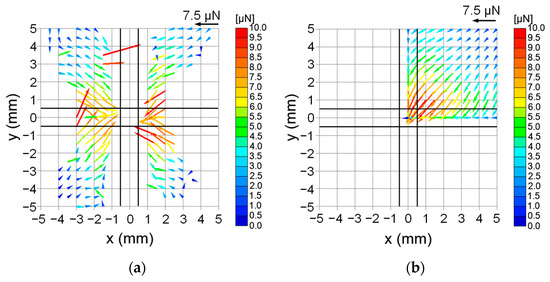
Figure 8.
Comparison between the experimental and the numerical simulation on electrostatic forces exerted on the glass sphere: (a) Experimental (four times magnified version of Figure 6 with arrows at x = ±1 mm hidden); (b) Simulation.
Figure 9a,b show Fx in the experiment and simulation, respectively. The values in Figure 9a are four times than those shown in Figure 7. Although the experimental values are not stable, their magnitudes are of the same order as those in the simulation in the range of ≥ 1.5 mm, which suggests that dielectrophoretic forces are dominant. The forces at the locations within 1.5 mm from x = 0 were significantly larger compared to those obtained by the simulation. This difference can be explained by the dielectric barrier discharge that can occur between the glass sphere and edges of the upper electrode. Ions of both polarities are divided to adhere to the surfaces of the glass sphere and glass plate, resulting in an attractive Coulombic force. Such forces head to the upper electrode and not to the cross point. In addition, these attractive forces may generate torque because the charges on the insulator surface do not necessarily spread uniformly over a short period. Therefore, there may be a difference between the true forces and those obtained using Equation (5).
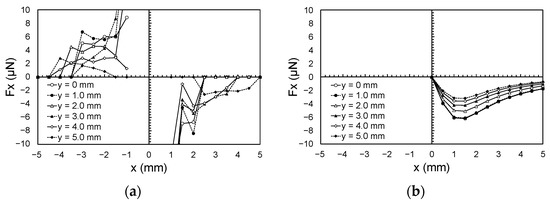
Figure 9.
Comparison between the experimental and the numerical simulation on x-component of the electrostatic forces: (a) Experimental (four times magnified version of Figure 7); (b) Simulation.
Figure 10b shows the magnitude of the electric field on the sphere obtained from the simulation when the sphere center is at x = 1 mm. As shown in Figure 10a, the magnitude of the field is on the great circle parallel to the zx-plane. The electric field was beyond the dielectric strength of air, 3 MV/m, at the bottom and top of the sphere except at the top of the sphere at y = 4 mm. This indicates that the discharge occurred during the experiment and explains the experimental result that the forces at x = ±1 mm did not decrease with increasing y (<4 mm). Discharge basically should be avoided because it disturbs the particle motion. The simplest countermeasure is using lower voltages. However, the authors believe other measures including the charge neutralization, which is applied when handling powder materials, should be tested to increase potential options in future works.
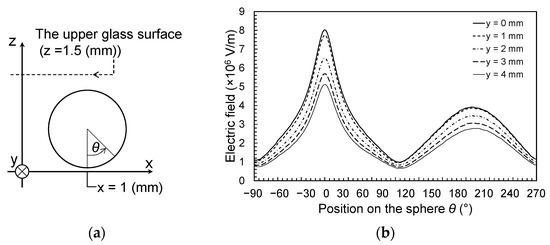
Figure 10.
Magnitude of the electric field on the glass sphere: (a) Definition of the position where electric field strengths are indicated; (b) The magnitude of electric field on the sphere when the sphere center is at x = 1 mm and y = 0–3 mm.
Figure 11 shows the vertical force, Fz, exerted on the glass sphere obtained from the simulation. Fz was downward at all the locations. This suggests that the assumption that the sphere does not slip but rolls on the glass plate is reasonable, considering that the friction coefficient between the glasses ranges from 0.9 to 1.0 [21].
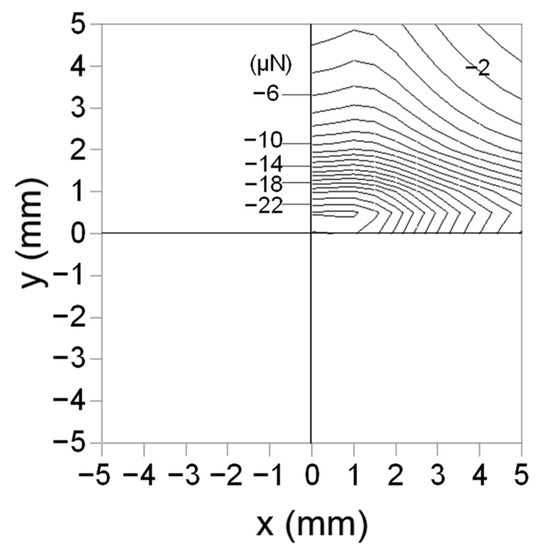
Figure 11.
Vertical component of the electrostatic force, Fz.
3.2. Case of Two Adjacent Cross Points
First, the glass sphere was transferred from the initial holding point to an adjacent point. Figure 12 and Figure 13 display the results when the upper electrode of the initial point was grounded and floated, respectively. The glass sphere was guided to the cross point at the left in the pictures in advance, and then a high voltage was applied at t = 0 ms. The positions of the glass sphere at every 100 ms are demonstrated. The transfer of the sphere was possible for both cases. However, in the case with the grounded upper electrode at the initial point, the sphere went largely beyond the destination despite the initial speed being small; therefore, it took approximately 800 ms to stop. However, with the floating potential at the upper electrode of the initial point, it took only 300 ms with a faster initial speed and less overshoot.

Figure 12.
Transfer from an initial holding point to the adjacent cross point (the upper electrode of the initial point is grounded).

Figure 13.
Transfer from an initial holding point to the adjacent cross point (the upper electrode of the initial point is floating).
Figure 14a,b compare the forces around the cross point of the destination (x = 0 mm) between the cases of the grounded and the floating upper electrodes of the initial point (x = −3 mm). In the grounded condition, significantly large forces of magnitudes greater than 40 µN occurred only at a line of x = −1 mm with very small forces near the initial point. In contrast, in the floating condition, more uniform forces existed from the initial to the destination with a maximum force of less than 24 µN at x = −1 mm. The lower initial speed and larger overshoot of the grounded case can be explained by the force distributions. At x > 0 mm, all the forces head to the cross point of the destination for both conditions. The forces at x = 1 mm were smaller compared to those found in the case of the isolated cross point for both conditions. This difference suggests that some of the lines of the electric field exited from the upper electrode of the destination to the adjacent electrode, resulting in the suppression of discharge at the electrode edge of x > 0 mm. In addition to the locations of x = 1 mm, the distribution of the force vectors in the floating condition resembles that of the isolated cross point.
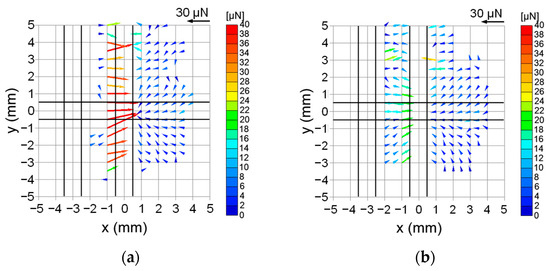
Figure 14.
Comparison of experimentally obtained electrostatic forces between the cases where the upper electrode of the initial point is grounded and floating: (a) The case of grounded; (b) The case of floating.
Figure 15a,b compare the force distributions between the experiment and simulation for the case with the grounded upper electrode of the initial holding point. The scale of Figure 15a is four times magnified than that in Figure 14a with the arrows at x = −1 mm hidden. In addition, in the simulation results, forces were found to concentrate at the electrode edge of x < 0 mm and oriented horizontally. It is understood that the large forces at x < 0 mm are caused by the increased gradient of E2 created by the large difference in the potential of the high-voltage and grounded electrodes. However, the forces were less than 15 µN even at x = −1 mm in the simulation result, which indicates the influence of the discharge at these locations in the experiment. In the region of x < −1.5 mm, comparison is impossible because the forces do not exceed the static friction force and they could not be estimated in the experiment. In the region of x > 0 mm, both the forces in the experiment and the simulation coincide well, except at several locations at x = 1 mm where discharge might occur.
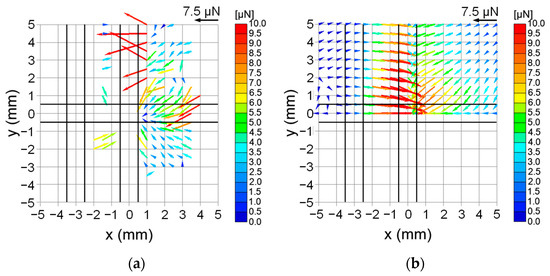
Figure 15.
Comparison of electrostatic forces between the experimental and the simulation for the cases where the upper electrode of the initial point is grounded: (a) Experimental (four times magnified version of Figure 14a with arrows at x = −1 mm hidden); (b) Simulation.
Figure 16a,b compare the force distributions between the experiment and simulation for the case where the potential at the upper electrode of the initial holding point is floated. Figure 16a is constructed in the same manner as in Figure 15a. In contrast to the grounding case, the simulation demonstrates that the magnitude of the forces is less than 7 µN, even at x = ±1 mm, which is similar to the result for the isolated cross point. A comparison with the simulation suggests that discharge probably caused large forces of up to 24 µN at x = −1.0 mm (Figure 14b) and forces found at several locations at x = ±1.5 and −2.0 mm. At other locations, the results of both the experiment and the simulation coincide well.
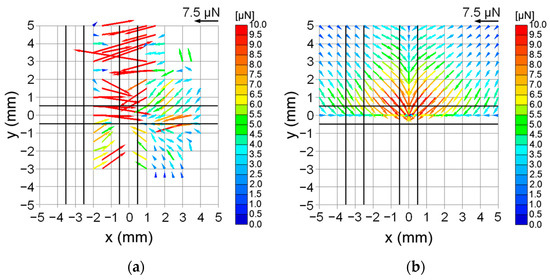
Figure 16.
Comparison of electrostatic forces between the experimental and the simulation for the cases where the upper electrode of the initial point is floating: (a) Experiment (four times magnified version of Figure 14b with arrows at x = −1 mm hidden); (b) Simulation.
A comparison between the cases where the upper electrode of the initial holding point is grounded and floated indicates that the latter case is more adequate for the transfer of objects. In addition, although no effect of contact charging was observed in this study, such an effect must be addressed to handle various materials in the future.
4. Conclusions
In this study, a manipulation device was designed for small objects with a lattice structure. This study investigates the characteristics of the most basic components. Two types of devices were tested. One of them consisted of two strip-shaped electrodes facing each other perpendicularly. The other type had a structure in which one of the electrodes of the former type was replaced with two parallel electrodes. The former and latter types have one and two cross points that hold the objects, respectively. The evaluation of the forces exerted on a small glass sphere as a model target object led to the following conclusions.
- (a)
- Applying a high voltage between two perpendicularly facing electrodes creates forces toward the cross point. A comparison with the numerical simulation indicated that dielectrophoretic forces were dominant among the forces observed in the experiment at locations sufficiently remote from the cross point.
- (b)
- Large forces are generated near the electrodes to which high voltages were applied. These forces could be attributed to the Coulombic force that works between the charges created by the dielectric barrier discharge.
- (c)
- The glass sphere is successfully transferred from one holding point to an adjacent point.
- (d)
- Two cases, one of which the electrode of the initial holding point was grounded and in the other of which that electrode was floated, were compared. For grounding, large forces are generated immediately before the destination point. This was caused by the large field gradient between the two electrodes. For floating, forces toward the destination were created more uniformly between the initial and destination points. In the latter case, the glass sphere was transferred faster and more smoothly. Therefore, the floating condition was a better manipulation device.
- (e)
- There are at least two problems to be solved in the future work: The manipulation of multiple objects with diverse sizes and shapes, and the development of the countermeasures against the discharge that disturbs transportation by dielectrophoretic force.
Author Contributions
Conceptualization, K.Y.; methodology, K.Y.; formal analysis, K.Y. and I.S.; investigation, K.Y. and I.S.; data curation, K.Y. and I.S.; writing—original draft preparation, K.Y.; writing—review and editing, K.Y.; supervision, K.Y.; project administration, K.Y.; funding acquisition, K.Y.; resources, K.Y.; visualization, K.Y. and I.S. All authors have read and agreed to the published version of the manuscript.
Funding
This research received no external funding.
Data Availability Statement
Data are contained within the article.
Acknowledgments
The authors are grateful to undergraduate student Shuya Uchida for assisting with the experiments.
Conflicts of Interest
The authors declare no conflict of interest.
References
- Nadjem, A.; Kachi, M.; Bekkara, F.; Medles, K.; Zeghloul, T.; Dascalescu, L. Triboelectrification of granular insulating materials as affected by dielectric barrier discharge (DBD) treatment. J. Electrost. 2017, 86, 18–23. [Google Scholar] [CrossRef]
- Zouaghi, A.; Zouzou, N. Numerical modeling of particle motion in traveling wave solar panels cleaning device. J. Electrost. 2021, 110, 103552. [Google Scholar] [CrossRef]
- Sayyah, A.; Horenstein, M.N.; Mazumder, M.K.; Ahmadi, G. Electrostatic force distribution on an electrodynamic screen. J. Electrost. 2016, 81, 24–36. [Google Scholar] [CrossRef]
- Horenstein, M.N.; Mazumder, M.; Sumner, R.C., Jr. Predicting particle trajectories on an electrodynamic screen—Theory and experiment. J. Electrost. 2013, 71, 185–188. [Google Scholar] [CrossRef]
- Calle, C.I.; Buhler, C.R.; McFall, J.L.; Snyder, S.J. Particle removal by electrostatic and dielectrophoretic forces for dust control during lunar exploration missions. J. Electrost. 2009, 67, 89–92. [Google Scholar] [CrossRef]
- Smallwood, J.; Praeger, M.; Chippendale, R.; Lewin, P. Dielectrophoretic adhesion of 50–300 μm particles under ambient atmospheric conditions. J. Electrost. 2016, 82, 1–6. [Google Scholar] [CrossRef]
- Ertugrul, I.; Ulkir, O. Dielectrophoretic separation of platelet cells in a microfluidic channel and optimization with fuzzy logic. RSC Adv. 2020, 10, 33731–33738. [Google Scholar] [CrossRef] [PubMed]
- Lee, D.; Hwang, B.; Kim, B. The potential of a dielectrophoresis activated cell sorter (DACS) as a next generation cell sorter. Micro Nano Syst. Lett. 2016, 4, 2. [Google Scholar] [CrossRef]
- Mustafa, A.; Pedone, E.; Marucci, L.; Moschou, D.; Lorenzo, M.D. A flow-through microfluidic chip for continuous dielectrophoretic separation of viable and non-viable human T-cells. Electrophoresis 2022, 43, 501–508. [Google Scholar] [CrossRef] [PubMed]
- Giduthuri, A.T.; Theodossiou, S.K.; Schiele, N.R.; Srivastava, S.K. Dielectrophoretic Characterization of Tenogenically Differentiating Mesenchymal Stem Cells. Biosensors 2021, 11, 50. [Google Scholar] [CrossRef] [PubMed]
- Sandu, T. Calculation of dielectrophoretic force acting on biological cells and on micro-and nanoparticles. In Proceedings of the International Semiconductor Conference, CAS, Sinaia, Romania, 12–14 October 2015; pp. 215–218. [Google Scholar]
- Benselama, A.M.; Pham, P.; Canot, É. Modeling of the dielectrophoretic forces acting upon biological cells: A numerical comparison between Finite Element/Boundary Element Maxwell stress tensor methods and point–dipole approach. In Proceedings of the NSTI Nanotech 2004, Boston, MA, USA, 7–11 March 2004; pp. 188–191. [Google Scholar]
- Washizu, M.; Techaumnat, B. Analysis of general multipolar images on dielectric layers for the calculation of DEP force. J. Electrost. 2013, 71, 854–861. [Google Scholar] [CrossRef]
- Green, N.G.; Ramos, A.; Morgan, H. Numerical solution of the dielectrophoretic and travelling wave forces for interdigitated electrode arrays using the finite element method. J. Electrost. 2002, 56, 235–254. [Google Scholar] [CrossRef]
- Limsimarat, A.; Techaumnat, B. Dynamic simulation using a multipolar model of particles under dielectrophoretic force. J. Electrost. 2007, 65, 672–679. [Google Scholar] [CrossRef]
- Cao, J.; Cheng, P.; Hong, F. A numerical analysis of forces imposed on particles in conventional dielectrophoresis in microchannels with interdigitated electrodes. J. Electrost. 2008, 66, 620–626. [Google Scholar] [CrossRef]
- Imasato, H.; Yamakawa, T. Measurement of dielectrophoretic force by employing controllable gravitational force. J. Electrophor. 2008, 52, 1–8. [Google Scholar] [CrossRef]
- Tathireddy, P.; Choi, Y.H.; Skliar, M. Particle AC electrokinetics in planar interdigitated microelectrode geometry. J. Electrost. 2008, 66, 609–619. [Google Scholar] [CrossRef]
- Williams, S.J.; Romero, N.; Parkes, L.; Jackson, D.J.; Naber, J.F. Inexpensive three-dimensional dielectrophoretic microfluidic devices using milled copperclad substrates. J. Electrost. 2015, 75, 49–53. [Google Scholar] [CrossRef]
- Kawamoto, H. Manipulation of single particles by utilizing electrostatic force. J. Electrost. 2009, 67, 850–861. [Google Scholar] [CrossRef]
- TriboNet, Friction Coefficient Tables in Air and Vacuum. 2017. Available online: https://www.tribonet.org/ (accessed on 1 April 2022).
Publisher’s Note: MDPI stays neutral with regard to jurisdictional claims in published maps and institutional affiliations. |
© 2022 by the authors. Licensee MDPI, Basel, Switzerland. This article is an open access article distributed under the terms and conditions of the Creative Commons Attribution (CC BY) license (https://creativecommons.org/licenses/by/4.0/).