Article

The Impact of Enterprise R&D Investment and Government Subsidies on Technological Progress: Evidence from China’s PV Industry

1
School of Business, Guilin University of Electronic Technology, Guilin 541004, China
2
School of Management Science and Engineering, Nanjing University of Information Science and Technology, Nanjing 210044, China
3
School of Economics and Management, Nanjing University of Aeronautics and Astronautics, Nanjing 211106, China
*
Author to whom correspondence should be addressed.
Energies 2022, 15(12), 4462; https://doi.org/10.3390/en15124462
Submission received: 22 May 2022 / Revised: 13 June 2022 / Accepted: 14 June 2022 / Published: 19 June 2022

Abstract

:
China has become the major stakeholder in global photovoltaic (PV) technology. However, the existing mechanistic interpretation of “what promotes the technological progress of the Chinese PV industry” is controversial. This paper takes China’s A-share listed PV enterprises from 1999 to 2019 as the research sample and uses a panel fixed-effect regression model to empirically test the impact of research and development (R&D) investment and government subsidies on the technological progress of PV enterprises. The results show that there is an “N”-shaped nexus between R&D investment and technological progress, and most PV enterprises are in the climbing stage of the N-shaped curve. With the development of the PV industry, the nexus will undergo a transformation from inverted U-shaped to N-shaped, indicating that R&D investment is a key driver of PV technological progress. Yet, government subsidies are a “double-edged sword”. They have a significant positive direct effect on PV technological progress but also a negative moderating effect. Tax returns play a positive incentivizing role, while financial subsidies play a negative moderating role. This study provides a policy basis for the timely reduction of financial subsidies and increased R&D investment to promote technological progress in China’s PV industry.

1. Introduction

PV power generation has the characteristics of being safe, not polluting the environment, involving a short power station construction cycle, and having fewer environmental constraints. Therefore, the substitution of PV power for fossil fuel is desirable [1]. The proportion of fossil energy in China’s current energy structure has risen to 84%. However, clean energy such as wind energy, hydropower, and PV power only accounts for 16%. At the 75th United Nations General Assembly in September 2020, the Chinese government announced that it would strive to reach its peak carbon dioxide emissions by 2030 and achieve carbon neutrality by 2060. The white paper entitled, “Energy in China’s New Era”, published by the State Council of China in December 2020, was put forward as the leading plan for PV power generation. The aim of implementing this plan is to promote PV power-generation technical progress and provide a powerful engine with which to reach the peak carbon dioxide emissions and achieve carbon-neutrality goals [2].
By the end of 2019, the cumulative installed capacity of global solar PV power generation will reach 586.4 GW, with the Asia-Pacific region supplying close to 55.7%. The Asia-Pacific region has become the main driving force behind global PV development. China’s cumulative solar PV power installed capacity is 205.5 GW, which is three times the installed capacity of Japan (61.8 GW) and is well ahead of other countries. For many years, China has been ranked number one in the world for the installed capacity and growth rate of solar PV power generation (Figure 1). Nine of the top-10 enterprises in global component shipments in 2019 were from China. Chinese enterprises such as Jinko and JA are in an advantageous position in terms of product quality, reliability, performance, and technological progress. The above enterprises have actively explored overseas and domestic markets, and their growth momentum will become more and more powerful. The Chinese PV industry has become one of the few industries that can simultaneously compete internationally and gain advantages.
China has benefitted from technical spillovers, the procurement of the most advanced production equipment, and the introduction of overseas technical engineers. Chinese enterprises have mastered how to apply technology to efficiently manufacture the modules in the PV value chain. In the last 10 years, the upstream and midstream of the global PV industry have transferred to China, and China has become the dominant force in the PV global value chain. Since the price of PV products has fallen sharply, PV enterprises in the United States, European Union, and other countries are facing increasing competitive pressure. A combination of internal and external factors has forced many PV enterprises to cease trading or let themselves be acquired by others. This partly explains why global PV patent applications have declined since 2011, while China maintains sustained and rapid growth (Figure 2). A similar but more complex pattern can be found when analyzing patent applications for photovoltaic-related technologies (Figure 3). This shows that the dependent development pattern of China’s PV industry has shifted to the development pattern of the whole industry chain, and China has become a major stakeholder in global PV technology.
However, there are controversies around why China has become the dominant global player in the PV industry chain in less than 10 years. According to one view, China’s ability to replace western countries in the PV industry hinges mainly on its low costs of labor and electricity, abundant material resources, and the potentially huge market [5]. This argument is unconvincing, however, since it does not explain why China has achieved technological progress upstream and downstream of the PV industry chain. In fact, after years of hard work, China’s PV industry has moved to the forefront of innovation, with Chinese enterprises also achieving manufacturing advantages. So, labor force factors and the scale economy are not the only reasons for the rapid development of China’s PV industry. Ignoring the important role of technological progress constitutes a failure to understand the real reasons for the rapid rise of China’s PV industry. All emerging industries face a severe challenge at some point, which leads to a reshuffling of power and advantage, especially during the “shifting racetrack” stage. Now at this point, product innovation in the PV industry has entered the “technological trajectory” fueled by the need to have a leading design. Cost-oriented competition and process innovation have accelerated the reshuffling of the global PV industry. Process innovation, beyond product innovation, has become key to gaining a competitive advantage, and market demand is rapidly expanding.
The comparative advantage of Chinese enterprises in this stage during the last 10 years is obvious. Since 2010, Chinese enterprises have replaced Japanese and German enterprises at the top spot [6]. The research of Zhao et al. showed that China has made great strides in PV power-generation technology, especially thanks to some key industry links [7]. Due to the technological progress of high-efficiency, low-pollution, high-reliability PV cells and power-generation systems, China’s PV industry has grown rapidly and continues to be at the forefront of global PV technological progress. The technical potential of solar PV power generation is almost unlimited theoretically. However, Zheng and Kammen noted that the R&D intensity of Chinese PV manufacturers is often lower than in other major countries; the current investment in Chinese PV is mainly focused on manufacturing and application, rather than R&D [8]. The lack of a focus on R&D led de la Tour et al. to propose that China’s PV success cannot be attributed to innovation [9] but instead to national policies and regulations, which have determined the development trajectory of the PV industry [10]. The Chinese government is good at utilizing industrial policy tools including government subsidies to support strategic emerging industries. China has thus adopted a mercantilist policy with massive government subsidies on the PV industry, aiming to develop the emerging renewable energy industry, achieve energy transformation, and support the green growth of China’s economy. These government subsidy policies have not only increased the pace of the PV industry reshuffle but have also led researchers to propose there are serious legitimacy issues. Germany’s renewable energy policy, potentially as a result of China’s, failed to foster industrial vitality in the country. For this reason and more, the Chinese subsidy policy for the PV industry has drawn wide criticism, with trade restrictions and more from the European Union as the result.
Yet, how exactly has this happened? Why has China’s PV industry achieved such a rapid rise? Considering the huge potential of China’s PV industry and its importance in the energy transition, the mechanisms through which government subsidy policies and R&D investment have influenced technological progress in China’s PV industry are obviously interesting. To explore those, this paper constructs a hypothetical conceptual model, as shown in Figure 4.
The main contributions of this paper are as follows: First, our empirical evidence shows that although there is a non-linear “N”-shaped nexus between R&D investment and technological progress for Chinese PV enterprises, the vast majority of PV enterprises are at the front end of the N-shaped curve. With the development of the PV industry, there is a transition from an inverted U-shaped to an N-shaped nexus. This proves that harnessing R&D investment to achieve technological progress is an important driving force for China’s PV industry, and it provides a good explanation for how China’s PV industry has risen rapidly in under 20 years. Although previous studies proposed that China’s ability to replace western countries in the PV industry has mainly resulted from its low costs of labor and electricity, abundant material resources, and potentially huge market [5], the empirical results of this paper correct the above ideas. Second, government subsidies are shown to have had a direct and significant positive incentivizing effect on technological progress. This positive and direct effect became particularly obvious after 2013, at which time the supervision of various subsidies to the PV industry came to be increasingly standardized and strengthened by the Chinese government. However, we find that government subsidies, mainly financial, have a negative moderating effect on the nexus between R&D investment and technological progress. This shows that as a “double-edged sword”, more government subsidies are not necessarily better. Our study forms a response to the academic voices proposing that government subsidy policies may excessively interfere with the technological progress of the PV industry, and it also provides a policy basis for the Chinese government to implement a financial subsidy reduction policy at the right time. Third, compared with financial subsidies, tax returns, as a “post”-subsidy method, are shown to have great advantages in eliminating negative external effects and avoiding efficiency losses. This provides a solution for PV enterprises seeking to avoid the double dilemma of government subsidy dependence and huge financial pressure from the government.
The remainder of this article is structured as follows. The following section reviews the previous literature on R&D investment and government subsidies, presents a corresponding theoretical analysis, and then puts forward research hypotheses. Section 3 then explains the materials and methods used in this study. Section 4 summarizes the empirical results, carries out a robustness test, and then conducts data analyses. Section 5 summarizes the research conclusions and policy recommendations. At the same time, the limitations of this paper are outlined and directions for future research proposed.

2. Theoretical Analysis and Research Hypothesis

2.1. Direct Effect of Enterprise R&D Investment on PV Technological Progress

Endogenous economic growth theory holds that R&D investment is the driving force of technological progress, and technological progress is the product of accumulated knowledge and experience [11]. Different from neoclassical economic theory, endogenous economic growth theory is more focused on R&D investment, and views technological progress as the result of manufacturers’ active R&D investment to maximize profits. However, there are still some controversies about the nexus between R&D investment and technological progress. One view is that R&D investment is a good predictor of technological progress, which is justified in the following way [12,13].
The strategic emerging PV industry is capital- and technology-intensive. The researcher Kazmerski found that technological innovation and reduced production costs are sources of advantage for PV enterprises in the current early stage of industry development [14]. Yet, this industry is not only full of growth potential but also huge innovation risks that enterprises must navigate. If they can succeed, focusing on R&D investment to achieve technological progress and sustainable development is a strong move for PV enterprises. The results of the Watanabe et al. study into the Japanese PV industry showed that through investment plans such as the “Sunshine Project” (1974) and the “New Sunshine Project” (1993), Japan finally formed a virtuous cycle of “R&D—market growth—price drop—R&D” [15]. In such a way, R&D investment is both a sign of the beginning of industrial-technological progress and the basis for the continuous development of technological advancement capabilities [16]. It is common practice for almost all industries to gain technological capabilities through R&D investment [17].
Through the joint efforts of policy support and R&D investment from enterprises, it is proposed that China’s PV industry has successfully realized the transition from policy-driven to market-driven and has grown into one of the few emerging industries that can simultaneously compete internationally and build strong advantages in massive industrial production. The number of international patent applications filed by China’s PV industry shows that its technological capabilities continue to increase, approaching the world technology frontier [18]. The transformation and upgrading of China’s PV industry attest to how the key to technological progress in the PV industry may lie in persistent R&D investment. In support of this, the empirical results of Zhao and Wang verify that the driving force for the growth of China’s PV industry has shifted from factor input to R&D investment [19].
The strength of Chinese enterprises’ technological R&D progress is by no means an overnight effort. Long-term R&D investment by the enterprise is needed to reap the rewards. Figure 5 illustrates how R&D investment in China’s PV industry has been showing an upward trend, with the growth rate increasing substantially. According to Blackhawk PV’s statistics on R&D intensity, in the first half of 2019, the total R&D expenses of 50 listed PV enterprises accounted for 2.96% of the total revenue (R&D intensity), while the R&D spending of Sungrow Power and Oriental Risheng was as high as 4–5%. Chinese PV enterprises clearly seek to increase R&D investment to promote technological progress in the PV industry. A McKinsey research report comparing the major country origins of the leading and competitive industries worldwide presented how China’s PV industry and products comprise its absolute leading industry. This reinforces the notion that R&D investment is an important driving force for technological progress.
Another view is that the nexus between R&D investment and technological progress is not simple or linear. Knott asserted that true innovation requires more than just R&D budgets [20], with a narrow understanding of “what innovation is” and confusion between innovation and R&D resulting in an overemphasis on the role of R&D investment in promoting innovation [20]. The researcher put forward a new concept of “R&D IQ”, where the ability to innovate is determined not by the R&D input or output but also by the efficiency of those [20]. One research result showed that there is an inverted U-shaped threshold effect between R&D investment and enterprise technological progress [21], and Daniel proposed that excessive R&D investment may not match production capacity, resulting in inevitable waste, with innovation benefits offset by huge expenditures [22]. In further research, empirical tests found that with an increase in R&D intensity, continuous R&D investment will generate a “negative—positive—negative” non-linear nexus for technological progress [23].
Yet, elsewhere in the literature, research conclusions of the above literatures hint at the possibility of an N-shaped curve of the nexus between R&D investment and technological progress.
Hence, this paper puts forward the following hypothesis:
Hypothesis 1 (H1).
There is an “N”-shaped nexus between enterprise R&D investment and technological progress.

2.2. Direct Effect of Government Subsidies on PV Technology Progress

Two aspects of the Chinese PV industry are explainable by the direct effect of government subsidies on the technological progress of PV enterprises. First, the technological progress of the PV industry has a strong externality. Nelson and Arrow described how due to the non-exclusiveness of innovation income, indivisibility of the innovation process, and high risk, innovation resources may not be well allocated and may deviate from the optimal Pareto state, leading market failures to occur. This view provides a theoretical basis for the government to intervene in technological advancement activities. In public finance theory, the stronger the public goods attribute of the product, the stronger the government’s support. Considering that the PV industry is a strategic emerging industry with fierce market competition, and the revenue spillover of PV technology progress is prominent, the government has been inspired to use fiscal subsidy tools to plug the gap between social marginal benefits and costs and reduce the negative impact of externalities.
Second, government subsidies have a funding effect. We contend that government subsidies are capital factors that can be used as inputs, most notably to play an incentivizing role in guiding technological progress. As such, in the early stages of PV industry development, the application of government subsidies and other policies to support the PV industry has been common practice for major PV powers. Government subsidies can ease the difficulties in organizing innovation financing, have a smoothing effect on innovation investment to reduce the market failure risk of the R&D activities of PV enterprises, and encourage technological progress and scale expansion to quickly corner the market.
Hence, this paper puts forward Hypothesis 2:
Hypothesis 2 (H2).
Government subsidies have a significant positive promoting effect on technological progress.

2.3. Moderating Effect of Government Subsidies

Existing research shows that as a “visible hand”, government support actions moderate technological progress [24]. This means that the ratio of technological output to input may change with the intensity of government subsidies [25]. Regardless of their intensity, government subsidies are always a controversial political issue. New Keynesian theory holds that both the market and government may fail. Government failure is most likely to result from high intervention costs, low efficiency, decision-making errors, and corruption. China has a mixed economy, that is to say, it does not have a purely traditional and planned economical system, and the market also plays an important role in the national economy. Therefore, China is a government-dominated market economy. In that context, we propose that excessive intervention could harm the PV industry. Yet, looking at Figure 6, it seems the Chinese government has paid sufficient attention to the importance of developing the PV industry through long-term and increasing subsidies. If it had not, we have reason to think that an excessively intervening government subsidy policy would have not only increased the uncertainty in the development of China’s PV industry but also delayed the technological innovation process of the PV industry, though the government subsidies may have stimulated scale expansion in the short-term.
In general, government subsidy policies may have both positive and negative stimulus effects on the short-term technological progress of enterprises, but in the long run, they negatively moderate progress as a whole. The long-term effect of government subsidies is not only limited but also has a diminishing marginal benefit [26]. In view of this, it is a wise choice to introduce a subsidy reduction policy when the enhancement effect on technological innovation is no longer significant. It may already be noted that, during the early development stages of China’s PV industry, many PV enterprises exploited loopholes in subsidy policies to cheat the government through its subsidies with false projects, demolition after construction, and shoddy work, and so, in many cases, the subsidy policies have not exerted the so-called “guidance effect”.
Can government subsidies continue to drive innovation and progress in the PV industry? Are there differences between different government subsidy methods? Judging from the actual development of China’s PV industry, government subsidies have indeed promoted its rapid progress. Yet, we believe that government subsidy policies are a “double-edged sword”. On the one hand, they have indeed spurred the large-scale expansion of the PV industry. However, on the other hand, excessive government subsidies can be used inefficiently and delay industrial-technological progress.
Hence, this paper puts forward Hypothesis 3:
Hypothesis 3. (H3).
Government subsidies have a negative moderating effect on the nexus between enterprise R&D investment and technological progress.

3. Materials and Methods

3.1. Empirical Model

The primary concern of the current research was whether enterprise R&D investment and government subsidies can together promote technological progress in China’s PV industry. Based on the previous theoretical analysis and research hypotheses and improving on the paper of Li and Chen [27], this research project refined the relationship between variables and proposed a nonlinear model. The model setup is as follows.
Model 1:
l n P a t e n t s i t = β 0 + β 1 R D I i t + β 2 R D I i t 2 + β 3 R D I i t 3 + β 4 X i t + μ i + ν t + ε i t .  
Model 2:
l n P a t e n t s i t = β 0 + β 1 G o v S u b i t + β 2 X i t + μ i + ν t + ε i t .  
Model 3:
l n P a t e n t s i t = β 0 + β 1 R D I i t + β 2 R D I + β 3 R D I i t 3 + β 4 G o v S u b i t + β 5 G o v S u b i t × R D I i t + β 6 G o v S u b i t × R D I i t 2 + β 7 G o v S u b i t × R D I i t 3 + β 8 X i t + μ i + ν t + ε i t
where i represents the enterprise, t represents the year, lnPatents stands for technological progress, RDI stands for R&D investment, RDI2 stands for the square of R&D investment, RDI3 stands for the cube of R&D investment, GovSub stands for government subsidies, GovSub × RDI stands for the interaction between government subsidies and R&D investment, GovSub × RDI2 stands for the interaction between government subsidies and R&D investment squared, GovSub × RDI3 stands for the interaction between government subsidies and R&D investment cubed, Xit stands for the control variable vector, μi denotes individual fixed effects, νt denotes time fixed effects, and εit is a stochastic disturbance team.

3.2. Data Sources and Variable Descriptions

This research was based on enterprise-level panel data from 1999 to 2019, which included datasets such as the number of patent authorizations, R&D investment, government subsidies, and R&D personnel. Of these, the number of patent authorizations was taken from the China Research Data Service Platform (CNRDS) [28]; the R&D personnel came from the Wind database [29] and were supplemented with Oriental Wealth [30]; the financial data related to the enterprise, such as government subsidies, R&D investment, and the asset-liability ratio, were taken from the CSMAR Data Service Center [31] and the Wind Financial Database [29], and the data were supplemented to a certain extent with information from the annual financial reports of listed enterprises. Since the datasets used were taken from multiple databases, the current study consolidated the data in the following ways: We found the names and stock codes of all listed enterprises in the PV industry in the A-share PV concept sector (excluding special treatment enterprises) and then matched the databases with the stock codes of the PV listed enterprises, merging them to form the final dataset.

3.2.1. Technological Progress

Technological progress (lnPatents) was the dependent variable. To upgrade their core competitive ability, enterprises often apply for patents to maintain their technological advantages and so attract greater profits [32]. Therefore, the number of patent authorizations may be seen as the most direct reflection of innovative activity. Moreover, the authorization of invention patents, which is closely vetted by patent examiners, necessitates that the innovation has strong practicability and creativity. Since patent applications are usually made for commercial purposes, their application and maintenance require a significant amount of time and high costs, which attest to the applicant’s belief that the patented innovation can bring them the expected economic returns [33]. Compared with patent applications, authorized patents thus better represent a creative work achievement and successful commercialization of this by the inventor(s). To that end, this paper selected the number of patents authorizations by the enterprise and used the natural logarithm to measure from this the enterprise’s technological progress.

3.2.2. R&D Investment

R&D investment (RDI) was the independent variable, attesting to the upgrade opportunities for enterprises [34] and also representing the most important predictive variable of enterprise technological innovation. Referring to Liu and Jiang [35] and Sun and Wang [36], this project used the ratio of enterprise R&D expenditure divided by the total operating income to measure R&D investment.

3.2.3. Government Subsidies

Based on our hypothetical conceptual model (Figure 4), government subsidies have direct and moderating effects. Government subsidies (GovSub) may largely be divided into financial subsidies and tax returns, and this paper used the ratio of the total operating income to the sum of the government subsidies received by the enterprise and the tax return in the current period, to measure the intensity of the government subsidies [27].

3.2.4. Control Variables

Referring to the previous research, this paper chose the following factors for its research and analysis: R&D personnel (RDP) [37]), debt-to-asset ratio (Debt) [27], enterprise scale (lnAssets) [38], operating income growth rate (OIGR) [27], Tobin’s Q (TQ) [27], age of the enterprise (lnAGE) [39], return on total assets ratio (ROA) [35], and equity ratio (ER) [27]. We used these seven factors as the control variables of the model.
The above variables are presented in Table 1.

3.3. Sample Selection

We chose A-share listed enterprises in the PV industry from 1999 to 2019 as the initial research sample. Following the methods of Wang and Zhang [40] and Li et al. [41], the initial sample was screened as follows: (1) we excluded listed enterprises with a severe lack of variables; (2) excluded listed enterprises with financial abnormalities, such as special treatment (ST and ST*); (3) excluded listed enterprises that withdrew from the Stock Exchange during the investigation period; (4) excluded enterprises listed after 1999. Finally, a dataset of balanced panels including 672 observations from 32 listed PV enterprises in the 21 years from 1999 to 2019 was obtained.

4. Empirical Results and Discussion

4.1. Descriptive Statistical Analysis

Table 2 reports the descriptive statistical analysis of the sample variables. Among these, the dependent variable is technological progress (lnPatents). The average value of technological progress in the sample can be seen to be 1.435, the minimum is 0, the maximum is 5.645, and the standard deviation is 1.694, which indicates a wide gap between the technological progress of the sampled enterprises. Similarly, the independent variable, R&D investment (RDI), varies from 0 to 12.873, with an average value of 0.691 and a standard deviation of 1.535, indicating that the R&D investment of listed enterprises in the PV industry varies greatly. Most of the sampled enterprises have not actively filed research and development patents, and most seriously lack R&D investment. The government subsidy (GovSub) varies from 0 to 0.263, with an average value of 0.017 and a standard deviation of 0.033, indicating that the difference in government subsidies received by PV enterprises is again large.
Based on these findings, we saw there was a need to thoroughly explore whether R&D investment and government subsidies stimulated or guided the technological progress of Chinese PV enterprises during the study period.

4.2. Correlation Analysis

It can be seen from Table 3 that the dependent variable technological progress (lnPatents), the independent variable R&D investment (RDI), and the direct/moderating variable government subsidy (GovSub) are all significantly positively correlated at the 1% level, and there is an association between the three. There is also a positive correlation between R&D investment and government subsidies, which is significant at the 1% level. At the same time, the independent variable and control variables are significantly positively correlated, with the exception of the debt-to-asset ratio (debt), return on total assets ratio (ROA), and equity ratio (ER), which are not significant.
The information obtained by the correlation coefficient matrix required further quantitative analysis.

4.3. Benchmark Regression Analysis

Before estimating the regression model, we conducted multicollinearity tests on all explanatory variables. The results showed that the variance inflation factor (VIF) value among all variables was much lower than 10, indicating that there was no problem with multicollinearity. In this paper, the Hausman test was performed before regression, and a panel fixed-effect regression model was selected to estimate the parameters. Table 4 reports the regression results of Models 1–3.

4.3.1. Direct Effect of R&D Investment

As can be observed from Model 1 in Table 4, the respective estimated coefficients for enterprise R&D investment (RDI), R&D investment squared (RDI2), and R&D investment cubed (RDI3) are 0.757, −0.134, and 0.007, which are significant at 1%, 5%, and 10% levels, respectively, indicating that there may be an N-shaped non-linear nexus between R&D investment and technological progress and thereby validating the rationale of Hypothesis 1. In Model 3, the respective estimated coefficients for RDI, RDI2, and RDI3 are 1.193, −0.299, and 0.021, respectively, which are significant at the 1% level. This still indicates that there is an N-shaped nexus between R&D investment and technological progress, verifying Hypothesis 1 once again.
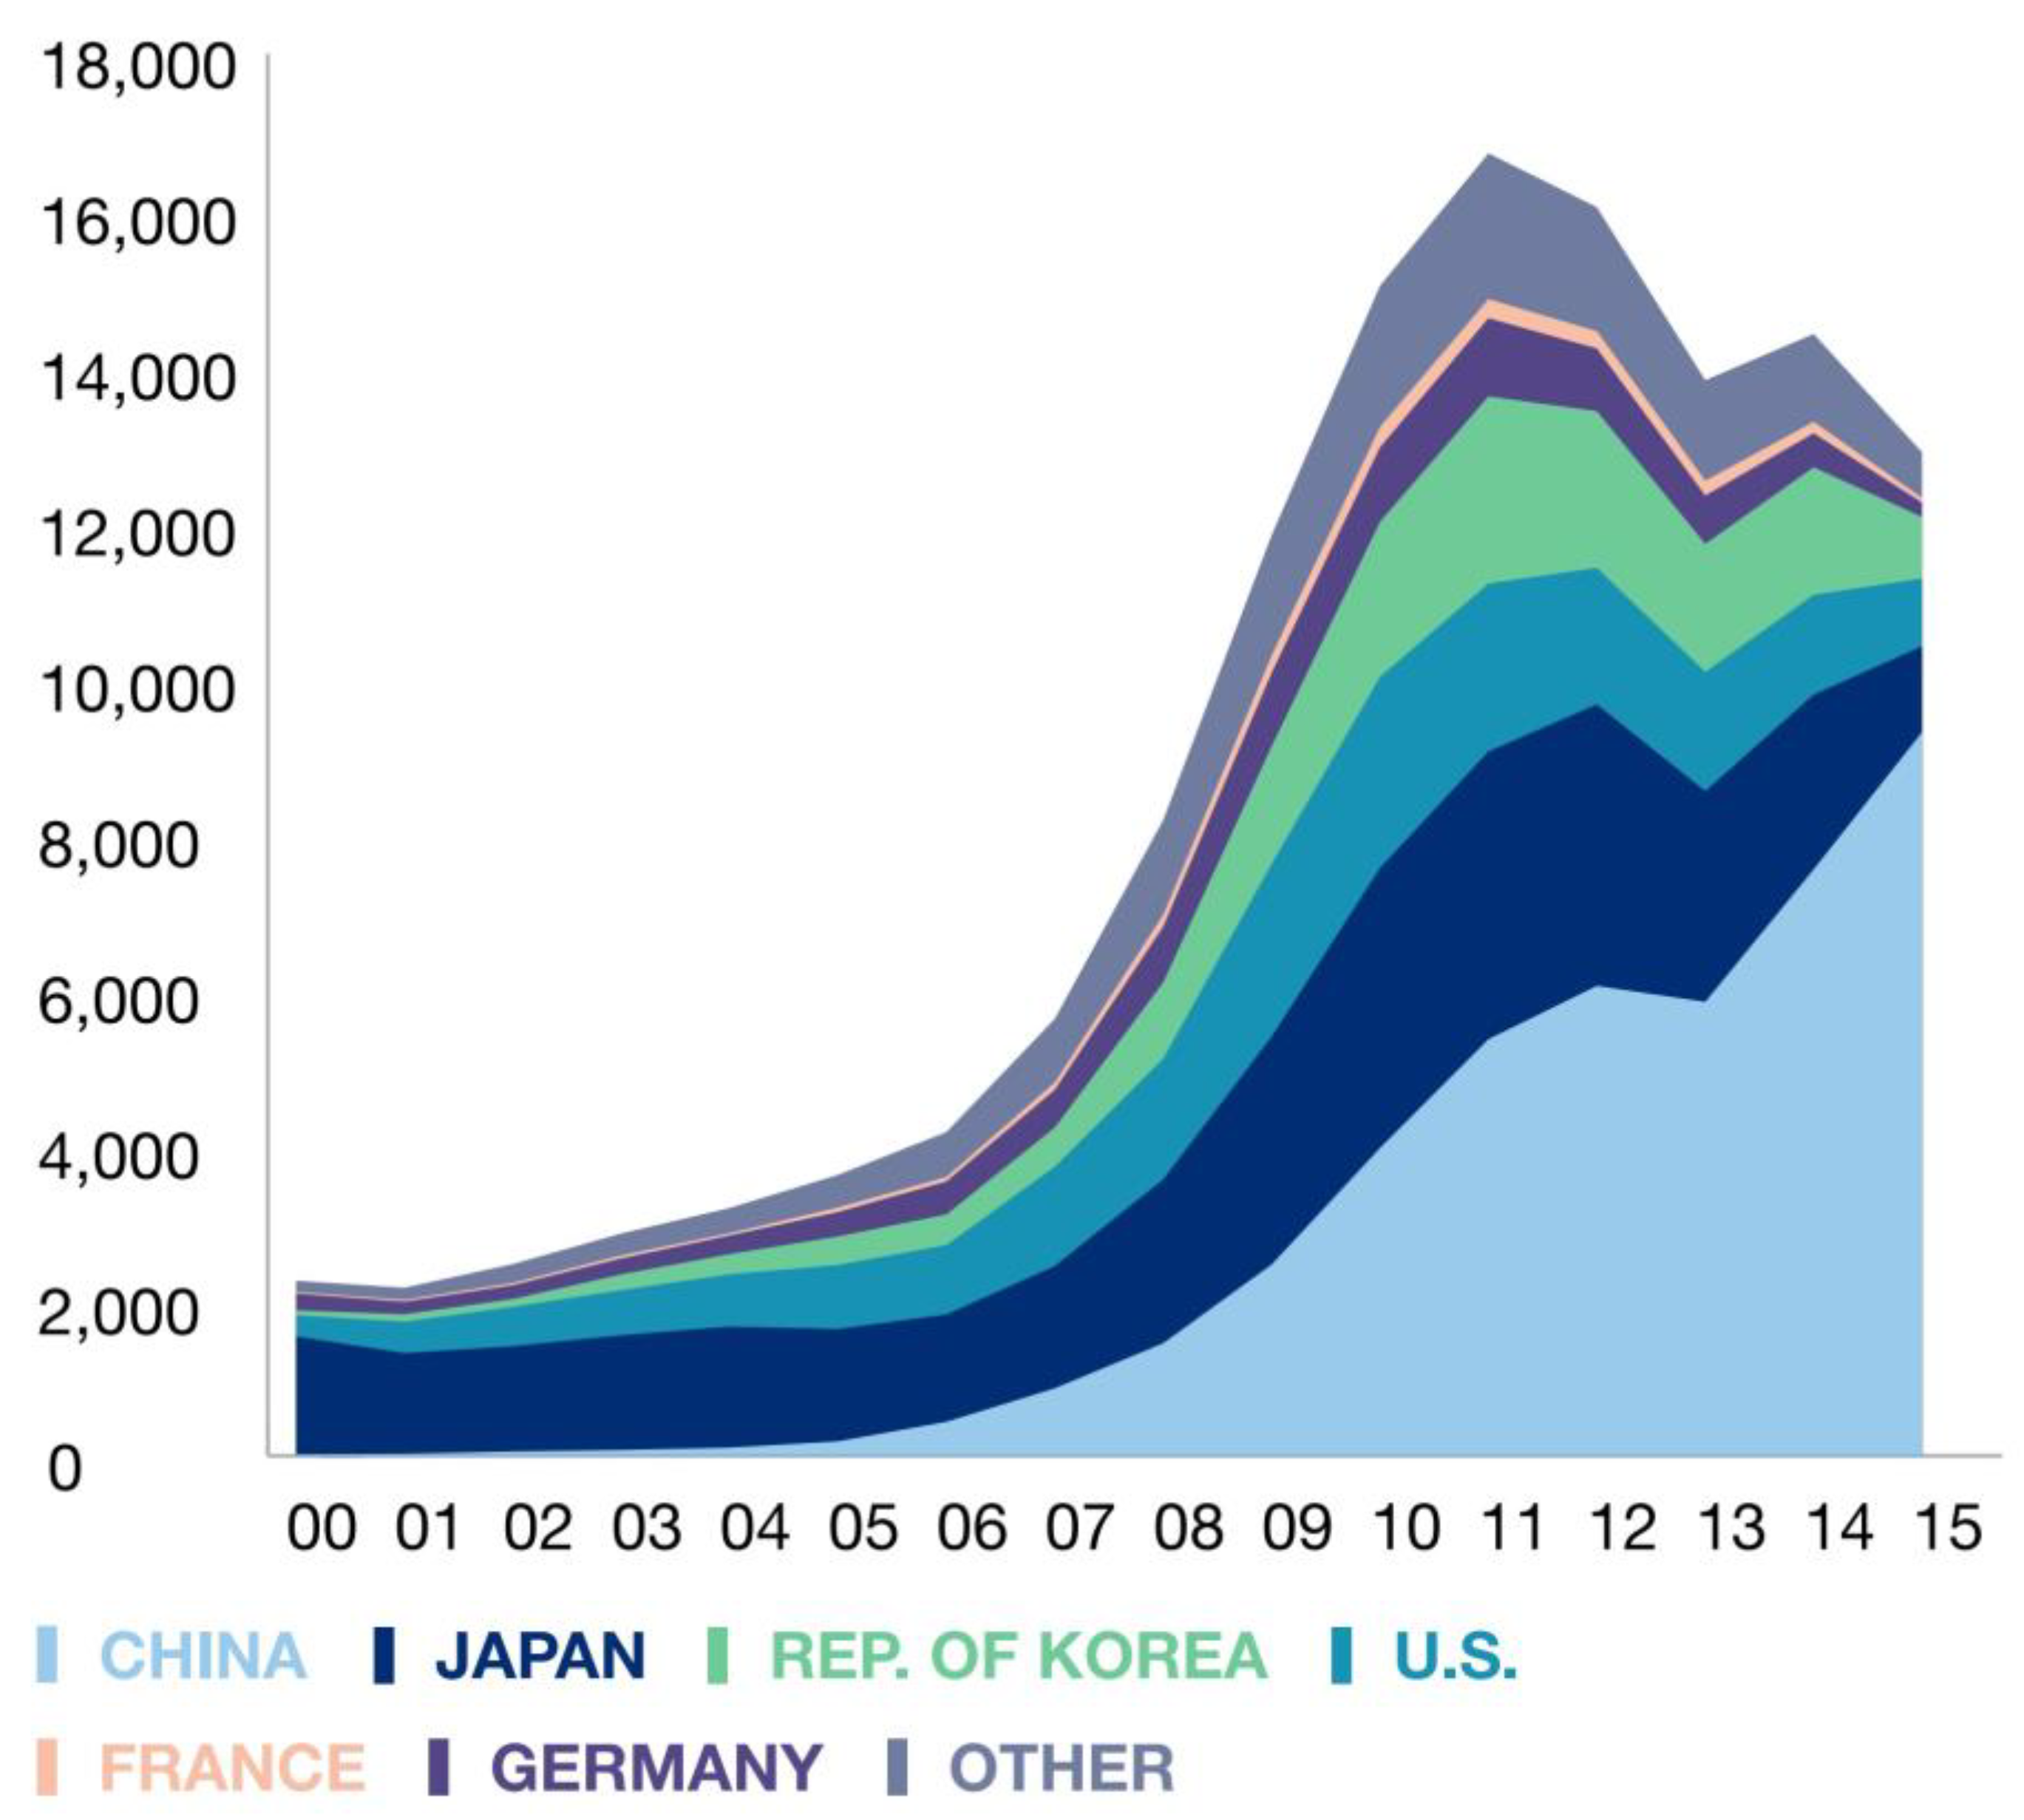
Technological progress and low production costs are two major driving forces that profoundly change the development paradigm of China’s PV industry. According to the findings of this research, a non-linear N-shaped curve represents the nexus between PV enterprises’ R&D investment and technological progress. Therefore, it has been necessary to increase R&D investment in the early development stage of China’s PV industry. The R&D investment of Chinese PV enterprises, especially in the upstream crystalline silicon, silicon wafer, and midstream module manufacturing links of the industrial chain, maintained a growth trend from 1999 to 2019. With the increase in R&D investment, China’s PV industry has been able to achieve innovative development. Crystal silicon and battery products with different technical routes are emerging continuously, such as high-purity polycrystalline silicon, monocrystalline passivated emitters and rear cells, and films. The photoelectric conversion efficiency in China has reached more than 24%, representing the world’s leading level.
However, it is not necessarily the case that the more money spent on R&D, the better. The efficiency of R&D input and output is the key to improving the innovation of PV enterprises. Penrose’s resource-based theory holds that enterprise efficiency is determined not only by the investment in resources but also by the management of those resources [42]. PV enterprises that only focus on R&D investment and ignore R&D management will lack innovation ability and only reap the effects of a “mountain of labor”. As such, Chinese PV enterprises should pay attention to the R&D IQ concept proposed by Knott and focus on R&D efficiency [20]. In addition, reducing costs is an important factor for Chinese PV enterprises if they are to increase their market share by bettering the competition, which they can achieve by increasing their production capacity and building large-scale industrial development. Yet, many PV enterprises may “squeeze out” some of their R&D funds, which may delay their technological progress. Moreover, when the R&D investment of PV enterprises exceeds the inflection point, it will not bring the same degree of enterprise technological innovation performance improvement. This conclusion is basically consistent with the findings of [21,43]. Yet, all these studies indicate that, in the long run, increasing R&D investment is still the fundamental driving force for improving enterprises’ innovation capability and sustainable development.
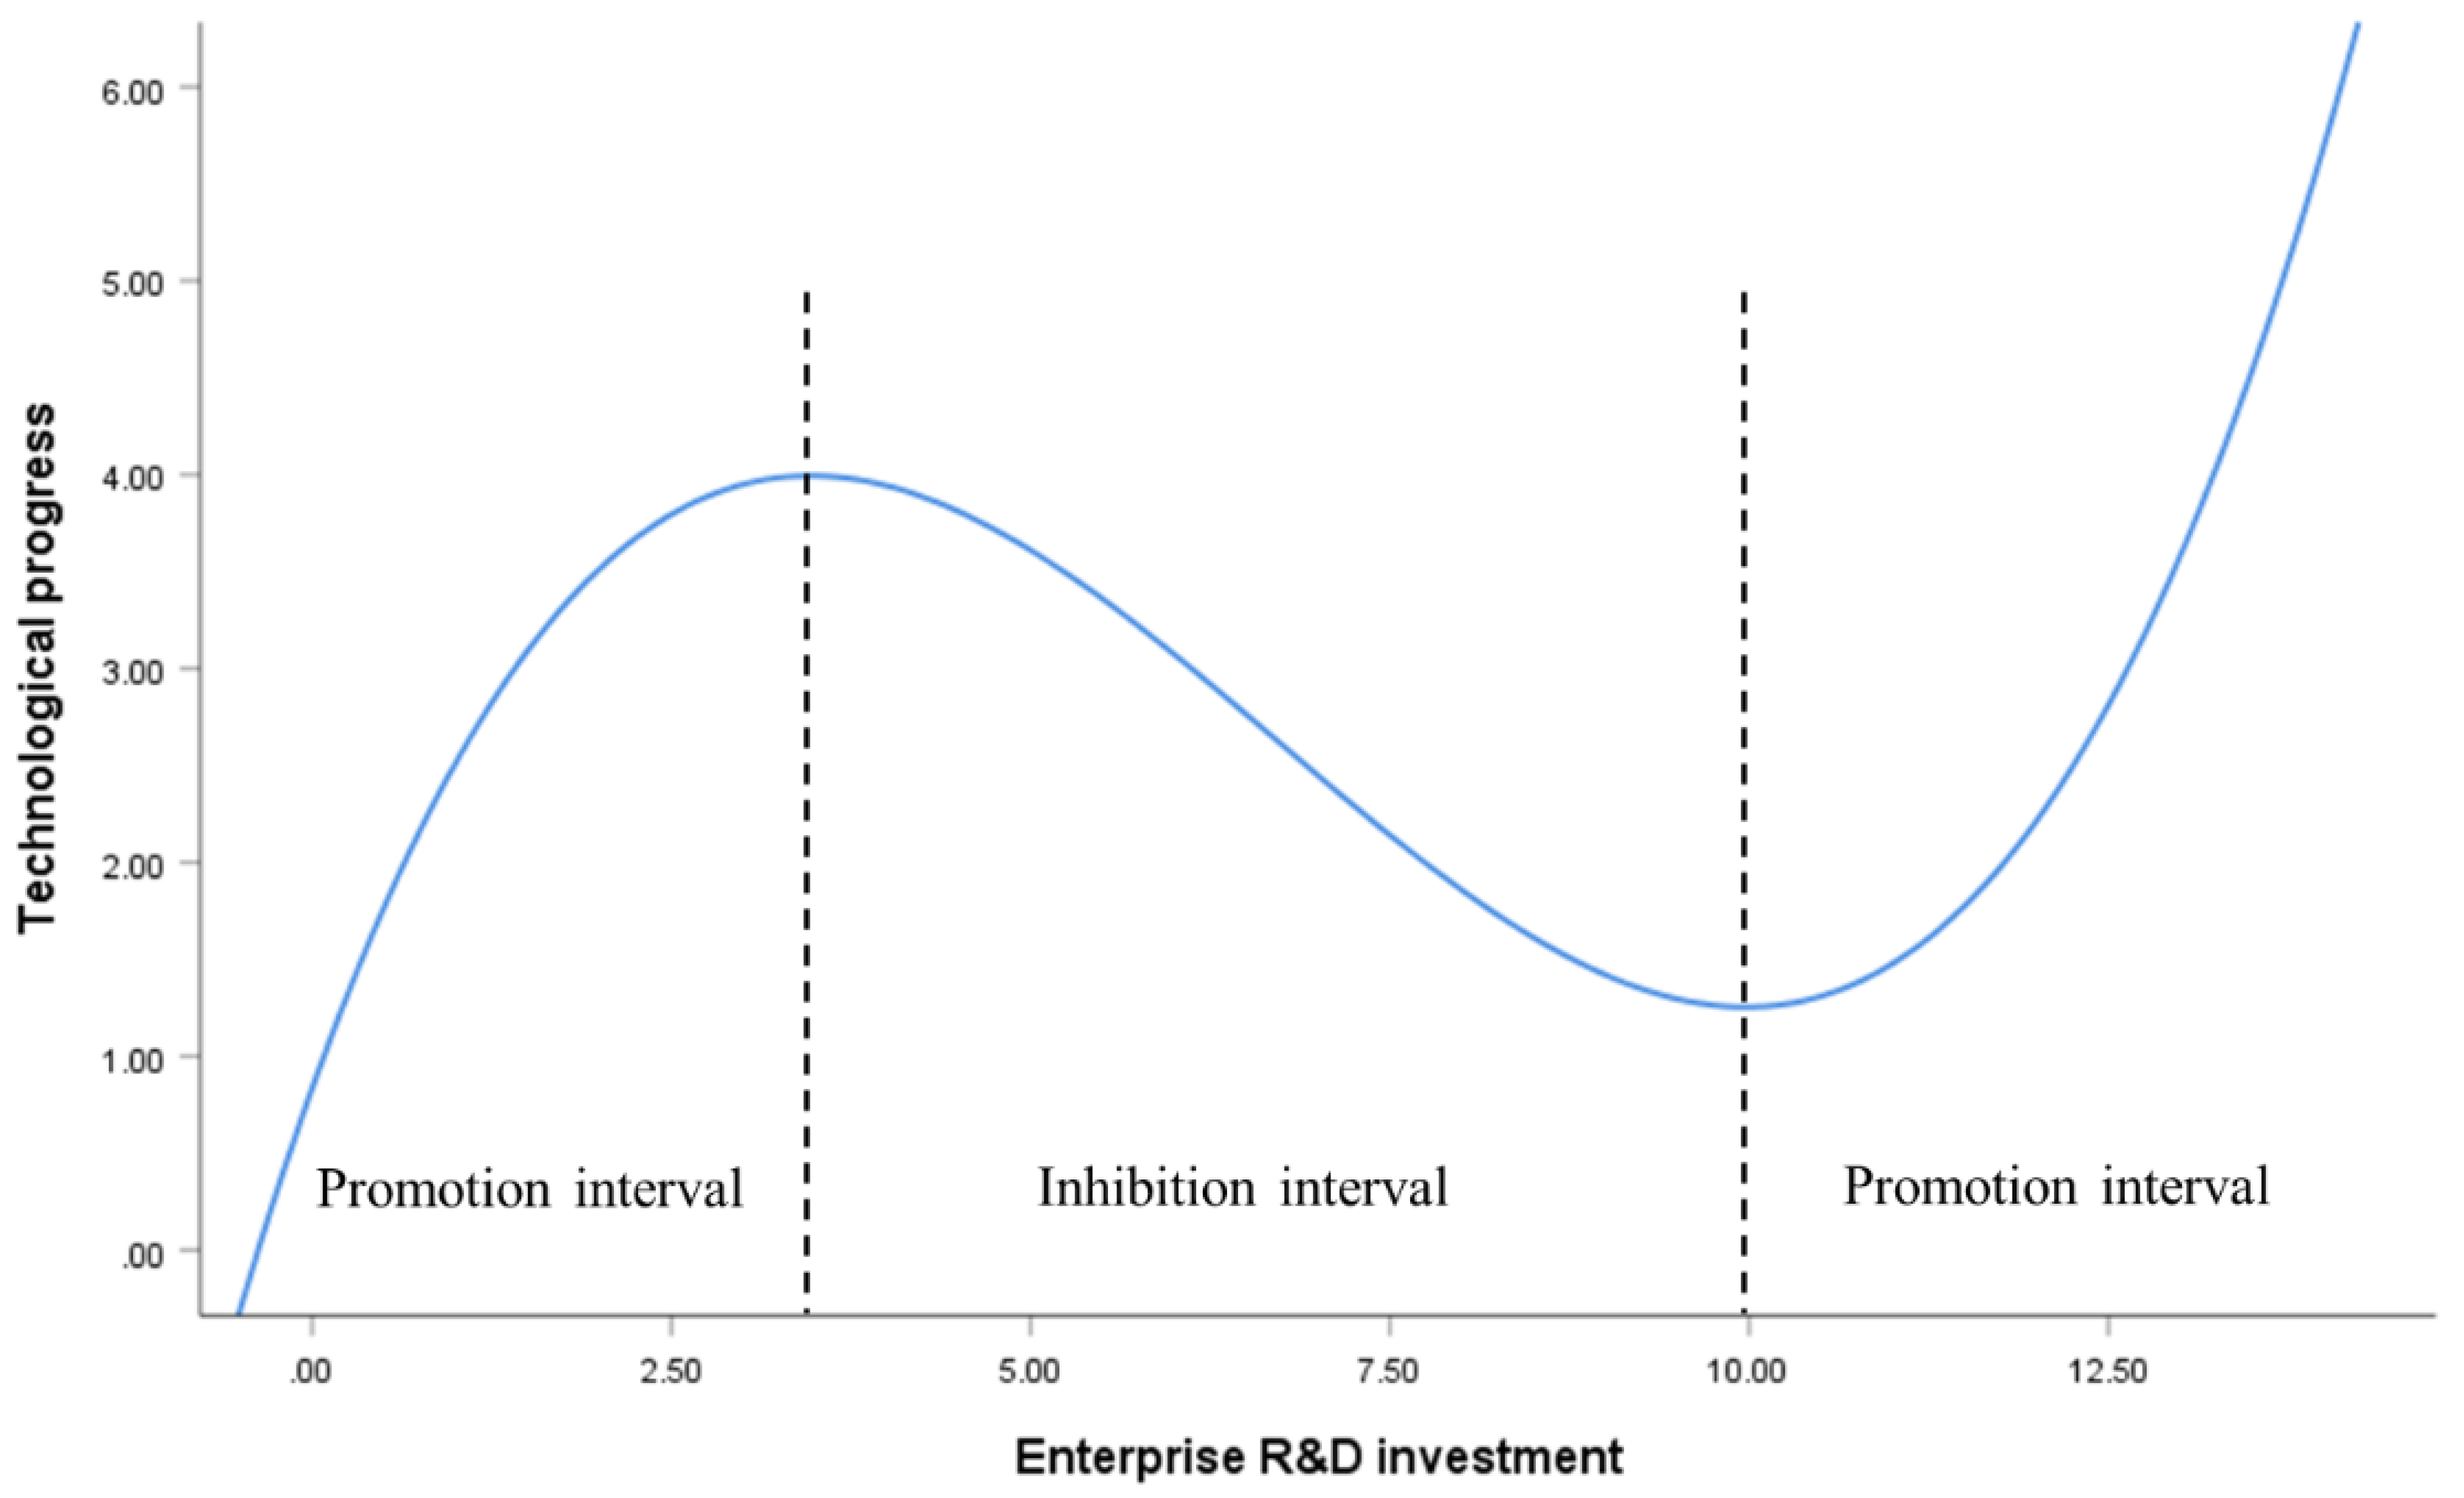
To explain Hypothesis 1 further intuitively, we have drawn a fitting diagram of R&D investment (RDI) and technological progress (lnPatents) free of the influence of other variables, as shown in Figure 7. The line graph illustrates the changing trend of technological progress at different levels of enterprise R&D investment without considering other variables. As can be seen in Figure 7, the nexus between R&D investment and technological progress is an N-shaped curve. Supporting this, the preliminary conclusion drawn from the previous descriptive statistical analysis was that the R&D investment and technological progress of PV enterprises may be very different. In fact, most PV enterprises have a serious lack of R&D investment and have not taken the initiative to make technological progress. Accordingly, most of the enterprises in the sample are located at the left “promotion interval” of the first inflection point of the N-shaped curve, seeking to promote their technological progress by increasing R&D investment. Meanwhile, only a very small number of PV enterprises are at the right end of the second inflection point. So, we consider that China’s PV industry is still in the climbing stage, and will remain there for a long time in the future. For now, Chinese PV enterprises must continue to increase R&D investment to promote technological progress.

4.3.2. Direct Positive Effect of Government Subsidies

As we can see from Model 2 in Table 4, the regression coefficient of government subsidies (GovSub) is 4.546, which is significant at the 5% level. In Model 3, the regression coefficient of GovSub is 4.764, which is significant at the 10% level. These results show that the incentivizing effect of government subsidies obtained by PV enterprises is clear, thus validating Hypothesis 2.
First of all, from the perspective of the resource base, government subsidies can influence the innovation of enterprises through direct resource supplementation. Yet, technological progress is associated with positive externalities and high risks, which are particularly prominent for the PV industry, a new energy industry. To overcome market failures and prevent enterprises from having high risks and low returns, the government will share the risks with enterprises. Its own financial strength and adequacy of information, shared with enterprises through various government subsidies, will mean the industry achieves Pareto efficiency improvement. Plus, the government subsidies signal that the industry is worthy of recognition, guiding external investors to provide greater external financing to large PV enterprises, and ultimately, helping large enterprises to improve their technological innovation. Given these mechanisms at work, many scholars accept that government subsidies can promote technological progress.

4.3.3. Negative Moderating Effect of Government Subsidies

As can be observed from Model 3 in Table 4, the interaction coefficient of enterprise R&D investment and government subsidies (GovSub × RDI) is −9.316, the interaction coefficient of government subsidies and R&D investment squared (GovSub × RDI2) is 2.848, and the interaction coefficient of government subsidies and R&D investment cubed (GovSub × RDI3) is −0.200, all of which are significant at the 5% level. This demonstrates that government subsidies have a negative moderating effect on the relationship between enterprise R&D investment and technological advancement, meaning Hypothesis 2 is confirmed.
Although there have been controversies in academic circles about the role of government subsidies in the development of strategic industries, judging from the actual effect of China’s PV industry’s development, government subsidies have effectively promoted the growth of the PV industry. However, our empirical results show that government subsidies have not played an incentivizing and guiding role in industrial-technological innovation. We believe this may be for the following reasons:
First, due to the high initial manufacturing cost of PV products, it is difficult for enterprises to absorb the cost independently, and the creation of a terminal market is facing a series of bottlenecks. The original intention of the government subsidy policies was actually to cultivate this market, promote industry socialization, and reduce the operational risks and production costs faced by enterprises, rather than directly stimulate enterprises’ R&D investment.
Second, since government subsidies are a “free lunch”, they have negative consequences. Many loopholes have been exposed in the implementation of government subsidies. Some PV enterprises take advantage of their information advantages to defraud tax incentives and government subsidies through deliberate concealment and false declarations, which seriously distort the final policy effect and reverse the stimulus effect of government subsidy policies. In particular, the government subsidy policies for China’s PV industry, especially the early “chaotic” subsidy policy, to some extent, induced many PV enterprises to regard government subsidies as a “free lunch”, resulting in a huge waste of financial resources and loss of control of industrial development, which created overcapacity and excessive competition in the industry. As a result, the European and American developed countries initiated anti-dumping and anti-subsidy regulations against China, which disrupted the structural adjustment and technological progress rhythm of the PV industry.
Third, government subsidies lead to immorality in the management of listed PV enterprises. To a certain extent, government subsidies can increase enterprises’ net profits and improve their financial statements, but to a certain extent, this will lead to inertia. Listed PV enterprises will come to rely on government subsidies to support their performance, resulting in management laziness, excessive compensation, and lack of effort. Enterprises will no longer pay attention to improving their core competitiveness and making technological progress.
To better demonstrate the moderating effect and further intuitively explain Hypothesis 3, this paper followed the guidelines set out in [44] and plotted significant interactions after grouping the sample by the government subsidy intensity (GovSub). 
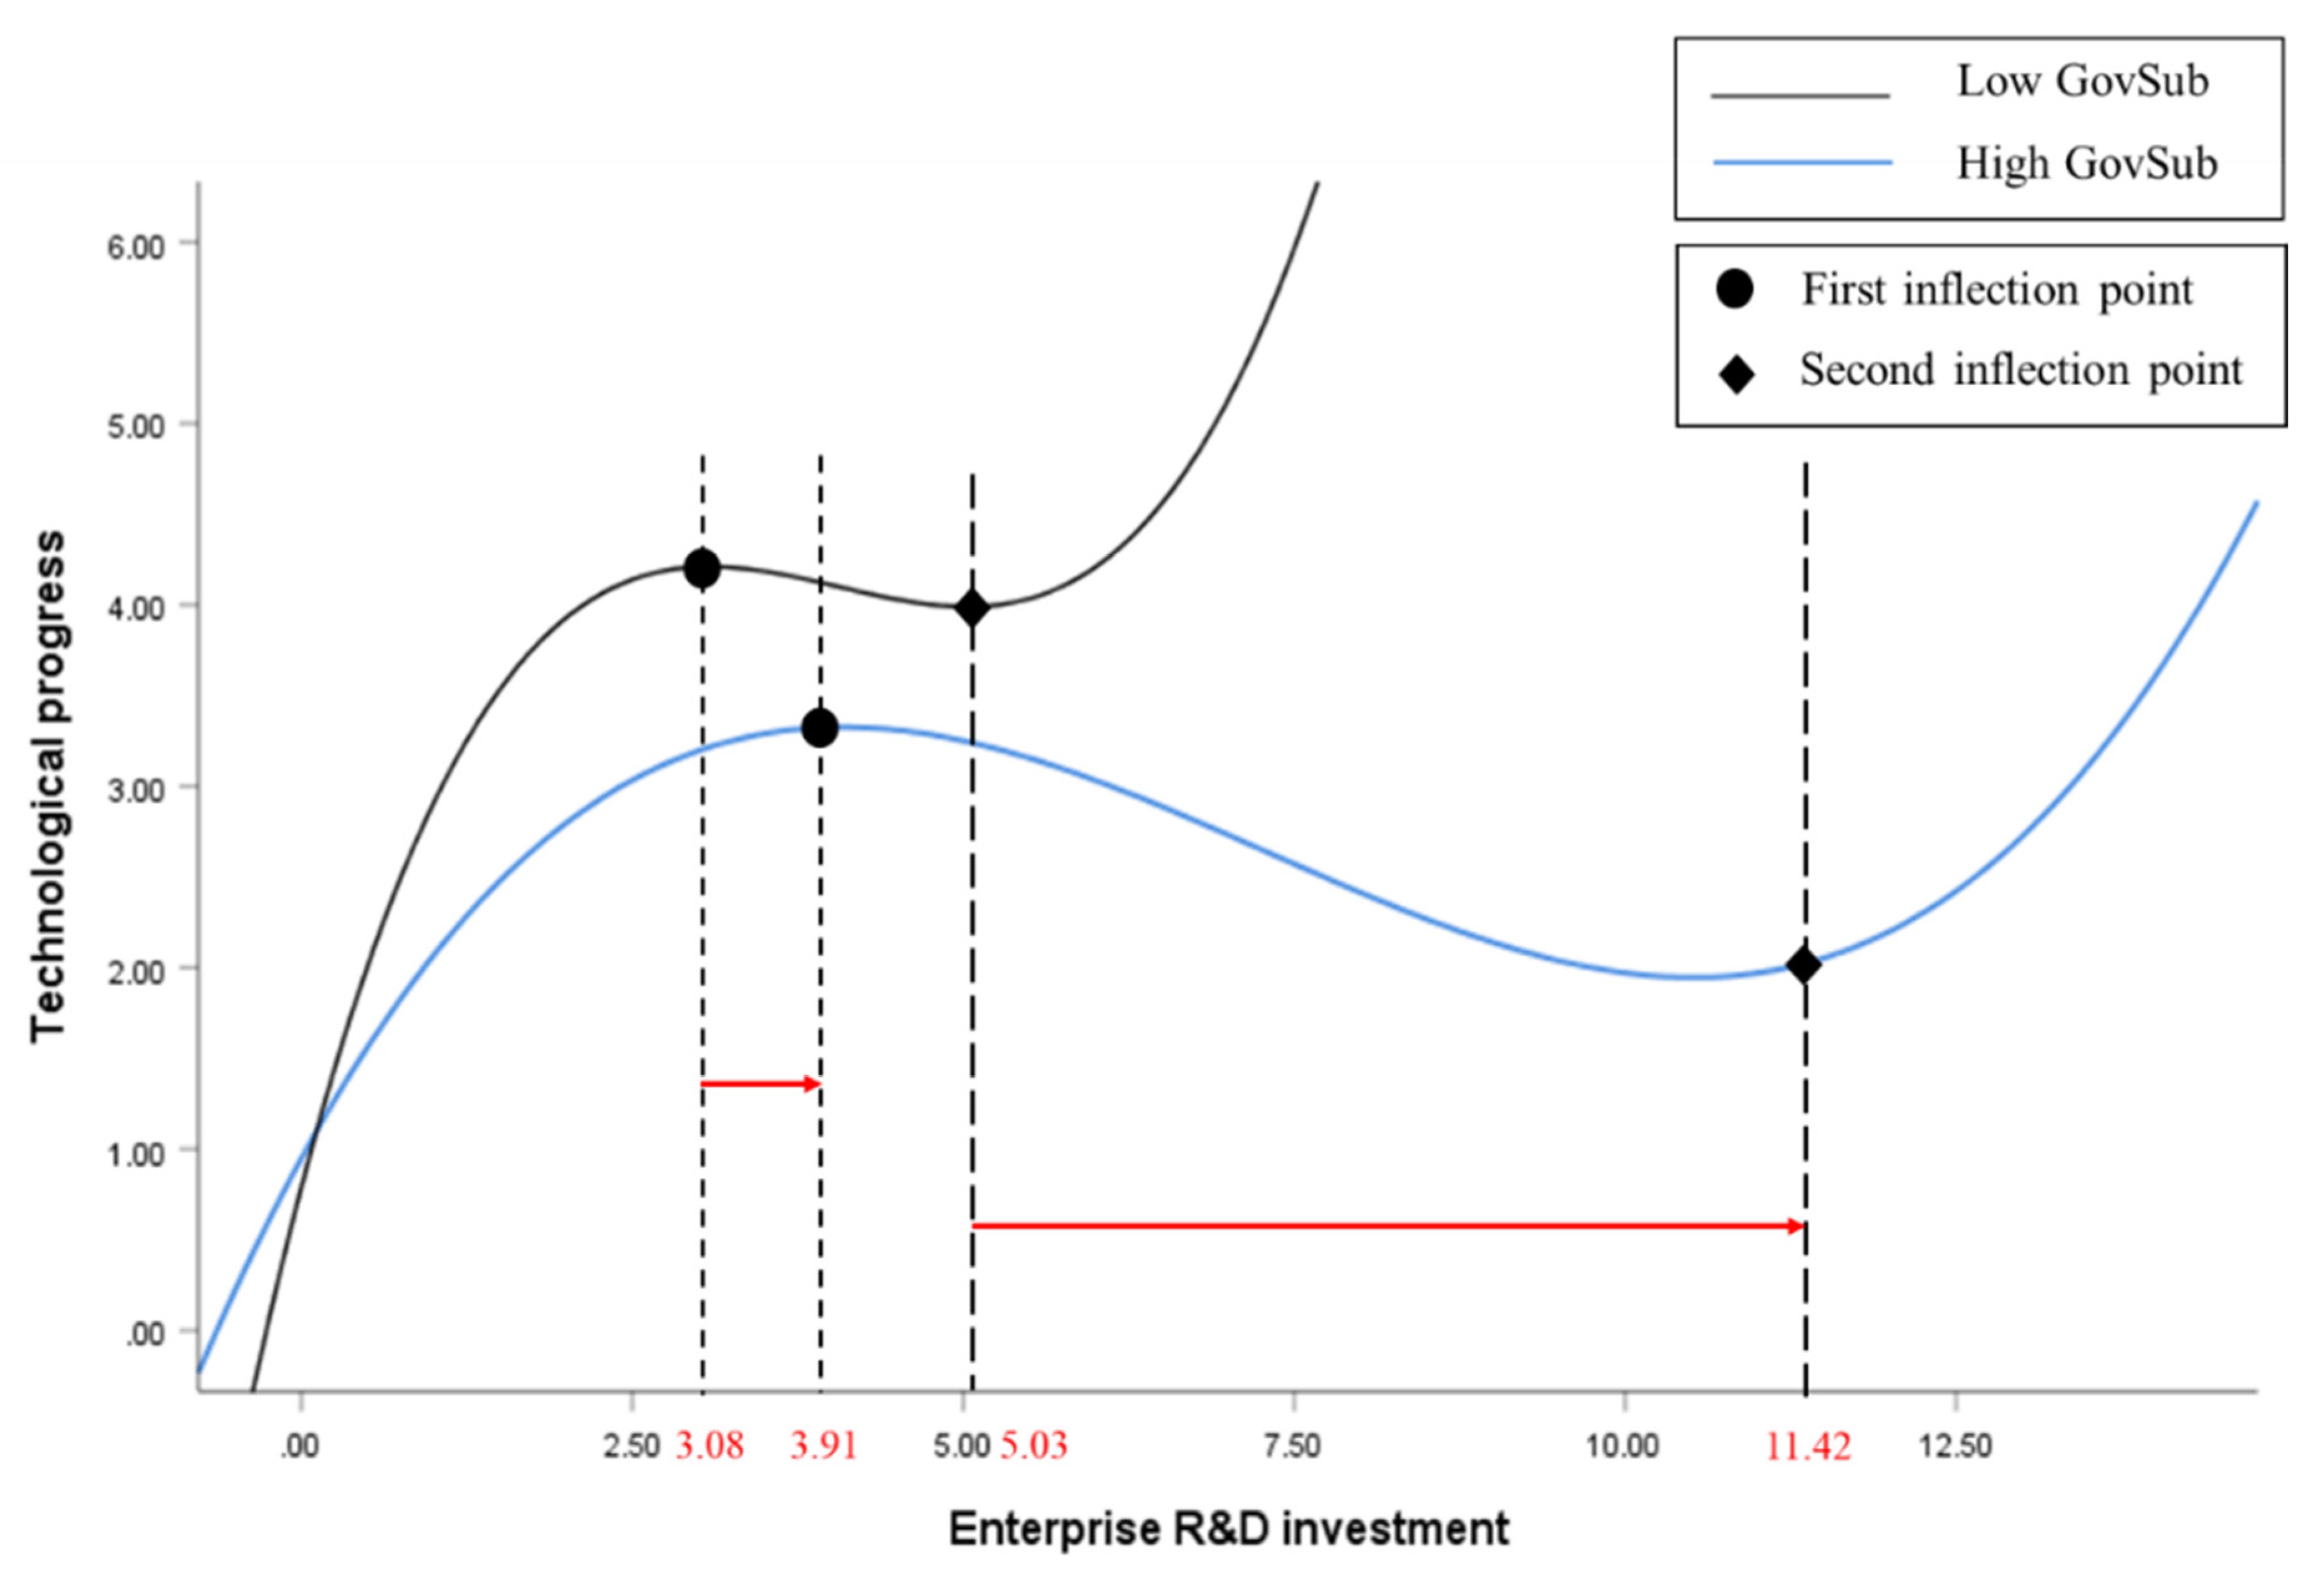
Figure 8 shows three geometric features: (1) The regression line of the low government subsidy group is above that of the high group; (2) As the intensity of government subsidies increases, all inflection points of the N-shaped curve move to the right (the R&D investment values corresponding to the first and second inflection points of low government subsidies (less than one standard deviation) are 3.08 and 5.03); (3) As the intensity of government subsidies increases, the positive and negative slopes of the nexus between R&D investment and technological progress become smaller, and the curve flattens. This shows that the sensitivity of technological progress to R&D investment will be weakened, and the impact of R&D investment on technological progress will become less positive (more negative). This shows how the role of R&D investment in promoting technological progress weakens. Figure 8 illustrates the increasingly obvious inhibitory effect of government subsidy policies. We can see that government subsidies are a “double-edged sword” when we combine their positive direct effects. The figure further shows that government subsidy policies are not as widespread among enterprises as they should be, and it is vital to withdraw government subsidies in a timely manner.
Figure 9 demonstrates the marginal effect of government subsidies, showing their impact on technological progress at different levels of subsidy. It can be seen from Figure 9 that the marginal effect of government subsidies changes from positive to negative, and the overall performance is negative, showing a downward trend. Combined with the above regression results, this further indicates that the negative moderating effect of government subsidies gradually strengthens, and timely withdrawal of government subsidies is crucial.
The control variables can be seen from Model 3 in Table 4. The coefficient of the enterprise R&D personnel (RDP) is positive and significant at the 5% level, indicating that enterprises can promote technological progress by increasing their investment in R&D personnel. R&D personnel are an important subject to promote the technological progress of PV enterprises, and as such, are the core resources that all enterprises focus on introducing and developing. The investment in R&D personnel will directly impact technological progress. The coefficient of the enterprise scale (lnAssets) is positive and significant at the 1% level, and this result is consistent with the fundamental realities of China. In general, the larger the enterprise, the less restricted the funds, meaning the enterprise can invest more funds in R&D for technological progress. Accordingly, larger enterprises have an advantage in terms of technological progress.
The estimated coefficient of the enterprise age (lnAGE) is negative and not significant. This may be particular to the PV industry, where mass government subsidies have caused many enterprises to swarm to this emerging industry like “hungry wolves”. Yet, repeated construction, disorderly implementation, and overcapacity, combined with the 2008 global financial crisis and anti-dumping regulations from European and American countries, have caused many PV enterprises to close down. Therefore, throughout the development history of China’s PV industry, over the past 21 years, PV enterprises have entered and exited frequently.
The debt-to-asset ratio (Debt) estimated coefficients are positive and not significant, while the equity ratio (ER) estimated coefficients are negative and significant. The coefficient of the operating income growth rate (OIGR) is positive, and the coefficient of the return on total assets ratio (ROA) is negative, with neither significant. The coefficient of Tobin’s Q (TQ) is positive but not significant. Since TQ value reflects the market potential of an enterprise, a higher TQ value indicates better enterprise growth. The better the growth, the more it can be recognized by investors, and the easier it then is for the enterprise to obtain further innovative financing to promote technological innovation. The index regression coefficient, meanwhile, is positive and consistent with common sense.

4.4. Robustness Test

(1)
New measurement of technological progress
The authorization of invention patents, which are closely vetted by patent examiners, can well reflect technological innovation capabilities. Yet, many studies have shown that the numbers of invention patent applications and invention patent licenses do little to reflect the innovation of an industry [45]. To this end, referring to Tan and Qian’s method for measuring technological progress [46], this paper instead used the number of invention patents granted and the natural logarithm as a new proxy variable. Accordingly, the results of Model 1 in Table 5 are robust and support Hypotheses 2 and 3 once again.
(2)
Zero-inflation Poisson regression
Considering the large number of “0” values in the sample, which may have emerged due to sample selection deviation, this paper used the zero-inflated Poisson regression (ZIP) method to estimate Model 3. The idea is similar to that of the two-stage model proposed by Heckman [47]. In theory, the decision may be made in two stages. In the first stage, the binary selection model is adopted, taking zero or a positive integer as the input. The second stage entails precisely selecting which positive integer is to be used based on the regression analysis. The results of our zero-inflation Poisson regression indicated that the Poisson regression should be rejected and the zero-inflation Poisson regression selected. The results of Model 2 in Table 5 are robust and support Hypotheses 1–3 once again.
(3)
Tobit regression model
The Tobit model is mainly used in the regression analysis of continuous count data containing a large number of “0” values. The Tobit model holds that for some data points in the actual observation data, the explanatory variable is compressed at a point, meaning the data have a mixed (point and a continuous) distribution. Given the left-tailed distribution of the patent data, the Tobit model was used to estimate the need for a robustness test. The results of Model 3 in Table 5 are robust and support the research hypothesis in the previous paper.
(4)
Propensity score matching (PSM)
PV enterprises receiving government subsidies went through a process of being selected [48], so they may represent a “screening effect”. In studying this, government subsidies were regarded as a dummy variable, indicating whether or not enterprises received such subsidies. Enterprises receiving subsidies were 1, and those without were 0. The propensity score matching (PSM) method was used for robustness testing, and the one-to-one nearest matching method was used for matching. The balance test results in Table 5 show that the deviation of all paired variables did not exceed 10%, and a t-test showed no significant difference between the treatment and control groups at the 10% level, indicating that the sample matching effect was better.
This paper used matched samples to test the role of government subsidies in moderating the nexus between enterprise R&D investment and technological progress. The results of Model 4 in Table 5 show that the coefficients of the variables RDI, RDI2, RDI3, GovSub, GovSub × RDI, GovSub × RDI2, and GovSub × RDI3 were significant at the 1% level, which supports Hypotheses 1–3, while indicating that the results are robust.
To summarize, when we changed the measurement method for the dependent variable—using Tan and Qian’s method for measuring technological progress [46], zero-inflation Poisson regression, Tobit regression, and PSM regression—the four methods applied gave the same results as the benchmark regression, which verified Hypotheses 1–3 proposed in this paper. The N-shaped relationship between R&D investment and technological progress is thus well-proven, meaning continuous R&D investment is a necessary factor at this stage for the success of China’s PV industry. Meanwhile, government subsidies are a “double-edged sword”, having a positive direct effect and negative moderating effect; we propose that it is important to allocate government subsidies reasonably and implement a timely retreat policy.

4.5. Further Analysis

4.5.1. Heterogeneity Analysis to Distinguish Different Stages of PV Industry Development

A significant year in the history of China’s PV industry was 2013. Before then, Chinese enterprises had expanded into foreign markets, especially high-end foreign markets such as the United States, Europe, and Japan. However, with the reduction of subsidies in other major PV countries, the outbreak of the global financial crisis in 2008, and the severe impact of the “dual reverse” policies of the European Union and United States, the market abroad shrunk. At the same time, emerging markets such as the Middle East, China, India, and Southeast Asia began to take off and become more important. At the end of 2012, the State Council of China issued the “Five National Measures” to increase efforts to support the development of the PV industry in terms of industrial structure adjustment, industrial development, application markets, support policies, and market mechanisms. In August 2013, as a detailed supporting policy of the “Five National Measures”, the “Notice on Utilizing a Price Leverage to Promote the Healthy Development of the PV Industry” was officially issued, implementing three types of PV feed-in tariffs and a distributed PV kilowatt-hour subsidy. As such, 2013 became an important watershed in the history of China’s PV industry (Figure 6). Since then, entering the policy-driven period, the subsidy policies have matured, hailing the “golden era” of China’s PV application market. Looking closely at the timeline, how can we differentiate the effects of government subsidy policies and R&D investment on technological progress pre- and post-2013?
The results of a staged regression are shown in Table 6. Model 1 represents the regression results for the first stage (1999–2013), and the regression results for the second stage (2014–2019) are shown in Model 2. The former shows that the regression coefficient of RDI is 1.195, which is significant at the 1% level. The regression coefficient of RDI2 is −0.353, which is significant at the 10% level. The RDI3 is not significant, indicating that R&D investment had an inverted “U”-shaped nexus with technological progress. Model 2 shows that the regression coefficient of RDI is 1.204, which is significant at the 5% level, the regression coefficient of RDI2 is −0.276, which is significant at the 10% level, and the regression coefficient of RDI3 is 0.017, which is significant at the 10% level, indicating that the nexus between R&D investment and technological progress in the second stage becomes N-shaped. The coefficients of GovSub are 3.460 and 14.889 in the first and second stages, respectively, both of which are significant at the 10% level, indicating that the direct incentivizing effect of government subsidies became enhanced in the second stage. In the first stage, GovSub × RDS is −12.277, and in the second stage, GovSub × RDS is −21.296, both of which are significant at the 10% level, indicating that government subsidies have a negative moderating effect on the nexus between enterprise R&D investment and technological progress.
The above regression results show that, first, R&D investment pre-2013 had an inverted “U”-shaped nexus with technological progress, while in 2014–2019 they had an N-shaped nexus. The transformation of this nexus shows that R&D investment can continuously stimulate the technological progress and development of the PV industry, suggesting that China’s PV industry should continue to increase its R&D investment, to improve the effectiveness of its technological progress. This strongly indicates that the reason China’s PV industry has been able to rapidly grow so that the sector is now largely “Made in China”, which has occurred in less than 20 years, is closely bound up with the early development model of China’s PV industry, which focused on increasing R&D investment to achieve technological progress [5]. Moreover, we believe that many scholars may have overlooked the advantage of the low technological and talent entry points of China’s PV industry. The early position of China’s PV industry value chain was in the midstream (mainly modules) and partly in the upstream (mainly silicon wafers). The modules and silicon wafers are actually semiconductors and diodes, making the PV module technology semiconductor technology. The shape, size, purity, flatness, smoothness, and cleanliness of PV silicon wafers are much lower than those of semiconductor silicon wafers. This has meant that the thresholds of talent and technology for China’s PV industry have actually not been too high. As such, enterprises in China have benefitted from building on basic integrated circuit technology and low-skilled staff. In addition, in the early stages of industrial development, China’s PV industry achieved remarkable progress by increasing R&D investment. Later, it continued to achieve remarkable progress by continuously increasing its R&D investment. In summary, we find that the “tail” of the inverted U-shape [49,50,51], extending to the N-shape that appeared in the first to second stage, is the result of the Chinese PV industry’s continuous increase in R&D investment and its long-term efforts.
The regression results also show that, second, with the significant increase in government subsidies (Figure 8), the positive direct effect of those began to strengthen in the second stage [52]. This could be related to how after 2013, the Chinese government upgraded its standards and strengthened its supervision of various subsidies to the PV industry, plugging policy loopholes and better containing certain PV enterprises that had cheated the government of its subsidies. In recent years, the PV industry has developed rapidly, not only driven by market demand but also by the continuous R&D investment of enterprises, closely related to the large-scale subsidies awarded by the government to the PV industry [53]. We observe that the Chinese government may have taken a relatively wise approach. Considering the huge risks and uncertainty around the development direction of the early PV industry, a tentative government subsidy was chosen, and subsidies did not begin to increase rapidly until later (Figure 8). The salient features of China’s PV industry in the second stage are the relative maturity of the industry, clear development potential, and broad market prospects. We believe this is the result of the inclusive nature of the Chinese government’s subsidy policies in the first stage, which aimed to encourage PV enterprises to invest more of their profits in scientific R&D, expand reproduction and other fields, enhance the viability of PV enterprises, and cultivate the scale of the market, thereby “creating a more enabling environment”. In the second stage, the government plugged loopholes in its subsidy policies by raising the technical threshold, enforcing subsidy standards, improving the regulatory system and other measures, removing the black sheep, and purifying the development environment of the PV industry. Looking ahead, establishing a market-oriented support mechanism, with the help of market forces, to encourage and prompt PV enterprises to invest greater resources in product R&D and innovation will be necessary to avoid their excessive dependence on subsidy policies and limit the efforts by certain enterprises to cheat these.

4.5.2. Heterogeneity Analysis to Distinguish Different Types of Government Subsidies

Table 7 reports the different government subsidy methods. Model 1 presents the regression results for financial subsidies, while those for tax returns are shown in Model 2. In Model 1, the regression coefficient of RDI is 1.090, of RDI2 is −0.274, and of RDI3 is 0.021, which are significant at the 1%, 1%, and 5% levels, respectively. This shows that R&D investment has an N-shaped nexus with enterprise technological progress, which is consistent with Hypothesis 1 above. The regression coefficient of the financial subsidy (GovSub) is 8.132, which is not significant. The interaction coefficient between financial subsidies and R&D investment (GovSub × RDI) is 22.901, between financial subsidies and R&D investment squared (GovSub × RDI2) is 8.482, and between financial subsidies and R&D investment cubed (GovSub × RDI3) is −0.810, which are significant at the 5%, 1%, and 5% levels, respectively. This shows that financial subsidies have a negative moderating effect on the nexus between enterprise R&D investment and technological progress, which is consistent with Hypothesis 3.
In Model 2, the regression coefficient of RDI is 0.733, of RDI2 is −0.161, and of RDI3 is 0.021, which are significant at the 5%, 10%, and 10% levels, respectively. This shows that there is an N-shaped nexus between R&D investment and enterprise technological progress, which is consistent with Hypothesis 1. The regression coefficient of the tax return (GovSub) is 4.379, which is significant at the 10% level. Meanwhile, the interaction term of R&D investment and the tax return is insignificant, indicating that there is no moderating effect.
According to these results, we can conclude that financial subsidies have a negative moderating effect on the relationship between R&D investment and technological progress for PV enterprises, while the tax return has a direct positive incentivizing effect on technological progress.
When considering the different government subsidy methods. on the one hand, since financial subsidies are a kind of “ante” subsidy, PV enterprises face certain threshold conditions to apply for the financial subsidies, and the procedures are relatively cumbersome. On the other hand, because of information asymmetry, it is easier for “adverse selection”, “moral hazard”, “misalignment of incentives”, and other serious problems to occur. Some PV enterprises defraud financial subsidies by deliberately concealing false declarations and distorting the effect of financial subsidy policies [54]. For reasons such as these, the financial subsidies had a negative moderating effect and did not produce direct positive incentives. The tax return, meanwhile, is a type of “post” subsidy, as only when PV enterprises successfully innovate and convert their ideas into products can they benefit from a tax return [55], which can significantly reduce the phenomena of fraud and profiteering. As such, the tax return method has greater advantages in eliminating external negative effects and avoiding efficiency losses.

5. Research Conclusions and Policy Recommendations

This paper investigated panel data for listed Chinese enterprises in the PV industry to empirically test the nexus between government subsidies, R&D investment, and technological progress. The results suggest the following:
First of all, there is a significant “N”-shaped non-linear nexus between R&D investment and the technological progress of PV enterprises (Figure 7), and most PV enterprises are in the “promotion interval” on the left of the first inflection point of the N-shaped curve, indicating that Chinese PV enterprises still need to increase their R&D investment to promote technological progress. Second, the regression coefficient of GovSub in Model 3 in Table 4 is 4.764, which is significant at the 1% level. This shows that government subsidies for PV enterprises have a direct positive promoting effect on technological progress by alleviating the innovation financing constraints of PV enterprises and thus introducing an “innovation smoothing effect”. Third, as can be observed from Model 3 in Table 4, the interaction coefficient of GovSub × RDI is −9.316, of GovSub × RDI2 is 2.848, and of GovSub × RDI3 is −0.200, all of which are significant at the 5% level. We can infer from this that government subsidies have a significant negative moderating effect on the nexus between R&D investment and technological progress (Figure 8), and with the increase in government subsidies, this inhibitory effect becomes more obvious (Figure 9). Fourth, Model 1 in Table 6 (1999–2013) shows that the regression coefficient of RDI is 1.195, which is significant at the 1% level. The regression coefficient of RDI2 is −0.353, which is significant at a 10% level. The RDI3 is not significant, indicating that R&D investment has an inverted U-shaped nexus with technological progress. Model 2 in Table 6 (2014–2019) then shows that the regression coefficient of RDI is 1.204, which is significant at the 5% level, the regression coefficient of RDI2 is −0.276, which is significant at the 10% level, and the regression coefficient of RDI3 is 0.017, which is significant at the 10% level, indicating that the nexus between R&D investment and technological progress in the second stage became an N-shaped nexus. From the first (1999–2013) to the second stage (2014–2019), the curve of the nexus between R&D investment and technological progress for the PV industry underwent a transformation from inverted U-shaped to N-shaped. This explains why China’s PV industry has rapidly grown, making the sector largely “Made in China”. Fifth, in Model 1 in Table 7, the interaction coefficient between financial subsidies and R&D investment (GovSub × RDI) is 22.901, between financial subsidies and R&D investment squared (GovSub × RDI2) is 8.482, and between financial subsidies and R&D investment cubed (GovSub × RDI3) is −0.810, which are significant at the 5%, 1%, and 5% levels, respectively. In Model 2 in Table 7, the regression coefficient of the tax return (GovSub) is 4.379, which is significant at the 10% level. Financial subsidies thus have a negative moderating effect on the nexus between R&D investment and technological progress for PV enterprises, but the tax return has a positive promoting effect, showing the superiority of the tax return as a “post” subsidy method.
The research results in this paper have major implications for policymakers and related enterprises: First of all, although R&D investment has an N-shaped nexus with technological progress (Figure 7), the time from start-up to achieving leapfrog development can be as short as a decade or as long as several decades. Regardless of how long it lasts, in the climbing stage (before the N-shaped curve inflection point) (Figure 7), enterprises must make full use of their existing advantages, i.e., building from a low technological and talent entry point and adhering to the development mode of increasing R&D investment to achieve industrial-technological progress. The essentiality of doing so is an important contribution of this paper. Second, this research project did not find a positive moderating effect of government subsidies but instead found a negative moderating effect (Figure 8). The Chinese government introduced small-scale inclusive government subsidies in the early stages to support the development of the PV industry, which had the effect of “creating a more enabling environment”. More recently, thorough intervention and strict supervision have improved the environment of the PV industry, enabling its healthy and sound development. Yet, though this played a positive role in promoting the development of the PV industry, it alleviated the inhibitory effect of government subsidies on R&D investment and technological progress. Third, it is crucial that PV enterprises come up with an integrated plan for their self-management, to avoid the double dilemma of government subsidy dependence and huge financial pressure from the government on PV enterprises. From this perspective, the long-term strategy to develop this strategic industry should be for the government to implement a timely financial subsidy reduction policy, fully opening up Chinese PV enterprises to global market competition.
In closing, we must note that the limitations of this study are twofold. First, this paper only used listed Chinese A-share enterprises as the sample and did not consider other non-listed enterprises. Accordingly, subsequent research should seek to broaden the sample and expand its size. Second, the influencing mechanism of technological progress in the PV industry is complicated, and there are limitations to how we can study it using traditional regression analysis. Future research should consider applying methods based on machine learning to take greater variables into account and thereby reveal the complex mechanism affecting technological progress in the PV industry.

Author Contributions

Data curation, J.L., H.Z. and P.C.; methodology, J.L., H.Z., P.C. and X.H.; software, J.L.; supervision, J.W.; validation, J.W.; visualization, X.C., J.W. and X.H.; writing—original draft, J.L.; writing—review and editing, X.C. All authors have read and agreed to the published version of the manuscript.

Funding

This work was supported by the National Natural Science Foundation of China (71463010 and 72164007), the Major Program of the National Fund of Philosophy and Social Science of China (17ZDA046), and the Innovation Project of GUET Graduate Education (2021YCXS087 and 2020YCXS072).

Institutional Review Board Statement

Not applicable.

Informed Consent Statement

Not applicable.

Data Availability Statement

Not applicable.

Conflicts of Interest

The authors declare no conflict of interest.

References

  1. Zou, H.Y.; Du, H.B.; Ren, J.Z.; Sovacool, B.K.; Zhang, Y.J.; Mao, G.Z. Market dynamics, innovation, and transition in China’s solar photovoltaic (PV) industry: A critical review. Renew. Sustain. Energy Rev. 2017, 69, 197–206. [Google Scholar] [CrossRef] [Green Version]
  2. The White Paper Titled “Energy in China’s New Era”. Available online: http://www.gov.cn/zhengce/2020-12/21/content_5571916.htm (accessed on 21 December 2021).
  3. Statistics Database of Development Research Center of the State Council of People’s Republic of China. Available online: http://data.drcnet.com.cn/search?title=%E5%85%89%E4%BC%8F (accessed on 1 December 2021).
  4. World Intellectual Property Report 2017. Available online: https://www.wipo.int/publications/en/details.jsp?id=4225 (accessed on 12 December 2021).
  5. Huang, P.; Negro, S.O.; Hekkert, M.P.; Bi, K. How China became a leader in solar PV: An innovation system analysis. Renew. Sustain. Energy Rev. 2016, 64, 777–789. [Google Scholar] [CrossRef] [Green Version]
  6. Wolden, C.A.; Kurtin, J.; Baxter, J.B.; Repins, I.; Shaheen, S.E.; Torvik, J.T.; Rockett, A.A.; Fthenakis, V.M.; Aydil, E.S. Photovoltaic manufacturing: Present status, future prospects, and research needs. J. Vac. Sci. Technol. Vac. Surf. Film. 2011, 29, 030801. [Google Scholar] [CrossRef] [Green Version]
  7. Zhao, Z.Y.; Zhang, S.Y.; Hubbard, B.; Yao, X. The emergence of the solar photovoltaic power industry in China. Renew. Sustain. Energy Rev. 2013, 21, 229–236. [Google Scholar] [CrossRef]
  8. Zheng, C.; Kammen, D.M. An innovation-focused roadmap for a sustainable global photovoltaic industry. Energy Policy 2014, 67, 159–169. [Google Scholar] [CrossRef]
  9. De La Tour, A.; Glachant, M.; Me´niere, Y. Innovation and international technology transfer: The case of the Chinese photovoltaic industry. Energy Policy 2011, 39, 761–770. [Google Scholar] [CrossRef] [Green Version]
  10. Edenhofer, O.; Hirth, L.; Knopf, B.; Pahle, M.; Schlömer, S.; Schmid, E.; Schmid, F. On the economics of renewable energy sources. Energy Econ. 2013, 40, S12–S23. [Google Scholar] [CrossRef]
  11. Romer, P.M. Endogenous Technological Change. J. Polit. Econ. 1990, 98, s71–s102. [Google Scholar] [CrossRef] [Green Version]
  12. Xin, K.; Chen, X.; Zhang, R.; Sun, Y.C. R&D intensity, free cash flow, and technological innovation: Evidence from high-tech manufacturing firms in China. Asian J. Techonl. Innov. 2019, 27, 214–238. [Google Scholar] [CrossRef]
  13. Song, L.S.; Su, N. Government R&D Funding, Enterprise R&D Investment and Technological Innovation Efficiency. Econ. Manag. 2017, 31, 45–51. [Google Scholar] [CrossRef]
  14. Kazmerski, L.L. Solar photovoltaics R&D at the tipping point: A 2005 technology overview. J. Electron. Spectrosc. 2006, 150, 105–135. [Google Scholar] [CrossRef]
  15. Watanabe, C.; Wakabayashi, K.; Miyazawa, T. Industrial dynamism and the creation of a “virtuous cycle” between R&D, market growth and price reduction: The case of photovoltaic power generation (PV) development in Japan. Technovation 2000, 20, 299–312. [Google Scholar] [CrossRef]
  16. Jiang, Z.W.; Gai, W.Q. Technological innovation, industrial innovation system and value creation based on China’s photovoltaic industry. J. Cent. South Univ. (Soc. Sci.) 2017, 23, 111–119+140. [Google Scholar]
  17. Un, C.A. R&D investment and entrepreneurial technological capabilities: Existing capabilities as determinants of new capabilities. Int. J. Technol. Manag. 2011, 54, 29–52. [Google Scholar] [CrossRef]
  18. Lacasa, I.D.; Shubbak, M.H. Drifting towards innovation: The co-evolution of patent networks, policy, and institutions in China’s solar photovoltaics industry. Energy Res. Soc. Sci. 2018, 38, 87–101. [Google Scholar] [CrossRef]
  19. Zhao, X.G.; Wang, W. Driving force for China’s photovoltaic industry output growth: Factor-driven or technological innovation-driven? J. Clean. Prod. 2020, 274, 122848. [Google Scholar] [CrossRef]
  20. Knott, A.M. R&D/Returns Causality: Absorptive Capacity or Organizational IQ. Manag. Sci. 2008, 54, 2054–2067. [Google Scholar] [CrossRef] [Green Version]
  21. Yeh, M.L.; Chu, H.P.; Sher, P.J.; Chiu, Y.C. R&D intensity, firm performance and the identification of the threshold: Fresh evidence from the panel threshold regression model. Appl. Econ. 2010, 42, 389–401. [Google Scholar] [CrossRef]
  22. Daniel, S.C. Sunk Costs of R&D, Trade and Productivity: The moulds industry case. Econ. J. 2017, 127, 1626–1664. [Google Scholar] [CrossRef]
  23. Wang, K.; Zhou, X. The Nonlinear Effects of R&D Inputs on the Technology Innovation Performance: An Empirical Analysis Based on Microeconomic Data. Stat. Inf. Forum 2017, 32, 86–93. [Google Scholar]
  24. Liu, X.Y.; Lin, S. Impact of Local Government Behavior on Technological Innovation of Start-up Enterprises—Dual Perspectives of Technological Innovation Resource Allocation and Innovation Outputs. RD Manag. 2013, 25, 12–25. [Google Scholar] [CrossRef]
  25. Johnstone, N.; Managi, S.; Rodríguez, M.C.; Haščič, I.; Fujii, H.; Souchier, M. Environmental policy design, innovation and efficiency gains in electricity generation. Energy Econ. 2017, 63, 106–115. [Google Scholar] [CrossRef]
  26. Chen, Q.S.; Zhong, C.P. Can Government R&D Subsidies Stimulate Enterprises Investment into R&D—Based on Micro Evidence from Listing Corporationsin the Solar Photovoltaic Industry. Credit. Ref. 2015, 33, 64–70. [Google Scholar]
  27. Li, Y.H.; Chen, S. Moderating Effectof Government Subsidy on the Relationship between Institutional Investorsand Enterprise Innovation Output: Empirical Evidence from A-shareListed Companiesin 2007–2019. Sci. Technol. Prog. Policy 2021, 38, 28–36. [Google Scholar]
  28. China Research Data Service Platform. Available online: http://www.cnrds.com (accessed on 7 June 2022).
  29. Wind Database. Available online: https://www.wind.com.cn (accessed on 7 June 2022).
  30. Oriental Wealth. Available online: https://www.eastmoney.com (accessed on 7 June 2022).
  31. CSMAR Data Service Center. Available online: https://www.gtarsc.com (accessed on 7 June 2022).
  32. Cai, X.; Zhu, B.Z.; Zhang, H.J.; Li, L.; Xie, M.Y. Can direct environmental regulation promote green technology innovation in heavily polluting industries? Evidence from Chinese listed companies. Sci. Total Environ. 2020, 746, 140810. [Google Scholar] [CrossRef] [PubMed]
  33. Hasan, I.; Tucci, C.L. The innovation–economic growth nexus: Global evidence. Res. Policy 2010, 39, 1264–1276. [Google Scholar] [CrossRef] [Green Version]
  34. Chen, J.L.; Meng, L.J.; Wang, Q. Nonlinear Link between R&D Investment and Performance of Listed Companies. China Sci. Technol. Forum 2015, 5, 67–73. [Google Scholar] [CrossRef]
  35. Liu, X.; Jiang, S.Q. Bank equity connections, intellectual property protection and enterprise innovation—A bank ownership perspective. China J. Account. Res. 2016, 9, 207–233. [Google Scholar] [CrossRef] [Green Version]
  36. Sun, H.; Wang, H. Government Subsidy, R&D Investment and Enterprise Innovation Performance—An Empirical Study Based on the Gem High Tech Enterprises. Sci. Technol. Manag. Res. 2017, 37, 111–116. [Google Scholar]
  37. Zhao, M.; Sun, T.; Feng, Q. Capital allocation efficiency, technological innovation and vehicle carbon emissions: Evidence from a panel threshold model of Chinese new energy vehicles enterprises. Sci. Total Environ. 2021, 784, 147104. [Google Scholar] [CrossRef]
  38. Wang, F.; Li, J.; Tu, W. Voluntary Agreements, Flexible Regulation and CER: Analysis of Games in Developing Countries and Transition Economies. Procedia Eng. 2017, 174, 377–384. [Google Scholar] [CrossRef]
  39. Lahiri, N. Geographic distribution of R&D activity: How does it affect innovation quality? Acad. Manag. J. 2010, 53, 1194–1209. [Google Scholar] [CrossRef]
  40. Wang, J.R.; Zhang, Y. Environmental regulation, green technological innovative intention and green technological innovative behavior. Stud. Sci. Sci. 2018, 36, 352–360. [Google Scholar] [CrossRef]
  41. Li, C.; Yao, Q.G.; Wu, J.; Wang, D.Y. Financialization and Risk Taking of Non-Financial Corporations Empirical Evidence from Chinese Listed Companies. J. Appl. Financ. Bank. 2019, 9, 79–107. [Google Scholar]
  42. Penrose, E. The theory of the growth of the firm. Long Range Plan. 1995, 29, 596. [Google Scholar] [CrossRef]
  43. Fu, L.P.; Li, X.J. The Signaling Effect of Government Subsidies in the Corporate Innovation Process Evidence from Strategic Emerging Industries’ Listed Companies. Systems Eng. 2014, 32, 50–58. [Google Scholar]
  44. Toothaker, L.E. Multiple regression: Testing and interpreting interactions. J. Oper. Res. Soc. 2017, 45, 119–120. [Google Scholar] [CrossRef]
  45. Klemetsen, M.E.; Bye, B.; Raknerud, A. Can Direct Regulations Spur Innovations in Environmental Technologies? A Study on Firm-Level Patenting. Scand. J. Econ. 2018, 120, 338–371. [Google Scholar] [CrossRef]
  46. Tan, X.F.; Qian, J.Q. Capital Market Pressure and Strategic Patent Behavior: The Perspective of Short Selling Mechanism. China Ind. Econ. 2020, 2020, 156–173. [Google Scholar] [CrossRef]
  47. Heckman, J.J. Sample selection bias as a specification error. Econometrica 1979, 47, 153–161. [Google Scholar] [CrossRef]
  48. Howell, A. Picking ’Winners’ in China: Do Subsidies Matter for Indigenous Innovation and Firm Productivity? China Econ. Rev. 2017, 44, 154–165. [Google Scholar] [CrossRef]
  49. Olof, E.; Astrid, K.; Martin, S.H. The R&D-growth Paradox Arises in Fast-growing Sectors. Res. Policy 2011, 40, 664–672. [Google Scholar]
  50. Wu, A.H. Specific investments and supplier sustainable innovation contribution: A moderated nonlinear link. Technol. Soc. 2022, 68, 101891. [Google Scholar] [CrossRef]
  51. Pan, X.F.; Guo, S.C.; Li, M.N.; Song, J.B. The effect of technology infrastructure investment on technological innovation—A study based on spatial durbin model. Technovation 2021, 107, 102315. [Google Scholar] [CrossRef]
  52. Lin, B.; Luan, R. Do Government Subsidies Promote Efficiency in Technological Innovation of China’s Photovoltaic Enterprises? J. Clean. Prod. 2020, 254, 120108. [Google Scholar] [CrossRef]
  53. Wang, H.W.; Zhu, X.T.; Li, P. Research on the Impact of Government Subsidies on Solar Photovoltaic Industry Innovation. Bus. Manag. J. 2022, 44, 57–72. [Google Scholar]
  54. Chu, D.Y.; Ji, F.; Yang, S. Fiscal subsidies, tax incentives and patent output of strategic emerging industries. Tax. Res. 2017, 99–104. [Google Scholar]
  55. Li, H.Y.; Cui, J.H. The driving effect of coordinated mode of tax incentives and direct subsidies on innovation. Tax. Res. 2014, 85–89. [Google Scholar]
Figure 1. Total installed PV capacities of China and the world. (Adapted from Statistics database of the Development Research Center of the State Council of the People’s Republic of China [3]).
Energies 15 04462 g001
Figure 2. Percentage distribution of PV-related patents by origin and value chain segment. (Reproduced with permission from [World Intellectual Property Report 2017], World Intellectual Property Organization, 2017 [4]).
Energies 15 04462 g002
Figure 3. First filings of PV-related patents by origin. Note: Horizontal axis—year; vertical axis—first filings of PV-related patents (number). (Reproduced with permission from [World Intellectual Property Report 2017], World Intellectual Property Organization, 2017 [4]).
Energies 15 04462 g003
Figure 4. Hypothetical conceptual model. (Source: Created by authors).
Energies 15 04462 g004
Figure 5. Change trend of R&D investment. (Source: Produced by the authors from the sample data using Stata 16.1).
Energies 15 04462 g005
Figure 6. Change trend of government subsidies. (Source: Produced by the authors from the sample data using Stata 16.1).
Energies 15 04462 g006
Figure 7. Influence of R&D investment on the technological progress of PV enterprises. Note: Enterprise R&D investment and technological progress are dimensional parameters. Source: Produced by the authors from the sample data using SPSS 16.1.
Energies 15 04462 g007
Figure 8. The moderating effect of government subsidies. Note: Enterprise R&D investment and technological progress are dimensional parameters. Source: Produced by the authors from the sample data using SPSS 16.1.
Energies 15 04462 g008
Figure 9. The marginal effect of government subsidies. Note: GovSub and the effects of lnPatents on linear pred. are dimensional parameters. Source: Produced by the authors from the sample data using Stata 16.1.
Energies 15 04462 g009
Table 1. Variable description table.
VariableExplanationDefinition
lnPatentsTechnological progress l n P a t e n t s = l n ( N u m b e r   o f   p a t e n t   a u t h o r i z a t i o n s + 1 )
RDIR&D investment R D I = ( E n t e r p r i s e   R & D   e x p e n d i t u r e T o t a l   o p e r a t i n g   i n c o m e ) × 100
GovSubGovernment subsidies G o v S u b = G o v e r n m e n t   s u b s i d i e s : T o t a l   o p e r a t i n g   i n c o m e
RDPR&D personnel R D P = l n ( N u m b e r   o f   R & D   p e r s o n n e l + 1 )
DebtDebt-to-asset ratio D e b t = T o t a l   l i a b i l i t i e s : T o t a l   a s s e t s
lnAssetsEnterprise asset scale l n A s s e t s = l n ( T o t a l   a s s e t s )
OIGROperating income growth rate O I G R = ( O p e r a t i n g   i n c o m e   t h i s   y e a r L a s t   y e a r s   o p e r a t i n g   i n c o m e ) : L a s t   y ear s   operating   income
Tobin’ s Q (TQ) T Q = E n t e r p r i s e   m a r k e t   c a p i t a l i z a t i o n : T o t a l   a s s e t s
Age of enterprise (lnAGE) l n A G E = l n ( Y e a r s   o f   e s t a b l i s h m e n t )
Return on total assets ratio (ROA) R O A = N e t   p r o f i t : T o t a l   a s s e t s
Equity ratio (ER) E R = T o t a l   l i a b i l i t i e s : T o t a l   o w n e r s   e q u i t y
Table 2. Descriptive statistics results.
VariableObs.MeanStandard DeviationMin.Max.
lnPatents6721.4351.6940.0005.645
GovSub6720.0170.0330.0000.263
RDI6720.6911.5350.00012.873
Debt6722.4261.8770.64317.958
lnAssets67221.9631.09719.43525.350
OIGR6720.3893.153−0.77755.759
TQ6721.4571.3280.07713.491
lnAGE6722.5680.6340.0003.611
ROA6720.0170.079−0.7540.298
ER6721.6033.414−31.73839.358
RDP6724.5792.1610.0008.956
Source: Produced by the authors from the sample data using Stata 16.1.
Table 3. Pearson’s correlation coefficient.
lnPatentsGovSubRDSDebtlnAssetsOIGRTQlnAGEROAERRDP
lnPatents1
GovSub0.107 ***1
RDI0.532 ***0.225 ***1
Debt−0.0470.071 *0.086 **1
lnAssets0.530 ***−0.0530.309 ***−0.319 ***1
OIGR0.081 **0.0120.019−0.0530.095 **1
TQ−0.204 ***0.183 ***−0.0250.412 ***−0.521 ***−0.0261
lnAGE0.322 ***−0.0580.322 ***−0.165 ***0.513 ***0.038−0.244 ***1
ROA0.0370.065 *−0.0310.173 ***0.094 **0.0360.129 ***−0.0501
ER−0.012−0.062−0.057−0.201 ***0.106 ***0.048−0.083 **0.058−0.066 *1
RDP0.422 ***−0.0270.240 ***−0.209 ***0.363 ***0.032−0.263 ***0.223 ***−0.054−0.0041
Note: ***, **, and * indicate significance at the levels of 1%, 5%, and 10%, respectively. Source: Produced by the authors from the sample data using Stata 16.1.
Table 4. Regression analysis results for the effects of R&D investment and government subsidies on technological progress.
Model 1Model 2Model 3
RDI0.757 *** 1.193 ***
(0.22) (0.29)
RDI2−0.134 ** −0.299 ***
(0.05) (0.09)
RDI30.007 * 0.021 ***
(0.00) (0.01)
GovSub 4.546 **4.764 *
(2.03)(2.58)
GovSub × RDI −9.316 **
(4.15)
GovSub × RDI2 2.848 **
(1.17)
GovSub × RDI3 −0.200 **
(0.08)
RDP0.062 **0.074 **0.057 **
(0.02)(0.03)(0.03)
Debt0.0210.0330.019
(0.03)(0.04)(0.03)
lnAssets0.618 ***0.690 ***0.602 ***
(0.18)(0.19)(0.16)
OIGR0.0120.0130.012
(0.01)(0.01)(0.01)
TQ0.102 **0.1010.077
(0.05)(0.06)(0.05)
lnAGE−0.163−0.135−0.138
(0.43)(0.53)(0.42)
ROA−0.086−0.574−0.212
(0.55)(0.48)(0.53)
ER−0.017 **−0.020 ***−0.015 **
(0.01)(0.01)(0.01)
_cons−12.781 ***−14.518 ***−12.594 ***
(3.93)(4.35)(3.57)
Yearcontrolcontrolcontrol
Firmcontrolcontrolcontrol
R20.5240.4830.541
Adj. R20.5010.4590.515
N672672672
Note: ***, **, and * indicate significance at the levels of 1%, 5%, and 10%, respectively. _cons is constant, R2 is the coefficient of determination, Adj. R2 is the adjusted R2, and N is the number of samples. Source: Produced by the authors from the sample data using Stata 16.1.
Table 5. Robustness estimation results.
Model 1Model 2Model 3Model 4
RDI1.025 ***0.770 ***0.982 ***2.004 ***
(0.24)(0.13)(0.29)(0.32)
RDI2−0.237 ***−0.175 ***−0.275 ***−0.444 ***
(0.07)(0.04)(0.09)(0.10)
RDI30.016 ***0.011 ***0.020 ***0.027 ***
(0.01)(0.00)(0.01)(0.01)
GovSub4.227 *4.659 ***9.644 ***5.936 **
(2.22)(1.79)(2.68)(2.63)
GovSub × RDI−8.503 ***−8.037 ***−12.206 **−15.918 ***
(3.09)(2.99)(5.47)(4.66)
GovSub × RDI22.561 ***1.959 **3.588 **4.277 ***
(0.85)(0.80)(1.52)(1.30)
GovSub × RDI3−0.175 ***−0.118 **−0.246 ***−0.271 ***
(0.05)(0.05)(0.09)(0.08)
RDP0.025−0.479 ***0.136 ***0.144 ***
(0.02)(0.08)(0.04)(0.04)
Debt−0.026−0.505 ***0.115 **0.028
(0.03)(0.12)(0.05)(0.04)
lnAssets0.502 ***−1.093 ***0.765 ***0.564 ***
(0.13)(0.22)(0.13)(0.12)
OIGR0.009−0.0170.0180.018
(0.01)(0.05)(0.02)(0.01)
TQ0.072*−0.1040.0090.085
(0.04)(0.16)(0.10)(0.07)
lnAGE0.0780.420−0.585−0.106
(0.33)(0.39)(0.39)(0.23)
ROA−0.1021.655−0.832−0.000
(0.44)(1.92)(0.88)(0.63)
ER−0.0050.006−0.026−0.011
(0.01)(0.03)(0.02)(0.01)
_cons−10.787 ***25.690 ***−18.133 ***−11.968 ***
(2.84)(4.44)(2.98)(2.53)
Yearcontrolcontrolcontrolcontrol
Firmcontrolcontrolcontrolcontrol
N672672672672
Note: ***, **, and * indicate significance at the levels of 1%, 5%, and 10%, respectively. Source: Produced by the authors from the sample data using Stata 16.1.
Table 6. Staged regression results.
Model 1Model 2Model 3
1999~20132014~2019Full Sample
RDI1.195 ***1.204 **1.193 ***
(0.39)(0.51)(0.29)
RDI2−0.353 *−0.276 *−0.299 ***
(0.19)(0.14)(0.09)
RDI30.0220.017 *0.021 ***
(0.02)(0.01)(0.01)
GovSub3.460 *14.889*4.764 *
(2.00)(7.46)(2.58)
GovSub × RDI−12.277 *−21.296 *−9.316 **
(6.04)(11.51)(4.15)
GovSub × RDI24.2375.1352.848 **
(3.31)(3.21)(1.17)
GovSub × RDI3−0.268−0.298−0.200 **
(0.46)(0.19)(0.08)
RDP0.077 **0.0450.057 **
(0.03)(0.06)(0.03)
Debt0.0640.0180.019
(0.05)(0.08)(0.03)
lnAssets0.628 ***0.913 ***0.602 ***
(0.18)(0.19)(0.16)
OIGR−0.0090.010 *0.012
(0.01)(0.00)(0.01)
TQ0.0680.0740.077
(0.05)(0.19)(0.05)
lnAGE0.097−9.163−0.138
(0.42)(7.00)(0.42)
ROA0.0300.188−0.212
(0.50)(1.30)(0.53)
ER−0.012−0.023−0.015 **
(0.01)(0.02)(0.01)
_cons−13.550 ***7.901−12.594 ***
(3.93)(20.27)(3.57)
Yearcontrolcontrolcontrol
Firmcontrolcontrolcontrol
R20.4480.4190.541
Adj. R20.4130.3510.515
N480192672
Note: ***, **, and * indicate significance at the levels of 1%, 5%, and 10%, respectively. Source: Produced by the authors from the sample data using Stata 16.1.
Table 7. Heterogeneity analysis of different government subsidy methods.
Model 1Model 2Model 3
Financial SubsidyTax ReturnFull Sample
RDI1.090 ***0.733 **1.193 ***
(0.29)(0.30)(0.29)
RDI2−0.274 ***−0.161 *−0.299 ***
(0.09)(0.09)(0.09)
RDI30.021 **0.012 *0.021 ***
(0.01)(0.01)(0.01)
GovSub8.1324.379 *4.764 *
(7.00)(2.33)(2.58)
GovSub × RDI−22.901 **23.347−9.316 **
(8.51)(15.14)(4.15)
GovSub × RDI28.482 ***−6.1592.848 **
(3.09)(4.50)(1.17)
GovSub × RDI3−0.810 **0.302−0.200 **
(0.32)(0.26)(0.08)
RDP0.060 **0.060 **0.057 **
(0.02)(0.03)(0.03)
Debt0.0240.0140.019
(0.03)(0.03)(0.03)
lnAssets0.611 ***0.607 ***0.602 ***
(0.17)(0.17)(0.16)
OIGR0.0120.0060.012
(0.01)(0.01)(0.01)
TQ0.092 **0.097 *0.077
(0.04)(0.05)(0.05)
lnAGE−0.159−0.160−0.138
(0.43)(0.41)(0.42)
ROA−0.124−0.163−0.212
(0.59)(0.49)(0.53)
ER−0.020 ***−0.015 **−0.015 **
(0.01)(0.01)(0.01)
_cons−12.615 ***−12.693 ***−12.594 ***
(3.71)(3.75)(3.57)
Yearcontrolcontrolcontrol
Firmcontrolcontrolcontrol
R20.5340.5430.541
Adj. R20.5090.5180.515
N672672672
Note: ***, **, and * indicate significance at the levels of 1%, 5%, and 10%, respectively. Source: Produced by the authors from the sample data using Stata 16.1.
Publisher’s Note: MDPI stays neutral with regard to jurisdictional claims in published maps and institutional affiliations.

