Article

Application of CFD Method to Investigate the Evolution of the Thermodynamic Parameters of a Hyper Compressor and Its Pipelines

1
School of Energy and Power Engineering, Xi’an Jiaotong University, Xi’an 710049, China
2
State Key Laboratory of Multiphase Flow in Power Engineering, Xi’an Jiaotong University, Xi’an 710049, China
*
Author to whom correspondence should be addressed.
Energies 2022, 15(12), 4452; https://doi.org/10.3390/en15124452
Submission received: 6 May 2022 / Revised: 11 June 2022 / Accepted: 15 June 2022 / Published: 18 June 2022
(This article belongs to the Special Issue Advanced Research on High-Energy Performance Compressors)

Abstract

:
Hyper compressors are key facilities for producing the low-density polyethylene with discharge pressure up to 350 MPa. Such high pressure brings great challenges to the design of the hyper compressor in many aspects. In this paper, a 3D transient computational fluid dynamics (CFD) model with inlet and outlet pipelines is built to investigate the thermodynamic performance of a hyper compressor. To realize the interaction between the thermodynamic processes and the pressure pulsation through valve dynamics, the pressures across the valve surfaces were monitored to the dynamic equation of the poppet valve. Then, structured grids were generated for the flow domain inside the valve, and the entire numerical model was solved by a commercial code: ANSYS Fluent. Consequently, the p-V diagram, the valve motion and pressure pulsation could be acquired simultaneously. The results of the numerical model showed that the exponents of the expansion and compression processes were 5.12 and 13.22, which were much larger than the common compressor. The maximal pressure pulsations were 13.25% and 22.07%, which occurred in the suction and discharge chambers, respectively. Severe flutter happened during the opening process of the suction valve due to the high incompressibility of the ethylene.

1. Introduction

The hyper compressor is one of the key facilities for synthesizing polyethylene from ethylene. When the ethylene gas pressure exceeds 1000 atmospheres, the physical properties are greatly changed, especially the increase in incompressibility and sound speed, resulting in large pressure pulsation and the fatigue failure of parts [1,2]. The discharge pressure of hyper compressors can be as high as 350 MPa, which brings great challenges in designing the structure of components, controlling the pressure pulsation, and reducing the dynamic leakage through the packing cups [3,4,5].
Valves are key components to realize the compression process and are responsible for the thermodynamic performance and reliability of the compressor [6,7,8]. Due to the ultra-high pressure in the hyper compressor, many researchers have paid attention to improving the reliability of the valves. An advanced mathematical model to simulate the working process and valve motion of the reciprocating compressor was built by [9], and the model was used to evaluate the effects of multiple factors on designing the valves in the working pressure range of up to 350 MPa. The finite element method was also employed to calculate the stress of the valve. A 3D steady CFD model was used to evaluate the pressure losses, drag forces, and flow coefficients of the poppet valves for the hyper compressor at various operating conditions [10]. The 2D axisymmetric model and 3D model of the poppet valve for the LDPE compressor were compared, and it was found that the discrepancies in flow coefficients were between 7% and 20% [11]. Based on [11], ref. [12] carried out further experiments on the drag coefficients of different valves, and the drag coefficients were employed to calculate the impacting velocity of the poppet. Later, an investigation on the spring surge phenomena was presented and it was found that the vortex shedding could excite the fluttering of the poppet [13]. Experimental analysis was conducted and efforts were made to improve the design accuracy in terms of minimizing costs [14]. To reduce the wax fouling, [15] carried out experimental research on changing the multi-poppet valve (MPV) to a single-poppet valve (SPV).
Under ultra-high operating conditions, the use of acoustic filters such as volume bottles is not possible. Meanwhile, the allowable pressure pulsation levels under these conditions are beyond the scope of AIP 618 [16]. Under the combined effects of long pipelines, the sound speed of ethylene, and variable working conditions, the compressor could be prone to fall into resonance with natural acoustic frequencies. As suggested by [1], acoustical simulation-aided design should be carried out from the early stage of a project. A theoretical model for analyzing the pressure pulsations of the LDPE compressor was built by [4]. Furthermore, a preliminary pulsation analysis for high-pressure piping size evaluation for hyper compressors was performed [17]. The acquired pressure pulsations in the two-stage hyper compressor, all no larger than 7%, occurred in the first-stage cylinders. The FEM method was employed to calculate both the gas column and pipeline natural frequencies of the discharge pipe for the LDPE compressor [18]. A case analysis of the piping rupture resulting from high piping vibrations based on the results of a dynamic forced-response FEM model was presented [19]. New and more effective supports with high damping fabric pads were added after a detailed root cause analysis. An innovative technique was proposed to measure pressure pulsations [20]. The strain-based method was also adopted to monitor the pressure pulsation of an LDPE pipeline, and the acquired pressure pulsations were used to determine the thermodynamic properties of the ethylene [21]. The author concluded that pressure pulsation can be obtained only if the thermodynamic properties of the ethylene are accurately evaluated.
Valve motion and pressure pulsation are now the two major factors affecting the safety and reliability of the LDPE compressor. Furthermore, the actual performance of the valve and characteristics of pressure pulsation can be variable due to the wide range of working conditions. Therefore, an accurate model for predicting the comprehensive performance of the hyper compressor is urgently expected to avoid potential hazards during the design stage. In this paper, a 3D CFD model of a hyper compressor is built, while taking into consideration the valve dynamics and pressure pulsation in the pipeline system. A single-degree-of-freedom equation is employed to resolve the motion of the poppet valve, while the pressure across the valve surface is monitored to obtain the acting forces. The acceleration, velocity, and displacement (lift) of the valve plates are calculated and adopted to control the dynamic motion of the valves by using user-defined functions (UDFs). Using a newly proposed mesh mapping technique, high-quality structured grids are generated, rendering the valve geometry with high fidelity. As a result, the working process, valve motion, and pressure pulsation of the hyper compressor and its pipelines are acquired simultaneously.

2. Numerical Model

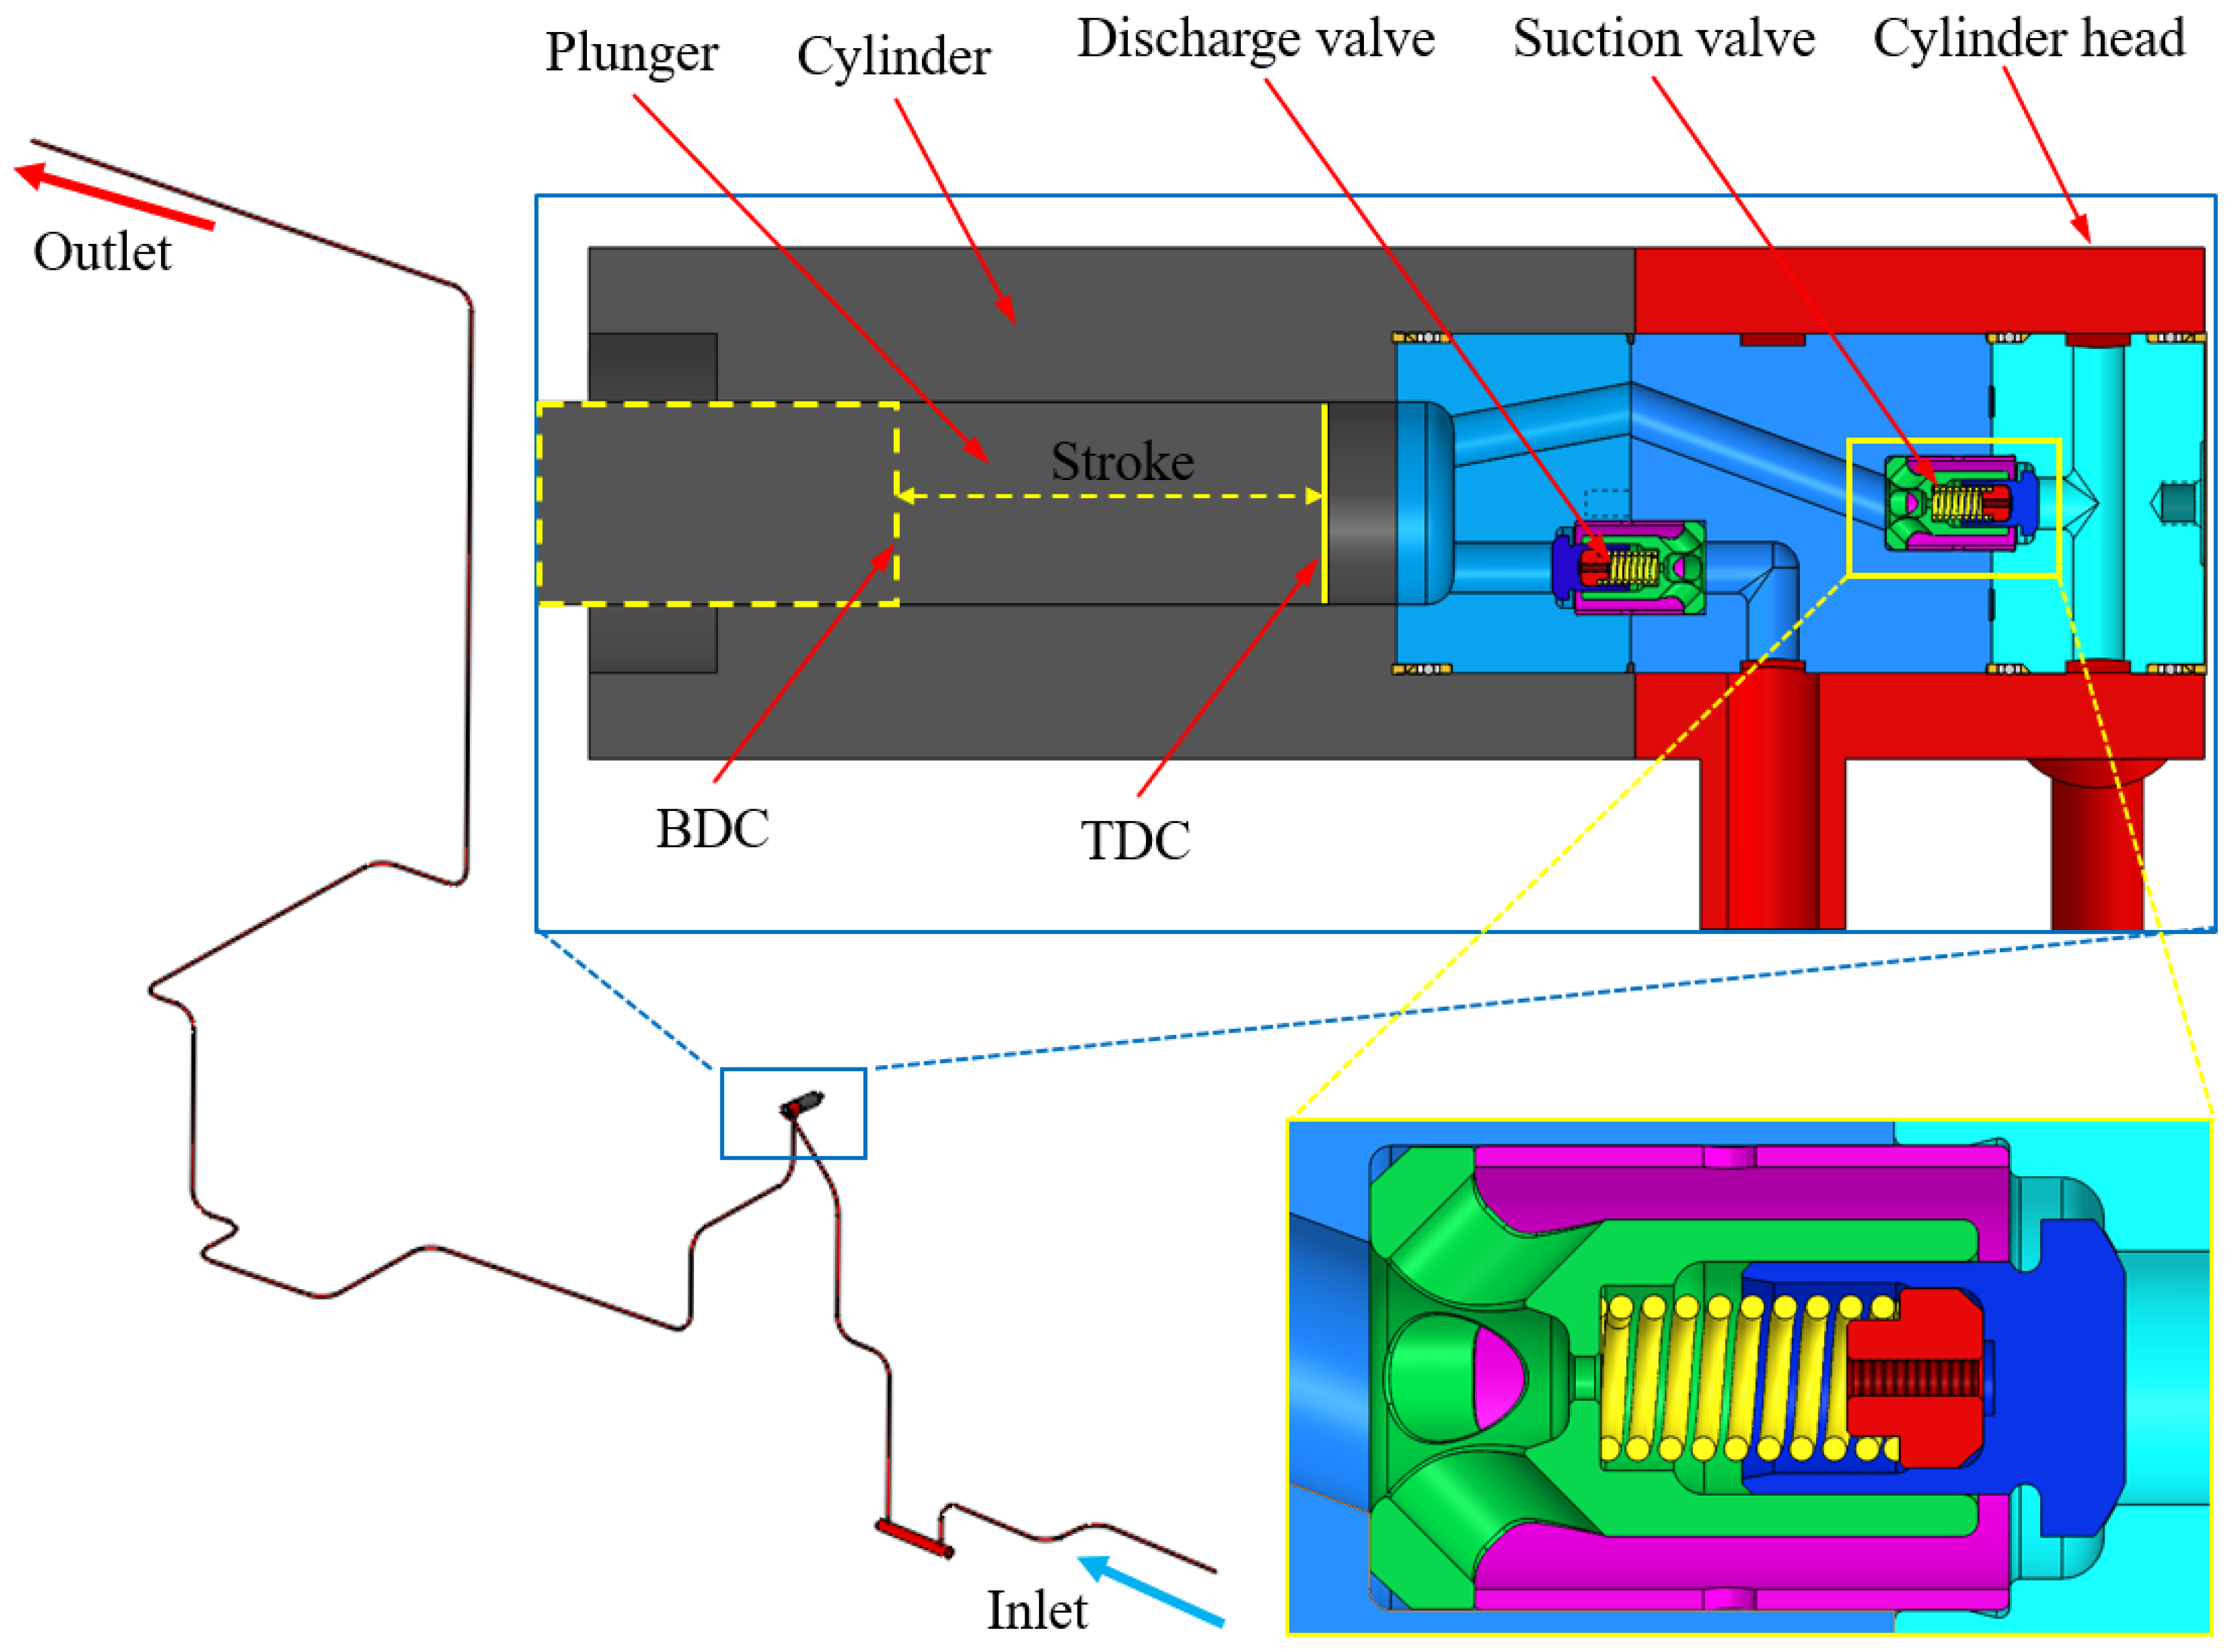
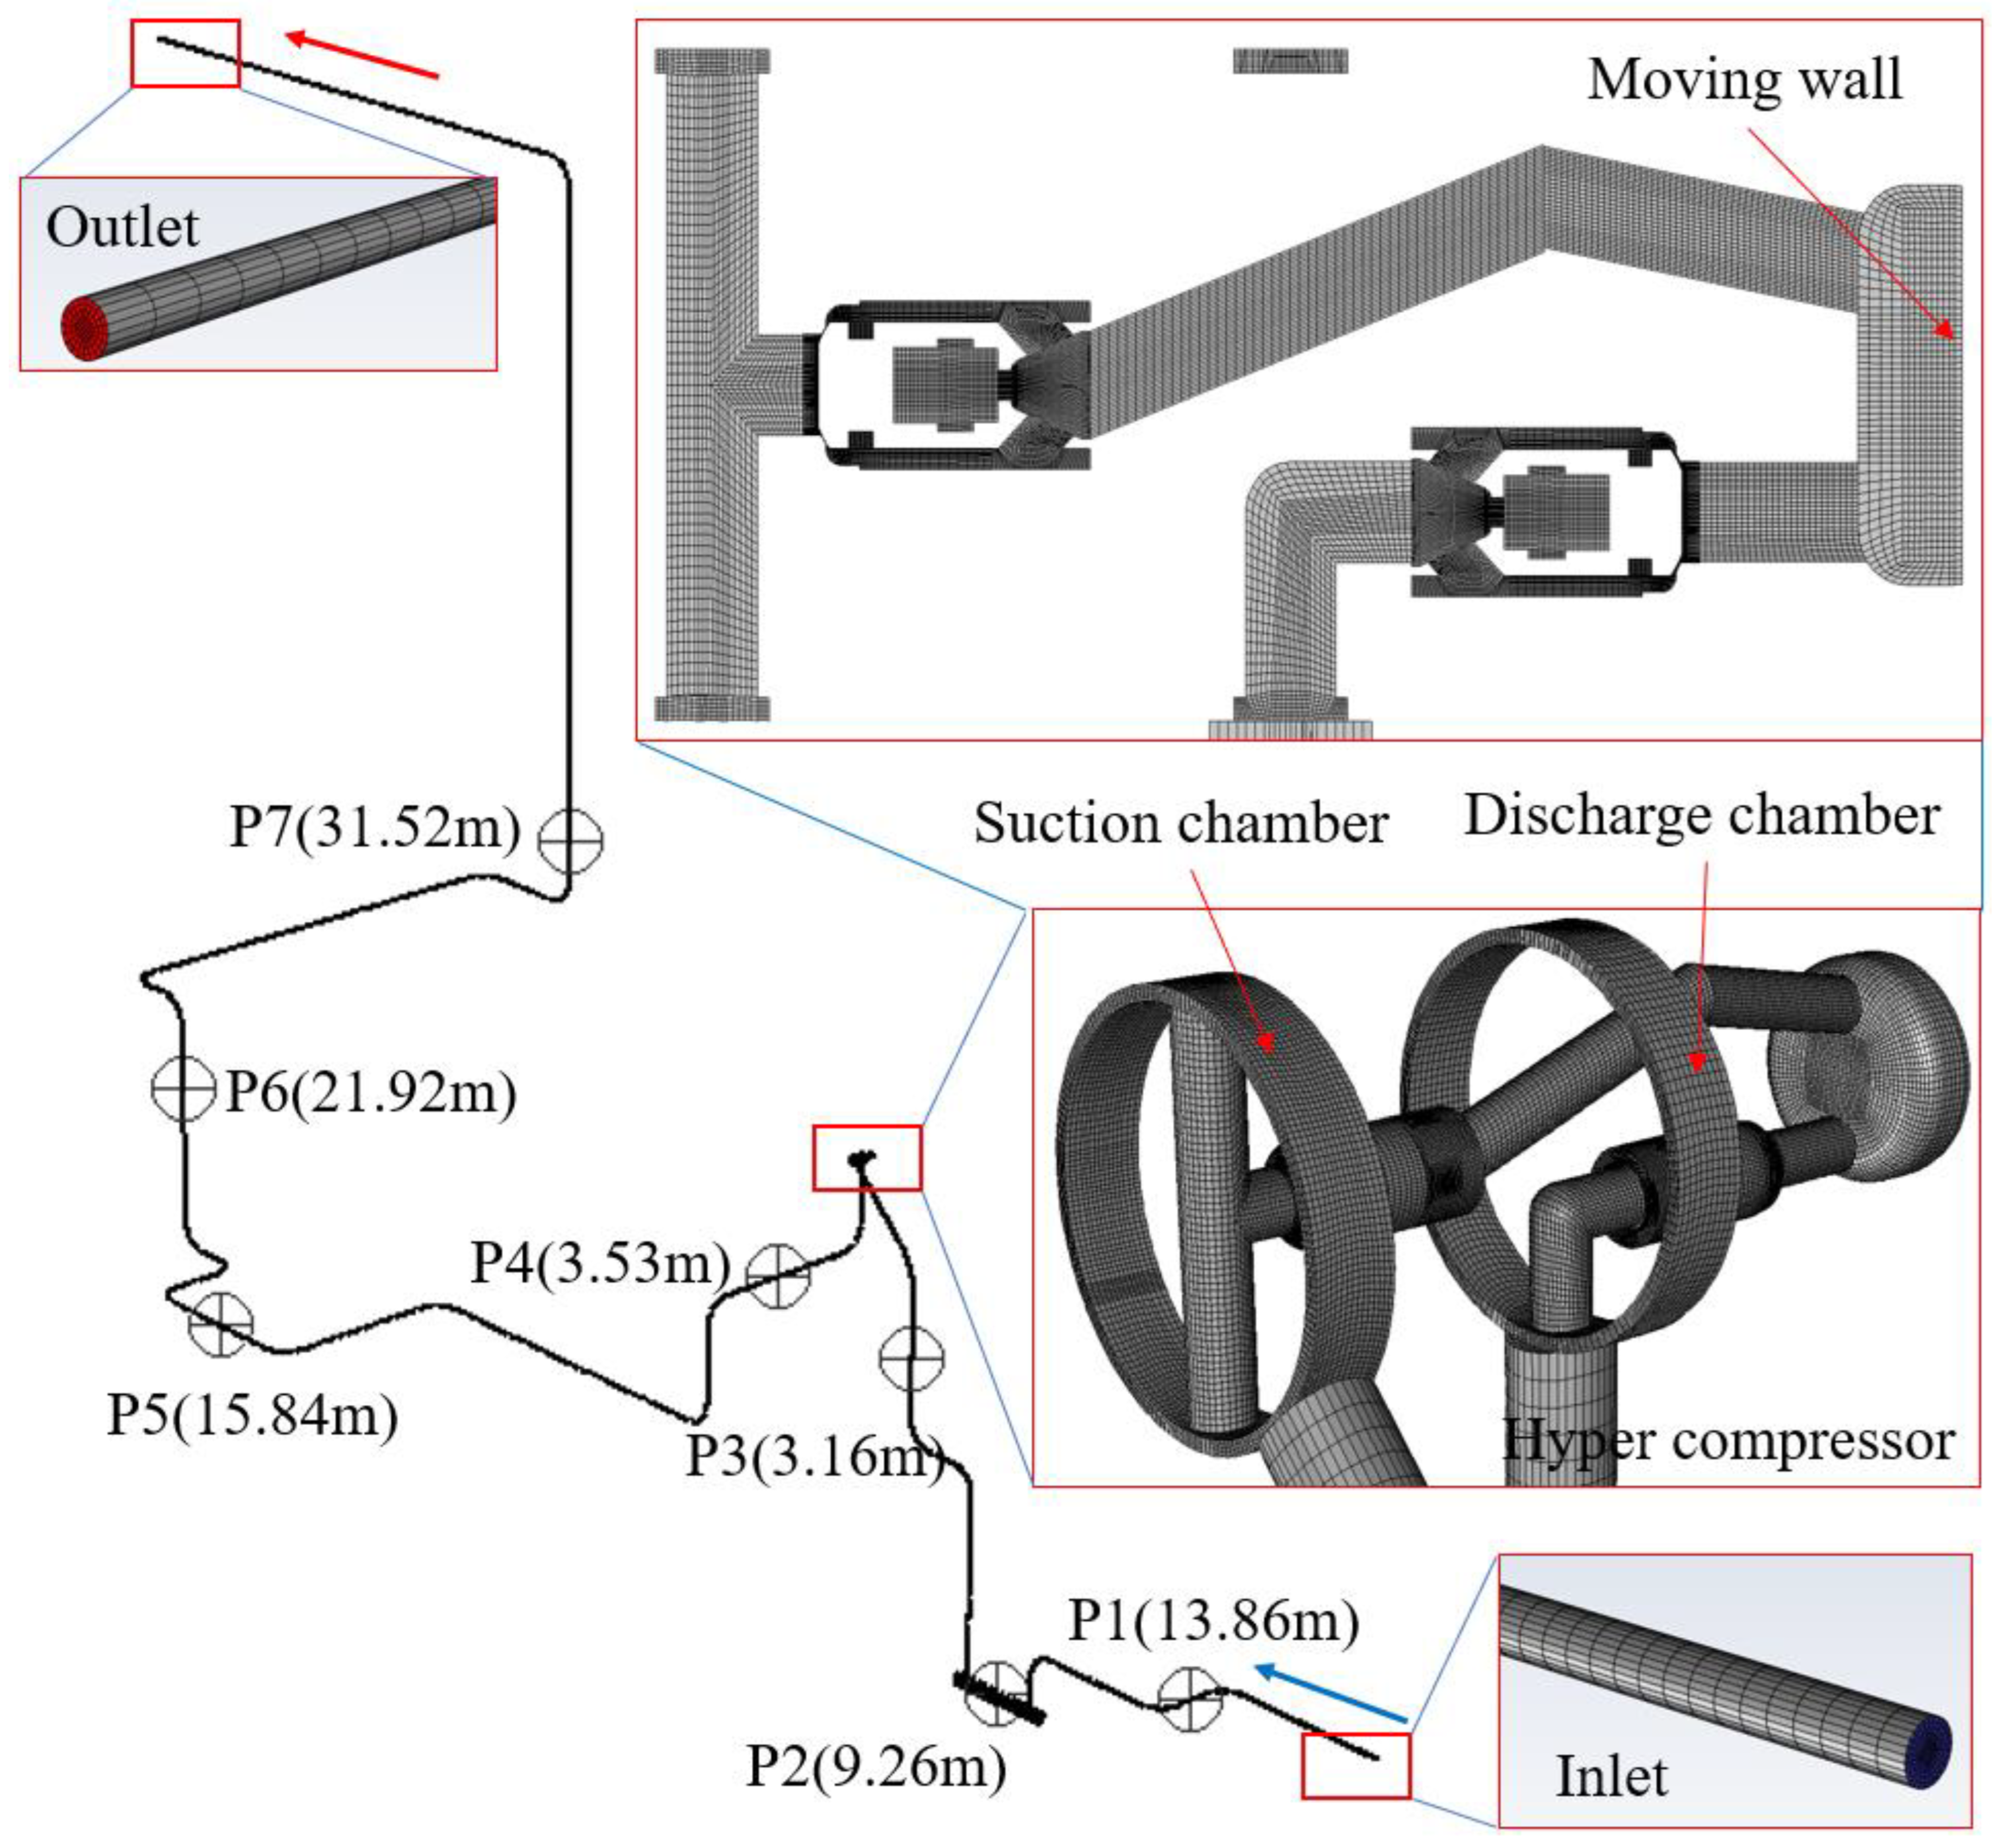
2.1. Meshes for the Hyper Compressor and the Pipelines

A typical cylinder of a hyper compressor, together with its pipelines, was chosen to perform the transient flow analysis in this work. This cylinder was equipped with a combined valve including a suction poppet valve and a discharge poppet valve, as shown in Figure 1. The inlet pipeline had a buffer tank with a volume of 54 L. Both the diameters of the inlet and outlet pipeline were 43 mm with a length of 15.76 m and 54.89 m, respectively.
The working processes of the compressor include expansion, suction, compression and discharge. During the working processes of the compressor, the plunger is driven by a crank-connecting rod mechanism and the pressure of ethylene in the working chamber tends to decrease as the plunger moves to the left side from the top dead center (expansion). When the pressure difference between the inlet and working chamber is large enough to overcome the pre-force acting on the poppet, the inlet valve opens, and the ethylene flows into the working chamber (suction). When the plunger moves back to the right side from the bottom dead center, the suction valve closes and the pressure inside the working chamber tends to increase (compression). When the pressure inside the working chamber is large enough to overcome the pre-force acting on the discharge valve, the discharge valve opens, and the ethylene inside the working chamber is discharged to the outlet pipe (discharge). The fluid–structure interaction happens during the suction and discharge processes in a cycle of the compressor. The key dimensions of the cylinder are listed in Table 1.
The key dimensions of the cylinder are listed in Table 1.
In the hyper compressor, the plunger is usually connected to the crosshead and driven by a crank mechanism and moves in a reciprocating way. During the rotation of the crank, the plunger moves between the top dead center (plunger on the right) and the bottom dead center (plunger on the left), as shown in Figure 1. Normally, the reciprocating speed of the plunger ( v ) can be expressed as the function of stroke ( S ), rotational speed ( n ), and the ratio of the crank-connecting rod mechanism ( λ ), as follows:
v = S n π 60 sin θ + λ 2 sin 2 θ 1 λ 2 sin 2 θ
The flow domain in this work was first divided into three parts, i.e., inlet pipeline, outlet pipeline, and flow region inside the cylinder. To realize the coupling between the pressure pulsation and thermodynamic process in the working chamber, the flow region in the working chamber was further divided into more sub-parts, including the suction chamber, valve channels, the working chamber, and the discharge chamber, as shown in Figure 2. During the working process, the poppet valves could be driven to close or open by the pressure difference; therefore, a clearance of 0.1 mm was reserved between the poppet and valve seat as seed mesh to generate dynamic meshes during the opening process. Additionally, considering the reserved mesh of the clearance could lead to unexpected leakage, the meshes for the clearance were controlled by a sliding mesh technique. When the poppet opened, the sliding mesh interfaces were constructed, and the flow domains in the suction/discharge chamber and the working chamber were connected. All the meshes for the flow domains in this work were generated with a high-quality structural mesh. Finally, the entire computational domain including the discharge pipeline was built, as shown in Figure 2. Seven points were arranged on the inlet and outlet pipelines to monitor pressure pulsation and propagation.

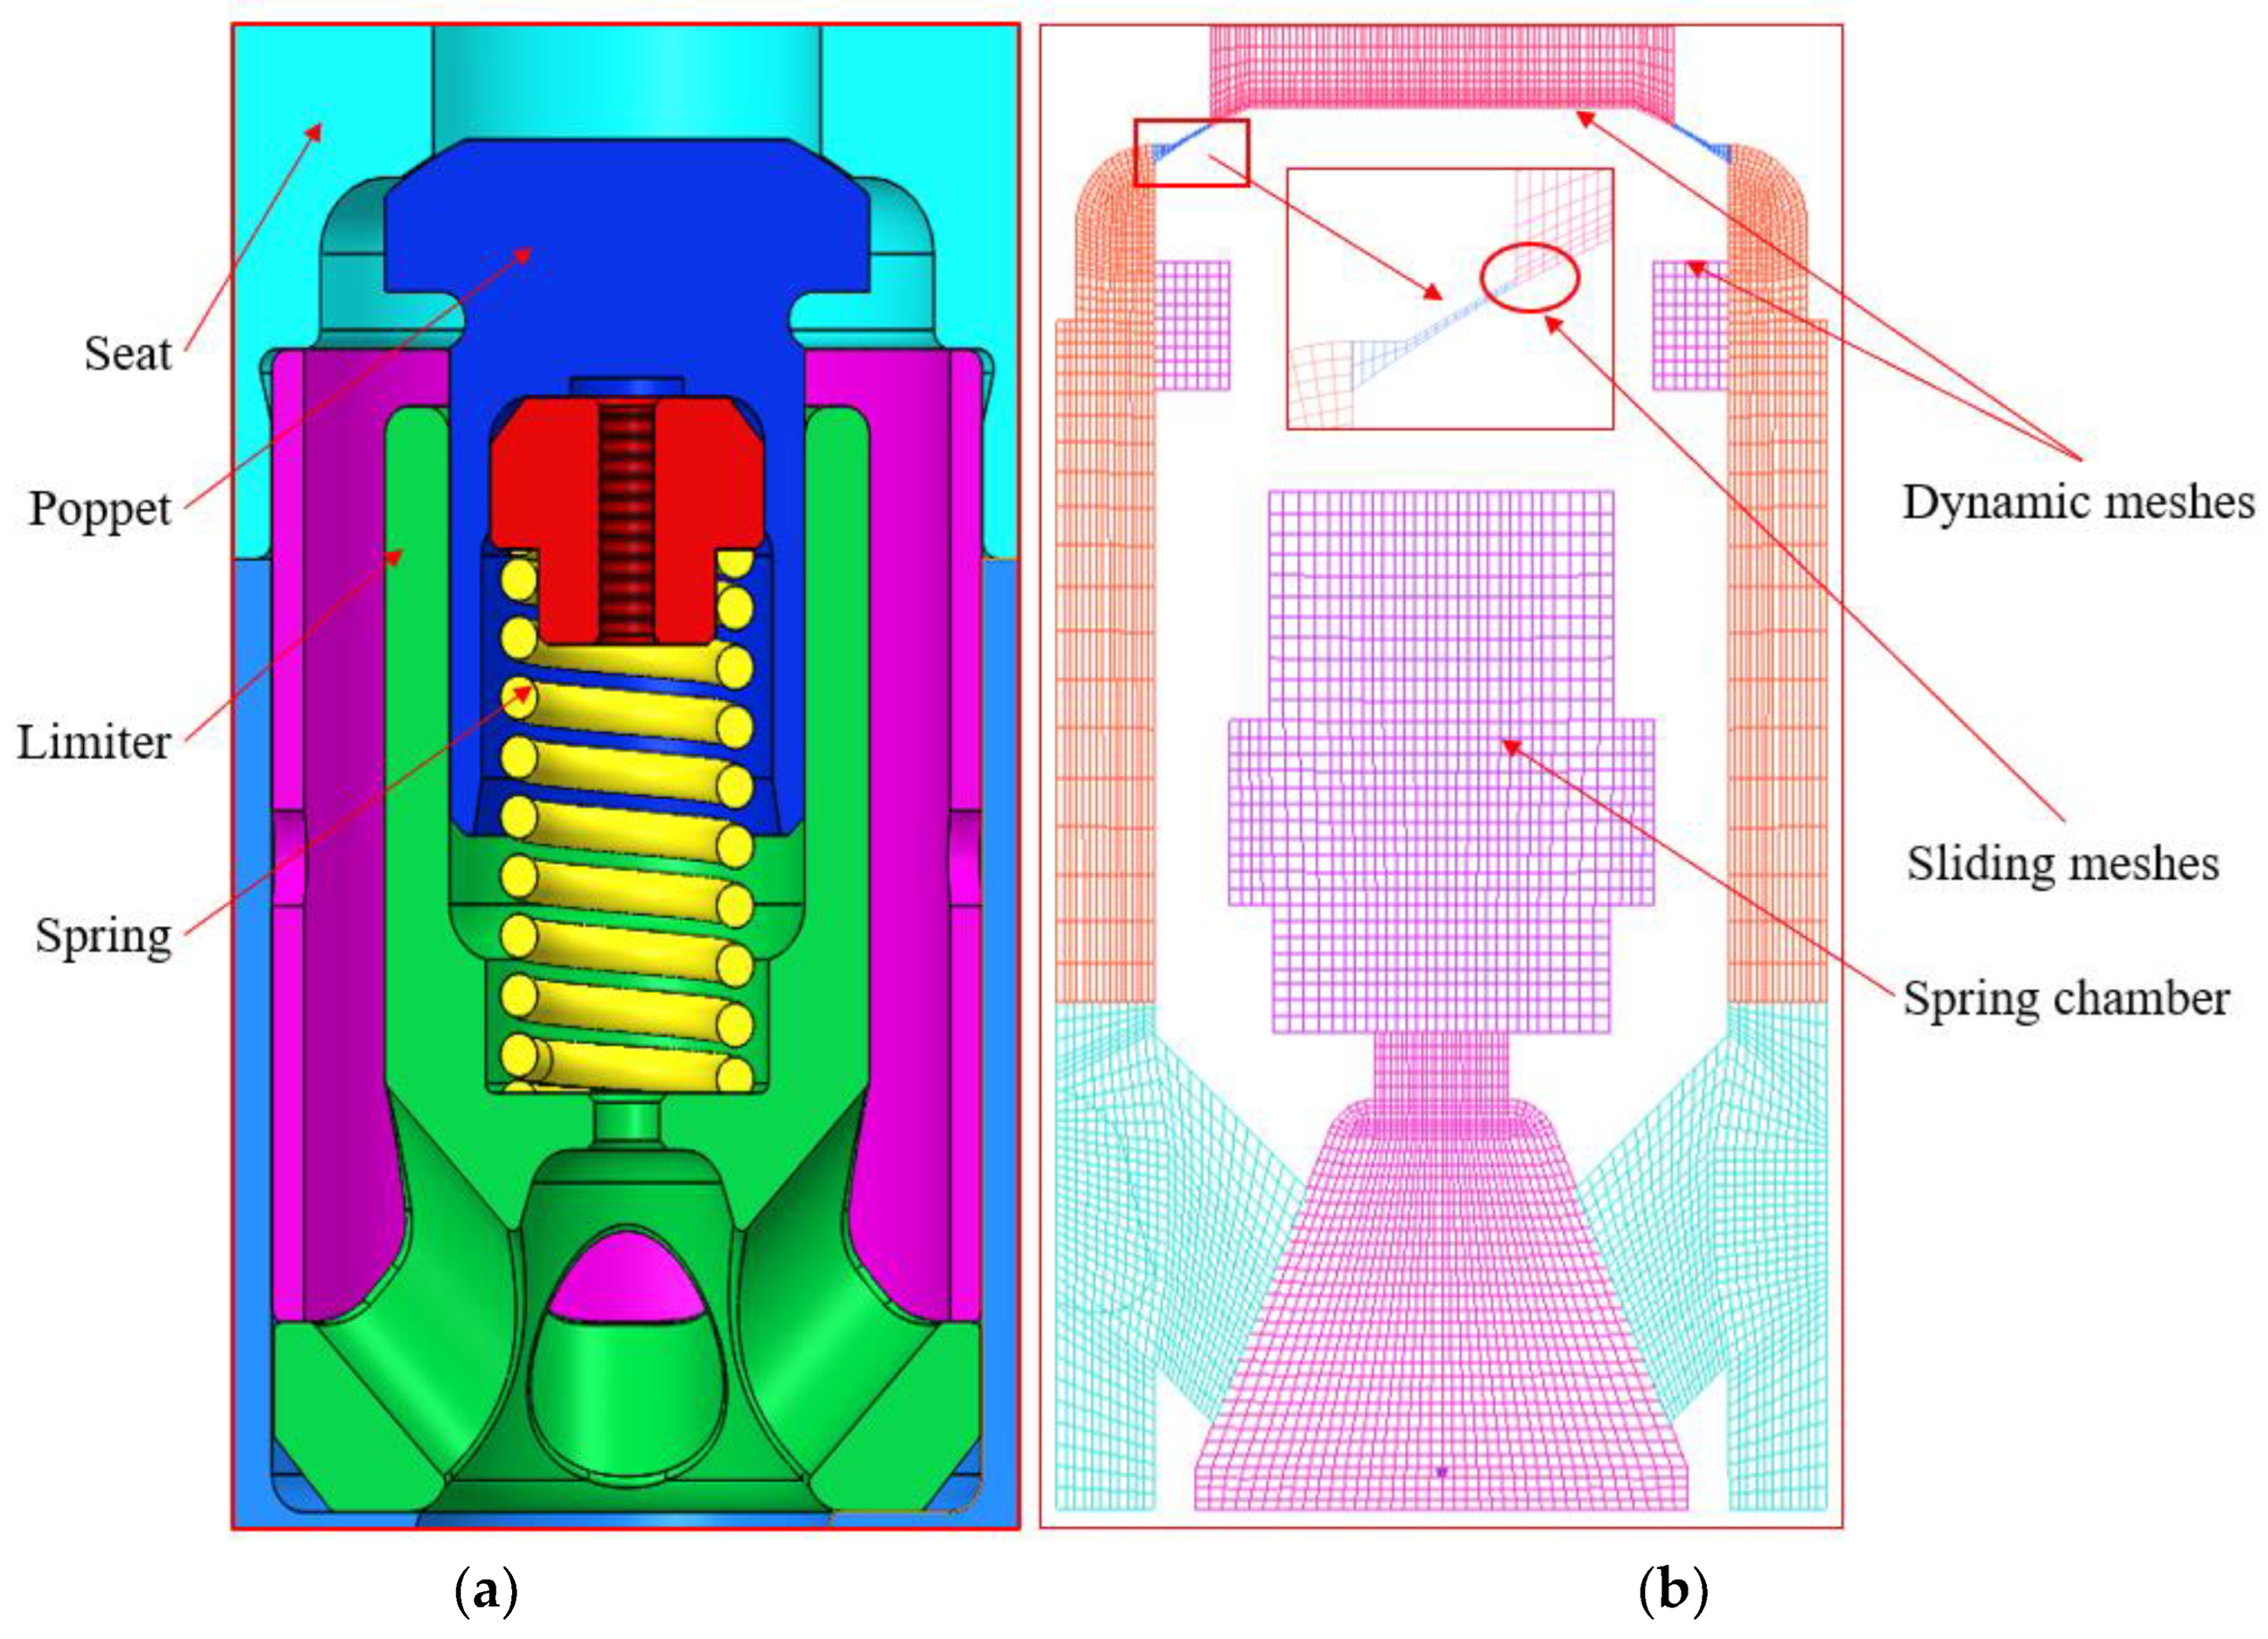
2.2. Meshes for the Poppet Valve

In this numerical model, the geometry profile of the poppet valve was preserved as much as possible. However, this brought a great challenge in building the dynamic mesh for the poppet. To solve this problem, the flow domain inside the valve was further divided into several parts, thus allowing for generating structural mesh with high quality. The structural mesh also had the advantage of generating dynamic mesh with much higher efficiency when compared to the unstructured mesh.
For example, the entire flow channel of each poppet valve was considered to consist of several basic parts corresponding to the valve poppet, as shown in Figure 3. The flow region was divided into several sub-zones and shown in different colors, thus satisfying the need to establish a dynamic mesh. All the sub-zones were connected using interfaces. A small clearance of 0.1 mm was reserved between the poppet and valve seat, and the small clearance was initially divided into two layers. An ideal height of 0.1 mm with a compression ratio of 0.4 and an expansion ratio of 1.2 was set for the dynamic deformation of clearances. Sliding interfaces were set between the separated clearances to realize the opening and closing of the poppet valve, as shown in the red box of Figure 3b.
A one-degree-of-freedom equation was employed to describe the dynamic motion of the poppet valve, as follows:
M e q x ¨ + C x ˙ + K x = F p + F o
where M e q is the mass of the poppet, C is the damping coefficient, K is the stiffness of the spring, x ¨ , x ˙ and x are the acceleration, velocity, and displacement of the poppet, F p is the accumulated force acting on the poppet induced by the gas pressure, and F o is the spring pre-force acting on the poppet.

2.3. Governing Equations and Boundary Conditions

The governing equations representing the working process of the hyper compressor include the mass, momentum, and energy equations. The unsteady compressible RANS equations were selected to solve the numerical model, as follows:
ρ t + x j ρ u j = 0
t ( ρ u i ) + x j ( ρ u i u j ) = p x j + τ i j x j
t ( ρ h ) + x j ( ρ u j h ) = p t + u j p x i + τ i j u i x j u j x i
where τ i j is the stress tensor and can be expressed as follows:
τ i j = μ ( u i x j + u j x i 2 3 δ i j u k x k )
Moreover, the thermodynamic properties of the working medium ethylene were acquired from a professional software NIST. The density, enthalpy, entropy, heat capacity, sound speed, compressibility factor, and viscosity under the temperatures of 260 K and 400 K and the pressures of 80.0 MPa and 300.0 MPa are listed in Table 2. As can be seen, the density increased by 19.32% with the pressure increase from 80.0 MPa to 300.0 MPa at the temperature of 260.0 K. The compressibility was as large as 6.02 at the temperature/pressure of 260.0 K/300.0 MPa, which means the ethylene was almost incompressible.
Before solving the numerical model, a physical and thermal properties table should be defined at the concerning range of temperature and pressure. The range of temperature was 260 K to 400 K with an interval of 1 K, and the range of the pressure was 80 MPa to 300 MPa with an interval of 0.5 MPa. Linear interpolation was adopted to deal with the physical and thermal properties of the ethylene between the defined points.

2.4. Algorithm and Boundary Conditions

For the 3D transient flow inside the reciprocating compressor, the RNG k-ε turbulence model was well accepted to ensure both high accuracy and reasonable computational cost. The Pressure Implicit with the Splitting of Operators (PISO) algorithm, the second-order upwind scheme, and the second-order backward Euler scheme were selected to solve the numerical model.
The boundary conditions for the inlet and outlet of the numerical model were set at the pressure inlet of 107 MPa/30 °C and the pressure outlet of 260 MPa/85 °C, respectively, with a turbulence intensity of 10%. The initial condition of the inlet pipeline, and the suction chamber were all set as 107 MPa/30 °C, and the initial condition of the suction valve, working chamber, discharge valve and the outlet pipeline were set as 260 MPa/85 °C.
For the numerical model, mesh independence checks were conducted using four mesh densities, i.e., about 144, 216, 321, and 467 million. The accumulated mass flow rate at the outlet of the discharge chamber was selected as the criterion for the mesh independence check. The acquired mass flow rate was 3.78, 3.90,3.93 and 3.92 kg/s. Therefore, the mesh number of 216 million was adopted to conduct the simulation. The low Mach number approximation model was employed to reduce the computational cost [22]. The adaptive time step method was employed during the solving process, and the time step of 0.0004 s was finally decided, corresponding to a crank angle step of 0.048°. The pressures in the working chamber and inlet and outlet pipelines were monitored to examine whether the results were converged, as shown in Figure 4. Convergence was defined as the deviation of pressure between two successive cycles smaller than 1%.
The numerical model was solved by using a high-performance platform with a CPU of 56 cores, and the computational cost was about 18 h per cycle of the hyper compressor. It took about six cycles to acquire the converged solution, as shown in Figure 4.

3. Results and Discussion

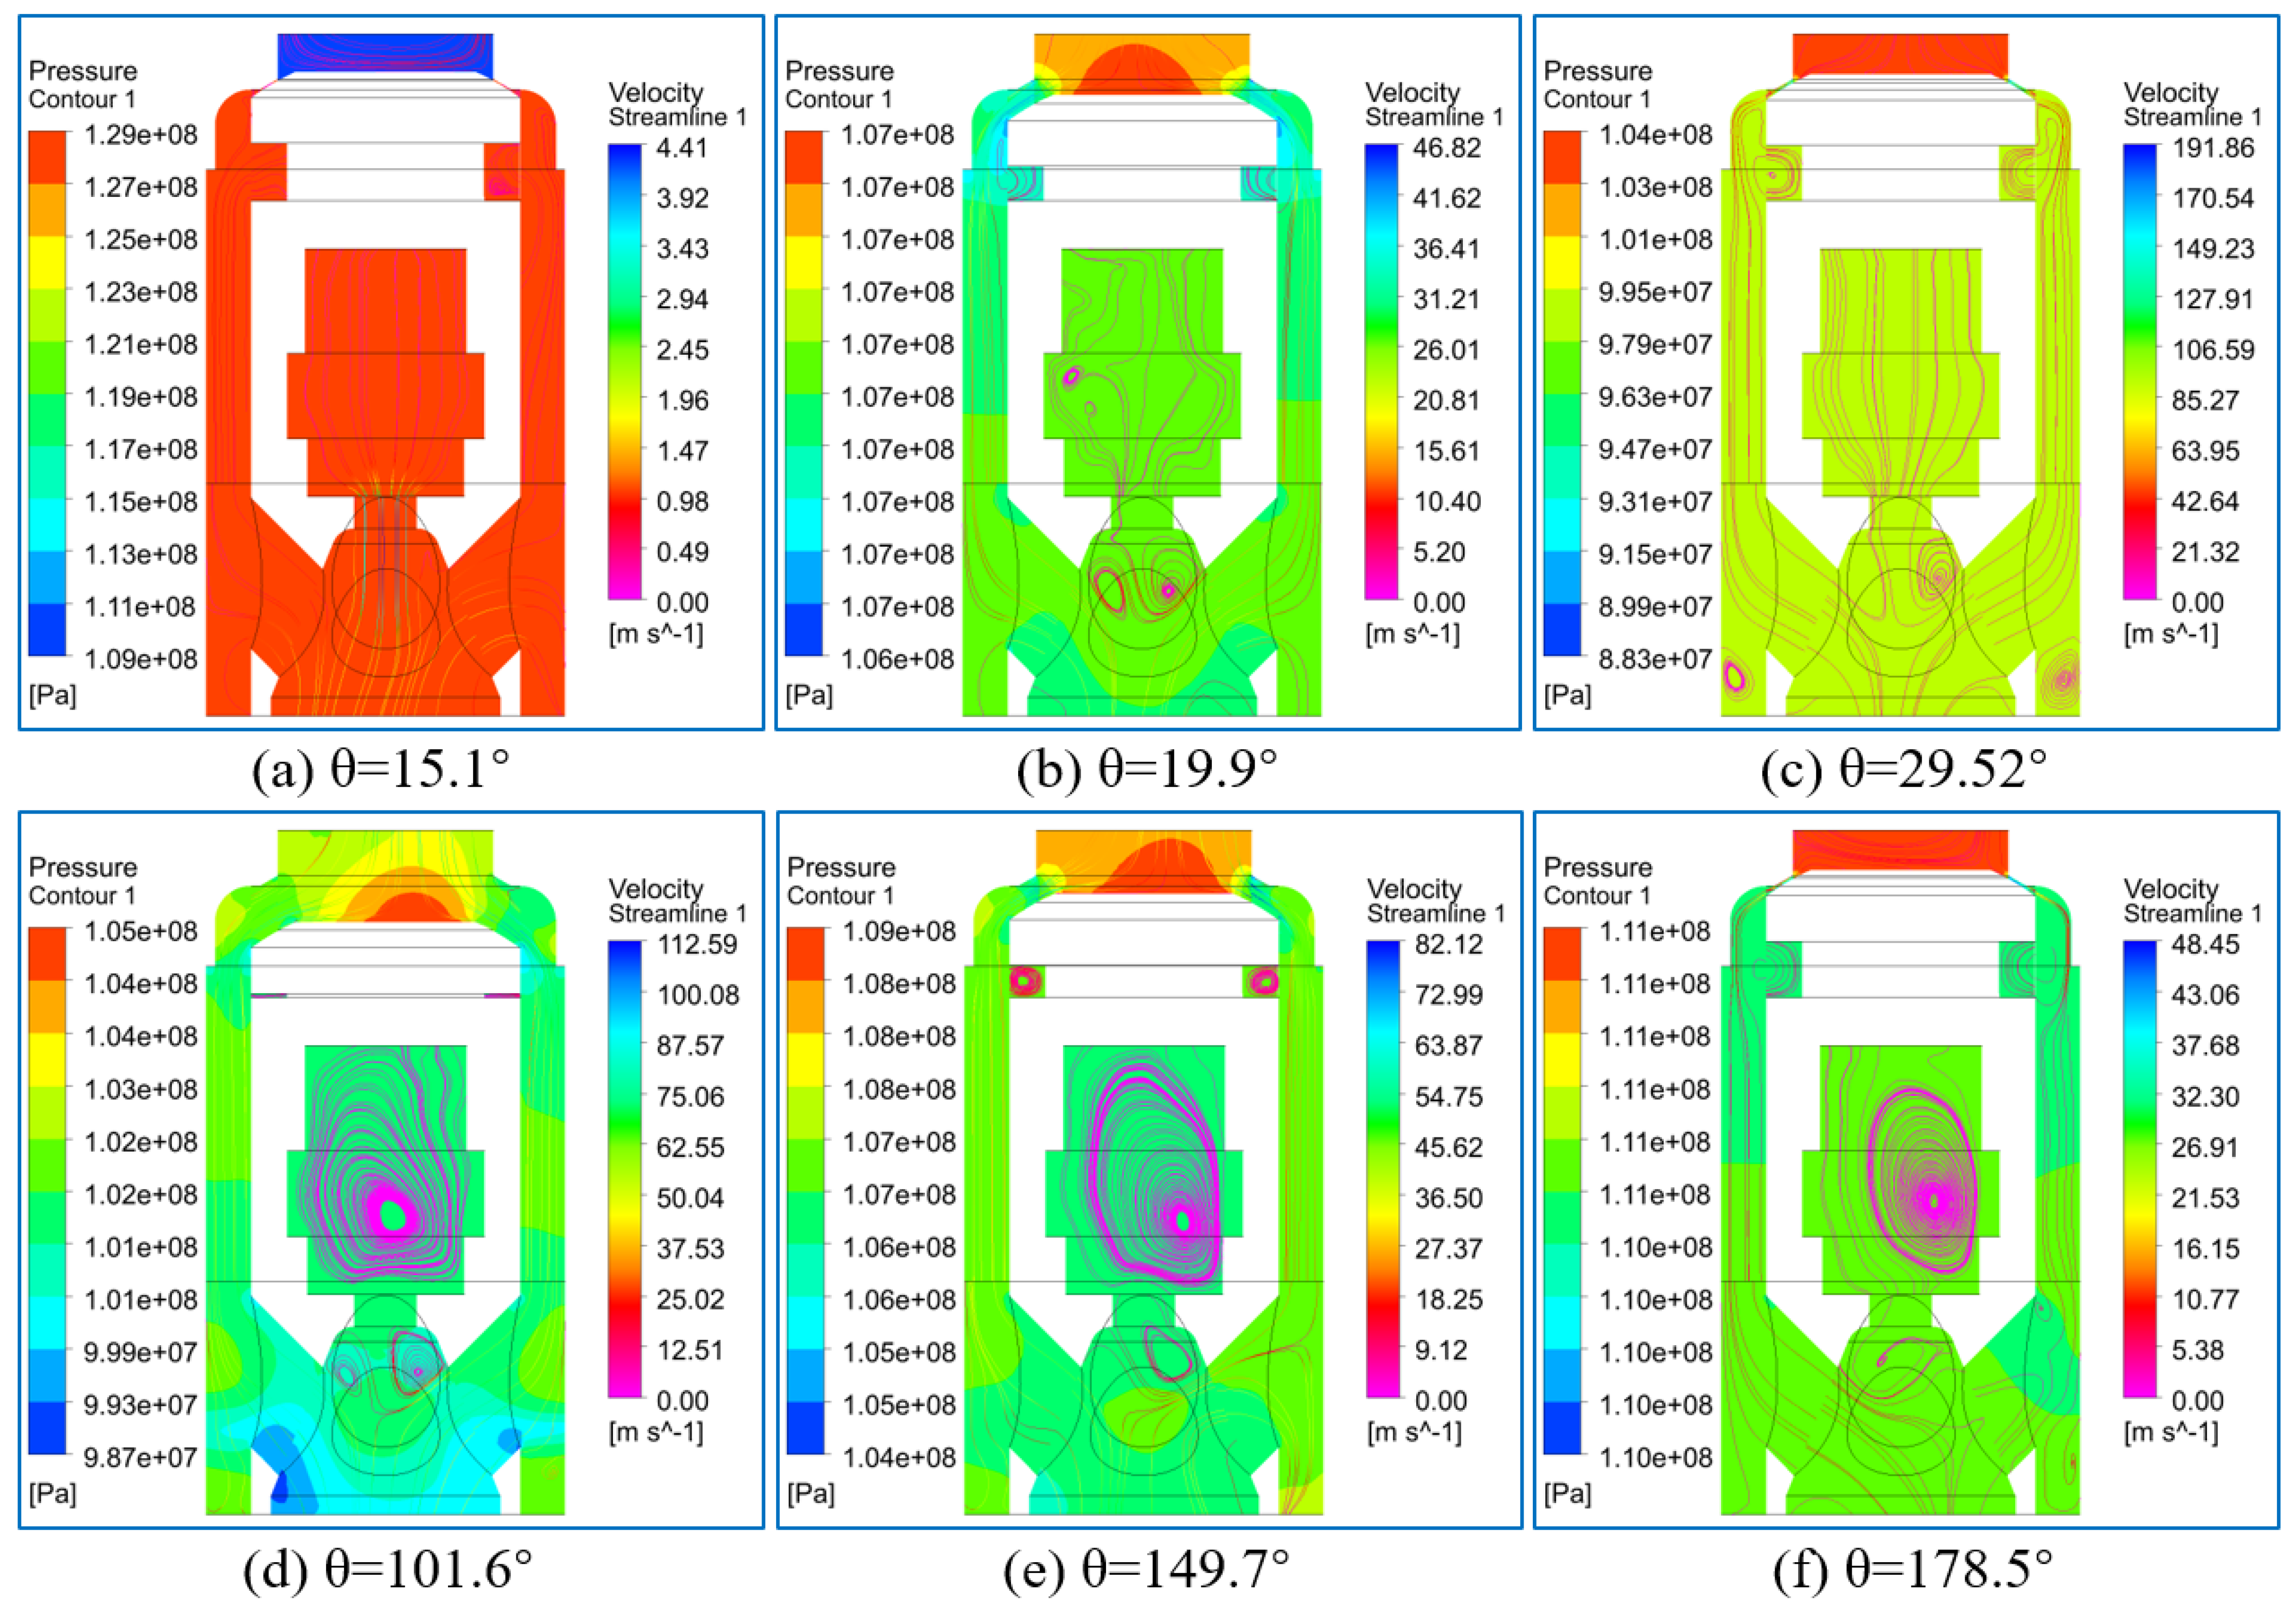
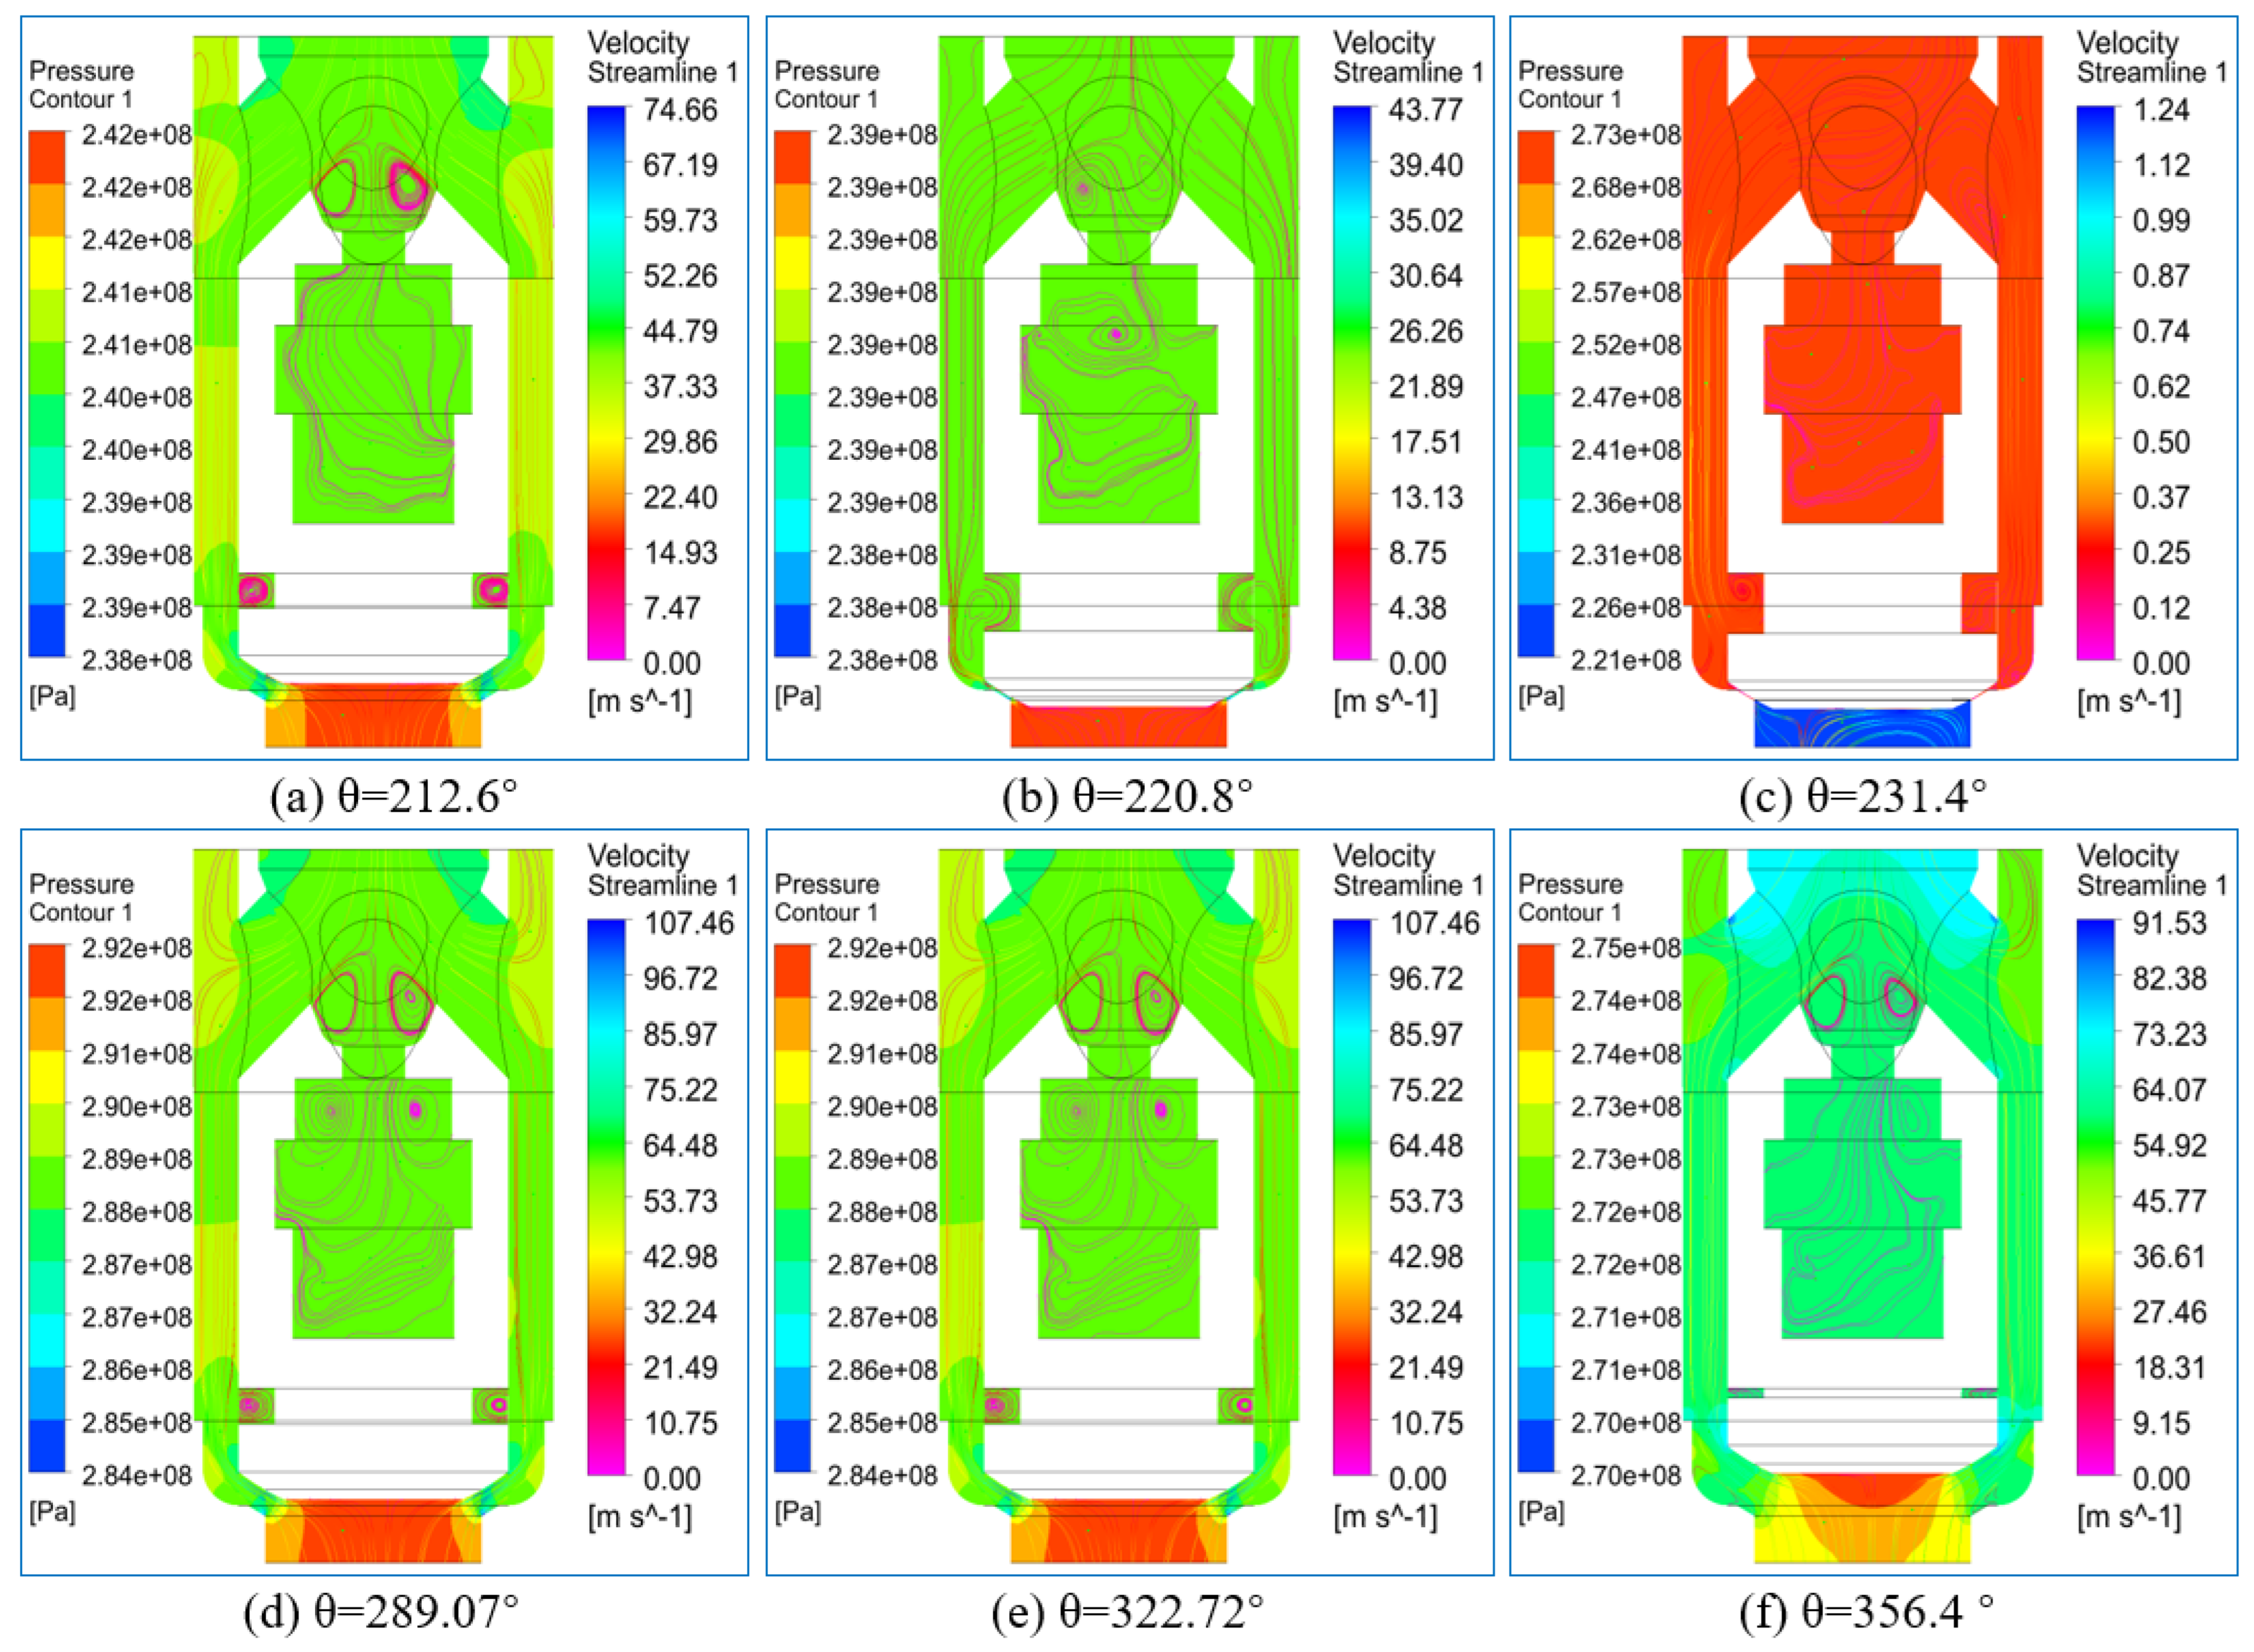
3.1. Thermodynamic Process and Internal Flow

(1) P-V diagram inside the working chamber
The second stage of the LDPE hyper compressor usually works at a suction pressure of 100~110 MPa and discharge pressure of 240~350 MPa, depending on the components of the working medium and the expected products. In this work, the inlet and outlet of the numerical model were set at a pressure inlet of 107 MPa/30 °C and a pressure outlet of 260 MPa/85 °C. The rotational speed of the hyper compressor was 200 rpm. Multiple points were set on the inlet and outlet pipelines to monitor the pressure pulsations and propagation. The averaged pressure on the plunger was calculated to represent the pressure inside the working chamber, and the results are shown in Figure 5 and Figure 6. With the increase in the crank angle, the volume of the working chamber increased when the plunger began to move from the top dead center (the right) to the bottom dead center (the left), as shown in Figure 1. The increase in the working chamber volumes led to the expansion of ethylene between the crank angles of 0° to 18°. The pressure inside the working chamber decreased greatly from 243.18 MPa to 101.86 MPa in this period. Then, the suction valve tended to open under the effect of the increased pressure difference across the valve surfaces. The ethylene in the inlet pipeline flowed into the working chamber and pressure fluctuations occurred greatly during the opening process of the suction valve. This was caused by the complex interaction between the pressure in the inlet chamber, the pressure in the working chamber, and the valve dynamics. Another factor contributing to this phenomenon could be the incompressibility and high sound speed of ethylene. With the increase in the crank angle to 180°, the suction process ended with the close of the suction valve. The compression process happened during the crank angle of 180° and 218° where the pressure increased from 110.8 MPa to 286.7 MPa. The pressure continued to increase, slowing down the gradient because of the opening of the discharge valve. Then, the ethylene was discharged out of the working chamber between the crank angle of 218° and 360°. During the discharge process, the maximal and minimal pressures were 295.63 MPa at 229.04° and 237.09 MPa at 304.78°. In both the suction and discharge processes, the pressure inside the working chamber followed the tendencies of the pressure in the inlet chamber and outlet chamber through the coupling of the valve motions.
The p-V diagram can be calculated based on the p-θ diagram in Figure 5 and the basic parameters of the hyper compressor in Table 1, as shown in Figure 6. The volume of the clearance, V0, was 13.24% of the total working volume. The exponents of the expansion and compression processes could be derived from the p-θ diagram. By using the pressures and volumes at the starting points and ending points of these processes, the calculated exponents of the expansion and compression processes were 13.22 and 5.12, respectively. These exponents were much larger than the common air compressor because of the higher incompressibility of the ethylene under ultra-high pressures.
(2) Evolution of thermodynamic parameters inside the working chamber
During the simulation process, the evolution of thermodynamic parameters, such as pressure, velocity streamline, temperature, etc., can be acquired and are shown in Figure 7, Figure 8 and Figure 9. In Figure 7a–h, the pressure distributions inside the working chamber are illustrated at the crank angle from 0° to 360° with an interval of 45°. With the increasing volume of the working chamber, the pressure decreased rapidly, as shown in Figure 7a,b, and under the effect of the increased pressure difference between the suction chamber and working chamber, the suction valve opened between 0° and 45°. With the ethylene flowing into the working chamber, the pressure inside the working chamber fluctuated in a small range. As can be seen in Figure 7a–e, the pressure of the working chamber in Figure 7c was the lowest, and the maximal velocity of 114.06 m/s through the valve channel occurred at the crank angle of 45°, as shown in Figure 8c. When the plunger arrived at the bottom dead center, the suction process ended with the closing of the suction valve, as shown in Figure 7e. Two large eddies were found in the working chamber of the hyper compressor. The compression and discharge processes are shown in Figure 7f–h. The maximal pressure during the compression process occurred at the crank angle of 215° with a maximal speed during the discharge process of 95.11 m/s, as shown in Figure 8f. Then, the maximal pressure in the working chamber tended to decrease with the continued discharge process. This was because the lift of the discharge valve resulted in the maximal value and stayed steady on the limiter.
As shown in Figure 9, despite the inlet temperature of the numerical model being set at 30 °C (303 K), the lowest temperature during the working process was 295.3 K at the crank angle of 45°. The lower temperature was induced by the expansion of ethylene in the spring chamber of the valve. With the increase in crank angle, the lowest temperatures were in the range of 282 K to 305 K and the highest temperatures were in the range of 348 K and 362 K. The temperature fluctuations were caused by the pressure pulsations in the inlet and outlet pipeline.

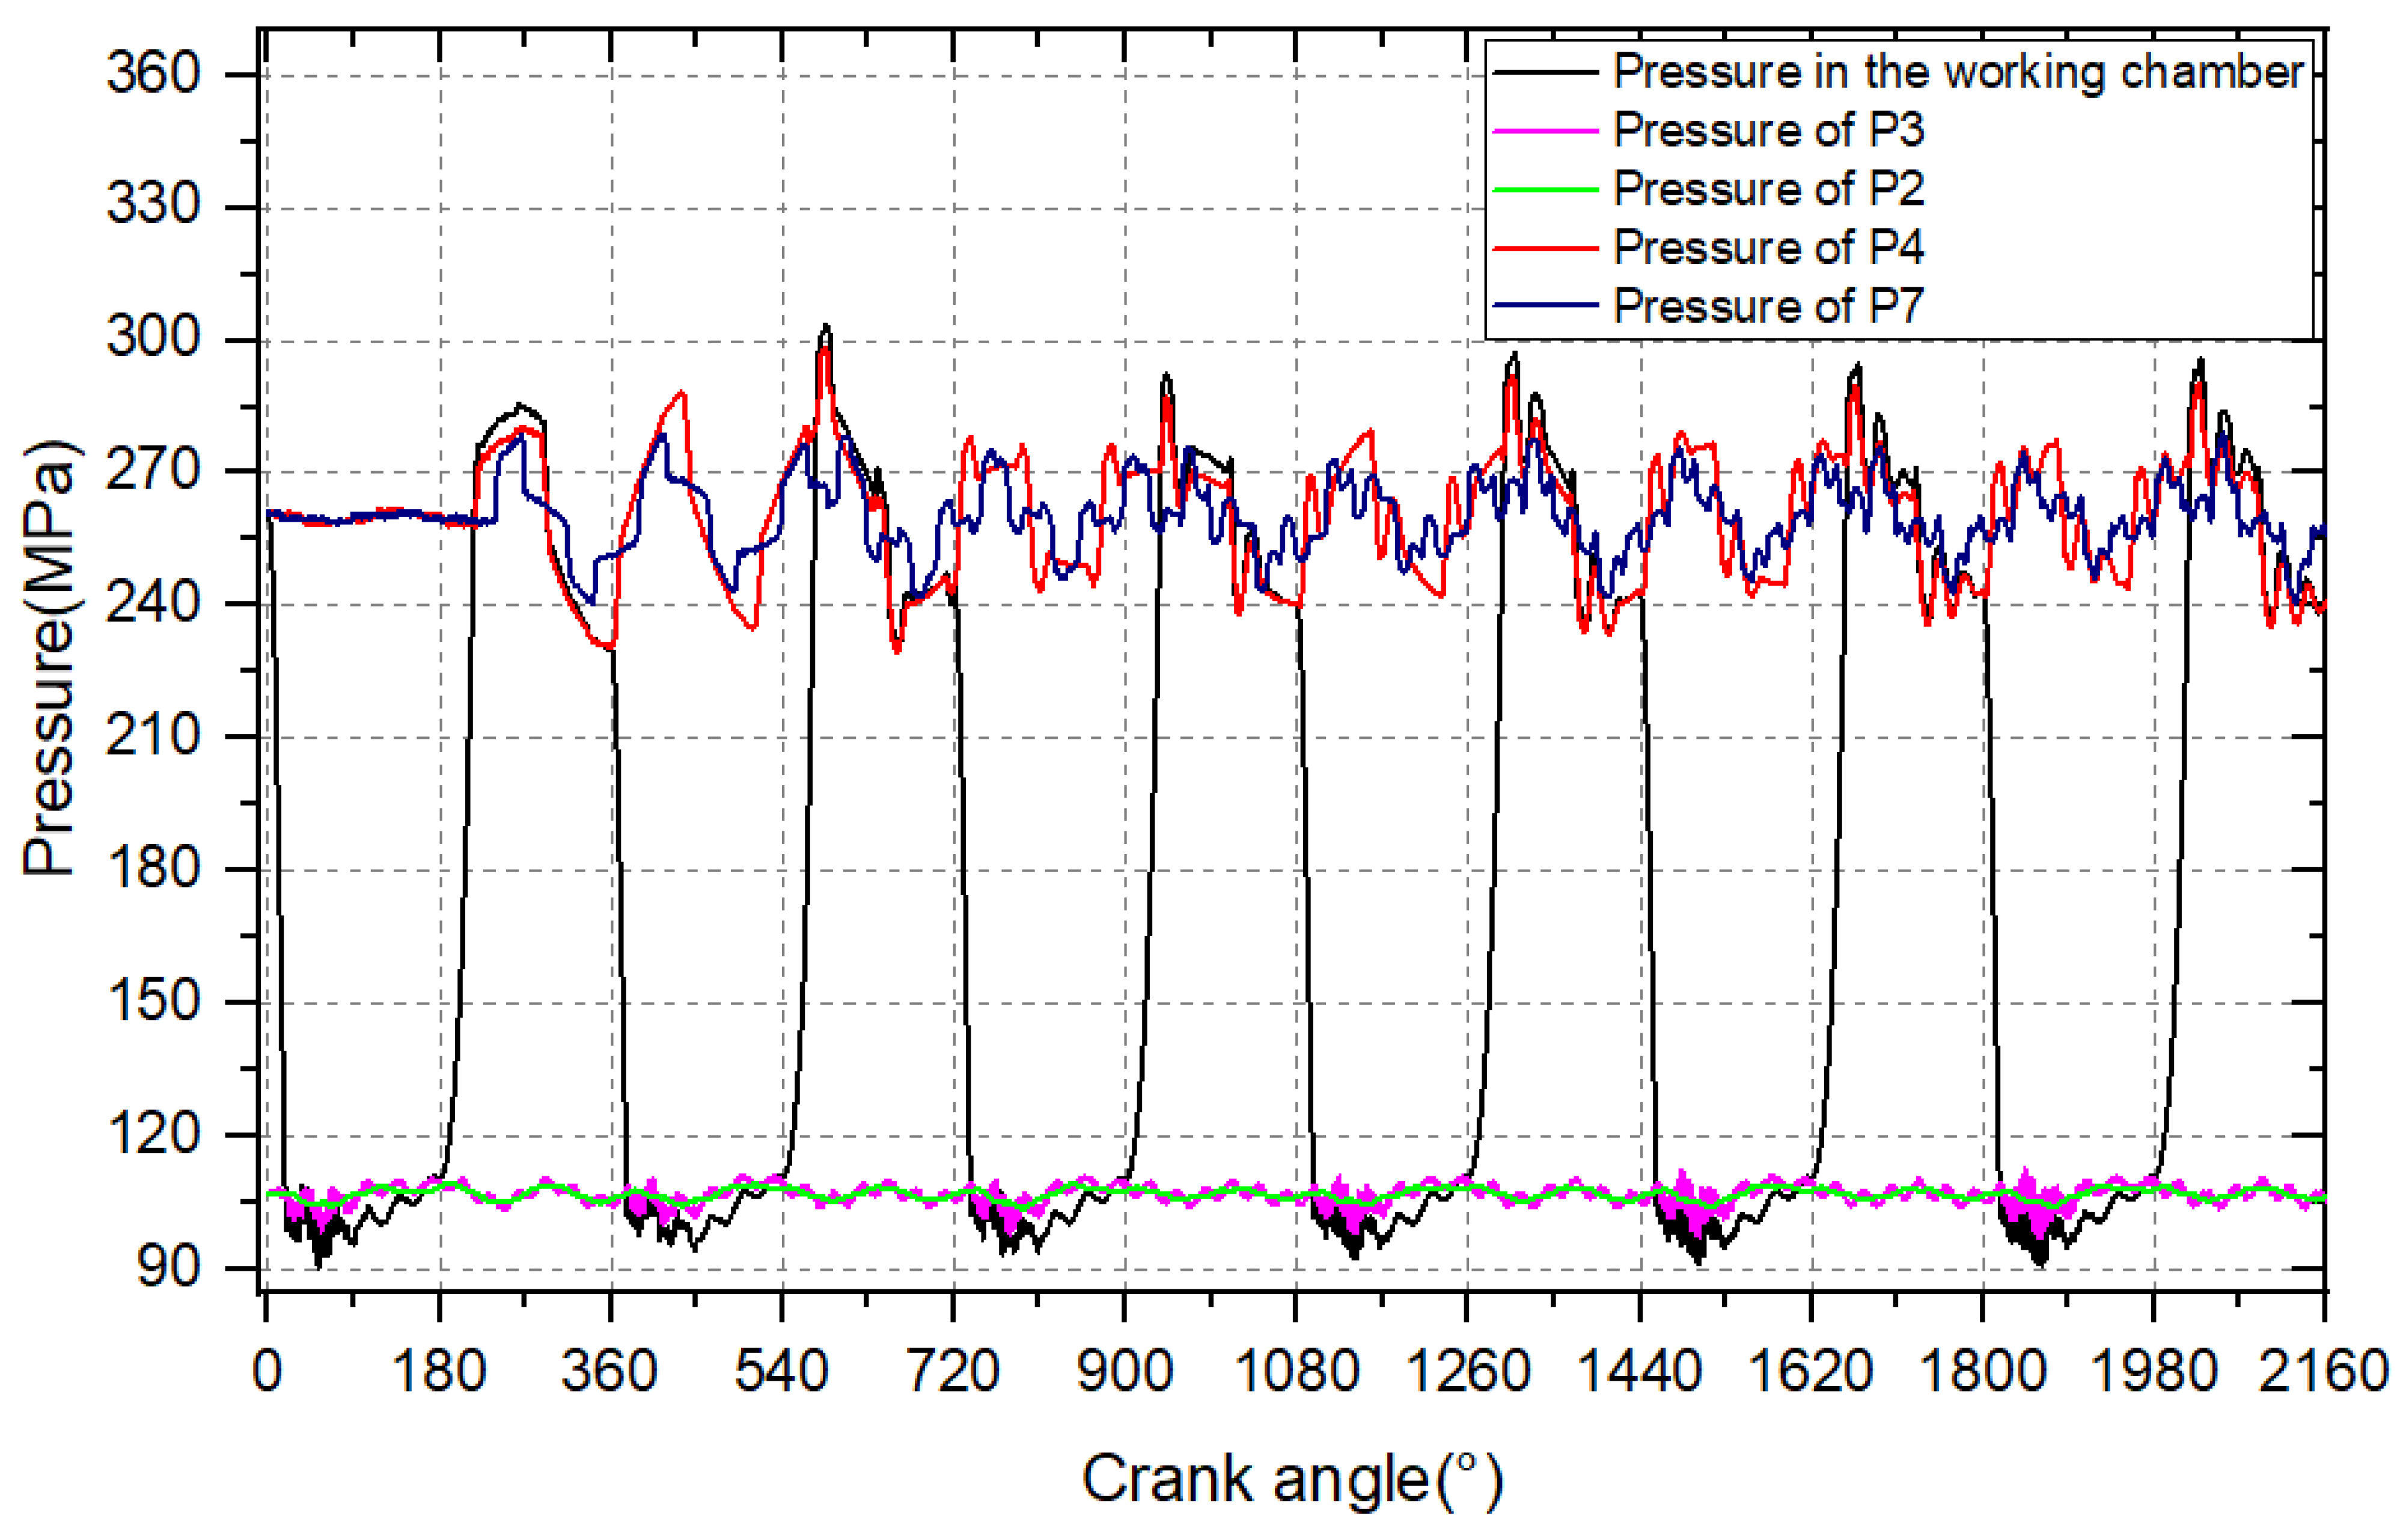
3.2. Characteristics of Pressure Pulsation

As illustrated in Figure 5, the pressure pulsation occurring in the inlet and outlet pipeline was induced by the intermittent suction/discharge process of the hyper compressor. There were two and four pressure monitoring points on the inlet and outlet pipelines, as shown in Figure 2, and the acquired pressure pulsations are shown in Figure 10. Pressure pulsation was evaluated by the pressure unevenness, defined as δ = p m a x p m i n p m × 100 % , i.e., the ratio of the maximal pressure difference p m a x p m i n to the averaged pressure ( p m ) in a cycle. As can be seen, the overall pressure pulsations in the inlet pipeline were smaller than those in the outlet pipeline. The pressure pulsations between the buffer tank and the hyper compressor were 13.65% and 14.46%, which were three times larger than the pressure pulsations in the buffer tank and before the buffer tank. The results showed that the buffer tank was significantly effective in attenuating the pressure pulsation. Nevertheless, there was no buffer tank in the outlet pipeline, and the pressure pulsations of the five monitored locations were 22.07%, 21.15%, 17.81%, 16.43 and 14.74%. Despite the pressure pulsation decreasing along the outlet pipeline, the pressure pulsations were much higher than the expected value of lower than 10%.
The pressure pulsations originated in the suction chamber due to the interaction of the valve dynamics and the working processes of the hyper compressor, and the same reason applies for the outlet pipeline. As the rotational speed of the hyper compressor was set at 200 rpm, the fundamental frequency was about 3.33 Hz. The amplitude–frequency distributions of the pressure pulsations in Figure 10 were obtained by using Fast Fourier Transform (FFT), as shown in Figure 11. The location of the monitored pressure is shown in Figure 2, where P1, P2 and P3 are on the inlet pipeline, and P4, P5, P6 and P7 are on the outlet pipeline. The averaged values of the pressure pulsations were about 106.95 MPa and close to the inlet pressure. The pressure pulsation in the inlet pipeline were mainly formed by the 1st–4th and 10th–13th orders of the harmonics with higher amplitudes, as shown in Figure 11a. While in Figure 11b, the averaged values of the pressure pulsations were about 260.15 MPa and close to the outlet pressure. The peak values of amplitude–frequency distributions of these pressure pulsations occurred in the 2nd, 7th, 12th, 17th, 24th, and 29th orders of the harmonics. The amplitude–frequency distributions of these pressure pulsations could then be used as exciting sources to evaluate the mechanical response and vibration of the pipeline.

3.3. Characteristics of Valve Motion

The lifts of the valves can be acquired by using the monitored coordinates of the poppet valves, which are shown in Figure 12. The lifts of the suction and discharge valves are represented with blue and red solid lines. As can be seen, the suction valve opened at the crank angle of 17.02° and closed at the crank angle of 178.73°. Severe flutter happened during the opening process between the crank angle of 17.02° and 99.97°. Then, the poppet reached the maximal lift and stayed on the limiter of the valve during the crank angles of 99.97° and 131.98°. The poppet started to move back to the seat of the valve at a crank angle of 131.98° and closed at a crank angle of 178.73°. The flutter of the poppet valve was dominated by the pressure difference between the pressure in the suction chamber and the pressure in the working chamber, as shown in Figure 5. The other reason for the poppet flutter could be the over-small preload of the spring in the valve or the over-large stiffness of the spring. The blue and red shaded areas are the ideal flow area. The discharge valve opened at the crank angle of 217.07°, stayed on the limiter at 229.81°, started to move back to the seat at 294.01°, and closed at 358.21°. The opening of the discharge valve was quickly accomplished at only 2.61°, and the speed of the poppet increased greatly. Consequently, the poppet of the discharge valve impacted with the limiter twice at 219.29° and 224.45°. The shaded areas in blue and red are the areas of ideal movement of the suction and discharge valves. Then, the coefficients of area utilization can be defined as the ratio of the area below the lift and the ideal area. In this case, the coefficients of area utilization for the suction and discharge valves were 66.88% and 67.79%. Both the severe flutter of the suction valve and the fast opening of the discharge valve could be contributed by the incompressibility of the ethylene under ultra-high pressure. Because the volume of the working chamber changes with the reciprocating movement of the plunger, as shown in Equation (1), the pressure in the working chamber could increase/decrease greatly with the decrease/increase in the working volume due to the high incompressibility. The sharply changed pressure would determine the acceleration, velocity, and lift of the poppet, which in turn determines the mass flow rate through the valve and the thermodynamic parameters in the working chamber.
The pressure distributions and velocities during the opening process of the poppet valve and discharge valve are shown in Figure 13a–f. Figure 13a,b show the moment the suction valve opened during the crank angle of 15.1–19.26° and how the interfaces of the sliding meshes are built to allow the ethylene to flow into the working chamber. The pressure values in the suction chamber and the working chamber were about 109 MPa, as shown in Figure 13a. With the pressure decreased in the working chamber, the poppet of the suction valve opened at the crank angle of 19.2° with a maximal velocity of 46.82 m/s, as shown in Figure 13b. Then, due to the high compressibility of the ethylene, the pressure difference across the poppet decreased, which pushed the poppet to move back to the seat of the suction valve with a maximal velocity of 191.86 m/s, as shown in Figure 13c. The poppet of the suction valve experienced multiple flutters during the opening process and then stayed steadily on the limiter of the suction valve. The suction process continued with the movement of the plunger, as shown in Figure 13d,e, and ended at the crank angle of 178.2°, as shown in Figure 13f.
The pressure distribution and evolution in the discharge valve during the discharge process are shown in Figure 14. As mentioned earlier, the poppet of the discharge valve opened at the crank angle of 217.02°, as shown in Figure 14a,b. The velocity increased greatly with the opening of the discharge valve. The maximal pressures during the discharge processes increased from 273 MPa to 290 MPa with the opening of the discharge valve, as shown in Figure 14a–c, and then decreased to 242 MPa with the decrease in pressure in the outlet pipeline, as shown in Figure 14d–f. The maximal velocity during the discharge process was 112.52 m/s which was much smaller than that during the suction process. This was because the severe flutter of the poppet of the suction valve led to the relatively larger local pressure difference between the suction chamber and working chamber.

4. Conclusions

This work presents a transient CFD simulation of a hyper compressor which incorporated the working process inside the cylinder, the dynamic motion of the poppet valve, and the pressure pulsation inside the pipeline system. The dynamic motion of the poppet valves was solved with real-time pressures inside the working chamber and the pipeline, thus realizing the interaction between the thermodynamic process and the valve motion, and between the valve motion and the pressure pulsation with the working medium of ethylene. The dynamic mesh technique and sliding mesh technique were employed to control the dynamic movement and opening/closing of the valve, respectively. The distribution and evolution of the thermodynamic parameters, pressure pulsation, and valve dynamics during the working processes of the hyper compressor were revealed and discussed. The major conclusions can be concluded as follows:
(1)
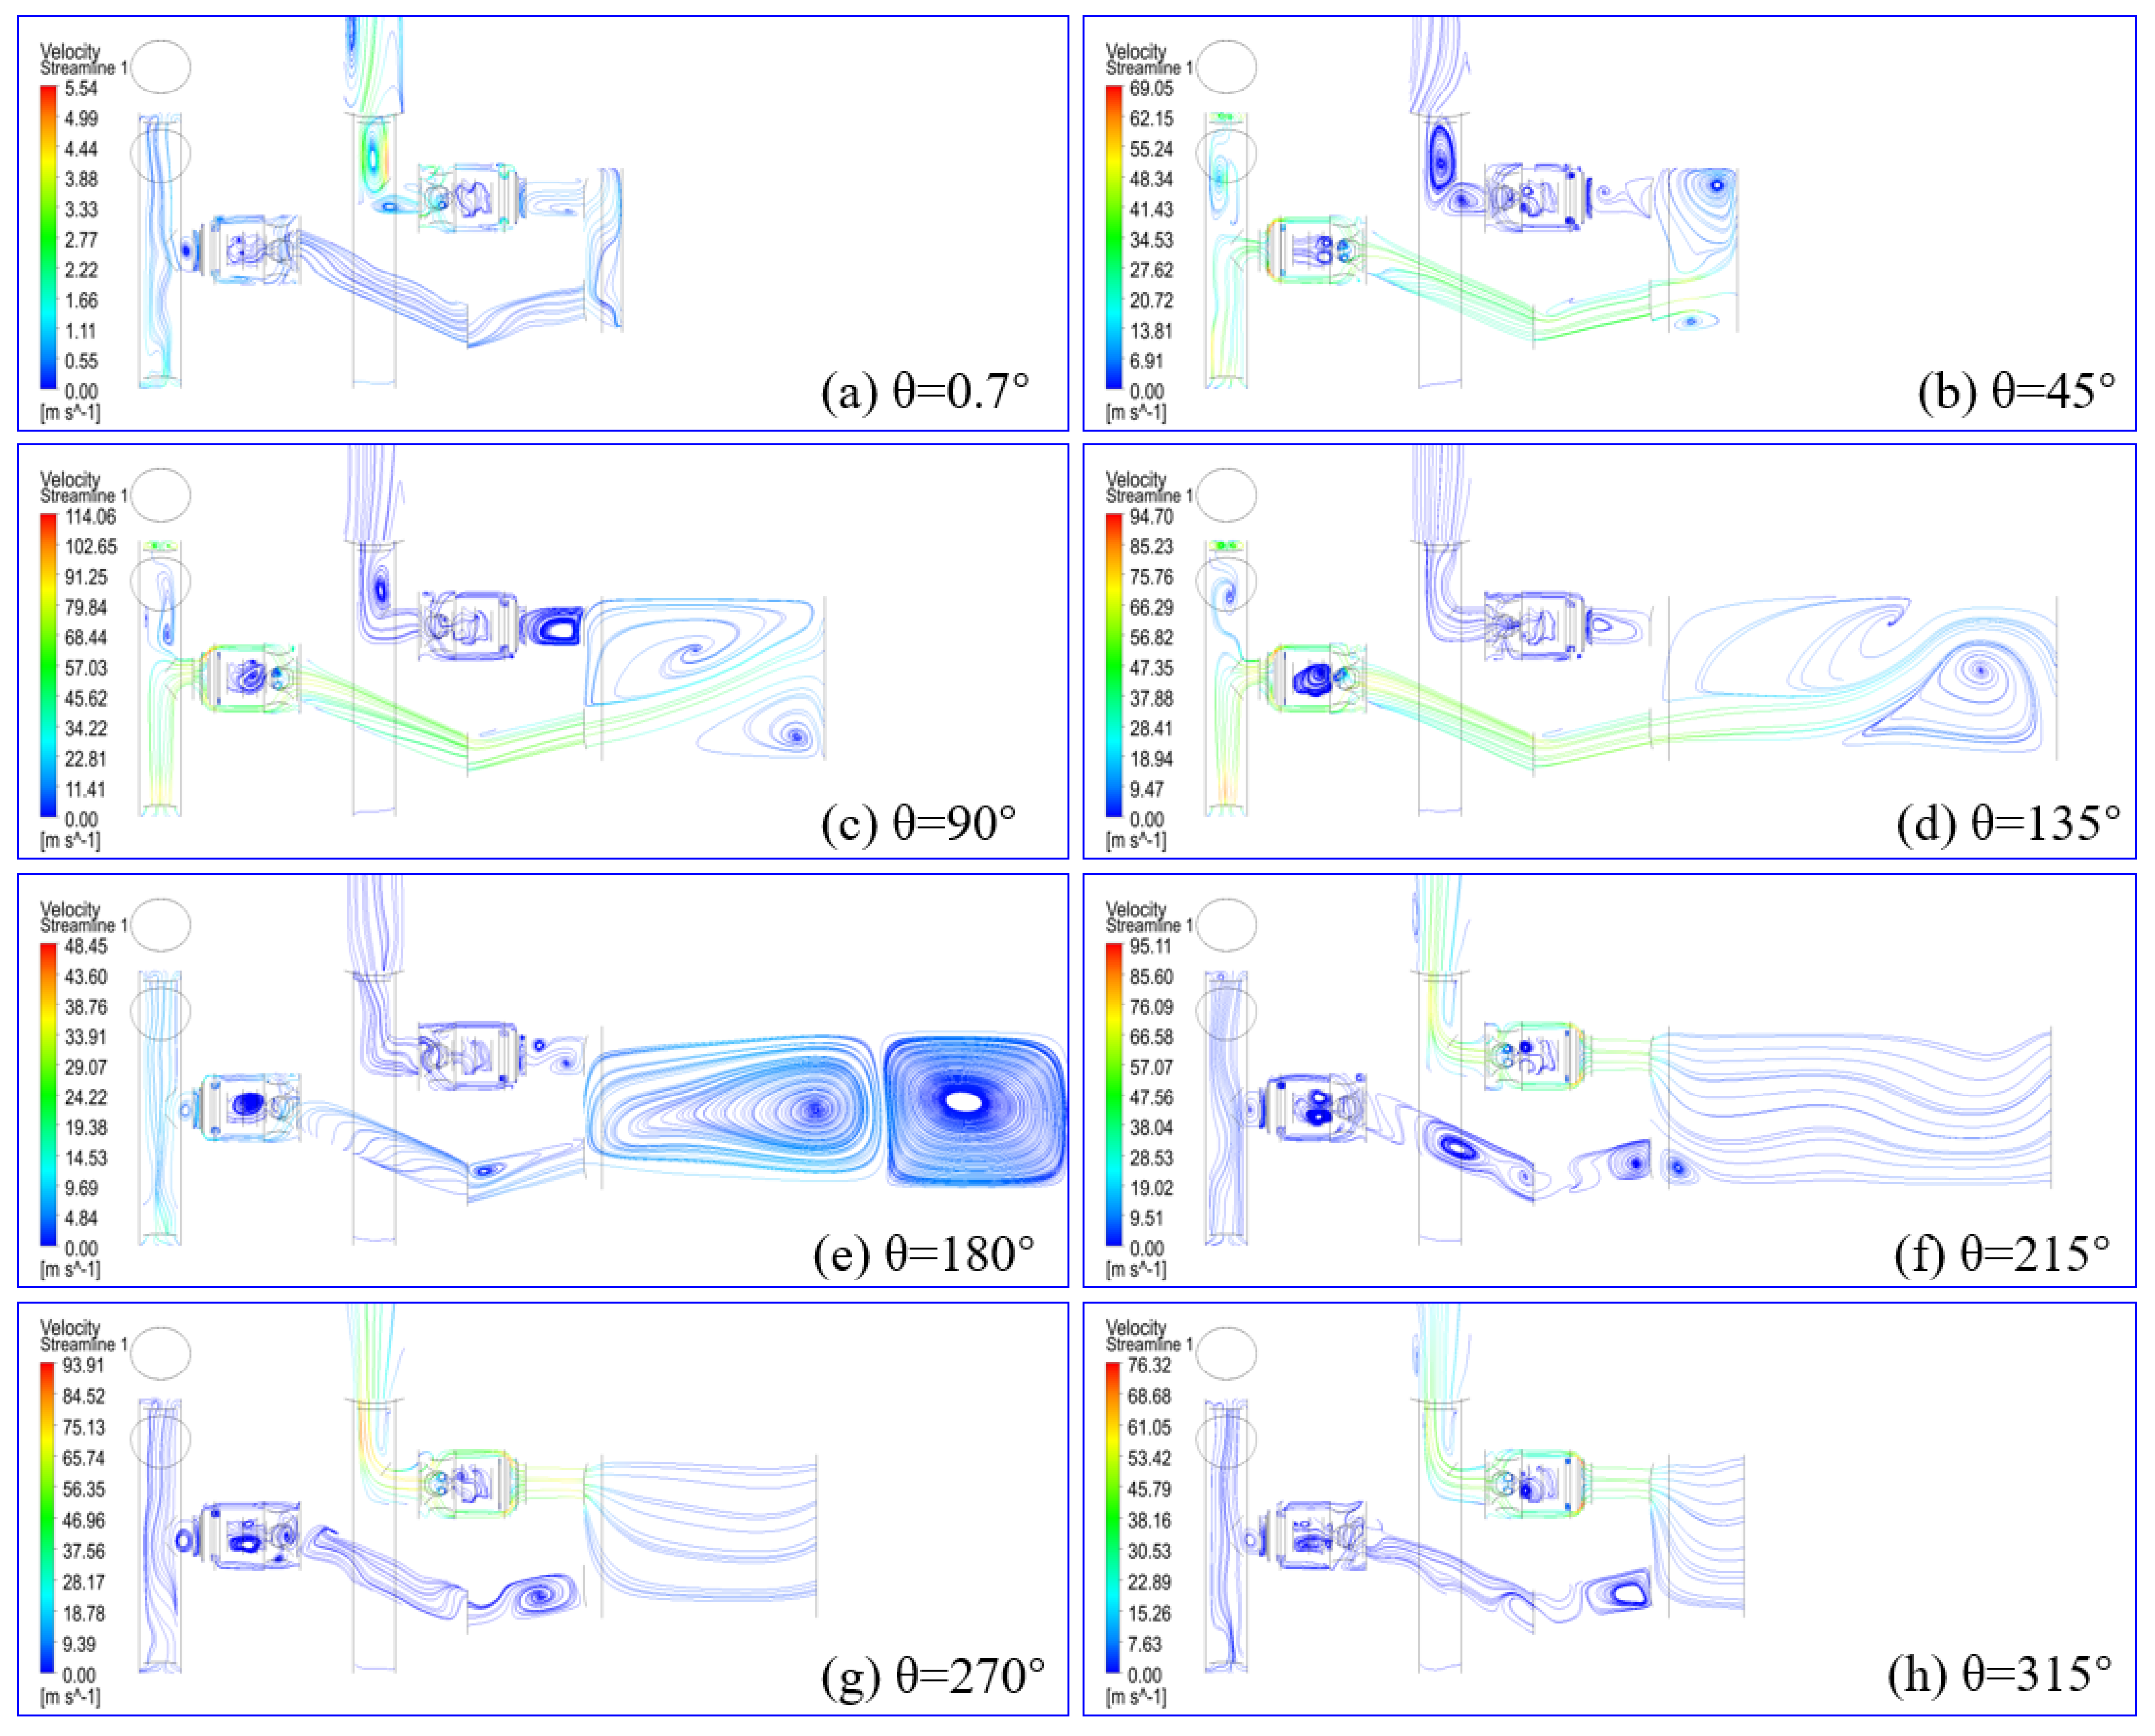
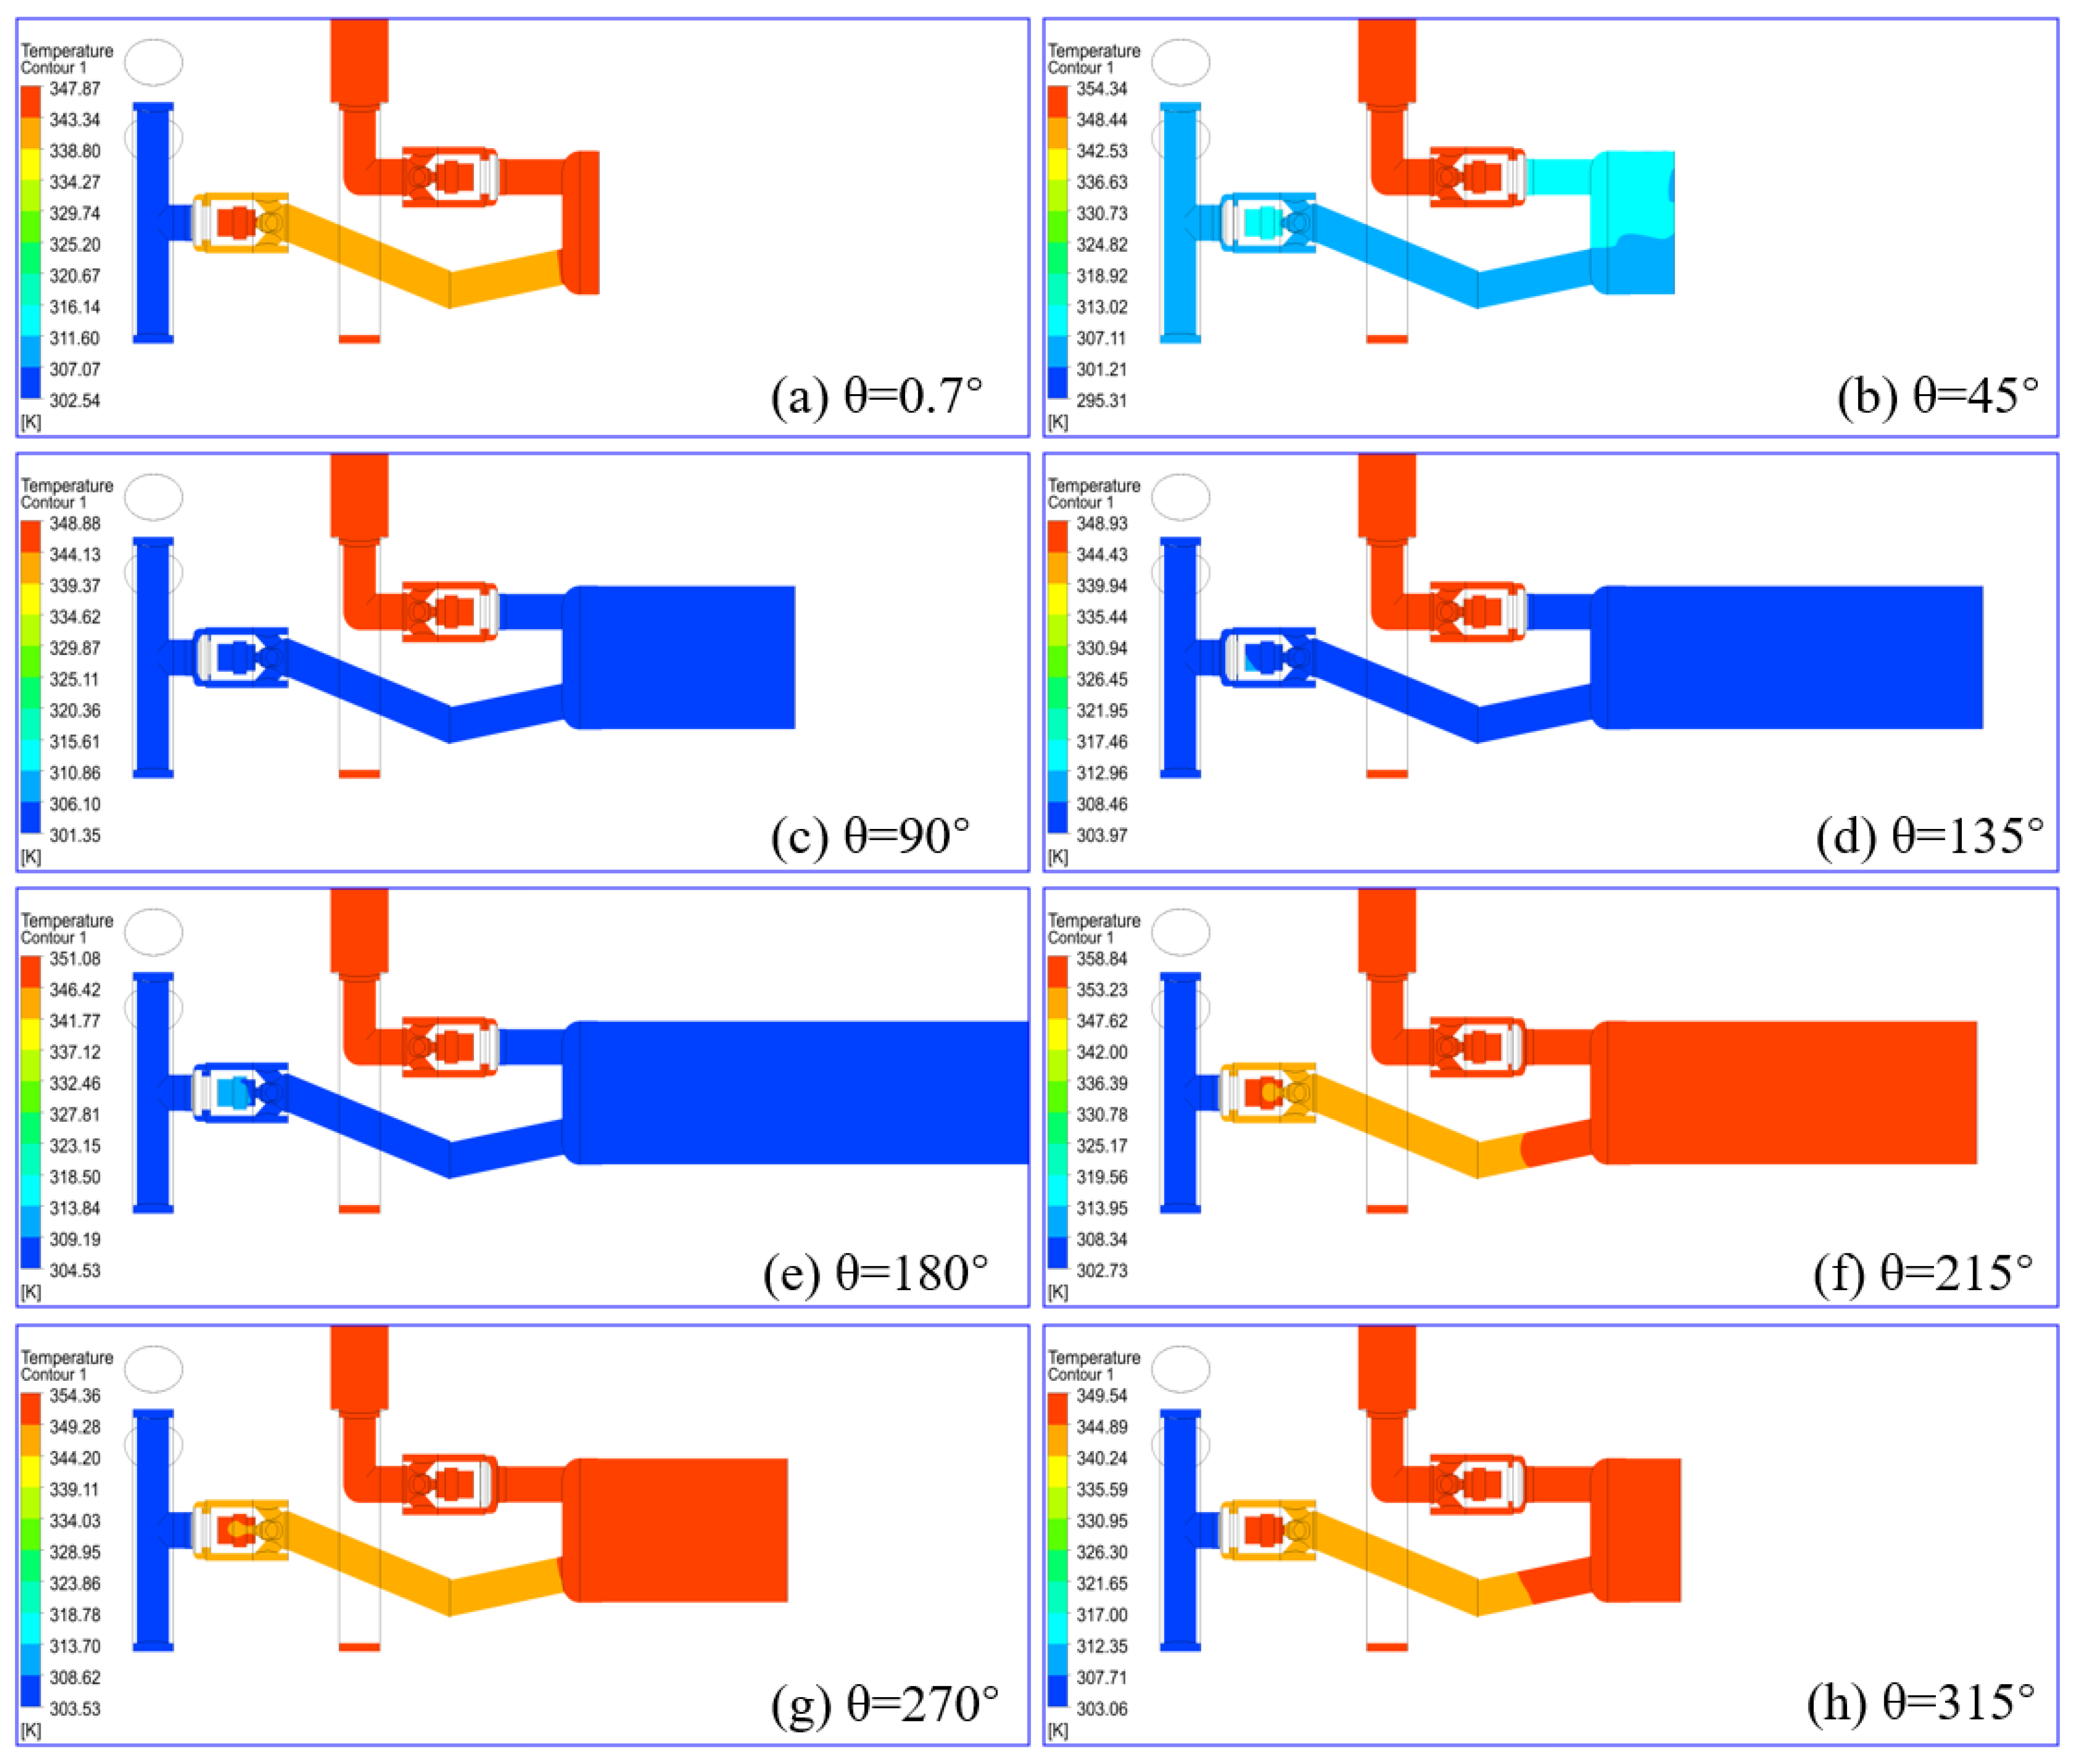
The proposed transient flow model was able to obtain the distribution and evolution of the hyper compressor and its pipeline system by taking into consideration the interaction between the thermodynamic process inside the working chamber and the valve motion and between the valve motion and pressure pulsation inside the pipelines;
(2)
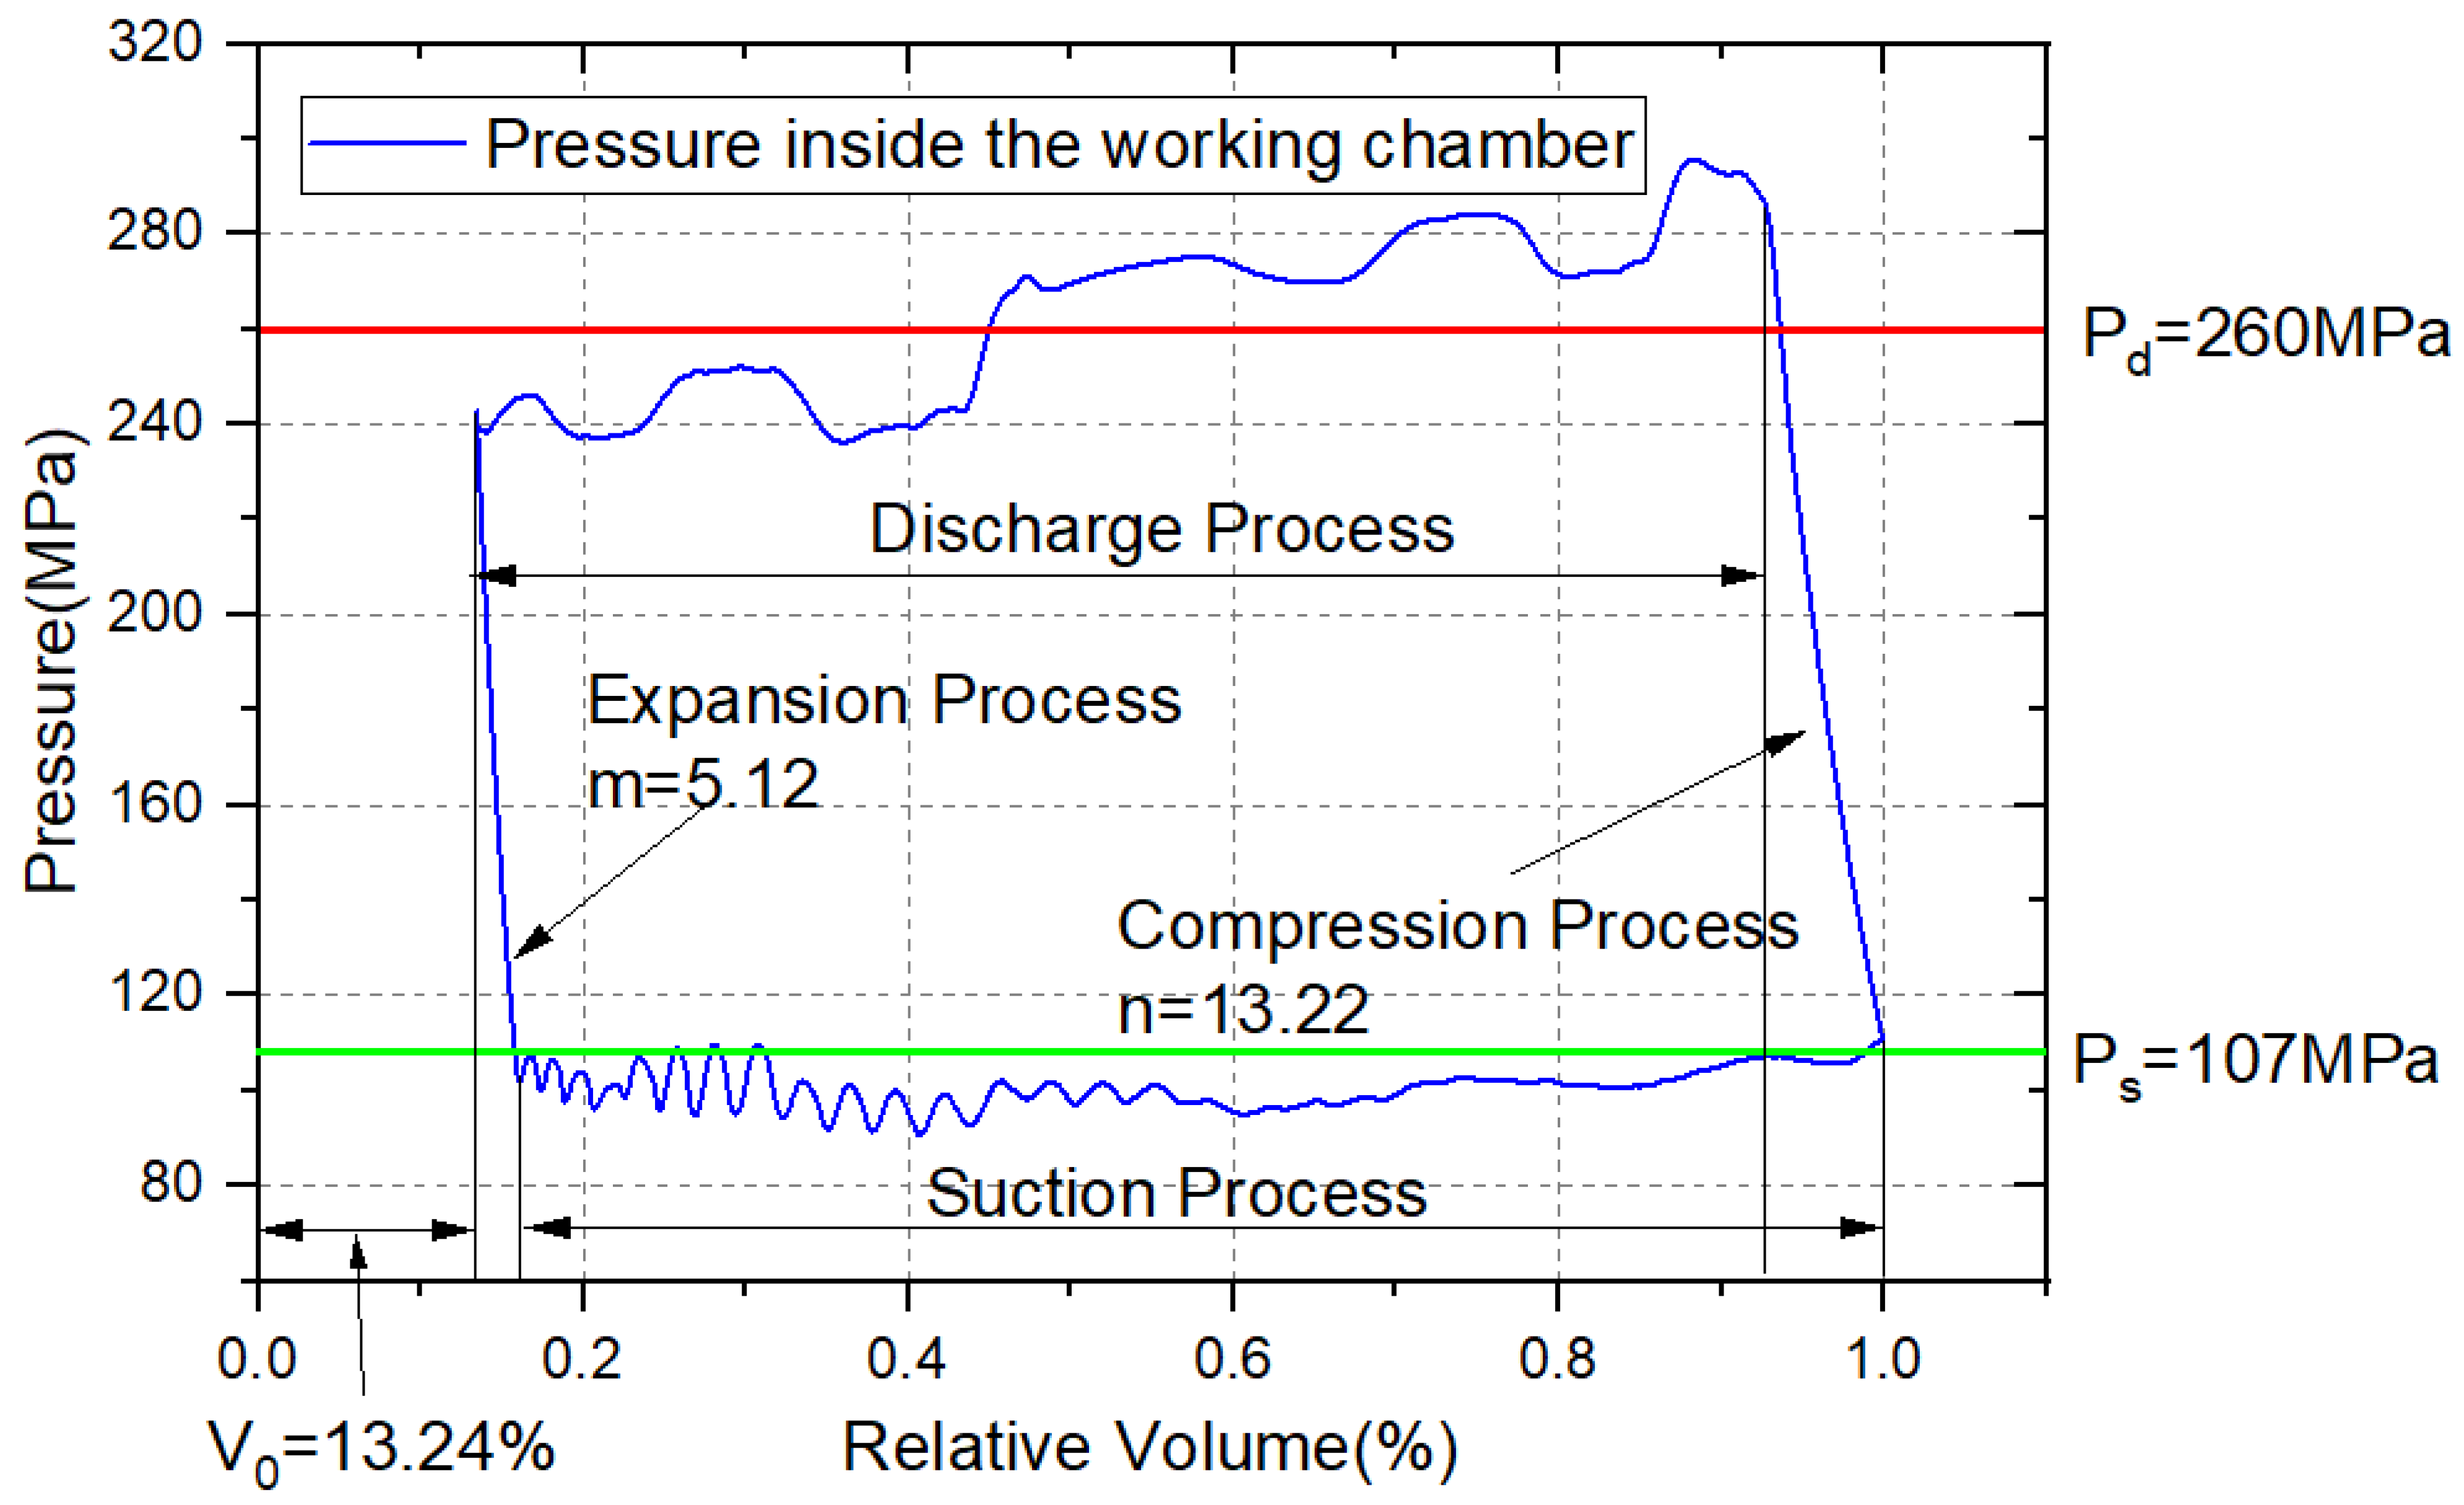
The evolution of the thermodynamic parameters and p-V diagrams of the working processes of the hyper compressor have been discussed, and the exponents of expansion and compression were 5.12 and 13.22;
(3)
The pressure pulsations in the outlet pipeline were 22.07%, 21.15%, 17.81%, 16.43, and 14.74% at five monitored locations. Pressure pulsation before and after the buffer tank in the inlet pipeline was 4.35% and 14.46%;
(4)
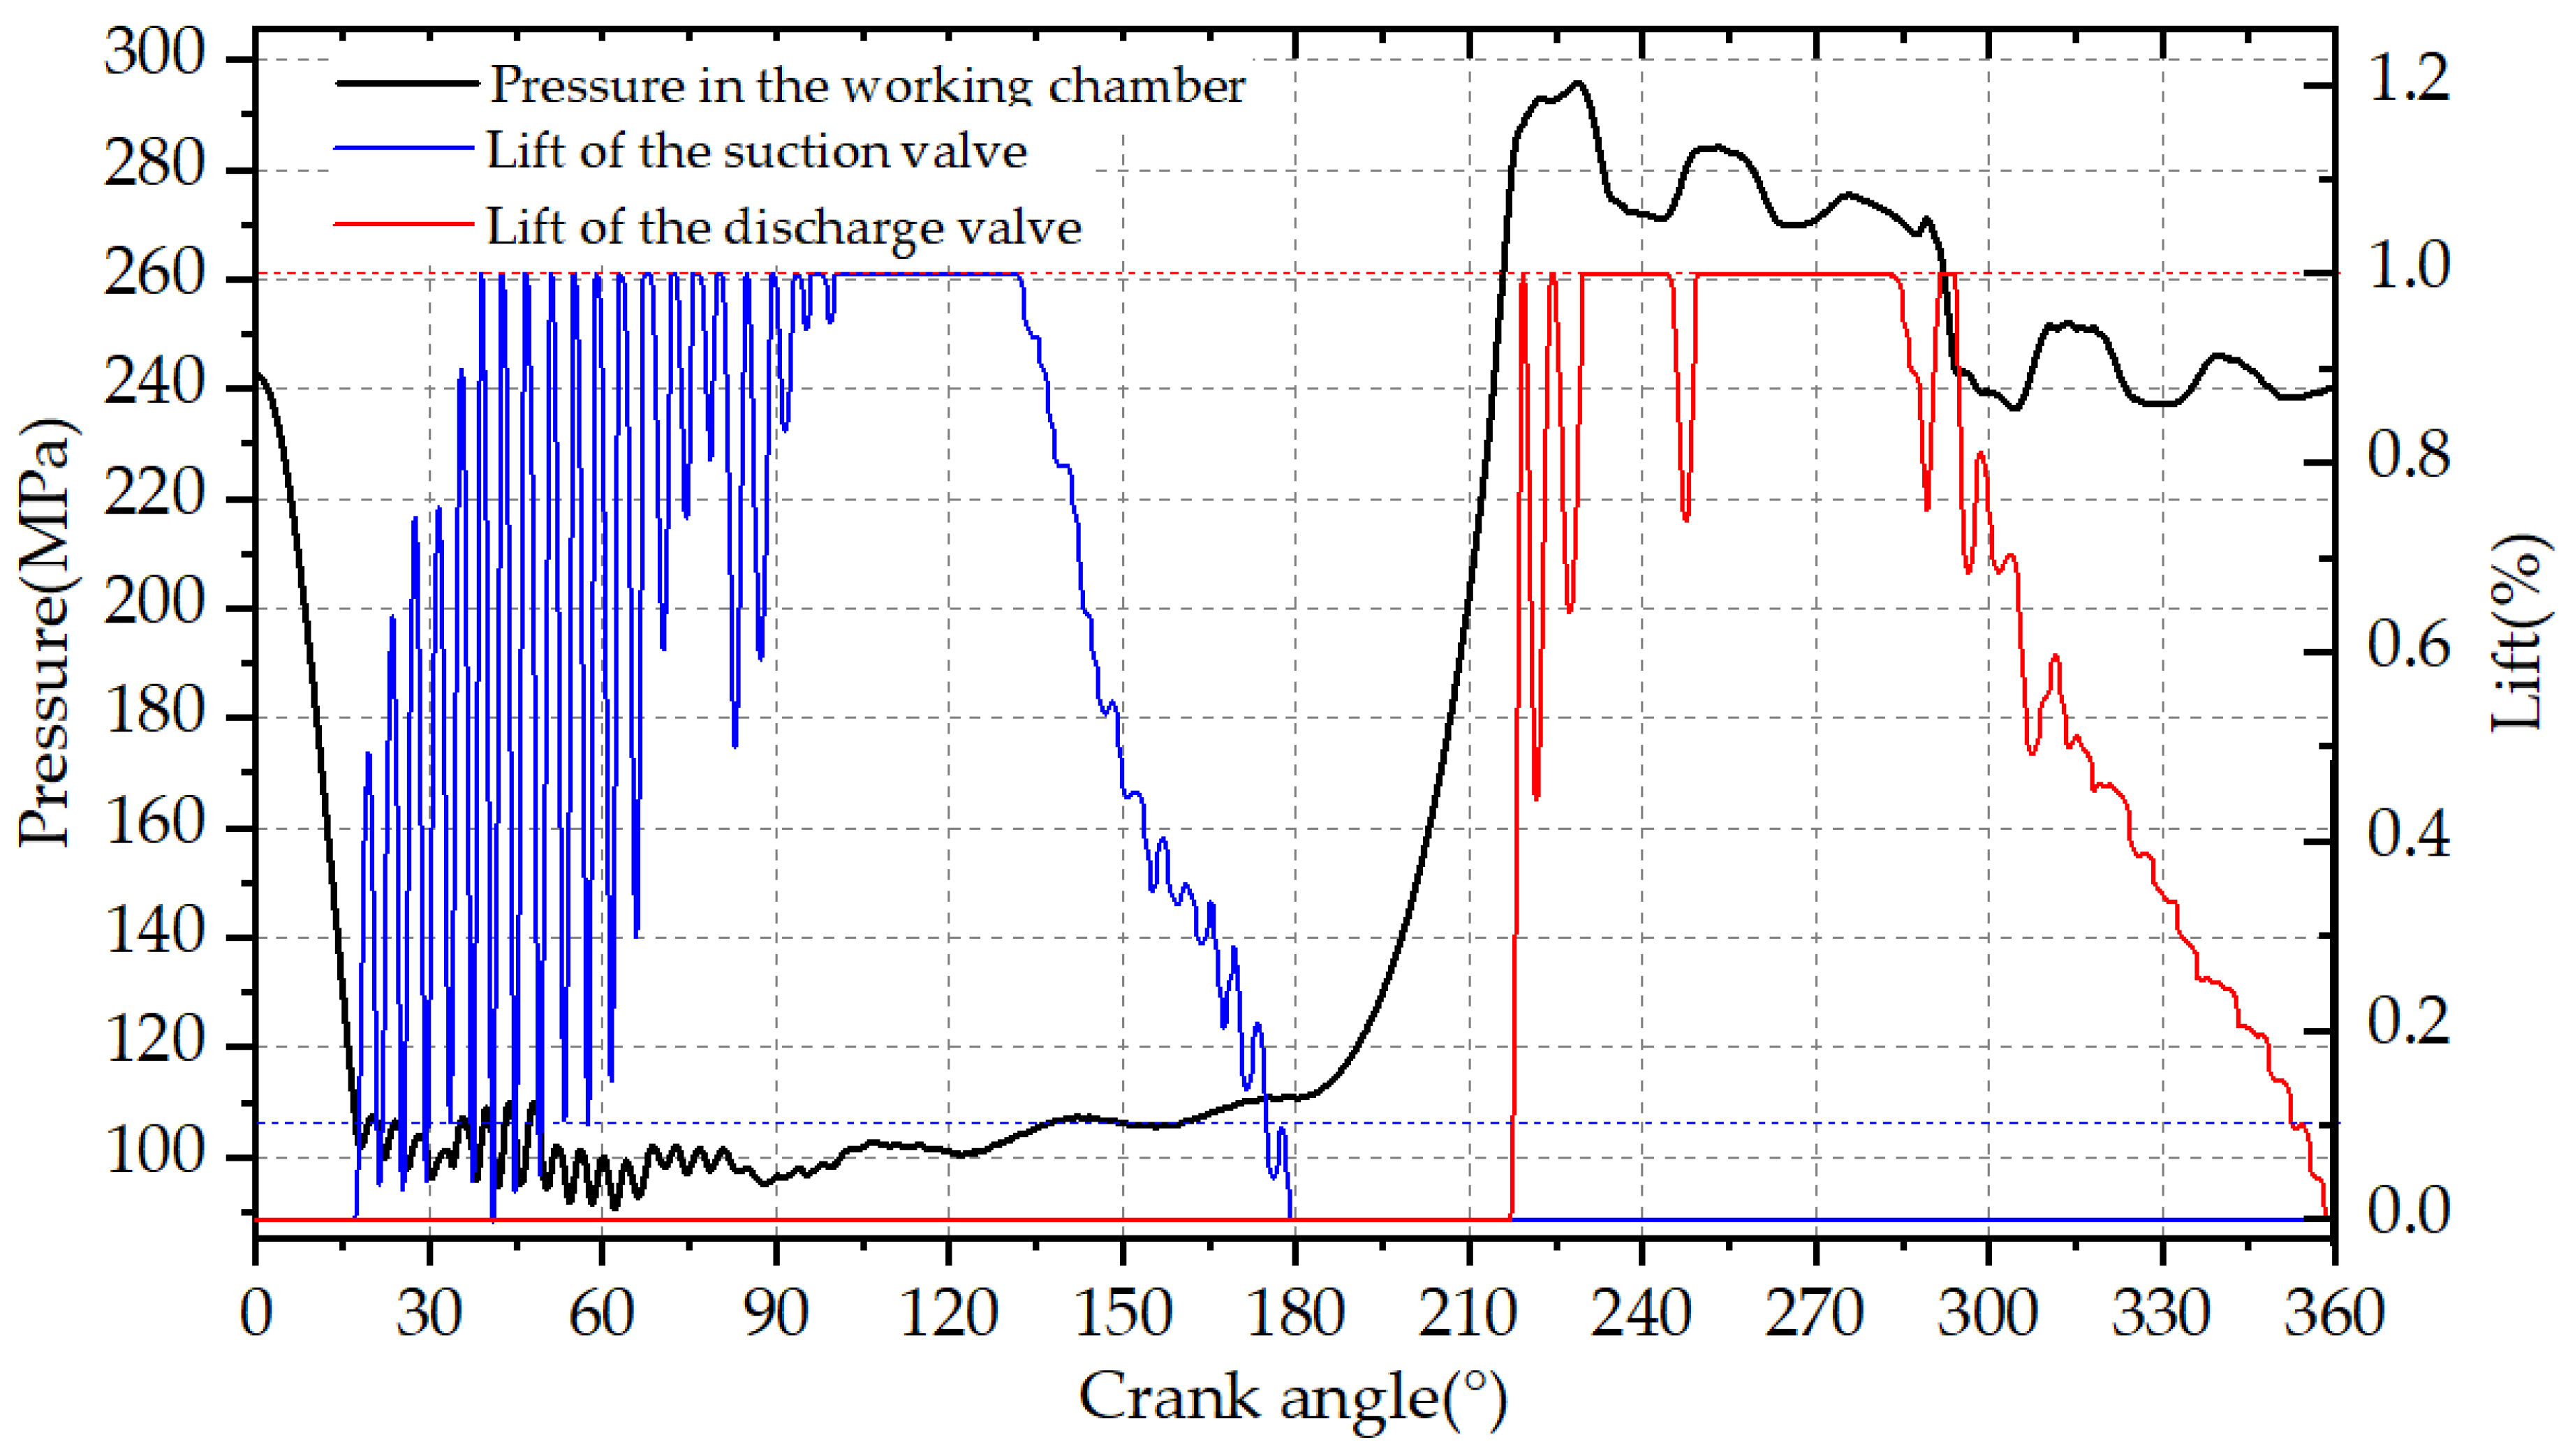
Due to the high incompressibility of the ethylene under ultra-high pressure, severe flutter occurred during the opening process of the suction valve. Special attention should be paid to the structural design of valves used in this situation.

Author Contributions

Conceptualization, B.Z.; funding acquisition, B.Z.; investigation, B.Z., H.W., Y.Z. and X.P.; methodology, B.Z., H.W., Y.Z., X.P. and J.F.; supervision, J.F.; writing—original draft, B.Z. and Y.Z.; writing—review and editing, X.P. and J.F. All authors have read and agreed to the published version of the manuscript.

Funding

This work was supported by the National Natural Science Foundation of China [Grant No. 52106054], and the China Postdoctoral Science Foundation [Grant No. 2018M643639].

Data Availability Statement

Not applicable.

Conflicts of Interest

The authors declare that they have no known competing financial interests or personal relationships that could have appeared to influence the work reported in this paper.

References

  1. Giacomelli, E.; Pratesi, S.; Fani, R.; Gimignani, L. Improving availability of hypercompressors. In Proceedings of the ASME Pressure Vessels and Piping Conference, Vancouver, BC, Canada, 5–9 August 2002; Volume 19477, pp. 71–82. [Google Scholar]
  2. Giacomelli, E.; Battagli, P.; Lumachi, F.; Gimignani, L. Safety Aspects of design of cylinders and hyper-compressors for LDPE. In Proceedings of the ASME Pressure Vessels and Piping Conference, San Diego, CA, USA, 25–29 July 2004; Volume 46687, pp. 63–71. [Google Scholar]
  3. Giacomelli, E.; Fani, R.; Battagli, P.; Pieraccini, M. Experience in Operation and Reconditioning of High Pressure Cylinder Heads for Hypercompressors for LDPE. In Proceedings of the ASME Pressure Vessels and Piping Conference, Vancouver, BC, Canada, 23–27 July 2006; Volume 4756, pp. 57–63. [Google Scholar]
  4. Giacomelli, E.; Passeri, M.; Giusti, S.; Zagli, F.; Generosi, S. Modeling of Pressure Pulsations for LDPE Reciprocating Compressors and Interaction With Mechanical System. In Proceedings of the Engineering Systems Design and Analysis, Manchester, UK, 19–22 July 2004; Volume 41731, pp. 945–952. [Google Scholar]
  5. Lei, D.; Li, X.; Li, Y.; Ren, X. Design of packing cup interference fit value of hypercompressors for low density polyethylene production. Front. Energy 2019, 13, 107–113. [Google Scholar] [CrossRef]
  6. Wang, Y.; Xue, C.; Feng, J.; Peng, X. Experimental investigation on valve impact velocity and inclining motion of a reciprocating compressor. Appl. Therm. Eng. 2013, 61, 149–156. [Google Scholar] [CrossRef]
  7. Zhang, J.; Wang, Y.; Li, X.; Jiang, Z.; Xie, Y.; Zhu, Q. A simulation study on the transient motion of a reciprocating compressor suction valve under complicated conditions. J. Fail. Anal. Prev. 2016, 16, 790–802. [Google Scholar] [CrossRef]
  8. Mu, G.; Wang, F.; Mi, X.; Gao, G. Dynamic modeling and analysis of compressor reed valve based on movement characteristics. Appl. Therm. Eng. 2019, 150, 522–531. [Google Scholar] [CrossRef]
  9. Giacomelli, E.; Falciani, F.; Volterrani, G.; Fani, R.; Galli, L. Simulation of cylinder valves for reciprocating compressors. In Proceedings of the Engineering Systems Design and Analysis, Torino, Italy, 4–7 July 2006; Volume 42487, pp. 949–958. [Google Scholar]
  10. Bianchini, M.; Campo, N.; Francini, S.; Vidyasagar, R. Advances in dynamic analysis for hypercompressor cylinder valves. In Proceedings of the ASME Pressure Vessels and Piping Conference, Chicago, IL, USA, 27–31 July 2008; Volume 48289, pp. 111–121. [Google Scholar]
  11. Giacomelli, E.; Schiavone, M.; Manfrone, F.; Raggi, A. Flow Coefficient Evaluation of Poppet Valves Used in Reciprocating Compressors for LDPE. In Proceedings of the ASME Pressure Vessels and Piping Conference, Chicago, IL, USA, 27–31 July 2008; Volume 48289, pp. 123–129. [Google Scholar]
  12. Bagagli, R.; Campo, N.; Francini, S.; Simpson, K.C.; Morgan, C. Methods for Life Assessment of Hypercompressor Poppet Valves. In Proceedings of the Pressure Vessels and Piping Conference, Bellevue, DC, USA, 18–22 July 2010; Volume 49248, pp. 85–92. [Google Scholar]
  13. Bagagli, R.; Campo, N.; Francini, S.; Simpson, K.C.; Morgan, C. Advances in Hypercompressor Valve and Valve Spring Design. In Proceedings of the Pressure Vessels and Piping Conference, Toronto, ON, Canada, 15–19 July 2012; American Society of Mechanical Engineers: New York, NY, USA, 2012; Volume 55041, pp. 19–26. [Google Scholar]
  14. Maggi, C.; Wojnar, J.; Bagagli, R.; Tognarelli, L. Improved Accuracy on Efficiency of PK Hypercompressor Valves. In Proceedings of the Pressure Vessels and Piping Conference, Anaheim, CA, USA, 20–24 July 2014; American Society of Mechanical Engineers: New York, NY, USA, 2014; Volume 46025, p. V005T05A004. [Google Scholar]
  15. Simpson, K.; Sanford, J.; Finnefrock, L. Redesign of LDPE Secondary Compressor Valves to Better Tolerate Polyethylene Wax Fouling. In Proceedings of the Pressure Vessels and Piping Conference, Vancouver, BC, Canada, 17–21 July 2016; American Society of Mechanical Engineers: New York, NY, USA, 2016; Volume 50411, p. V005T05A004. [Google Scholar]
  16. API 618 STD; Reciprocating Compressors for Petroleum, Chemical, and Gas Industry Services, 5th ed. American Petroleum Institute: Washington, DC, USA, 2011.
  17. Giacomelli, E.; Passeri, M.; Bassani, S.; Zagli, F.; Pieraccini, M. Preliminary Pulsation Analysis for High Pressure Piping Size Evaluation for Hyper-Compressors for LDPE Plants. In Proceedings of the ASME Pressure Vessels and Piping Conference, Vancouver, BC, Canada, 23–27 July 2006; Volume 4756, pp. 65–71. [Google Scholar]
  18. Bai, W.J.; Li, Y.Q.; Duan, Q. Vibration Analysis and Transformation of Hyper Compressor Pipeline for LDPE Plants. In Proceedings of the ASME International Mechanical Engineering Congress and Exposition, San Diego, CA, USA, 15–21 November 2013; American Society of Mechanical Engineers: New York, NY, USA, 2013; Volume 56437, p. V014T15A015. [Google Scholar]
  19. Carcasci, C.; Sacco, M. Preventing Failures In LDPE Plants Caused By Vibrations And Pulsations Of Reciprocating Compressors. In Proceedings of the Abu Dhabi International Petroleum Exhibition & Conference, Abu Dhabi, United Arab Emirates, 15 November 2017. [Google Scholar]
  20. Carcasci, C.; Sacco, M.; Landucci, M.; Fiaschi, M. From Piping Deformation to Pressure Pulsation Measurements to Solve LDPE Plants Vibration Issues. In Proceedings of the Pressure Vessels and Piping Conference, Prague, Czech Republic, 15–20 July 2018; American Society of Mechanical Engineers: New York, NY, USA, 2018; Volume 51661, p. V005T05A003. [Google Scholar]
  21. Fusi, A.; Cappelli, L.; Carcasci, C.; Sacco, M. Tuning of the Acoustical Analysis Model for Hypercompressors Through Strain Gage Pulsation Measurements. In Proceedings of the Pressure Vessels and Piping Conference, San Antonio, TX, USA, 14–19 July 2019; American Society of Mechanical Engineers: New York, NY, USA, 2019; Volume 58967, p. V005T05A008. [Google Scholar]
  22. Wall, C.; Pierce, C.D.; Moin, P. A semi-implicit method for resolution of acoustic waves in low Mach number flows. J. Comput. Phys. 2002, 181, 545–563. [Google Scholar] [CrossRef]
Figure 1. Solid model of the hyper compressor and its pipelines.
Energies 15 04452 g001
Figure 2. Meshes for the hyper compressor and its pipelines.
Energies 15 04452 g002
Figure 3. Meshes for the poppet valve. (a) Poppet valve; (b) meshes for the flow channel.
Energies 15 04452 g003
Figure 4. Monitored pressure in the working chamber (black), inlet pipeline (purple), buffer tank (green), P4 of outlet pipeline (red), and P7 of the outlet pipeline (navy).
Energies 15 04452 g004
Figure 5. p-θ diagrams in the cylinder.
Energies 15 04452 g005
Figure 6. p-V diagrams in the working chamber.
Energies 15 04452 g006
Figure 7. Pressure distribution and evolution during the working process of the hyper compressor.
Energies 15 04452 g007
Figure 8. Velocity streamline distribution and evolution during the working process of the hyper compressor.
Energies 15 04452 g008
Figure 9. Temperature distribution and evolution during the working process of the hyper compressor.
Energies 15 04452 g009
Figure 10. Pressure pulsation in the inlet (a) and outlet (b) pipelines.
Energies 15 04452 g010
Figure 11. Amplitude–frequency curves of the pressure. (a) Amplitude–frequency curves in theinlet pipeline; (b) Amplitude–frequency curves in the outlet pipeline.
Energies 15 04452 g011
Figure 12. Lifts of the poppet valves.
Energies 15 04452 g012
Figure 13. Pressure and velocity distribution during the opening process of the suction valve.
Energies 15 04452 g013
Figure 14. Pressure and velocity distribution during the opening process of the discharge valve.
Energies 15 04452 g014
Table 1. Dimensions of the cylinder and valve.
ItemValueItemValue
Diameter of cylinder (mm)96Stroke (mm)320
D_p (mm)95L_cr (mm)640
D_in (mm)43D_out (mm)43
n (rpm)200λ0.5
Lift (mm)6.0p_l (mm)2
K (N/mm)114C_f0.85
Table 2. Physical and thermal properties of the ethylene.
Temperature
(K)
Pressure
(MPa)
Density
(kg/m3)
Enthalpy
(kJ/kg)
Entropy
(kJ/kg/K)
Cp
(kJ/kg/K)
Sound Speed
(m/s)
Comp. FactorViscosity
(μPa·s)
260.0080.000541.95290.470.691742.22441357.51.9156104.44
260.00300.00646.65554.280.298942.15412070.56.0205156.35
400.0080.000431.62621.541.70572.5260979.141.563467.224
400.00300.00582.01873.981.27812.44361808.44.3480156.00
Publisher’s Note: MDPI stays neutral with regard to jurisdictional claims in published maps and institutional affiliations.

