Abstract
The stringent regulations set by the International Maritime Organization on pollutant emissions combined with the rise in fuel prices have stimulated research on cleaner fuels and new propulsion systems. This study describes a new method for evaluating alternative technologies and cleaner fuels that can be utilised in the marine sector to replace heavy fuel oil and diesel engines, and thus improve their performance while lowering carbon dioxide and nitrogen oxide emissions. The proposed techno-environmental technique allows consistent evaluation of simple intercooler/reheat gas and steam combined cycles fuelled by marine diesel fuel and liquefied natural gas, instead of a two-stroke diesel engine fuelled by marine diesel fuel, as a propulsion system of a large container ship. The implementation of the enhanced combined gas and steam cycles, and combined gas and steam cycles, fuelled by liquefied natural gas, increases the engine’s efficiency by 11% as compared with that of two-stroke diesel engines that run on marine diesel oil, while decreasing carbon dioxide and nitrogen oxide emissions by 44.7% and 76.3%, respectively. In addition, the advantages of using a gas and steam combined cycle to burn LNG over the gas and steam combined cycle for burning marine diesel oil are demonstrated.
1. Introduction
The global economy strongly depends on international shipping and approximately 90% of international cargo is carried by sea [1]. Most cargo is transported worldwide on ships because it is the most effective and reliable method, which necessitates a reduction in the operating costs. One of the main factors considered in the international shipping industry is the fuel cost [2]; however, the situation has recently changed due to the strict regulations on pollutant emissions and the possibility of emission taxation imposed by the International Maritime Organization (IMO). On the 10th of October 2008, the IMO introduced new regulations to reduce emissions from ships; these regulations have been subsequently amended and extended [3]. Marine Pollution (MARPOL) Annex VI has established strict limits on nitrogen oxide and sulphur oxide emissions. Most merchant ships are powered by diesel engines due to their ability to run efficiently on low-cost heavy fuel oil [4]. However, diesel engines fuelled with heavy fuel oil produce relatively high emissions of particulate matter, carbon dioxide, nitrogen oxides, and sulphur oxides, which are subject to strict regulations [5]. Some of these emissions are caused by the engines or fuels that are used. There are two approaches for reducing these harmful emissions: using a cleaner fuel or implementing an engine with higher efficiency. Among these solutions, the combination of a gas and steam turbine, called a gas turbine combined cycle (CCGT), offers a cycle efficiency of up to 60%, which exceeds that of a low-speed diesel engine [6]. The thermal efficiency of the CCGT can be further enhanced by improving the simple gas cycle (upper cycle) or the simple steam cycle (lower cycle). Some components, such as an intercooler, reheater, or these together, can be integrated into a simple gas turbine cycle to enhance the upper cycle’s thermal efficiency. To improve the steam turbine cycle’s efficiency, a double or triple pressure heat recovery steam generator (HRSG) should be employed and the lower cycle needs to be reheated [7]. The banned or unutilised low-cost heavy fuel oil helps eliminate a significant drawback in the CCGT. Therefore, this paper aims to implement CCGT cycles as a viable alternative to the conventional propulsion system through a techno-environmental method and evaluate all propulsion systems of large container ships.
Thus far, only a limited number of studies have implemented the techno-environmental assessments of advanced CCGTs for large container vessel. Therefore, this paper contributes:
- A technical assessment of CCGT cycles, a simple gas steam turbine combined cycle, and an intercooler/reheat gas steam combined cycle with a single heat recovery steam generator fuelled by liquefied natural gas (LNG) and marine diesel oil (MDO) for a large container ship with different international missions. In addition, the paper implements enhanced liquified natural gas cycles with cryogenic properties to enhance CCGT efficiency and evaluates a two-stroke diesel engine fuelled by MDO for the same system.
- A comprehensive environmental evaluation with different international missions to assess the emissions of nitrogen oxide and carbon dioxide from the presented CCGT cycles fuelled by MDO and LNG and a two-stroke diesel engine fuelled by MDO as propulsion systems.
The rest of this paper is organised as follows. The second part defines the methodology utilised in this paper. The third part describes the obtained results and establishes their significance, and the fourth section summarises the conclusions
2. Materials and Methods
The main aim of this paper was to establish a comprehensive method for evaluating the techno-environmental benefits of installing a CCGT instead of a 2-stroke diesel engine on a large container ship fuelled by LNG and MDO. The following assumptions were made in this study:
- The voyages of large container ships are expected to follow straight and direct routes unaffected by weather conditions, physical geographic entities, or calm seas.
- A large container ship is always assumed to maintain an operating speed of 23 knots.
To investigate an alternative solution for ship propulsion systems, a techno-environmental model framework has been developed. This framework (Figure 1) is modular and contains several core models that allow the detailed performance simulation of propulsion systems. The core models are further linked with the Poseidon ship simulator to assess the propulsion system of a large container ship from the technical and environmental viewpoints. The modules used in this study are described in detail in [2,8,9].

Figure 1.
Flow diagram of the methodology used in this study. CCGT: gas and steam combined cycle.
2.1. Core Models
2.1.1. CCGT Model
CCGT performance was simulated using the in-house gas turbine performance evaluation software Turbomatch [10] and MATLAB. A CCGT model was established to assess the engine performance. A single HRSG steam turbine model was established on the optimum steam cycle properties defined in previous studies [11,12]. In the long period, the CCGT cycles benefit from the unique cryogenic qualities of the liquified natural gas applied in this study. It is assumed that LNG is stored as a saturated liquid at atmospheric pressure. The results of this model are described in detail in [13]. The best CCGT propulsion systems were used in this study with comprehensive consideration of the performance and emissions level [13]. Table 1 lists various CCGT engines with fuels that are utilised in each cycle. The enhanced LNG cycle includes advanced NOx abatement technology procured from land-based gas turbines. It also incorporates an air precooling heat exchanger benefitting from the cryogenic properties of the fuel. This enables increased efficiency. Figure 2 shows the heat balance in the air precooling heat exchanger between the LNG and the inlet air in the ELNG cycle.

Table 1.
CCGT engines with different fuels.

Figure 2.
Heat balance in heat exchanger between the inlet air and LNG. 1g: inlet air mass flow temperature to heat exchanger; 2g: outlet air mass flow temperature from superheater stagnation to evaporator; 3g: outlet air mass flow temperature from heat exchanger to gas turbine; A: inlet LNG mass flow temperature to heat exchanger; b: outlet LNG mass flow temperature evaporator stagnation to superheater; c: outlet NG mass flow temperature from heat exchanger to combustion chamber gas turbine.
2.1.2. Two-Stroke Diesel Engine Model
A 2-stroke diesel engine model was constructed using the MATLAB software installed on a reference ship. Engine data were obtained from Hyundai–MAN B&W [14]. The most critical objective of this model was to design and investigate the performance (thermal efficiency) of a 2-stroke diesel engine during different journeys fuelled by MDO, which was employed as the propulsion system of a large container ship. The diesel engine model was used as the baseline scenario and verified against the ship’s fuel consumption.
2.2. Poseidon Ship Simulator
The Poseidon ship simulator is described in detail in [2,8,9]. It is divided into five subroutines that balance the power available from propulsion machinery and the power required by the aerodynamic and hydrodynamic resistance of the vessel. The total resistance calculation allows to estimate the required power from the propulsion system to maintain the established velocity of the vessel. The resistance model enables determination of the propulsive power of a ship using the method developed by Holtrop and Mennen [15]. The aerodynamic resistance (wind resistance of the upper body) of the ship was simulated by employing the approach developed in [16]. Note that the Poseidon ship simulator did not take into consideration the hydrodynamic resistance impacts of shallow water and cavitation of propeller. This case study simulated container ships in an open sea with different prime movers, such as the two-stroke diesel engine and various CCGT engines on different journeys (Figure 3A,B) [17]. The first journey was from the port of Shanghai, China, to Los Angeles, USA, with a distance of 5708 nautical miles (Nm). The second journey was from Shanghai, China, to Hamburg, Germany, with a distance of 10,778 Nm. The journey climate included three seasons (winter, summer, and midseason); the winter and summer seasons had 82.5 d, the midseason had 165 d, and the day in each season contained 24 h. The climate weather for each journey was selected based on the midpoint city weather between the two ports predicted using publicly available data [18]. Midway Island is the midpoint between Los Angeles (USA) and Shanghai (China) on the first journey. The second journey between Shanghai (China) and Hamburg (Germany) included four midpoint cities: Vietnam, Sri Lanka, Crete Island (Greece), and Ushant Island (France) for a more accurate weather forecast.
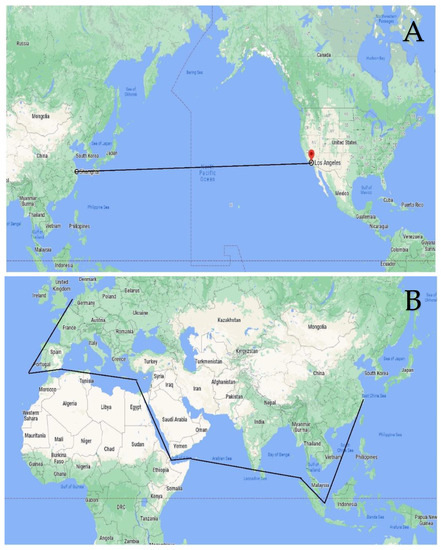
Figure 3.
(A) The first journey route Shanghai, China, to Los Angeles, USA; (B) the second journey was from Shanghai, China, to Hamburg, Germany.
2.3. Environmental Model
Two different factors can be used to assess emissions levels: engine power and fuel consumption [19]. In this study, emissions were determined from the fuel consumption as follows
where E is the total emission (tonnes/h), FC is the consumption fuel (tonnes/h), EF is the emissions factors (kg/tonnes), I is the emission types, j is the engine types (gas turbine, steam turbine, or 2-stroke diesel engine), and is the types of fuel (LNG or MDO).
To calculate the NOx emission scale factor, the following equation was used [20]
where is the emissions factor (g/kWI), i is the engine types, k is the emission types, is the concentration of gaseous species (ppm), P is the pressure (N/m2), V is the engine exhaust flow rate (m3/h), R is the ideal constant gas (J/mol·K), T is the exhaust gas temperature (K), MW is the molecular weight (g/mol), and PP is the engine power (kW).
To calculate the CO2 emission per kilogram of fuel, the following equation was applied [21]
where is the carbon content in the fuel, and is the fuel type.
3. Results
3.1. Assumptions, Simulation, and Validation
In this study we assumed calm sea and air, and thus, the wind resistance only dealt with the drag caused by the speed. A large container ship (CSCL Globe Container Ship) with the main parameters based on published data (Table 2) was used in this study [22]. The baseline vessel was powered by a two-stroke diesel engine (MAN B&W K98ME7.1-TII marine two-stroke diesel engine) with a speed of 23 knots.
Table 2.
Main ship parameters.
The two-stroke diesel engine model was inspired by a MAN B&W K98ME7.1-TII marine two-stroke diesel engine. Its main parameters derived from published data are listed in Table 3 [14].
Table 3.
Two-stroke diesel engine parameters.
Table 4 shows the deviations between the simulation data and the actual values of the marine two-stroke diesel engine.
Table 4.
Simulation data and actual parameters of the 2-stroke diesel engine model.
3.2. Route Analysis
The performance of the large container ships on different voyages between the selected ports was assessed over a period of one year (Table 5). Maximum ship utilisation was assumed. Therefore, the estimated time required to maintain, unload, and load the ship was one day per ship’s journey. The ship was assumed to operate 330 d per year [2]. The climate of the journey included three seasons (winter, summer, and midseason); the winter and summer seasons had 82.5 d; the midseason had 165 d. The numbers of journeys per year and per each season were estimated, assuming continuous operation of the large container ship on a given route, and are listed in Table 5.
Table 5.
Numbers of journeys per year and per each season.
The ambient temperature during each season determined for routes 1 and 2 are shown in Figure 4 and Figure 5, respectively.
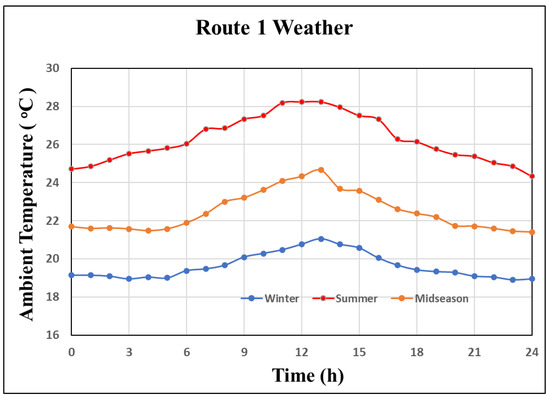
Figure 4.
Ambient temperature of all seasons for the first journey route Shanghai, China, to Los Angeles, USA.
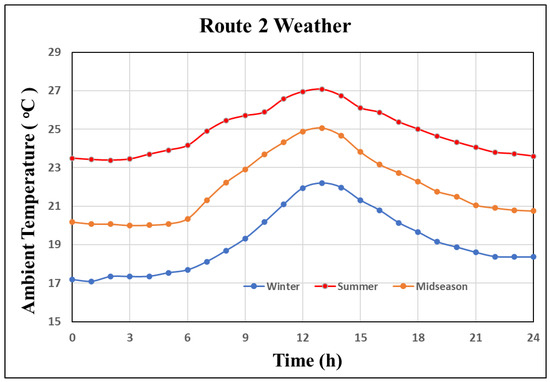
Figure 5.
Ambient temperature of all seasons for the second journey from Shanghai, China, to Hamburg, Germany.
3.3. Technical Evaluation
Figure 6 and Figure 7 display the thermal efficiencies of the propulsion systems of the large container ships plotted for all cycles against the journey times of routes 1 and 2 for all seasons. They show that the efficiency of the I/R ELNG CCGT cycle exceeds those of the CCGT cycles fuelled by LNG and MDO in all seasons by approximately 1% and 2%, respectively, due to the lower inlet temperature, which increased the air density and thus the turbine output. The higher calorific value of natural gas as compared with that of diesel oil, reduces the amount of fuel needed to produce the same heat output; therefore, the fuel efficiency of natural gas is higher than that of MDO in all CCGT cycles. The efficiency of LNG in all CCGT cycles was approximately 1% higher than that of MDO fuel. The maximum efficiency of the CCGT cycles was approximately 11% higher than the two-stroke diesel engine, and the minimum efficiency value was approximately 4% higher than two-stroke diesel engine due to the low specific fuel consumption of CCGT. The winter season demonstrated the highest efficiency because the power output depended on the air mass flow. The hot air was less dense than cold air, which reduced the power output. In addition, warm air requires more energy to compress than cold air, which increases the work performed by the compressor and internal energy losses. The ambient conditions of routes 1 and 2 were different, and route 1 was more energy efficient than route 2.
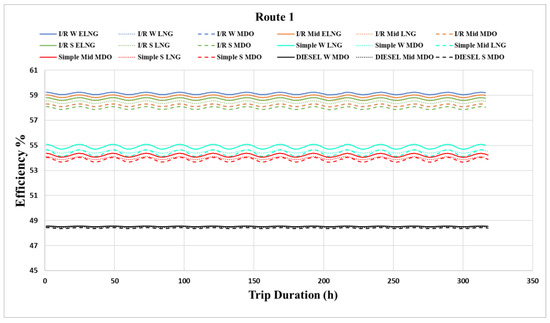
Figure 6.
Performance of various propulsion systems of the large container ship travelling between Shanghai and Los Angeles. I/R: intercooler/reheater CCGT; S: simple CCGT; Diesel: two-stroke diesel engine; W: winter; Mid: midseason; S: summer season; ELNG: enhanced liquified natural gas; MDO: marine diesel fuel; LNG: liquified natural gas.
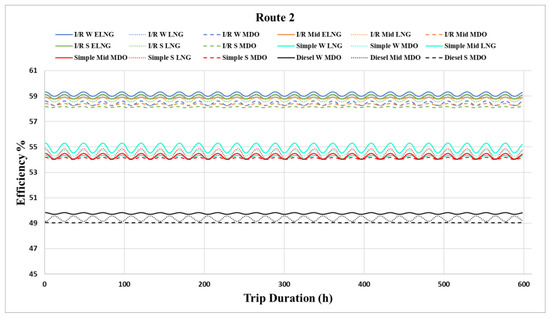
Figure 7.
Performance of various propulsion systems of the large container ship travelling between Shanghai and Hamburg. I/R: intercooler/reheater CCGT; S: simple CCGT; Diesel: two-stroke diesel engine; W: winter; Mid: midseason; S: summer season; ELNG: enhanced liquified natural gas; MDO: marine diesel fuel; LNG: liquified natural gas.
3.4. Environmental Results
As mentioned earlier, only CO2 and NOx emissions were considered in this study. The CCGT was assumed to burn MDO and LNG while the two-stroke diesel engine was fuelled by MDO. The NOx emissions from the two-stroke diesel engine were predicted based on the publicly available MDO data, and were in the range 5.7–14.8 g/kW·h [19,23,24,25,26,27,28]. The ELNG CCGT cycle allows the use of a dry low-NOx combustor [29] that produces very low NOx emissions, as demonstrated by the natural gas-fuelled land-based gas turbines [30]. The NOx concentrations of the ELNG, LNG, and MDO fuels utilised in this study were taken from [30,31,32]. The molecular weights of LNG and MDO were determined from previously published data [31,33]. The CO2 emissions depend on the fuel consumption and carbon concentration in the fuel. The CO2 fuel content was obtained from [34]. Table 6 show the theoretical parameters of each fuel.
Table 6.
Theoretical parameters of different propulsion systems and fuels.
Figure 8, Figure 9, Figure 10 and Figure 11 show the environmental CO2 and NOx emissions generated during the ship’s operation for one year on the three-season routes. It was found that CCGT emitted less NOx and CO2 than the two-stroke diesel engine because of the lower CCGT fuel consumption caused by its higher efficiency. The NOx emissions from routes 1 and 2 produced during different seasons (winter, summer, and midseason) are displayed in Figure 8 and Figure 9, respectively. They show the NOx levels emitted per hour during a single trip in different seasons by the different propulsion systems of the large container ships. The results indicate that the CCGT NOx emissions are significantly lower than those of the diesel engine because CCGT operated at lower and more homogeneous temperatures. Indeed, CCGT utilises a steady combustion process that allows better NOx emission control as compared with that of a two-stroke diesel engine, where the peak temperatures generated during the discontinuous process trigger the formation of thermal NOx species. As a result, the difference between the NOx emissions of the I/R ELNG CCGT cycles and two-stroke diesel engine fuelled by MDO was approximately 76.3%. In addition, the NOx emissions of the I/R and simple CCGT cycles fuelled by LNG were lower than the MDO-fuelled two-stroke diesel engine by 73.6% and 31.5%, respectively. The NOx emissions of the I/R and simple CCGT cycles fuelled by MDO were lower than the MDO-fuelled two-stroke diesel engine by 68.4% and 10.5%, respectively. Moreover, the NOx emissions of the I/R ELNG CCGT cycles were lower than those of the LNG-fuelled I/R and simple CCGT cycles by 3.3% and 57.6%, respectively. Finally, the NOx emissions of the I/R ELNG CCGT cycles were lower than those of the MDO-fuelled I/R and simple CCGT cycles by 8.4% and 67.3%, respectively.
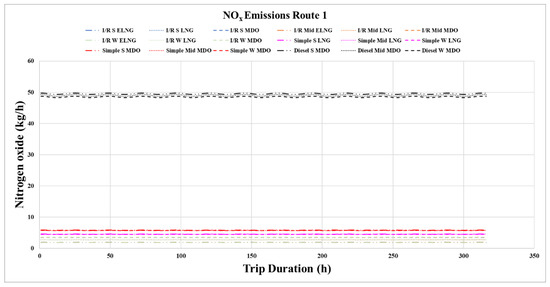
Figure 8.
NOx emissions of various propulsion systems of the large container ship travelling between Shanghai and Los Angeles. I/R: intercooler/reheater CCGT; R: reheater CCGT; S simple CCGT; Diesel: two-stroke diesel engine; W: winter; Mid: midseason; S: summer.
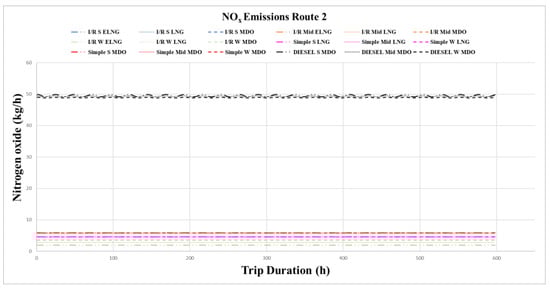
Figure 9.
NOx emissions of various propulsion systems of the large container ship travelling between Shanghai and Hamburg. I/R: intercooler/reheater CCGT; R: reheater CCGT; S simple CCGT; Diesel: two-stroke diesel engine; W: winter; Mid: midseason; S: summer.
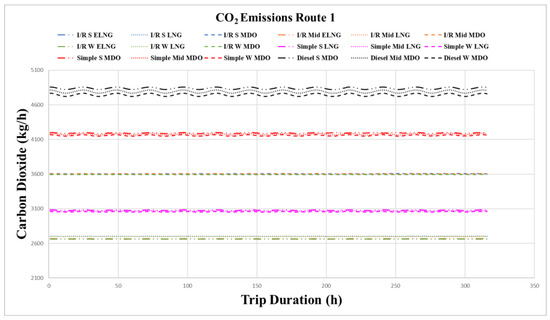
Figure 10.
CO2 emissions of various propulsion systems of the large container ship travelling between Shanghai and Los Angeles. I/R: intercooler/reheater CCGT; R: reheater CCGT; S simple CCGT; Diesel: two-stroke diesel engine; W: winter; Mid: midseason; S: summer.

Figure 11.
CO2 emissions of various propulsion systems of the large container ship travelling between Shanghai and Hamburg. I/R: intercooler/reheater CCGT; R: reheater CCGT; S simple CCGT; Diesel: two-stroke diesel engine; W: winter; Mid: midseason; S: summer.
Figure 10 and Figure 11 display the amounts of CO2 emitted per hour during a single trip with different seasons determined for various propulsion systems of the large container ships. Owing to the higher efficiency of CCGT, the difference between the CO2 emissions of the I/R ELNG CCGT cycles and two-stroke diesel engine fuelled with MDO was approximately 44.7%. In addition, the CO2 emissions of the I/R and simple CCGT cycles fuelled by LNG were lower than the MDO-fuelled two-stroke diesel engine by 43.7% and 35.41%, respectively. The CO2 emissions of the I/R ELNG CCGT cycles were lower than the LNG-fuelled I/R and simple CCGT cycles by approximately 2%, and 14.5%, respectively. Furthermore, the CO2 emissions of the MDO-fuelled I/R and simple CCGT cycles were lower than the two-stroke diesel engine by 25% and 12.5%, respectively. Finally, the CO2 emissions of the I/R ELNG CCGT cycles were lower than the MDO-fuelled I/R and simple CCGT cycles by 26.3% and 36.9%, respectively.
4. Conclusions
A techno-environmental assessment methodology was utilised to evaluate the performance and CO2 and NOX emissions of CCGT cycles, which could potentially replace the two-stroke diesel engine as a propulsion system of large container ships. The simple and intercooler/reheater ELNG and CCGT systems were fuelled by LNG and MDO, while the two-stroke diesel engine propulsion systems were fuelled by MDO. The findings of this study are very promising from the techno-environmental perspective and the utilised methodology can be potentially used for engine selection. The obtained results can be summarised as follows:
- Two international routes were investigated. The ambient conditions of the specific environmental regions in which the ships were operating were used as the simulation environments. For these specific simulated routes, the overall performance and emissions of the CCGT cycles were very promising.
- Fuelling CCGT cycles with MDO was undesirable.
- Although the simulated journeys were assumed to be direct routes, the stability of the ships was not considered. The obtained results indicated that the implementation of the ELNG-fuelled and LNG-fuelled CCGT cycles on large container ships could increase the fuel efficiency by 11% as compared with that of the MDO-fuelled two-stroke diesel engine, while the observed reductions in the CO2 and NOx emission levels amounted to 44.7% and 76.3%, respectively.
Finally, the evaluation procedure used in this work confirmed that the techno-environmental assessment employed in the marine sector was a highly effective tool for comparing and choosing between multiple technologies.
Author Contributions
A.M.T.A.: Conceptualisation, data curation, formal analysis, funding acquisition, investigation, methodology, project administration and resources. A.B.: software assistance. S.S.: supervision. P.P.: supervision. All authors have read and agreed to the published version of the manuscript.
Funding
This study received no external funding.
Institutional Review Board Statement
Not applicable.
Informed Consent Statement
Not applicable.
Data Availability Statement
Not applicable.
Acknowledgments
The authors are grateful to the Government of the State of Kuwait and the Public Authority for Applied Education and Training (PAAET) for their provisions and financial support.
Conflicts of Interest
The authors declare no conflict of interest.
References
- International Chamber of Shipping, RICARDO. A Zero Emission Blueprint for Shipping. 2021. Available online: https://www.ics-shipping.org/wp-content/uploads/2021/11/A-zero-emission-blueprint-for-shipping.pdf (accessed on 1 January 2022).
- Talluri, L.; Nalianda, D.K.; Giuliani, E. Techno economic and environmental assessment of Flettner rotors for marine propulsion. Ocean Eng. 2018, 154, 1–15. [Google Scholar] [CrossRef] [Green Version]
- International Marine Organization. Revised MARPOL Annex VI: Regulations for the Prevention of Air Pollution from Ships and NOx Technical Code 2008; IMO Publishing: London, UK, 2009. [Google Scholar]
- Shu, G.; Liang, Y.; Wei, H.; Tian, H.; Zhao, J.; Liu, L. A review of waste heat recovery on two-stroke IC engine aboard ships. Renew. Sust. Energ. Rev. 2013, 19, 385–401. [Google Scholar] [CrossRef]
- Kumar, J.; Kumpulainen, L.; Kauhaniemi, K. Technical design aspects of harbour area grid for shore to ship power: State of the art and future solutions. Int. J. Electr. Power Energy Syst. 2019, 104, 840–852. [Google Scholar] [CrossRef]
- Wiggins, E.G. COGAS propulsion for LNG ships. J. Mar. Sci. Appl. 2011, 10, 175–183. [Google Scholar] [CrossRef]
- Tanuma, T. Advances in Steam Turbines for Modern Power Plants; Woodhead Publishing: Sawston, UK, 2016. [Google Scholar]
- Talluri, L.; Nalianda, D.K.; Kyprianidis, K.G.; Nikolaidis, T.; Pilidis, P. Techno economic and environmental assessment of wind assisted marine propulsion systems. Ocean Eng. 2016, 121, 301–311. [Google Scholar] [CrossRef] [Green Version]
- Doulgeris, G.; Korakianitis, T.; Pilidis, P.; Tsoudis, E. Techno-economic and environmental risk analysis for advanced marine propulsion systems. Appl. Energy 2012, 99, 1–12. [Google Scholar] [CrossRef]
- Nikolaidis, T. The Turbomatch Scheme for Aero/Industrial Gas Turbine Engine. In The Turbomatch Manual; Cranfield University: Crabfield, UK, 2015. [Google Scholar]
- Altosole, M.; Benvenuto, G.; Campora, U.; Laviola, M.; Trucco, A. Waste heat recovery from marine gas turbines and diesel engines. Energies 2017, 10, 718. [Google Scholar] [CrossRef] [Green Version]
- Ebi, K.L.; Hallegatte, S.; Kram, T.; Arnell, N.W.; Carter, T.R.; Edmonds, J.; Kriegler, E.; Mathur, R.; O’Neill, B.C.; Riahi, K.; et al. A new scenario framework for climate change research: Background, process, and future directions. Clim. Change 2014, 122, 363–372. [Google Scholar] [CrossRef] [Green Version]
- Alzayedi, A.M.T.; Suresh Sampath, P.P. Techno-Environmental Evaluation of a Liquefied Natural Gas-Fuelled Combined Gas Turbine with Steam Cycles for Large Container Ship Propulsion Systems. Energies 2022, 15, 1764. [Google Scholar] [CrossRef]
- Guide, P.; Controlled, E. MAN B & W K98ME7 1-TII; MAN Diesel & Turbo: Augsburg, Germany, 2014. [Google Scholar]
- Birk, L. Holtrop and Mennen’s Method. Fundam. Ship Hydrodyn. 2019, 29, 611–627. [Google Scholar] [CrossRef]
- Schneekluth, H.; Bertram, V.; Boston, P.-O.; Melbourne New, J.; Singapore, D. Ship Design for Efficiency and Economy, 2nd ed.; Butterworth-Heinemann: Oxford, UK, 1998. [Google Scholar]
- World Map—Worldometer. Available online: https://www.worldometers.info/world-map/ (accessed on 1 February 2022).
- Available online: https://www.timeanddate.com/ (accessed on 1 February 2022).
- Trozzi, C. Emission Estimate Methodology for Maritime Navigation: 6. 2010. Available online: http://www.epa.gov/ttnchie1/conference/ei19/session10/trozzi.pdf (accessed on 1 February 2022).
- Campaign, O.M.; Port, T.; Clearances, S.; Campaign, P.; Emission, M.; Campaign, M. Development of a Methodology to Measure and Assess Ship Emissions Theme Theme 2—Marine Environmental Issues; International Association of Maritime Universities (IAMU): Tokyo, Japan, 2016. [Google Scholar]
- Coşofreţ, D.; Bunea, M.; Popa, C. The Computing Methods for CO2 Emissions in Maritime Transports. Int. Conf. Knowl. -Based Organ. 2016, 22, 622–627. [Google Scholar] [CrossRef] [Green Version]
- CSCL East China Sea, Container Ship, IMO 9645918|Vessel Details|BalticShipping.com. Available online: https://www.balticshipping.com/vessel/imo/964591 (accessed on 1 February 2022).
- IVL, C. Methodology for Calculating Emissions from Ships: 2. Emission Factors for 2004 Reporting; Swedish Environmental Protection Agency: Norrköping, Sweden, 2004; p. 11.
- ENTEC. Ship Emissions Final Report—Quantification of Ship Emissions. Ship Emissions Final Report. July 2002, pp. 3–48. Available online: http://ec.europa.eu/environment/air/pdf/chapter2_ship_emissions.pdf (accessed on 1 March 2022).
- Ammar, N.R. Environmental and cost-effectiveness comparison of dual fuel propulsion options for emissions reduction onboard lng carriers. Brodogradnja 2019, 70, 61–77. [Google Scholar] [CrossRef]
- Furqon Rochyana, M.; Yamin Jinca, M.; Siahaya, J. MDO and LNG as Fuels (Duel Fuel) to Support Sustainable Maritime Transport (a Case Study in KM Ciremai). Int. J. Eng. Sci. (IRJES) 2014, 3, 32–38. [Google Scholar]
- Fernández, I.A.; Gómez, M.R.; Gómez, J.R.; Insua, Á.B. Review of propulsion systems on LNG carriers. Renew. Sustain. Energy Rev. 2017, 67, 1395–1411. [Google Scholar] [CrossRef]
- Gilbert, P.; Walsh, C.; Traut, M.; Kesieme, U.; Pazouki, K.; Murphy, A. Assessment of full life-cycle air emissions of alternative shipping fuels. J. Clean. Prod. 2018, 172, 855–866. [Google Scholar] [CrossRef]
- Klassen, M. Fuel Flexibility for Dry Low Emission Gas Turbines—Cleanly Burning Biofuels, Coal Liquids and Petroleum Fuels. In Proceedings of the Power Gen International Conference, New Orleans, LA, USA, 10–14 December 2007. [Google Scholar]
- Willis, J.D.; Toon, I.J.; Schweiger, T.; Owen, D.A. Industrial RB211 DRY low emission combustion. In Proceedings of the ASME 1993 International Gas Turbine and Aeroengine Congress and Exposition, Cincinnati, OH, USA, 24–27 May 1993. [Google Scholar] [CrossRef] [Green Version]
- Gas Turbine Engines RB211—Rolls Royce—PDF Catalogs|Technical Documentation|Brochure. Available online: https://pdf.directindustry.com/pdf/rolls-royce/gas-turbine-engines-rb211/22649-86918.html (accessed on 1 March 2022).
- Kadhim, N.S. Study the Effect of Blending Kerosene with Diesel Fuel on the Performance and Emissions of Diesel Engine. Int. J. Eng. Sci. Res. Technol. 2015, 772–776. Available online: http://citeseerx.ist.psu.edu/viewdoc/summary?doi=10.1.1.695.4864 (accessed on 1 March 2022).
- Molecular Masses Table of Common Gases. Available online: https://powderprocess.net/Tools_html/Data_Diagrams/Tools_Molecular_weight.html (accessed on 1 March 2022).
- Herdzik, J. Decarbonization of marine fuels—The future of shipping. Energies 2021, 14, 4311. [Google Scholar] [CrossRef]
Publisher’s Note: MDPI stays neutral with regard to jurisdictional claims in published maps and institutional affiliations. |
© 2022 by the authors. Licensee MDPI, Basel, Switzerland. This article is an open access article distributed under the terms and conditions of the Creative Commons Attribution (CC BY) license (https://creativecommons.org/licenses/by/4.0/).