1. Introduction
The world’s energy sector is currently in a highly sensitive and volatile situation owing to the impact of the COVID-19 pandemic, high price volatility and the development of green energy [
1]. Oil and gas continue to dominate in the energy balance (about 31% and 25% in 2020, respectively) [
2]. According to expert assessment, global oil demand will level off approximately by 2030 [
3]; the share of natural gas will increase due to its environmental and cost index [
4]. Despite the declining interest in hydrocarbon resources, the share of offshore fields is only growing with each passing year. In contrast to the onshore fields, these fields have excellent geological structure, reservoir porosity and permeability, and physical/chemical properties of the formation fluids. However, they require large amounts of capital in technology because of the complicated operating and development conditions. About 35% of oil reserves and 29% of natural gas reserves are concentrated on the territory of the world’s continental shelf. The total hydrocarbon potential is about 264 billion tons of oil equivalent [
5].
The Johan Sverdrup field includes production licenses 265, 501, 501B and 502 and belongs to Equinor Petroleum AS, Petoro AS, Lundin Norway AS, Aker BP ASA and Total E&P Norge AS. The total resource potential of the entire field is estimated as 609.00 million m
3 of oil and 22.41 billion m
3 of oil-dissolved gas, of which 408.81 million m
3 of oil and 10.24 billion m
3 of gas are recoverable, according to Equinor assessment [
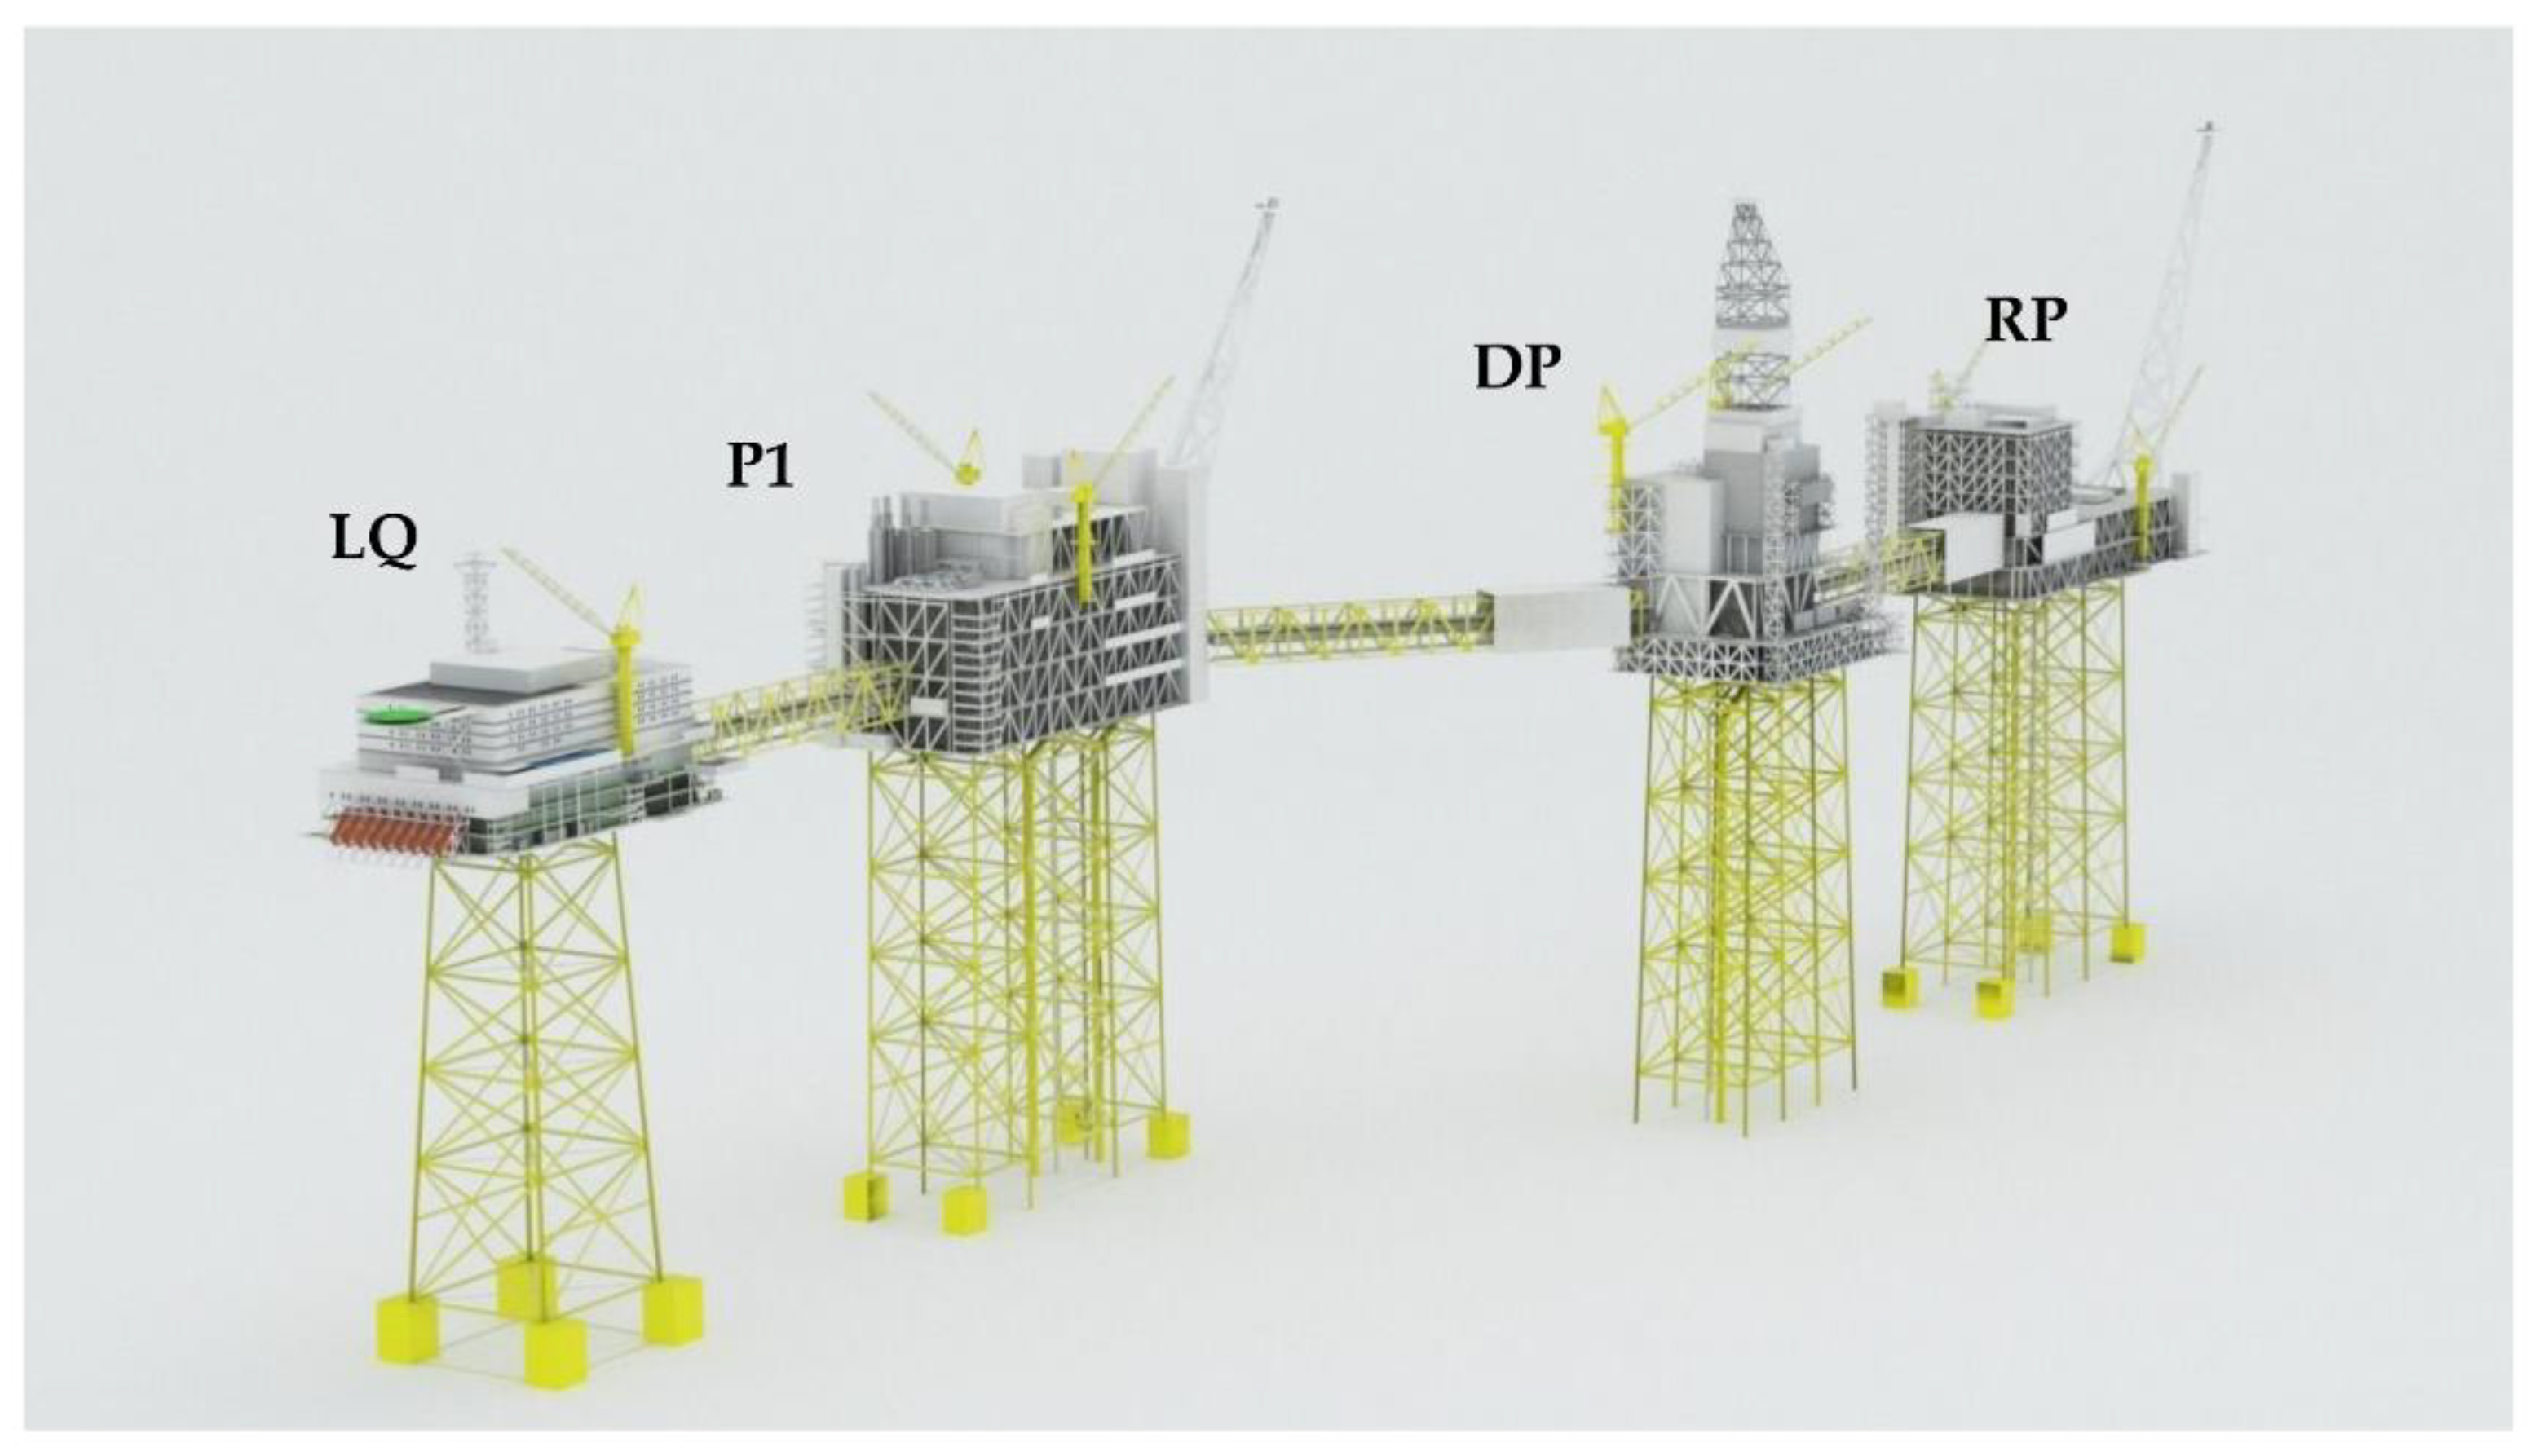
6]. The reserves were discovered by exploration well 16/2–6 in 2010. The Johan Sverdrup field is going to be developed in several stages (presumably four phases). To date, only the first phase, which includes the development of the field central section, is implemented. The central section of the Johan Sverdrup field consists of a processing platform (P1), a drilling platform (DP), a riser platform (RP) and a living platform (LQ) (
Figure 1). All platforms are connected by steel bridges 80–120 m long. It should be noted that the launch of the second phase is scheduled for 2022. This phase includes the completion of the central section development and the introduction of the Avaldsnes area development [
7].
This article aims to develop universal criteria and a mathematical model for determining a cost-effective offshore field facilities system on the example of the Avaldsnes section of the Johan Sverdrup field in the North Sea. Despite the high capital intensity of developing offshore hydrocarbon fields, the market value of these reserves is quite high. It is reasonable to assume that the engineering of an optimal offshore field infrastructure system will be of great interest to oil and gas companies.
2. Materials and Methods
The choice of an offshore field facilities system represents the selection of offshore oil and gas structures that ensure the operation of the field throughout its entire lifespan. The offshore field facilities system is divided into the following types [
8]:
Overground building (drilling directional wells from the shore, backfilling the seabed (production soil and ice islands) and draining the seabed in the oil and gas property);
Overwater building (well-drilling, crude-oil or gas production, handling of production, oil or gas storage, product shipment and other operations are performed on offshore platforms: floating platforms, fixed platforms, production ship);
Underwater building (well-drilling from floating drilling rigs with underwater wellhead completion and placement of oil and gas production, well-stream gathering, handling of production and transport facilities on the seabed);
Underground building (shaft method);
Combined system of buildings.
Recently, many researchers have made attempts to systematize and classify technical equipment and facilities involved in the development of offshore oil and gas fields. According to one of the current classifications, offshore oil and gas production can be performed in the following ways [
9]:
By use of coastal infrastructure;
By use of production islands;
By use of floating platforms;
By use of fixed platforms;
By use of subsea production units.
Oil and gas production by use of coastal infrastructure was first practiced by engineer Pototsky, P.N. for the Bibi-Heybat Bay field development. The essence of this method involves directional wells drilling using land-based rigs, holes of which are aimed at coastal oil and gas horizons by drift deviation. The offshore field facilities themselves do not differ from onshore field facilities. This method is used in circumstances of small deposits located partly within the coastline and partly behind it or at a distance of no more than 15 km from the coast. The particularity of this method lies in the possibility of year-round production, even under significant hydrometeorological conditions [
9].
Oil and gas production by use of production islands also originated in the Bibi-Heybat Bay at the beginning of the 20th century. The essence of this method involves the construction of water-separating structures (dams) on the seabed above the oil and gas horizon and backfilling the resulting void. In the absence of available constructional materials in the conditions of freezing seas, the construction of artificial ice islands takes place using the freezing of water. This method of arrangement also implies various modifications of production islands, for example, islands with slope protection using reinforced concrete and torsion box structures. The production island is used for small deposits and significant hydrometeorological loads in cases of firm soil [
9,
10].
Oil and gas production by use of floating platforms is performed with the following types of offshore structures: self-elevating floating drilling rigs, semi-submersible and submersible floating drilling rigs, shipshape drilling rig, modern float-type (SPAR) and tension (TLP) platforms. It is worth pointing out that most of the floating facilities are used exclusively for well-drilling due to the possibility of their transportation and reuse. It is important to note that they are used at depths from 90–100 m to 200–300 m with an anchor retention system and over 200–300 m with a dynamic stabilization (positioning) system. Separate modifications of deep-water drilling rigs are used at depths of the order of 500, 1000, and even 1800 m [
8].
Oil and gas production by use of fixed platforms is the most common method of offshore field development owing to the wide variety of applications. This method is performed with the following types of offshore structures: fixed platforms on the rigid and elastic foundation. Rigid structures are subdivided according to the method of ensuring their structural competence into gravity, piled and piled-gravity foundation. In the first case, the platform does not move relative to the seabed due to its weight, and in the second case, due to anchor piling. Rigid fixed platforms are classified according to the material of structures into concrete, steel or combined. According to the method of attachment, elastic structures are divided into guyed, floating and flexible towers. Guyed towers maintain stability by a system of guys, floating pontoons and counterweights. Floating towers are similar to a swinging pendulum which returns to the stable state with the help of floating pontoons. Flexible towers deviate from the vertical and, like a compressed spring, tend to return to the stable state. According to statistics, 76% of all fixed platforms are rigid structures, 45% of them are piled, 26%—gravity, and 5% piled-gravity. Elastic fixed platforms are used much less often in modern production practice: 13%—floating towers, 8%—guyed towers, 3%—flexible towers [
11]. Another type of fixed offshore platform is an offshore ice-resistant oil-producing platform. This structure is widely used at shallow depths of the Arctic shelf up to 10–18 m and under significant ice conditions. Despite the interest in oil and gas production on the Arctic shelf, at the moment there is a limited and poorly studied range of technical solutions in the field of this platform, which is applicable in limited areas of pack ice.
Oil and gas production by use of subsea production units is the most promising method to arrange offshore fields. This method is based on the use of subsea completion systems in which wellheads and other related equipment are located on the seabed. Subsea production units can be completely autonomous, as well as be used in combination with fixed or floating processing platforms. Subsea production equipment is divided into “wet”, “dry” and hybrid systems. “Wet” systems are particularly prevalent (approximately 90%) due to their constructive simplicity and diversity. “Dry” systems differ from “wet” ones in the presence of an atmospheric wellhead chamber, which protects the wellhead equipment. Subsea production units may include one or more satellite wells, a well cluster or a subsea production center. These arrangement systems are applicable for large oil and gas fields, both in terms of hydrocarbon reserves and an oil productive area. The main advantage of this method is the absence of surface structures, which minimizes the influence of hydrometeorological factors.
The choice of an offshore field facilities system is based on the analysis of the factors that determine the offshore structure manufacturing, construction and operation: technological, hydrometeorological, engineering–geological, production and environmental [
8,
12]. The technological factor is based on the estimated number of wells, their projected depth, distance from the coast and the oil productive area. The hydrometeorological factor involves the effect of the current and wind velocities, the temperature and salinity of sea water, climate, wave and ice conditions on the field facilities system. The engineering-geological factor determines the type of platform foundation and its position relative to the seabed, taking into account the soil stability. The availability of productions for the fabrication of the offshore structures, particularized onshore supply bases and hoisting-and-transport equipment is a determinative in the choice of construction materials. The ecological compatibility in the development of marine resources becomes vital as far as the danger level of production and accident consequences for these objects is estimated as extremely high [
13].
Table 1,
Table 2,
Table 3 and
Table 4 present the analysis results of the previously described factors to determine the range of applications of various offshore oil and gas facilities. Based on these results, it is possible to make a primitive selection of offshore field facilities systems for their further technological and economical applicability assessment.
The technological applicability assessment of the offshore oil and gas facilities involves calculating the loads’ effect from currents, wind, waves and ice. Considering the flow parameters in a set area, such factors as the nature of current (tidal or wind), depth distribution, and constancy in time should be taken into account. In the absence of information about the flow velocity vertical profile in the considered area, it is recommended to use the average data, which are characterized by the expression [
14]:
where
is a total current velocity at the distance
z from the surface, m/s;
is a tidal current velocity at the still water level
, m/s;
is a wind current velocity at the still water level
, m/s.
The time-averaged load from currents on per unit length of the underwater part of the platform should be calculated based on the formula [
15]:
where
is the density of sea water, kg/m
3;
is a form drag coefficient, which is accepted according to
Table 5 [
15];
is a projection of the current velocity vector onto a plane, which is orthogonal to the underwater part of the platform axis, m/s; and
is a projection area of the underwater part of the platform onto a plane, which is orthogonal to the current direction, m
2.
The force is directed along the normal to the axis of the underwater part of the platform. The total load from the currents is determined by integrating the loads over the underwater part of the platform.
The law of wind velocity altitude variation for the open area of the sea [
15]:
where
is a wind velocity at the anemometer height (
m), m/s;
is a height above the sea level, m.
The non-wind loads are determined by the formula:
where
is the atmospheric density, kg/m
3;
is the design wind velocity at the anemometer height, m/s;
is the windage of the
i-th element, м
2;
is a coefficient, which takes into account the altitude variation of the wind velocity;
is a form drag coefficient of the
i-th element, which is accepted according to
Table 6 [
13]; and
is the length along the axis of the underwater part, m.
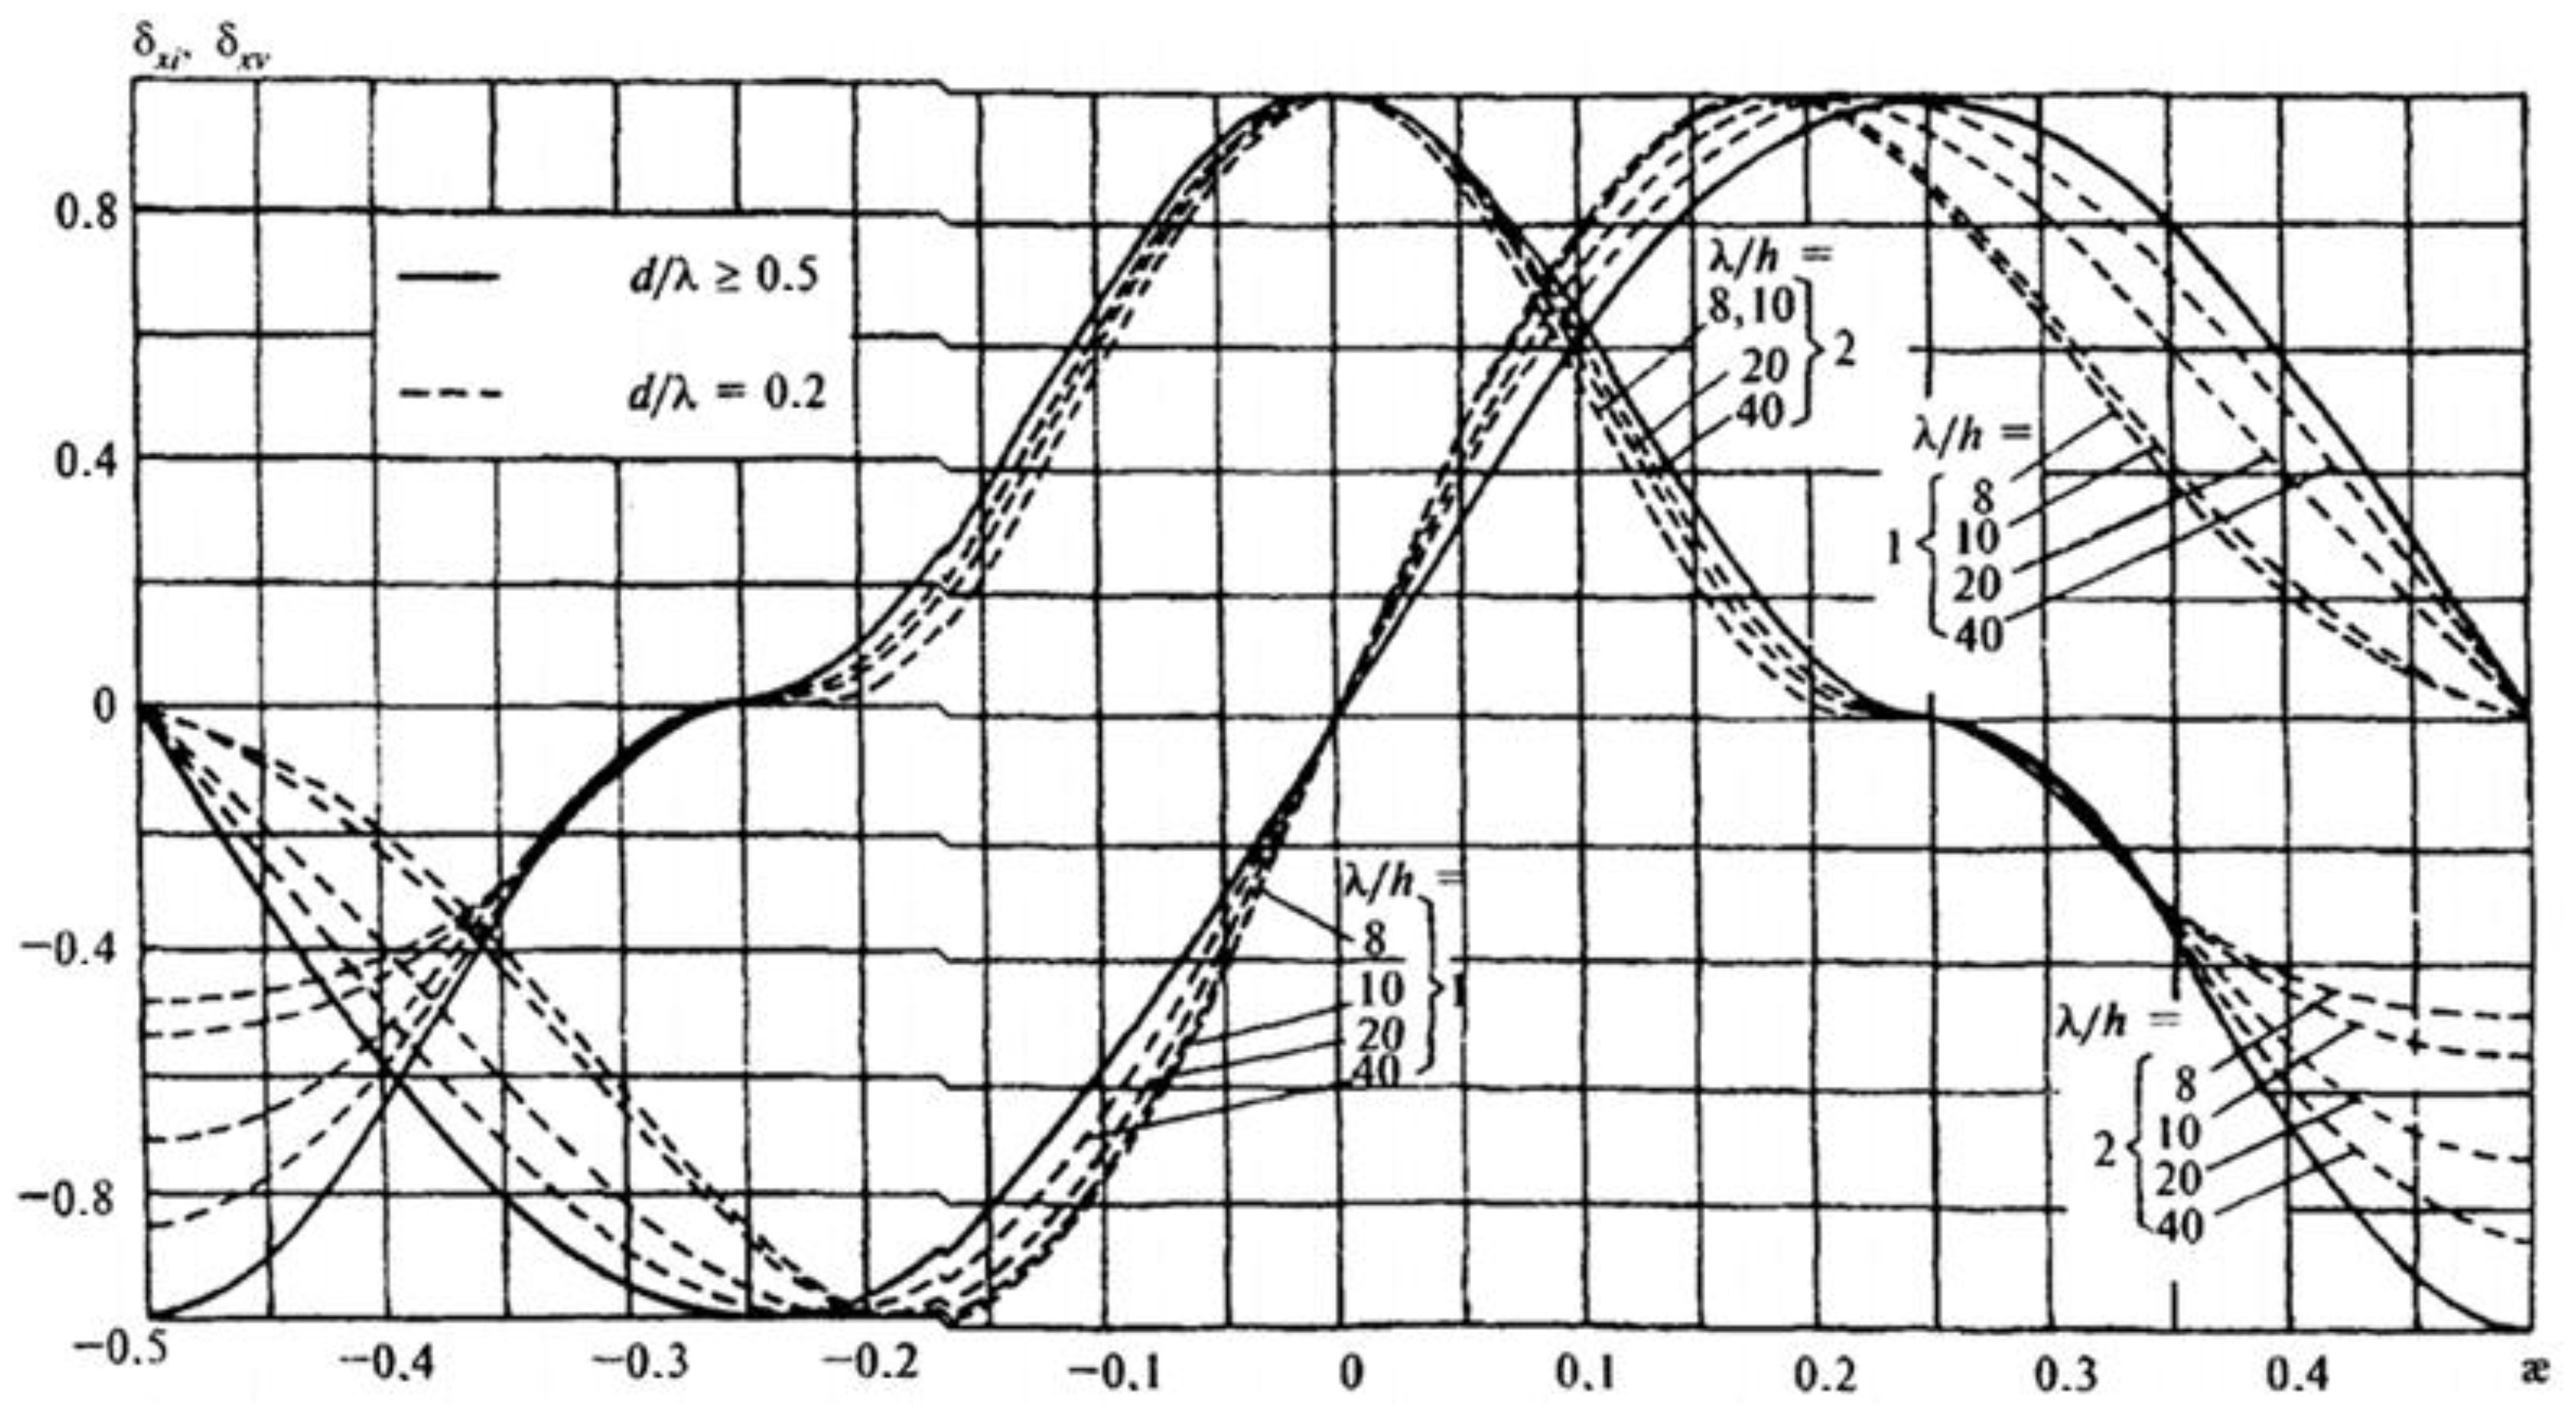
The linear load from waves on a streamlined barrier at depth z is determined by the formula:
where
and
are inertial and velocity components of the linear load from waves, which is accepted according to the formula:
where
and
are a combination factor of inertial and velocity components of the linear load from waves, which is accepted according to
Figure 2;
and
are coefficients of the linear load from waves, which is accepted according to
Figure 3;
is the density of sea water, kg/m
3;
is the width of the
i-th element, m;
is the length of the
i-th element, m;
is the depth of the
i-th element, m;
is a coefficient, which is accepted according to
Table 7 [
15];
and
are inertial and velocity coefficients of the barrier shape, which, according to the Norwegian bureau, Veritas, are equal to 1.6 and 0.75;
and
are the height and length of the wave, m.
At the moment, there are many regulatory documents (ISCS [
16], SNiP [
17], Standards of Gazprom [
18], API, CAN/CSA, DNV, Elforsk rapport 09:55, LG, ISO, EM), which determine the estimated value of the ice load. To simplify the calculation of the ice load, the standard methods of calculation were mathematically optimized [
19]. The load from the impact of ice formations (in meganewtons) on fixed vertical structures, depending on the factor
d/
h, is calculated by the formula [
18]:
where
is the width of the structure supports along the ice front, m; and
is the thickness of the smooth ice cover, m.
Depending on the duration and nature of the action, general construction norms are divided into permanent and temporary (long-term, short-term, special). In general, to compile the design combinations of loads, the most unfavorable conditions for the structure and practically possible combinations of loads with consideration of the real conditions of their synchronizing action should be taken into account. The estimated values of the minimum (summer) and maximum (winter) combination of loads on the platform according to
Table 8 are equal to [
20]:
To operate the platform, calculations of the strength and stability are made for the entire structure under various external loads. The structural competence is considered to be ensured if the following conditions are fulfilled [
20]:
where
is an estimated value of the overturning moment, MN
m;
is an estimated value of the holding torque, MN∙m;
is a combination factor of loads, which is accepted for the basic load combination during normal operation equal to 1;
is a specific-conditions-of-use factor, which is accepted for the basic load combination during normal operation equal to 1; and
is a criticality-based safety factor, which is accepted for the I class structure equal to 1.25.
The estimated value of the overturning moment is determined by summation of external moments:
The estimated value of the holding torque is determined by the formula:
where
is a weight of structure, N.
The shear stability is ensured by the following condition [
21]:
where
is a sum of shearing horizontal forces, MN; and
is a sum of holding horizontal forces, MN.
Under these conditions, the holding force is the force of friction between the base of the structure and the sea bottom. The sum of the holding forces is determined by the formula:
where
is a friction coefficient, which is determined by contacting materials and equal to 0.5.
The sum of the holding forces is equal to the calculated combination of loads on the platform.
The economical applicability assessment of an offshore oil and gas facility consists in the calculation of the key economic effectiveness parameter. The net present value (
NPV) is determined by the formula:
where
are numbers of time periods;
is the cash flow; and
is a discount rate.
The internal rate of return (
IRR) is determined by the formula:
The discounted payback period (
DPP) is determined by the formula:
where
is an investment.
The discounted profitability index (
DPI) is determined by the formula:
3. Results and Discussion
The technological factor for the arrangement of the Avaldsnes section is based on the estimated number of wells, their projected depth, parameters of the reservoir and fluid (
Table 9) [
7]. According to exploration wells, the average depth of the Intra Draupne sandstone ranges from 1900 m to 1930 m. The estimated number of wells is determined based on the experience of developing other sections of the Johan Sverdrup field and it is equal to 18. According to the hydrodynamic modeling in the Tempest software package with a staggered grid of horizontal wells, the following data were obtained [
22,
23,
24]:
Number of production wells: 10;
Number of injection wells: 8;
Lifespan of the section: 34 years;
Cumulative oil production: 77.5 million m3;
Cumulative gas production: 3.1 billion m3.
The water masses of the North Sea are characterized by a mixture of Atlantic, Baltic and river waters. The main flow of water enters the sea from the northwest—between the Shetland Islands and Scandinavia, as well as between the Shetland and Orkney Islands. The speed of constant wind currents is on average 0.1–0.2 m/s, but with storm winds, which are coincident in direction with currents, it can reach 1 m/s. In most of the open areas of the sea, the speed of tidal currents is equal to 0.2–0.4 m/s. It increases significantly in some straits; for example, in the narrow straits of the Shetland Islands, they reach 2.6 m/s [
25].
The North Sea is located at temperate latitudes with a climate strongly influenced by the influx of oceanic waters from the Atlantic Ocean, the Icelandic low and the Azores high. Following this fact, the climate of the North Sea has the characteristics of oceanic temperate latitudes with moderate air temperature, high humidity, high overcast and heavy precipitation. The winter season is characterized by the strongest winds. On average, monthly wind speed is equal to 5–6 m/s, and it increases from the southeast to the northwest. In the northern part of the sea, the average wind speed reaches 9–10 m/s. At the same time, strong storm winds often blow at this time of the year, the speed of which is equal to 25–30 m/s with the highest being 30–35 m/s. In summer the Azores high is more developed. Wind speed is usually not high, and in summer average monthly values lie within 2–5 m/s. In some coastal areas under the influence of the coastal relief wind speed increases and reaches 6–7 m/s. Storm wind speed in summer is usually 15–20 m/s.
In winter, the waves reach heights of 11 m and above. In most cases, in autumn and winter waves are 2–4 m high, much less often 7–9 m. In summer the prevailing wave height is about 2 m, and calms are observed more often [
25]. As the air temperature in the coldest season in the central part of the sea is 3–4 °C and rarely drops to 1 °C, and the water temperature ranges from −1 °C off the coast to 6 °C in the northwest, the North Sea is considered non-freezing. At extremely low temperatures, ice forms on the coast of Norway, but it does not affect the design of the field facilities system.
The bottom of the North Sea is characterized by a gentle slope from south to north and a very dissected relief. The topsoil consists of 10–12 m of soft silt/clay, followed by medium-density clay to a depth of 40–50 m and a 30 m-thick layer of sand, under which very hard clay lies.
The Johan Sverdrup field will be powered from the ground throughout its lifespan. The power station is located in Kårstø and is connected to the distribution station in Haugsnesct by AC cables. Underwater cables connect the distribution station and the power module on the riser platform RP. The part of the infrastructure created for the first phase already has sufficient capacity to cover the electricity needs for the second phase as well (more than 100 MW). The Dusavik base, located in the north of Stavanger municipality, was chosen as the production supply base. The base has a good environment and has a strategic location to oil and gas field on the Norwegian continental shelf. More than 60 service companies specializing in drilling, field facilities construction, repair work, and equipment use Dusavik as a service center for their production [
25]. The produced oil will be exported via a new 36-inch pipeline to the existing onshore terminal at Mongstad. The length of the pipeline will be about 275 km, the capacity is equal to 100,000 m
3/day, and it is sufficient to ensure the transportation of the produced oil in the second phase. The extracted gas will be exported via a new connecting line to the Statpipe main gas pipeline and further to the terminal in Kårstø. The connecting pipeline from the field will be about 155 km and its capacity will be 4–10 million m
3/day. This scheme of transportation of the extracted gas makes it possible to connect to the Åsgard pipeline, if the Statpipe will be decommissioned in 10–20 years after the field is launched.
Due to the fact that the field is supplied with electricity from land, CO
2 and NOX emissions will be very low. The specific CO
2 emission at the field is 6.7 kg/m
3. The average value for the Norwegian continental shelf is 52 kg/m
3. Reservoir water will be re-injected into the reservoir after three-stage purification to maintain reservoir pressure. The field will produce approximately 40 million m
3/year of associated water. For comparison, the total discharge of associated water in the North Sea in 2020 is estimated at 119 million m
3/year [
7]. The fishing economy is of great importance for the country. Due to the fact that the deposit is located in the center of the main source of fish, it is necessary to take into account the impact of oil production on sea aquaculture and the fishing process. There may be some problems with the land use of the seabed in the areas of installation of platforms, underwater mining complexes and pipelines. So, it will reduce the trawl routes and requires strengthening the equipment to protect against damage by trawls [
26].
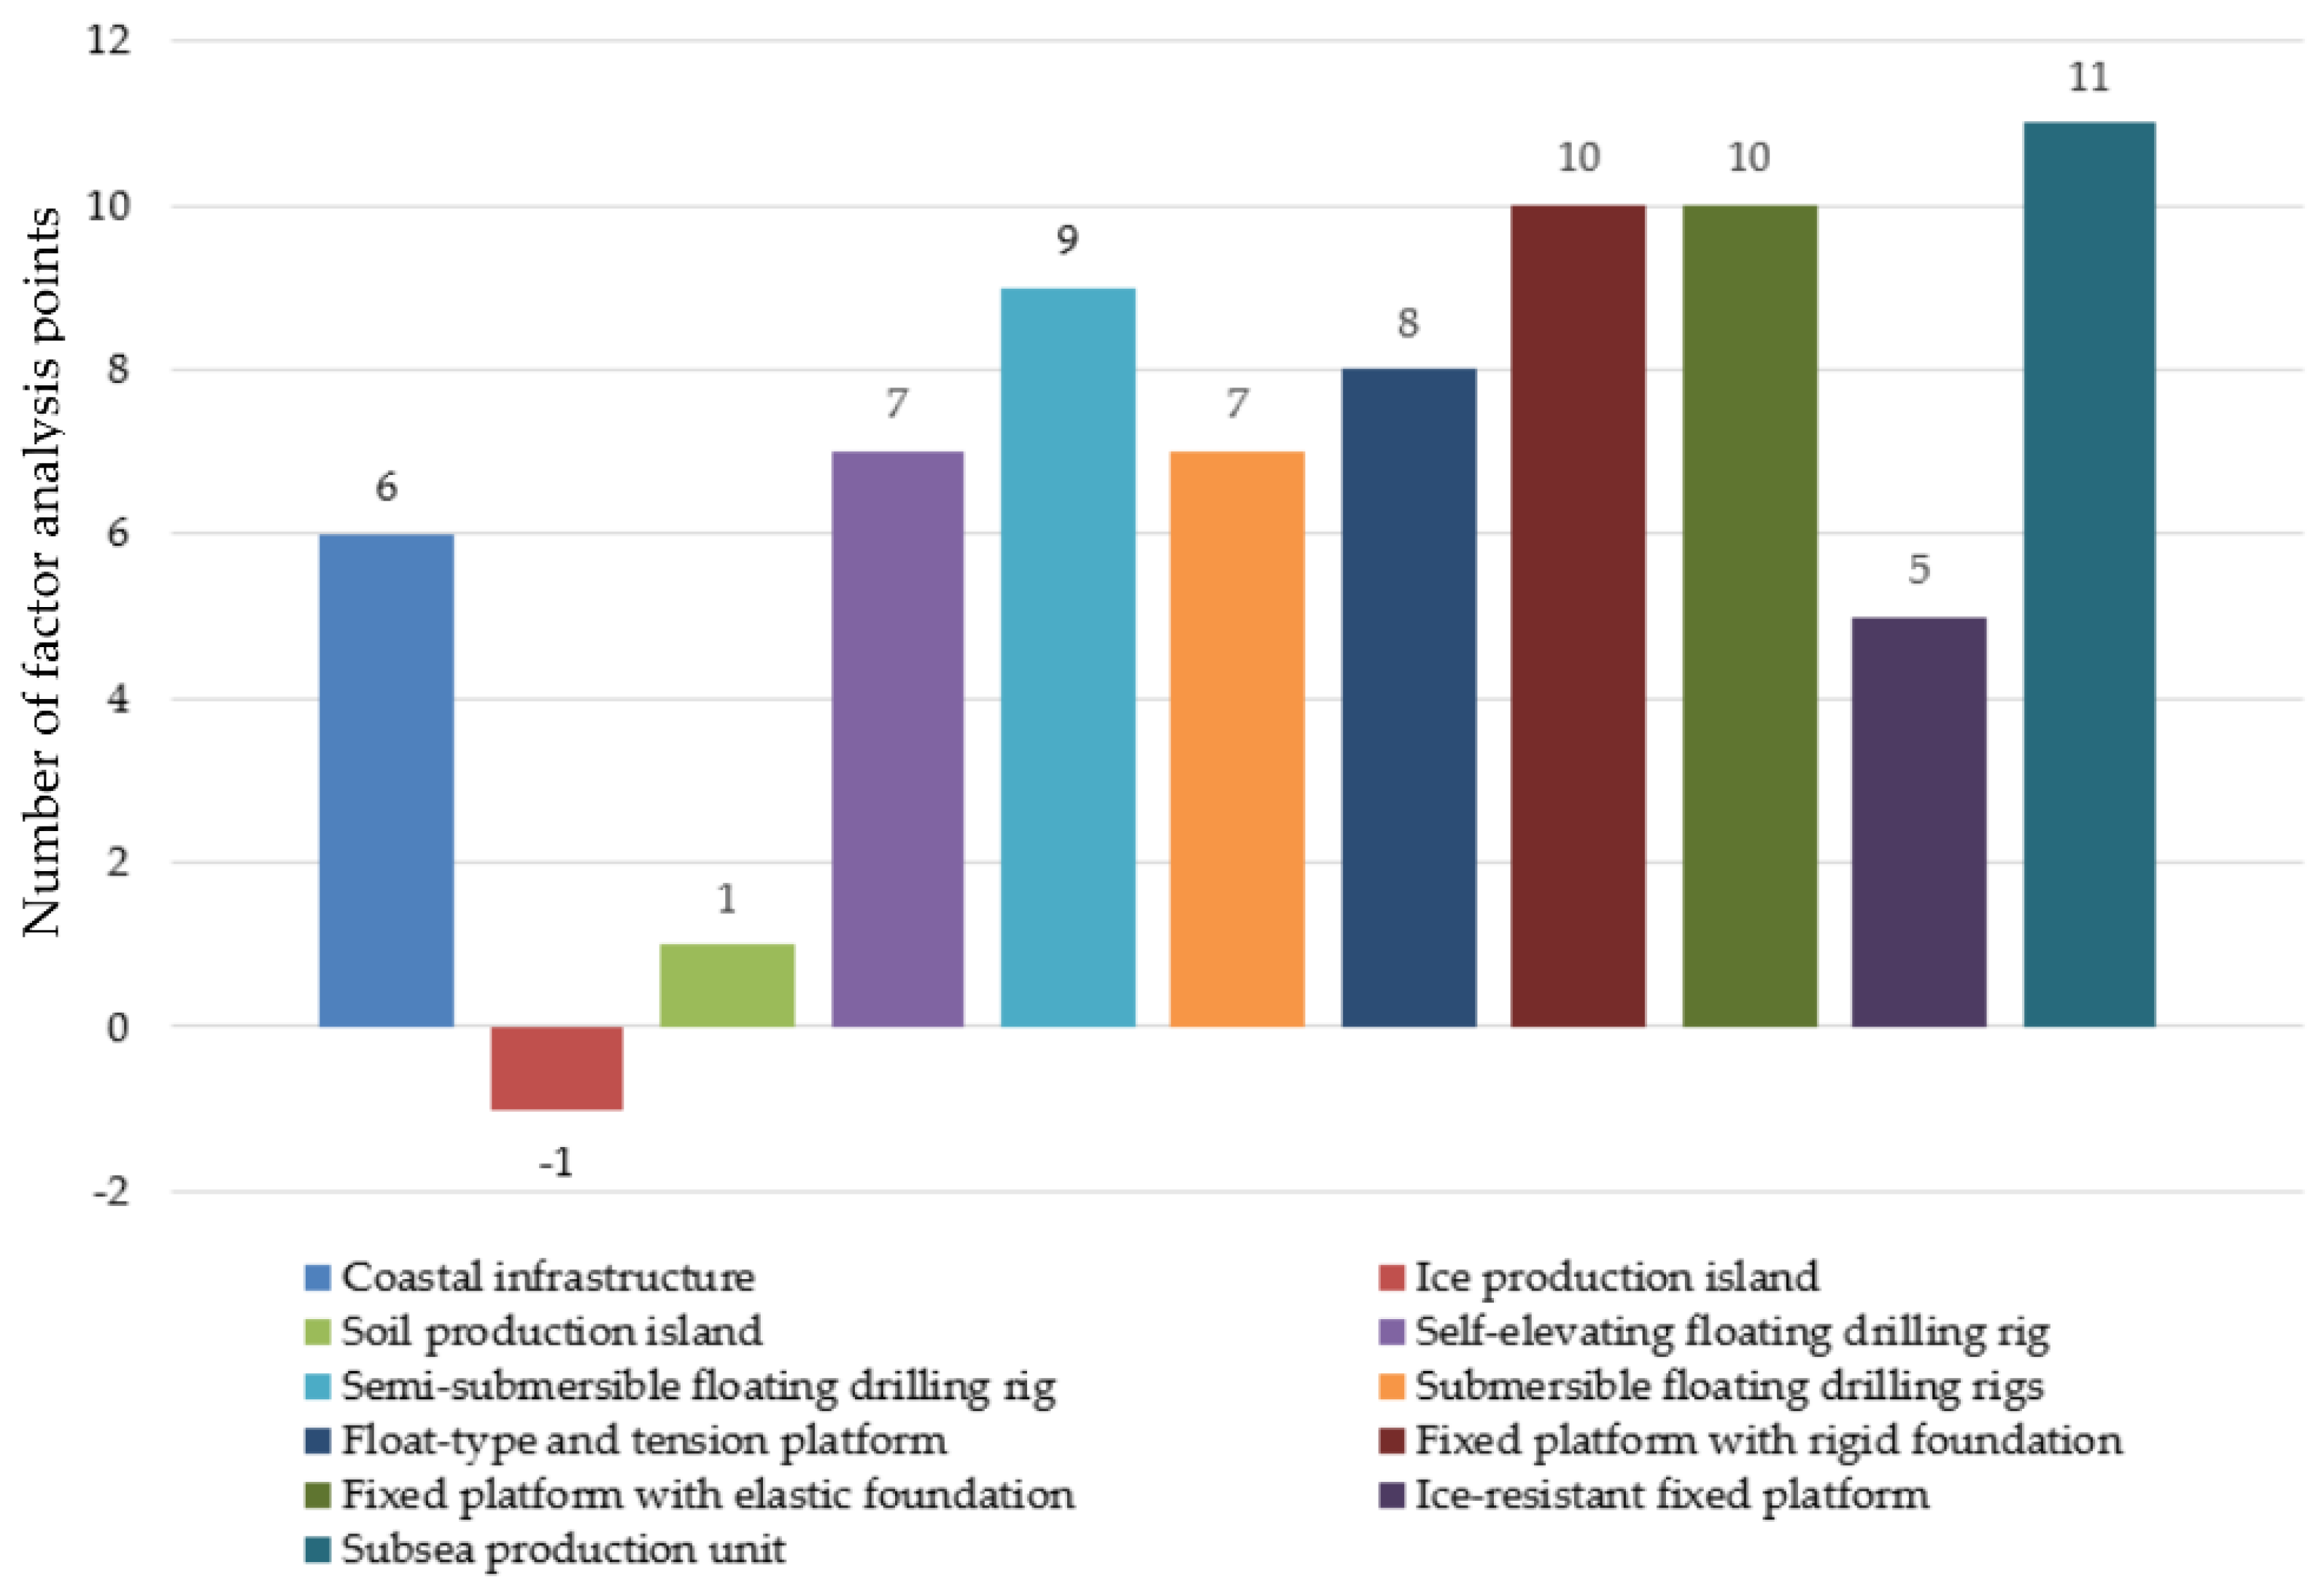
Having analyzed arrangement factors of the Avaldsnes section and criteria for the applicability of various offshore oil and gas facilities, a qualitative analysis was performed (
Figure 4). The essence of the analysis is to assign a maximum score in case of a positive result (max = 1) and a minimum score in case of a negative result (min = −1) for each type of marine structure for each arrangement factor. In case of a neutral result, no points are awarded. Further, results are summarized for each type of offshore structures and the most applicable option is determined by the maximum value. Based on the performed analysis, it can be concluded that the most applicable equipment systems for the Avaldsnes site will be fixed platforms with rigid foundations or subsea production units. Between different types of subsea production units, the most suitable is subsea production centers. This decision is conditioned by minimizing the environmental impact on fish. In addition, due to the frequency of trawl routes through the area, this offshore structure is the most suitable to ensure maximum protection of equipment. Taking into account the arrangement experience of fields in the North Sea and the central section of the Johan Sverdrup field, fixed platforms with elastic foundations belong to the unprofitable category.
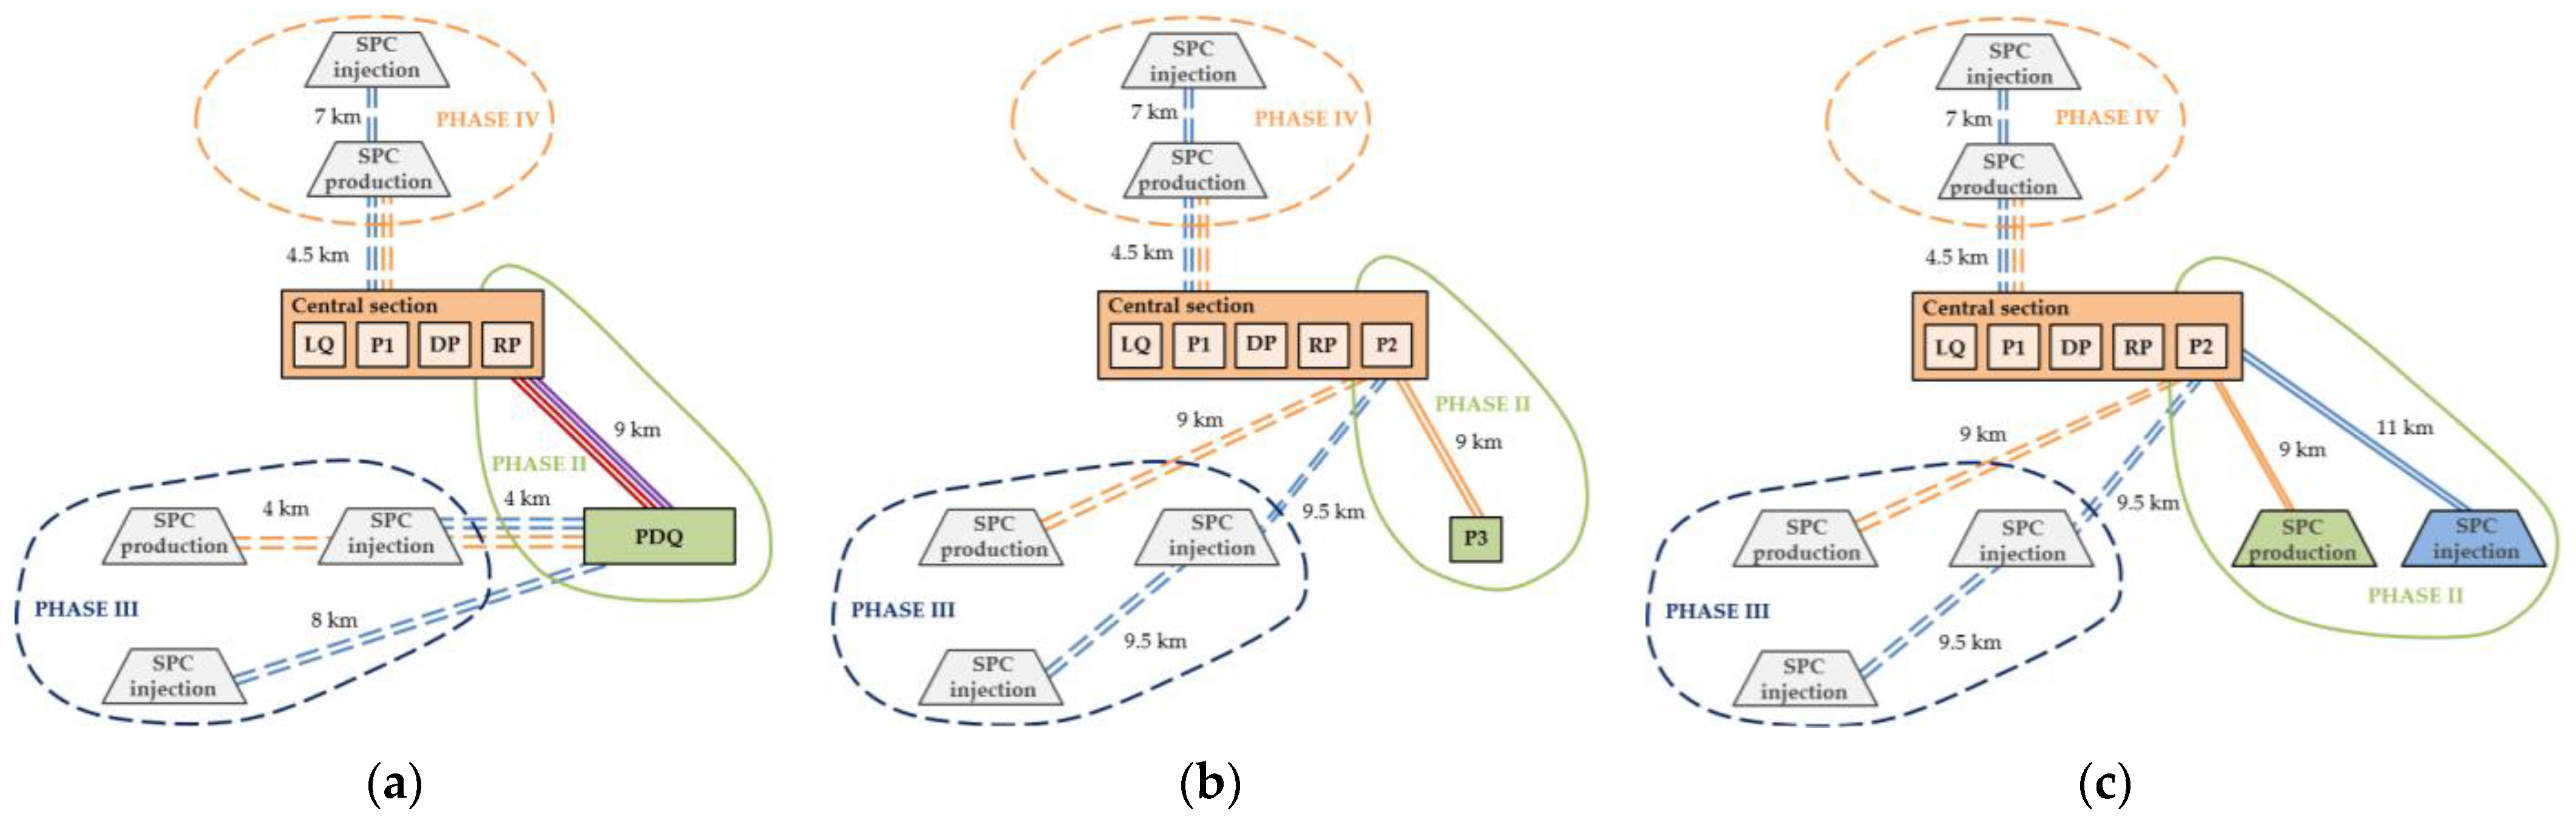
Thus, the following possible variants of the arrangement system for the Avaldsnes section of the Johan Sverdrup field can be identified (
Figure 5):
Scenario 1 consists of the construction of a steel pile fixed PDQ platform (P—production, D—drilling, Q—quarter) in the central part of the Avaldsnes section;
Scenario 2 consists of the construction of two steel-pile fixed technological platforms P2 and P3 in the central part of the field (connection to the quarter platform QP) and in the central part of the Avaldsnes section;
Scenario 3 consists of the installation of subsea production centers proportionally located along the site Avaldsnes section.
Scenario 1 is pointed out on the basis of the analogy method with the arrangement system of the Ivar Aasen field. The massiveness and multifunctionality of the PDQ platform are conditioned by the further introduction into the development of the western field section. A possible arrangement scenario for this section consists of the installation of the subsea production center, and its connection to the PDQ platform. The extracted fluid after multi-stage treatment on the platform will be transported via infield pipelines to the riser platform RP.
Scenario 2 is pointed out based on the arrangement experience of the Johan Sverdrup central section. The processing platform P3 serves the function of primary treatment of the extracted products to reduce the load on the processing platform P2. The processing platform P2 will be built for further inclusion in the project of the least productive areas of the field (north and west).
Scenario 3 consists of the installation of three subsea production centers:
The subsea production center with the possibility to connect 10 production wells at the Avaldsnes section;
The subsea injection center with the possibility to connect four injection wells in the east of the Avaldsnes section;
The subsea injection center with the possibility to connect eight injection wells in the west of the Avaldsnes section (four additional injection wells will be connected at the start of western section development of the Johan Sverdrup field).
This scenario also includes the installation of the processing platform P2 in the central part of the field to cover the need for multi-stage treatment of the extracted fluid from the Avaldsnes section and the western section of the Johan Sverdrup field.
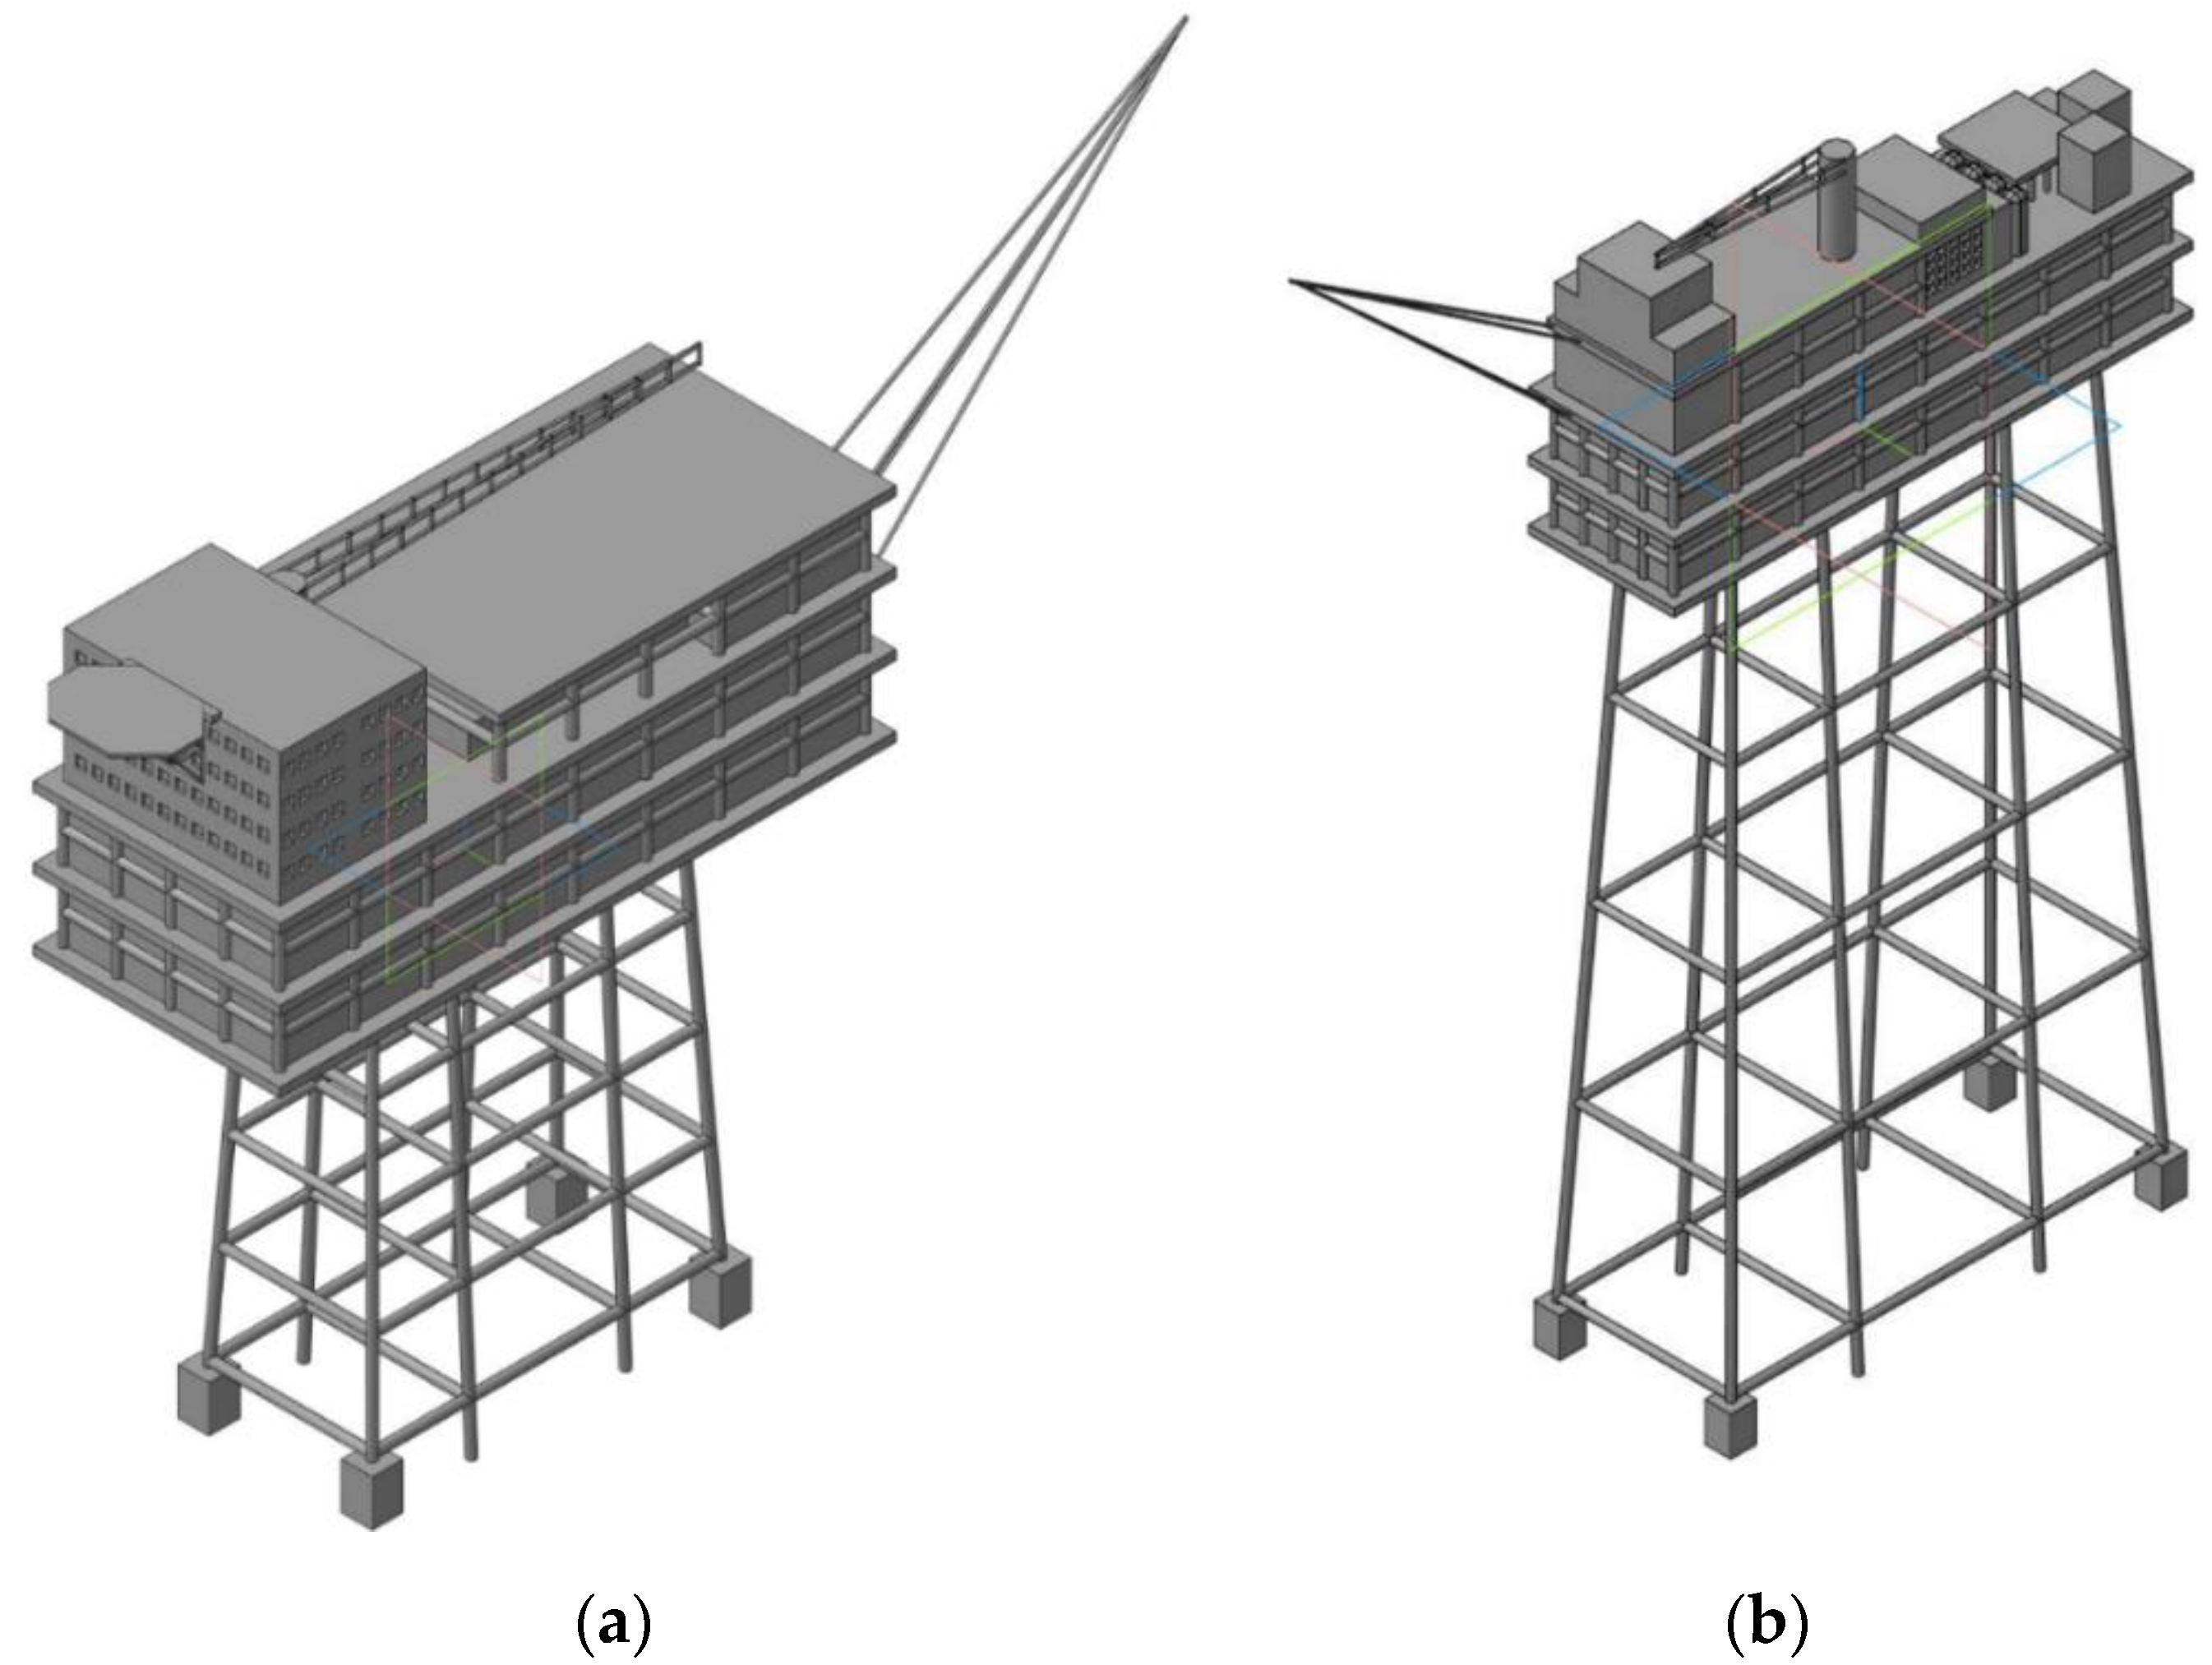
The basic parameters of the platforms are presented in
Table 10, according to which their 3D models were compiled (
Figure 6).
The important part of the arrangement system is the construction of subsea infield pipelines that provide transportation of extracted and injected products. According to Scenario 1 construction of two pipelines for oil transportation and two pipelines for gas transportation with a total length of 36 km to the riser platform RP will be required. Duplicate pipelines are obligatory for all scenarios and provide transportation of the extracted fluids in case of an emergency. In Scenario 2, after the first stage of treatment aimed at discharging produced associated water, fluids enter multiphase pipelines to the processing platform P2 with a total length of 18 km. In Scenario 3, it is necessary to construct two multiphase pipelines to transport the extracted fluids together with associated water to the processing platform P2 with a total length of 18 km and two pipelines to ensure water injection from the processing platform P2 to the subsea production center, with a total length of 22 km.
To calculate hydrometeorological loads, it is necessary to determine the platform clearance. The clearance of the topside structure of the offshore fixed platform in the absence of ice load is determined by the formula:
where
is the maximum amplitude of sea level change, which is possible once in 100 years, m;
is wave height with 0.1% probability, which is possible once in 100 years, m;
is the associated average wave length corresponding to the wave length of the wave length with 0.1% probability, which is possible once in 100 years, m;
is a diameter of the cylindrical support or a lateral size of the cone support at the sea level, m.
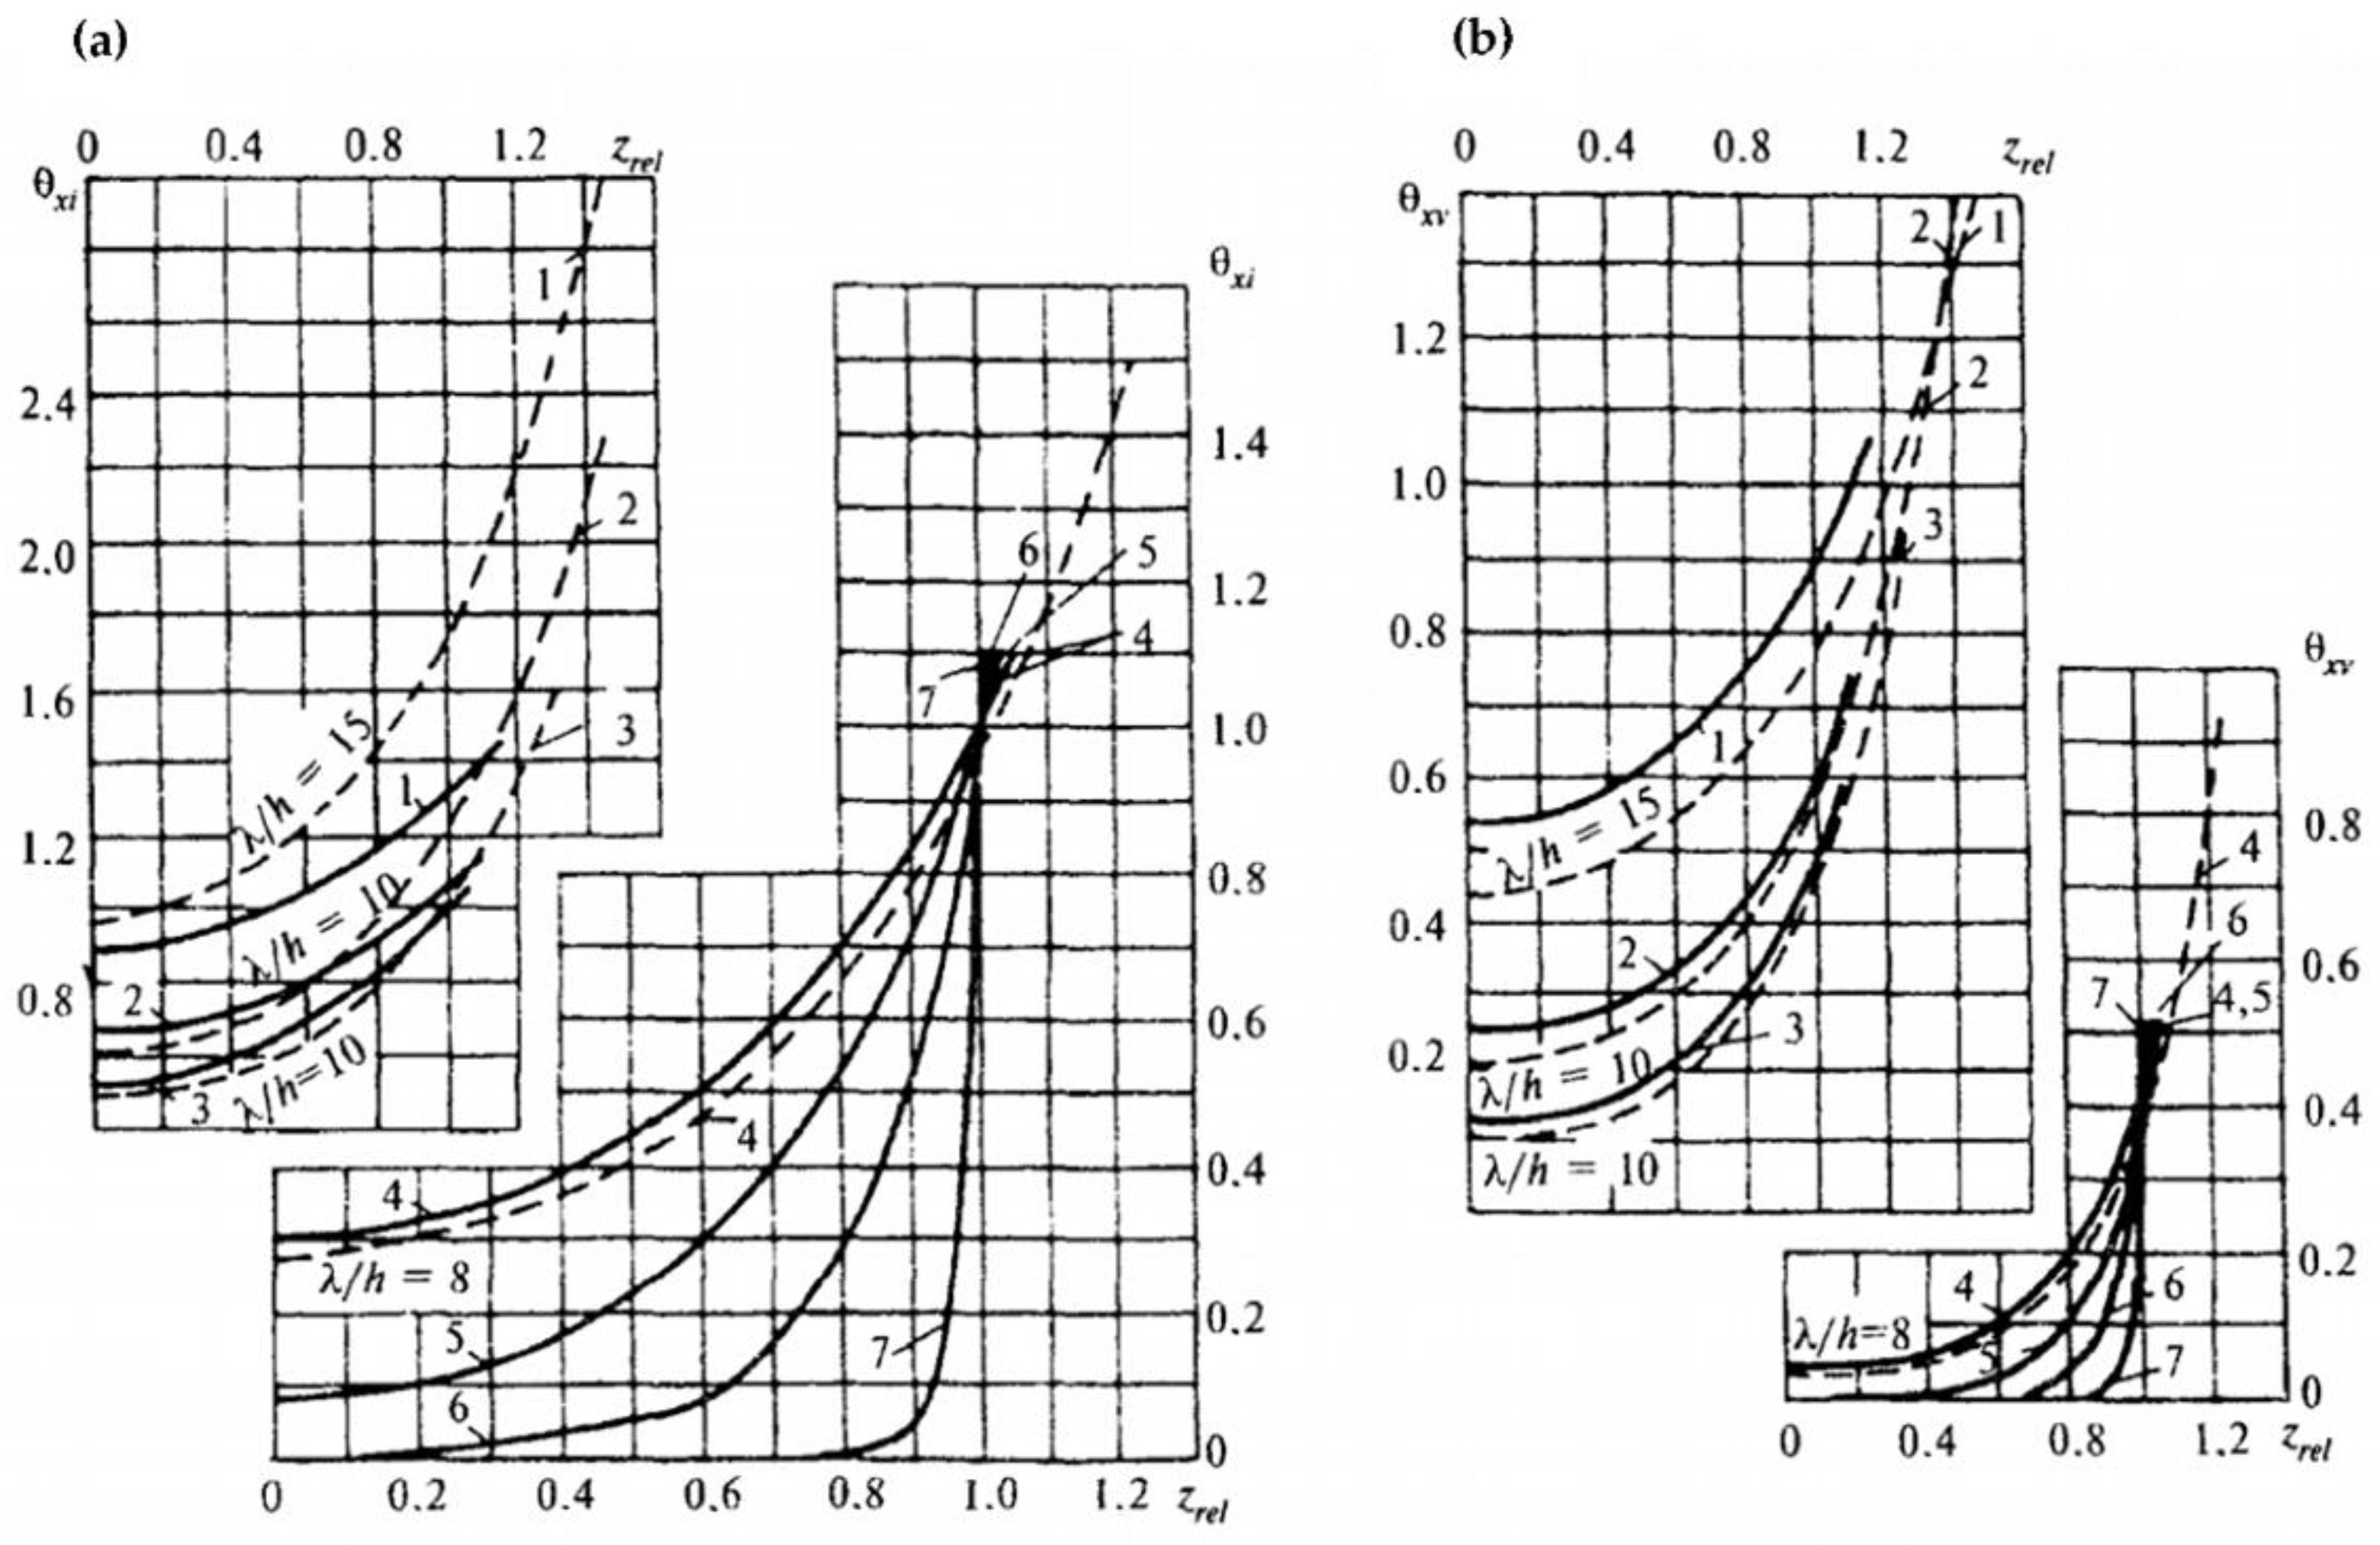
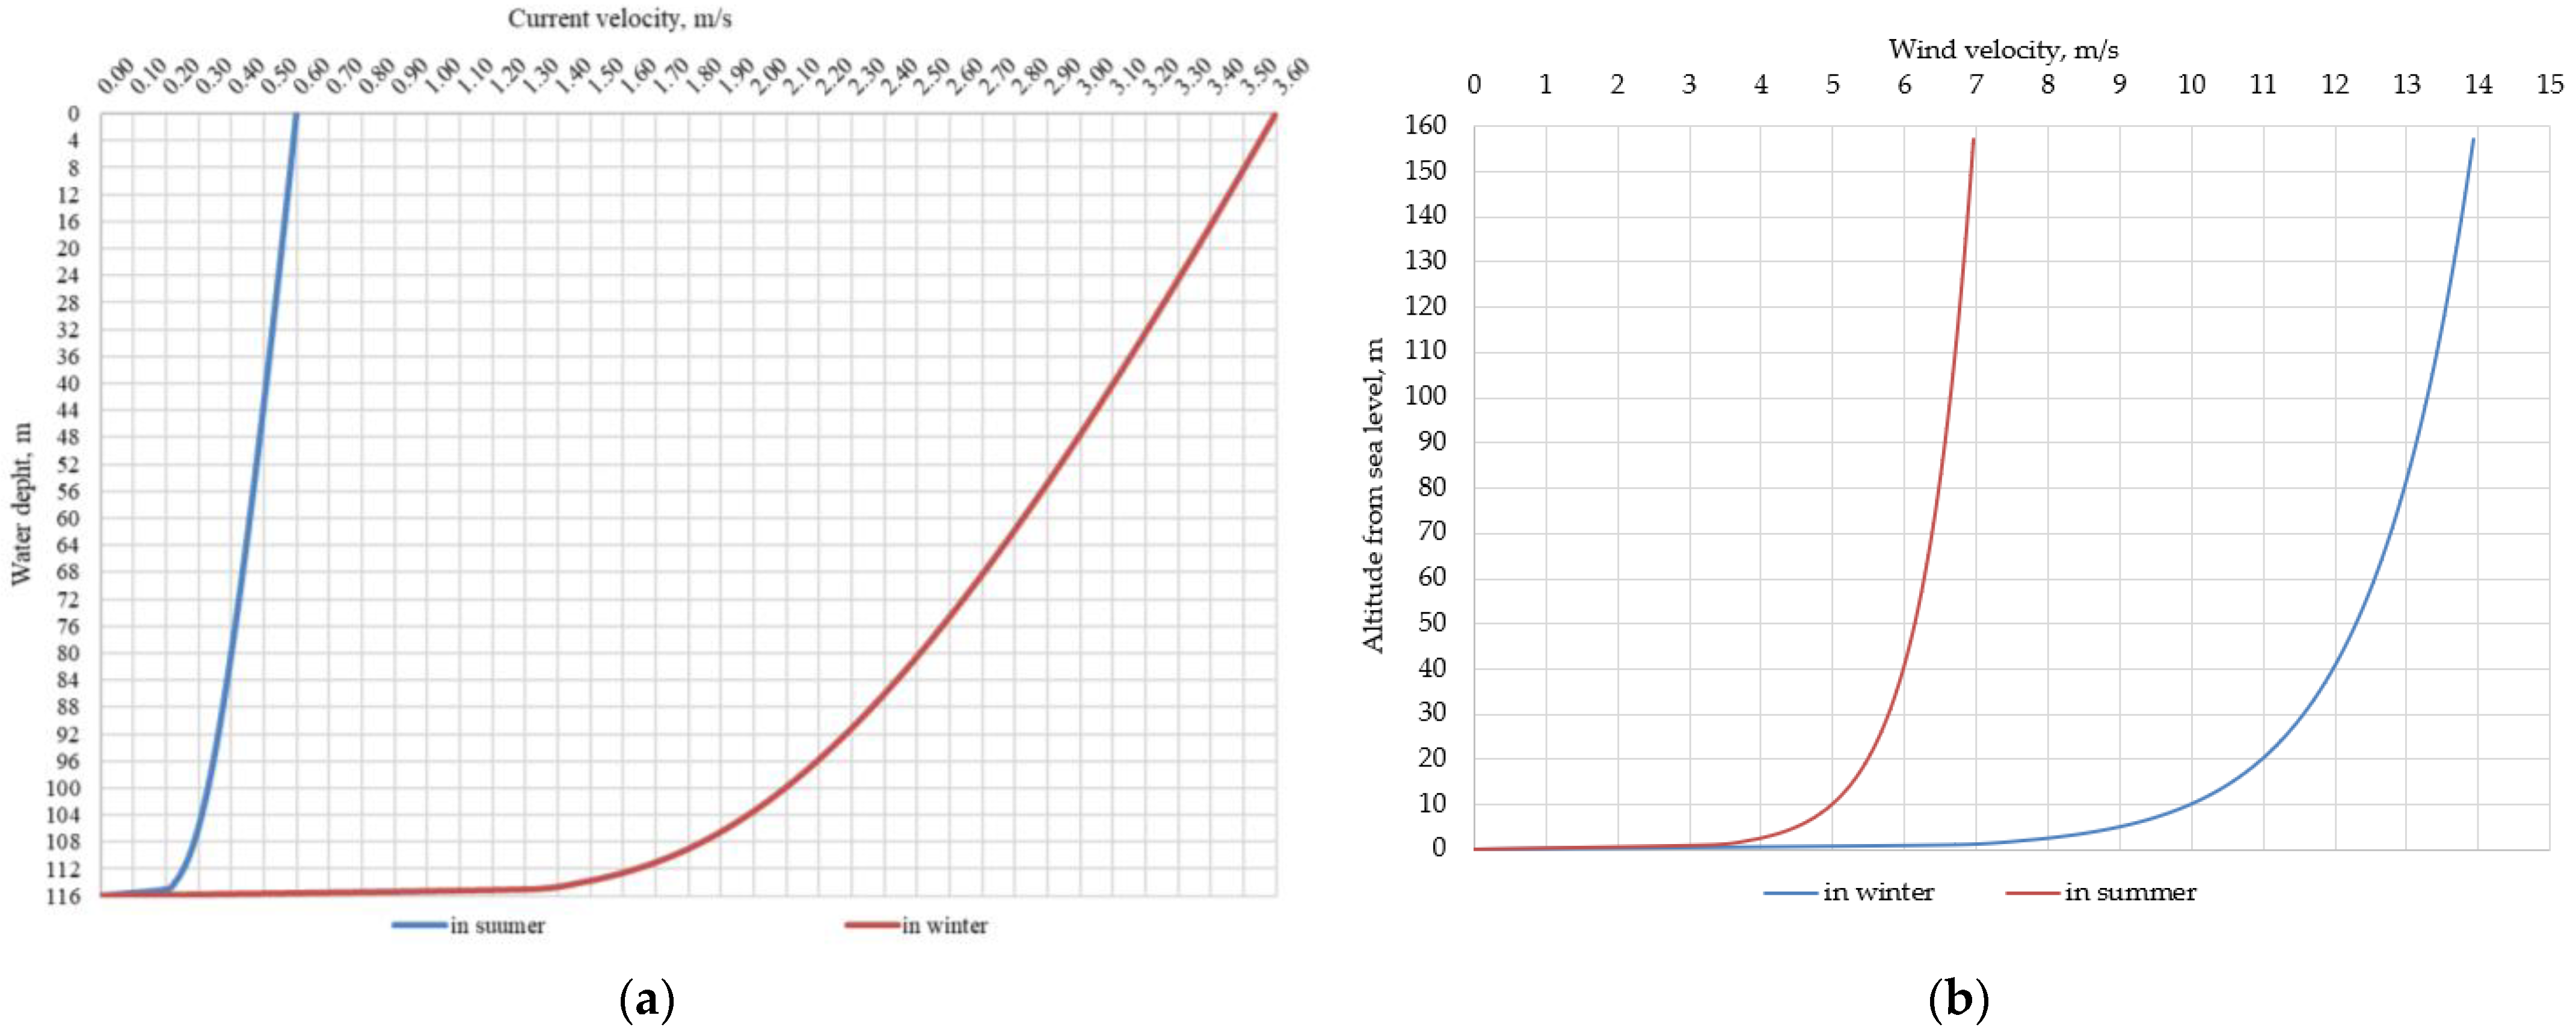
The clearance of the topside structures for the PDQ platform and platforms P2 and P3 are correspondingly equal to 14 and 18 m. The next step is to determine the load from currents, wind and waves on the platforms described in Scenarios 1 and 2, according to the expressions described earlier. The flow velocity vertical profile and the wind velocity profile for the height of structures are determined by the statistical method (
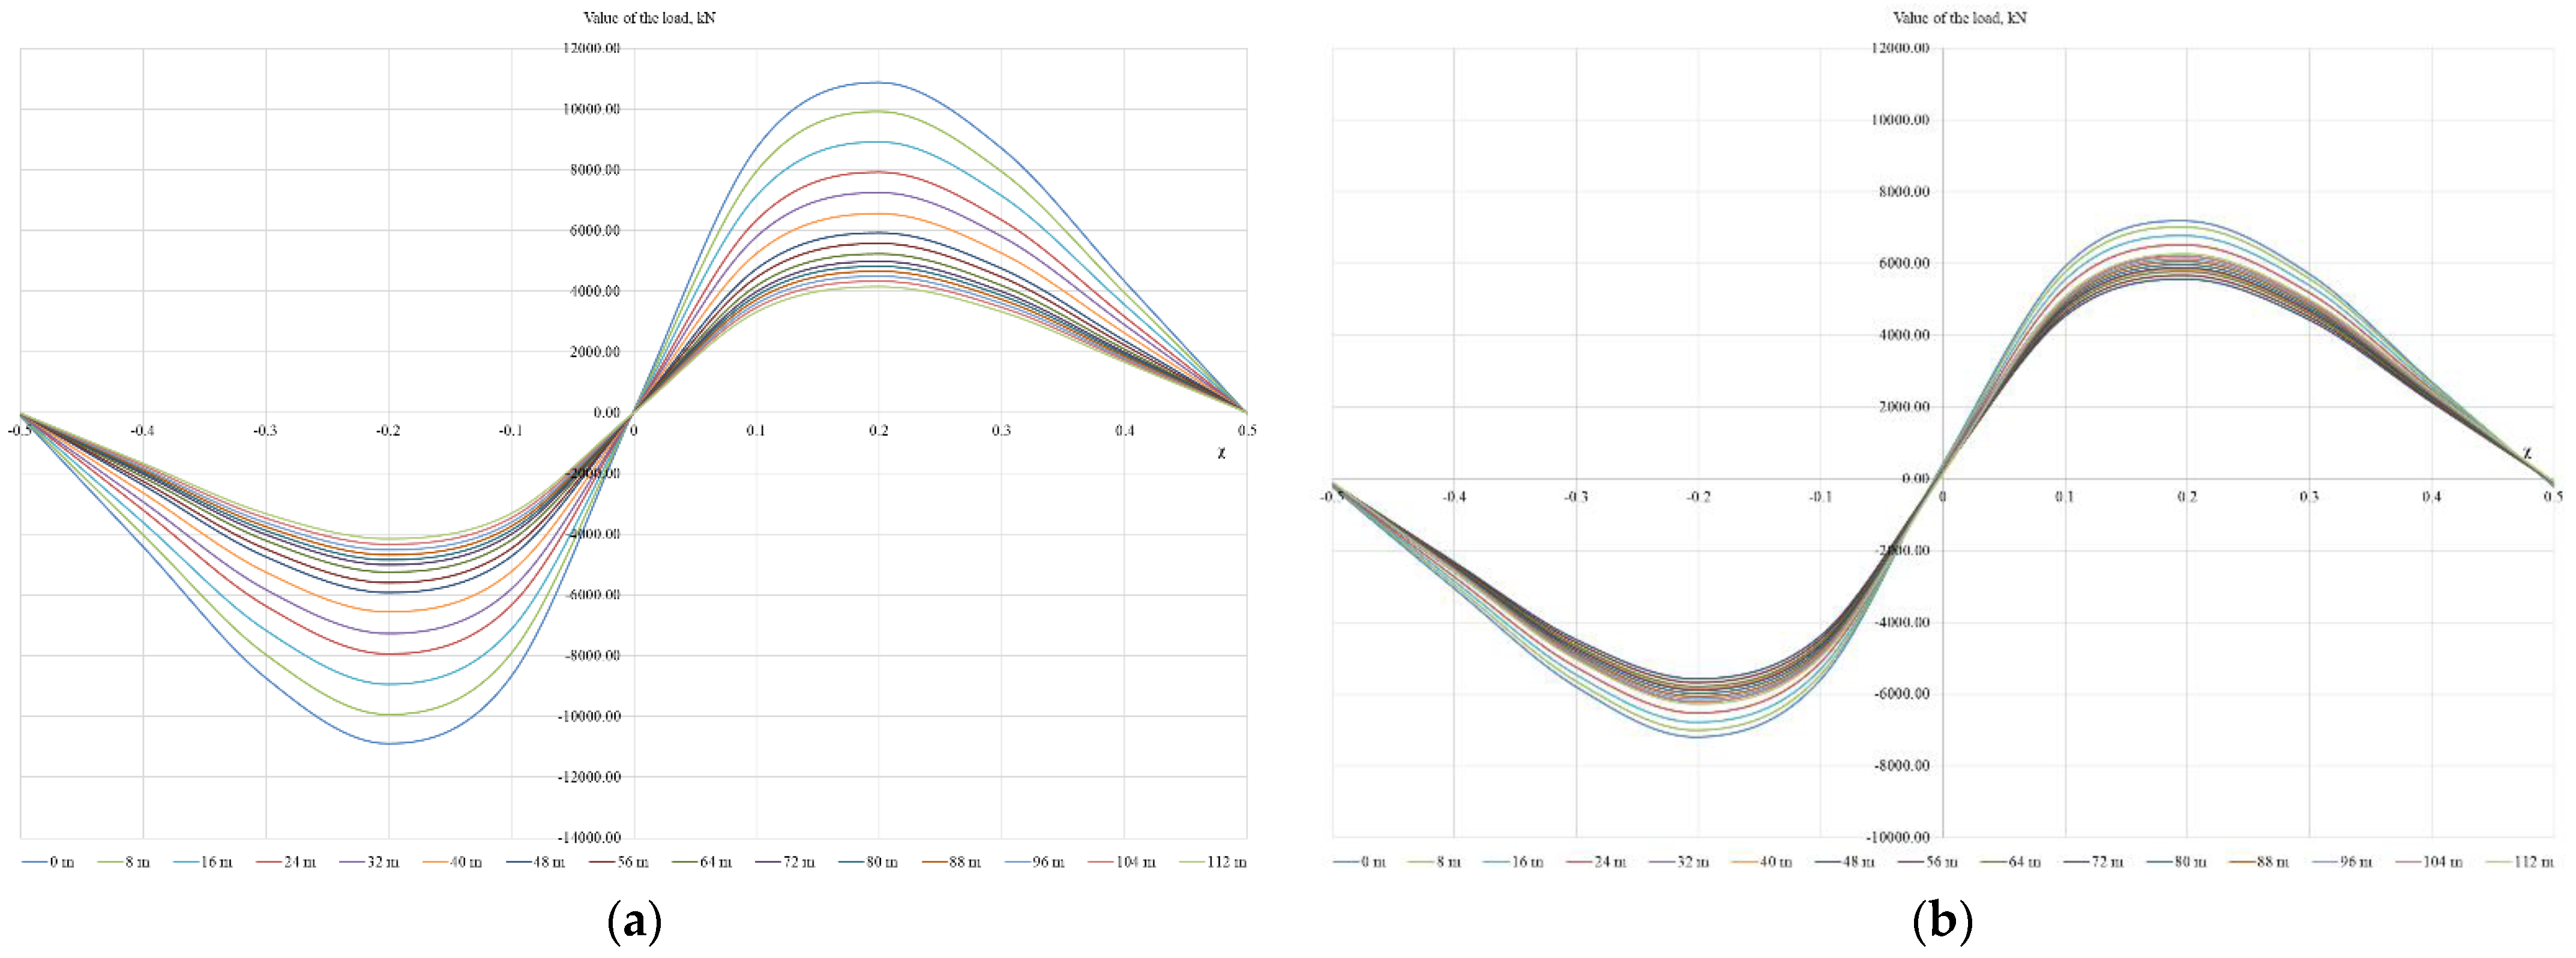
Figure 7). The wave load depends not only on the depth and initial calculation parameters but also on the position of the calculation point relative to the wave crest (
Figure 8). The maximum achieved load value appears at the value of the relative parameter
. Thus, further calculation of the wave load will be carried out at a distance of 53.8 m from the wave crest. Using expressions of linear loads, we determine the integral loads, their application points and moments by summing over the surface of the structure. The results of the calculations are presented in
Table 11,
Table 12 and
Table 13. The result of the loads’ calculation on the platforms is the compilation of calculated combinations of loads:
For Scenario 1 the maximum combination of loads is
439,160.6 kN, while the minimum combination of loads is 433,291.6 kN;
For Scenario 2 the maximum combination of loads is 435,005.3 kN, and the minimum combination of loads is 429,863.7 kN.
The sum of the shearing horizontal forces is equal to the calculated combination of forces. The sum of the holding forces is determined based on the mass of the projected structures: 385,925.40 kN for Scenario 1 and 196,200.00 kN for Scenario 2. Checking the structures for shear stability, it is revealed that both structures can be used at the Avaldsnes section.
The calculated value of the overturning moment is determined according to the calculated combinations of loads:
For Scenario 1 the maximum combination of moments is 21,244 283.6 kN‧m, the minimum combination of moments is 21,027,448.4 kN‧m;
For Scenario 2 the maximum combination of moments is 24,882,632.2 kN‧m, the minimum combination of moments is 24,647,872.1 kN‧m.
The holding moment for platforms has the value of 43,851 168.23 kN‧m and 16,489 684.89 kN‧m. As a result of checking the structures for resistance to overturning, it is revealed that in winter, due to high wave loads in the area of the Avaldsnes section, the processing platform P3 will be in an emergency situation. This fact indicates the impossibility of installation of this platform. The PDQ platform in Scenario 1 can withstand loads.
To calculate the operating revenue from the extracted oil sales, it is necessary to accept the price of Brent crude oil equal to 585.94 NOK per barrel and the price of natural gas as 1861.2 NOK per 1000 m
3. The cost of electricity for industrial needs according to Eurostar is 536.36 NOK per MW/h. The average level of remuneration for engineering specialties in 2020 is 46,000 NOK. The linear depreciation of fixed-capital assets is calculated, taking into account the cost-effective lifespan of the field site as 25 years. Tax payments in Norway include production royalty (8–16% of profit contribution), property tax (1.8%), rentals for the use of the license area (7000 NOK per 1 km
2), income tax (28% + special tax for oil and gas companies—50%) and tax for CO
2 emissions (0.76 NOK per 1 m
3). The discount rate should be taken equal to 20%. According to
Table 14 and
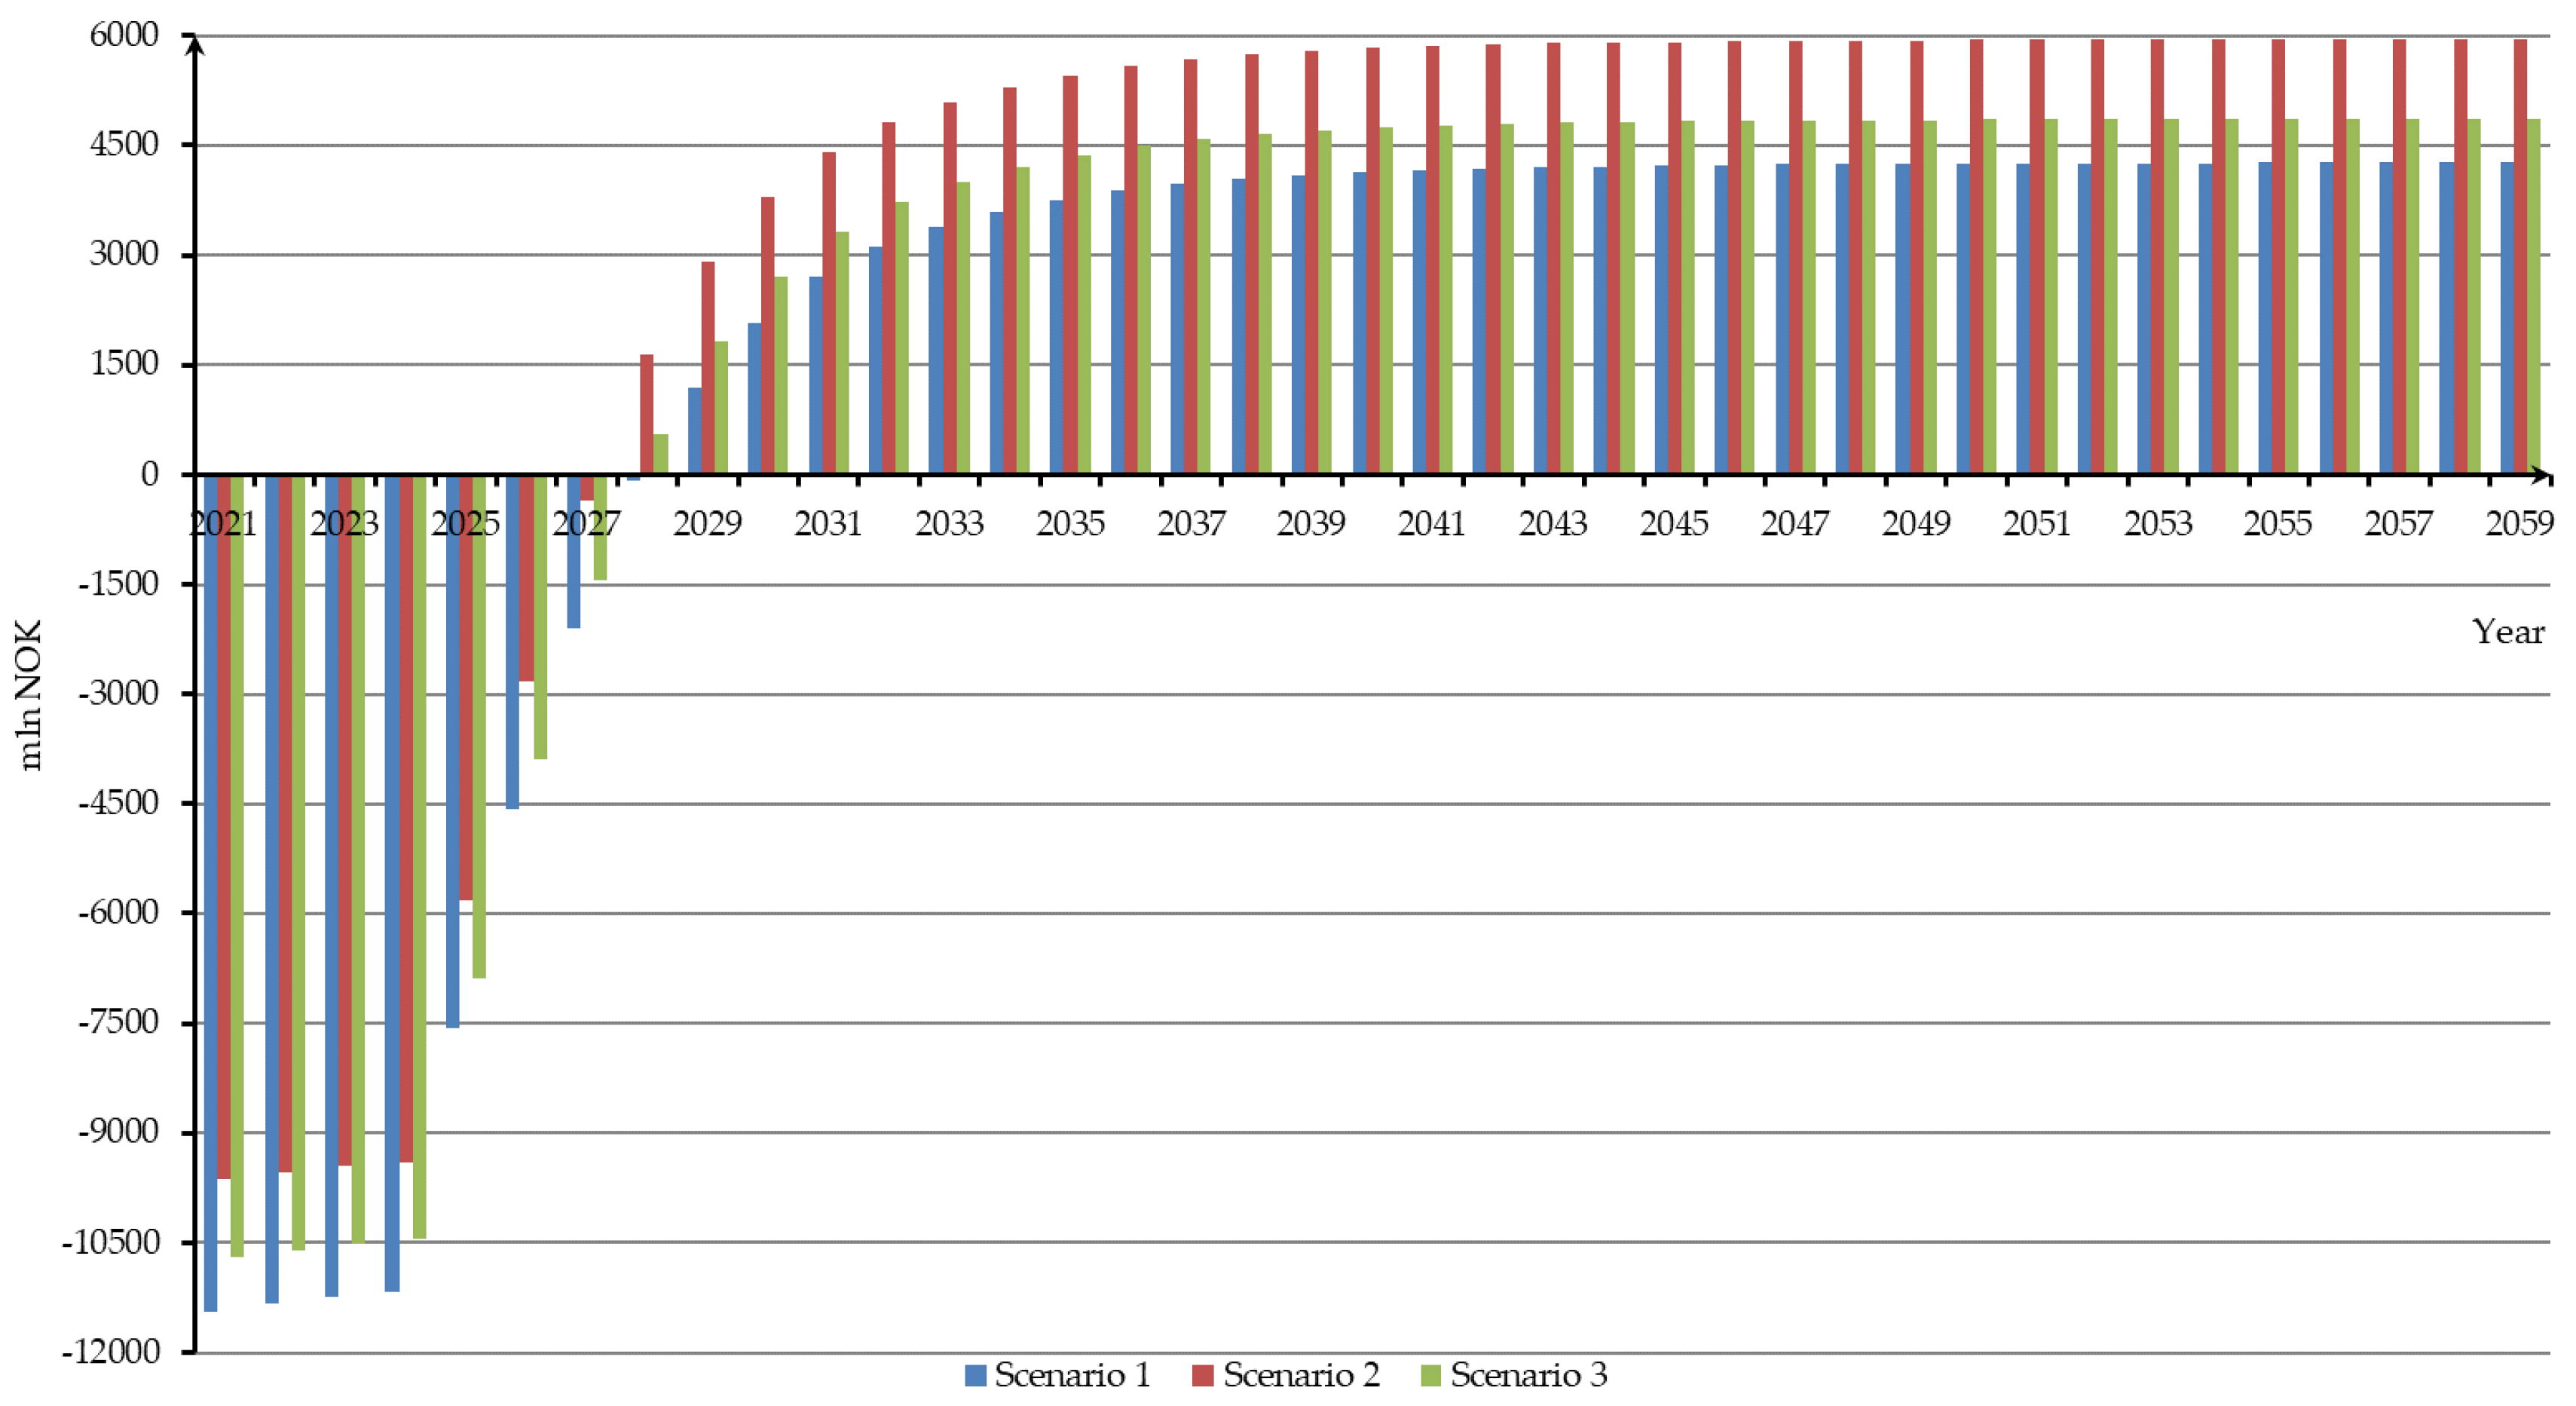
Figure 9, Scenario 2 is the most profitable choice for implementation.
The scenarios were subjected to technological (calculation of external loads) and economical (calculation of the economic effect of the project implementation) assessments. According to the results of the economical assessment, the most effective arrangement scenario is a system of steel-piled fixed platforms P2 and P3 with rigid foundations. Nevertheless, during the technological assessment, it was revealed that the processing platform P3 is unstable regarding overturning. Due to the impossibility of implementing Scenario 2, the construction of a system of subsea production centers will be the final decision. Paying attention to the environmental factor, it is worth noting that Scenario 3 requires less electricity (50 MW/year) and, as a result, emits the least amount of carbon dioxide into the atmosphere. This parameter is the most important in the framework of the decarbonization policy of the oil industry and the Norwegian continental shelf in particular [
27,
28]. Moreover, the use of subsea production centers minimizes the impact on vital functions of important fish species for Norway. The absence of surface equipment allows preservation of the current trawl routes passing through the Avaldsnes section.


