Article

On the Use of the Disability-Adjusted Life Year (DALY) Estimator as a Metric to Optimally Manage ICE Emissions

1
Istituto per la Tecnologia della Costruzione, Consiglio Nazionale delle Ricerche (CNR), Corso Stati Uniti 4, 35127 Padova, Italy
2
Department of Engineering and Management, University of Padua, Stradella San Nicola 3, 36100 Vicenza, Italy
*
Author to whom correspondence should be addressed.
Energies 2022, 15(12), 4386; https://doi.org/10.3390/en15124386
Submission received: 12 April 2022 / Revised: 1 June 2022 / Accepted: 13 June 2022 / Published: 16 June 2022

Abstract

:
We propose a new management strategy for engines equipped with automatic transmissions based on the damage to human health caused by emissions. The damage to human health is quantified by the years of life lost in a population due to disability or early death caused by exposure to pollutants. Various engine emissions share a common factor: damage to human health. Our strategy aims to keep engines running along the line of minimum damage instead of focusing on minimal fuel consumption. We applied the minimum damage strategy to the powertrain of a light vehicle to evaluate its effectiveness. In this work, we discuss this strategy’s effects on continuous variable transmission and seven gears automatic transmission and compare the classic minimum fuel consumption strategy to the minimum damage strategy. The latter results in a 50% reduction in damage compared with the minimum consumption strategy at the expense of an 8% increase in fuel consumption.

Graphical Abstract

1. Introduction

Regulations to limit vehicular emissions, enforced since the 1990s, have led to a continuous evolution of thermal engines and a consequent reduction in harmful emissions.
The regulated emissions for diesel and gasoline engines are the well-known CO, HC, NOX, and PM. The first two are the result of incomplete oxidation, while the third one arises mainly at high temperatures in the presence of an excess of oxygen. CO is toxic to humans because it hinders the transport of oxygen in the blood; the term HC includes a large variety of hydrocarbons, some of which are carcinogenic (benzene, some polycyclic aromatic hydrocarbons such as benzo(a)pyrene and dibenzo(a,l)pyrene). Nitrogen oxides cause respiratory diseases; they can combine with some HC to form O3. PM is mainly released by the diesel engine and is made up of carbonaceous particles coated with high molecular mass organic compounds. It penetrates deeper into the lungs the smaller its size. It causes lung diseases and is classified as a carcinogen.
The IARC [1] has recently classified diesel exhausts as belonging to Group 1, that is, carcinogenic to humans.
However, emission reduction can also be achieved through engine management, when allowed by the transmission, such as in vehicles equipped with CVT (continuously variable transmission), or by the degree of freedom allowed by a second energy source, such as in electric or hydraulic hybrid vehicles, and on a smaller scale, stepped automatic transmissions. In these cases, the powertrain control strategy plays a fundamental role.
There are many different energy management strategies for these vehicles in the literature. They can be divided into two groups: rule-based strategies and optimization-based strategies [2,3]. The strategies of the first group are designed based on heuristic considerations, human experience, and mathematical models without a priori knowledge of the driving cycle [4,5,6,7,8]. In particular, for powertrains equipped with CVT, the criteria used are based on predetermined load curves that the control system requires the engine to follow [9,10,11].
The simplest strategy is the speed envelope criterion, which is based on two curves that link the vehicle speed to the engine speed at two limit situations: overrun and strong acceleration, where the accelerator’s position is close to zero and the maximum value, respectively. The fuel economy of a vehicle can be improved by choosing a relatively low engine speed at cruising conditions.
The single-track criterion follows the minimum consumption curve faithfully and rapidly during transients. One of its variants envisages reaching the new static operating state by following curves that define two different driving modes: the economy and performance mode [9].
The rules-based strategies are easy to implement through lookup tables and guarantee optimal local management, but not optimal global management, i.e., extended over long periods [2,3].
However, these criteria do not consider emissions in any way except as a consequence of reducing consumption.
The control strategies of the second group derive from the optimization process of an objective function, which can be the fuel consumption, emissions, or a combination of both [2,3]. These methods are applied not only to hybrid electric [12,13,14] and hydraulic [15] vehicles but also to vehicles with traditional powertrains; this was the case for Masih-Tehrani et al. [16], who searched for the minimum cost function through genetic algorithms. In the cost function, each emission is multiplied by a normalization coefficient that is inversely proportional to the limit value of the emission and by a weight factor obtained by trial and error until the process reaches satisfactory values. On the other hand, Kazemi et al. [17] identified the strategy for managing minimum consumption and related control rules based on optimal control.
In the optimization strategies, the emissions are counted within the objective function together with the fuel consumption and the batteries’ state-of-charge [2,3]:
Objective Function = α × f + β × em + γ × SOC
where f, em, and SOC are, in general terms, the fuel consumption, the emissions, and the state-of-charge for the batteries, respectively; α, β, and γ are the relative weights, which can be varied to identify optimal management strategies and conditions for optimal Pareto [15,18,19].
The emissions, in turn, are expressed in various ways.
Hu et al. [20] and Tang et al. [21] considered the term em as the sum of the individual emissions mass. In this way, however, all emissions are considered equally dangerous, while some are known to be more dangerous than others.
The term em also represents the sum of the emission values multiplied by weights derived from standard limits [15,16] or subjective criteria that designate more dangerous emissions as more important. There is a certain degree of arbitrariness in this case because the standard limits are linked to the dangerousness of the emissions and the abatement technologies available.
Thibault [22], on the other end, considered the term em represented only by NOX because these compounds are the most dangerous. However, this choice can be reductive when applied as it tends to exclude other dangerous emissions, such as HC or PM, which are particularly important to diesel engines.
The works of Zentner [23] and Nuesch [24] are two particular cases. In the first case, the authors aimed to reduce CO2 during vehicle operation and transform CO2 minimization into an unconstrained problem whose objective function is the sum of CO2 emissions and other harmful emissions multiplied by the weights. These weights can be interpreted as equivalence factors that transform the problem into a minimization of the equivalent CO2. The values of the equivalence factors are identified through a procedure based on the Hamilton–Jacobi–Bellman (HJB) equation. The authors simplified some hypotheses, increasing the suitability of this procedure for onboard applications. The second case follows the same mathematical approach as the previous one and searches for fuel minimization strategies following reference trajectories for NOX emissions and the batteries’ state of charge [24].
In summary, since there are many emissions with different natures and dangerousness, their treatment within an objective function is complicated. In other words, there is no univocal criterion for assessing emissions that allows them to be treated as a whole, similarly to what happens for fuel consumption. However, if emissions could all be linked by a common element, defining that criterion would be a simple step.
Babcock [25], dealing with the problem of estimating total air pollution, moved in this direction using the air pollution index called Pindex. He converted the concentration of each emission into a single parameter through specific tolerance factors derived from the air standards.
The innovative proposal suggested here considers damage to human health as a common basis of all emissions. The damage to human health is quantified by the average number of years of life lost by a population due to disability or premature death caused by exposure to pollutants [26]. Damage is a more significant parameter than the mass value of each individual emission because it provides an immediate assessment of the danger for all emissions through a single number.
Therefore, the emissions within the objective functions, previously called em, can be replaced by the damage produced by a single emission or by the sum of the damages for all emissions involved, depending on the problem. This solution is possible for all optimization problems leading to both rule- and optimization-based control strategies.
For the former, damage as a substitute for emissions appears to be a particularly advantageous tool since it allows to define the management strategy for minimum damage as similar to that of the single-track type’s minimum fuel consumption [7,9].
The damage to human health as a substitute for individual emissions could form the basis for a future change in emission limit rules. In this case, the minimum damage strategy would help the action of the aftertreatment system to remain within the limits.
However, the minimum damage strategy could lead to excessive consumption, which would reduce the applicability of this type of management. Therefore, it is necessary to verify the effectiveness of the minimum damage strategy, i.e., if it involves a significant reduction in damage without excessive increases in consumption or if these reductions are small and lead to unacceptable increases in consumption.
The verification described in this work was conducted by comparing the performance of a light vehicle equipped with a powertrain with CVT and an automatic transmission powertrain. Both powertrains were managed according to minimum consumption and minimum damage strategies. The traditional gear-shifted powertrains were held as a benchmark.
The work will develop as follows: in Section 2, after the presentation of the method for calculating the damage caused by emissions, the management criteria for minimum consumption and minimum emissions will be defined and applied to some powertrains of a light vehicle; finally, in Section 3, the results are discussed, and some conclusions are drawn.

2. Materials and Methods

2.1. Assessment of Human Health Damage Due to Engine Emissions

Exposure to air pollutants reduces life expectancy caused by the onset of severe diseases of the respiratory and cardiovascular systems. This reduction can be quantified using the DALY quantity, which expresses, for a defined population, the years of life lost due to early death or disability caused by disease [25]. In the following analyses, the European Union population will be considered. The assessment of the damage to human health will be conducted through the Health Impact Assessment (HIA) [27], a procedure based on the IMPACT 2002+ Life Cycle Impact Assessment methodology (LCIA) [26,28]. Through appropriate conversion factors of medical origin, the LCIA directly quantifies the impact that each individual substance released into the environment has not only on human health but also on the environment and climate change. The LCIA procedure consists of the four steps represented in Figure 1 [29].
In the first step (“inventory”), an inventory of emissions released into the environment by an engine or by any thermal machine is built up. The second step (“characterization”) assigns each emission to the relevant impact categories and transforms it into an equivalent emission of a substance taken as reference. The third step (“damage assessment”) evaluates the damage caused by each equivalent emission in DALY units. In the last step, called “normalization”, the outcomes of the four damage categories are normalized by means of appropriate coefficients and summed up in a single value.
Since the HIA evaluates the impact of emissions on human health, the impact categories considered in the second phase of Figure 1 are only those related to human health, i.e., the first six, and the whole procedure stops at the third step.
The damage to health or D, caused by a substance released into the environment is provided by the product of the emitted substance’ mass, m, by the characterization factor cf, expressed in kg of equivalent substance for each kg of a substance emitted, and by the specific damage or sd, expressed as damage caused by the unit of mass of the equivalent substance [26,27].
D = m · c f · s d           [ k g · k g e q k g · D A L Y k g e q D A L Y ]
In general, the damage to health caused by n substances emitted will be [26,27]:
D t o t = j = 1 m ( i = 1 n ( m i , j c f i , j ) ) s d j [ D A L Y ]
where mi,j [kg] and cfi,j [kgref/kg] are the mass, and the characterization factor of the i-th substance belonging to the j-th impact category, respectively; sdj [DALY/kgref] is the specific damage for the j-th impact category.
Table 1 shows the cf and sd values for the engine regulated emissions, which are CO, NOX, PM, and HC. The first three emissions belong to the respiratory inorganics category, and the fourth, the HCs, to the respiratory organics category. It should be noted that for engines, unburned hydrocarbons are quantitatively comparable to VOCs.

2.2. Engine Management at Minimum Damage Conditions

In the engine map, given a generic quantity x = f (M, n) (where M is the engine torque, and n the engine speed), the set of minimum points for quantity x can be expressed as follows [7]:
ω | x ,   m i n = f ( P | x , m i n )
where the power P varies between the minimum and maximum powers of the engine map.
If the quantity x is the BSFC (Brake-Specific Fuel Consumption), the previous line is the optimal operating line (OOL). Pfiffner [7] suggested that OOL is the basis of the control system, which forces the engine to produce the required power at the minimum fuel consumption speed, as shown in Figure 2.
If x means the four regulated emissions, the minimum emission line for each can be identified. However, these lines are different since they refer to different compounds and with different genesis. In fact, CO, HC, and PM result from incomplete oxidation, whereas NOX results from excessive oxidation and is mainly favored by high temperatures. This fact prevents a single curve of minimum emissions from being imposed on the engine, similar to what has been seen for OOL.
However, the four emissions can be unified by the concept of damage: each emission is associated with the damage it produces (rewritten from Equation (3)):
D ( M , n ) = m ( M , n ) · c f · s d
and the total damage is the sum of the damage produced by each emission:
D t o t ( M , n ) = D ( M , n )  
The minimum total damage line can be identified and used as a target for the engine control system for a low-emission operation, or a trade-off operation between fuel economy and emissions.
The total damage could also be used at the engine calibration level, in order to prioritize the damage or any other trade-off condition considered interesting.

2.3. Application of the Minimum Damage Management Criterion to a Passenger Vehicle

This section will evaluate the effectiveness of the minimum damage criterion in reducing the emissions of an engine during on-road operation. The evaluation will be conducted by comparing the performance of the mathematical model of a compact SUV equipped with the following powertrains:
-
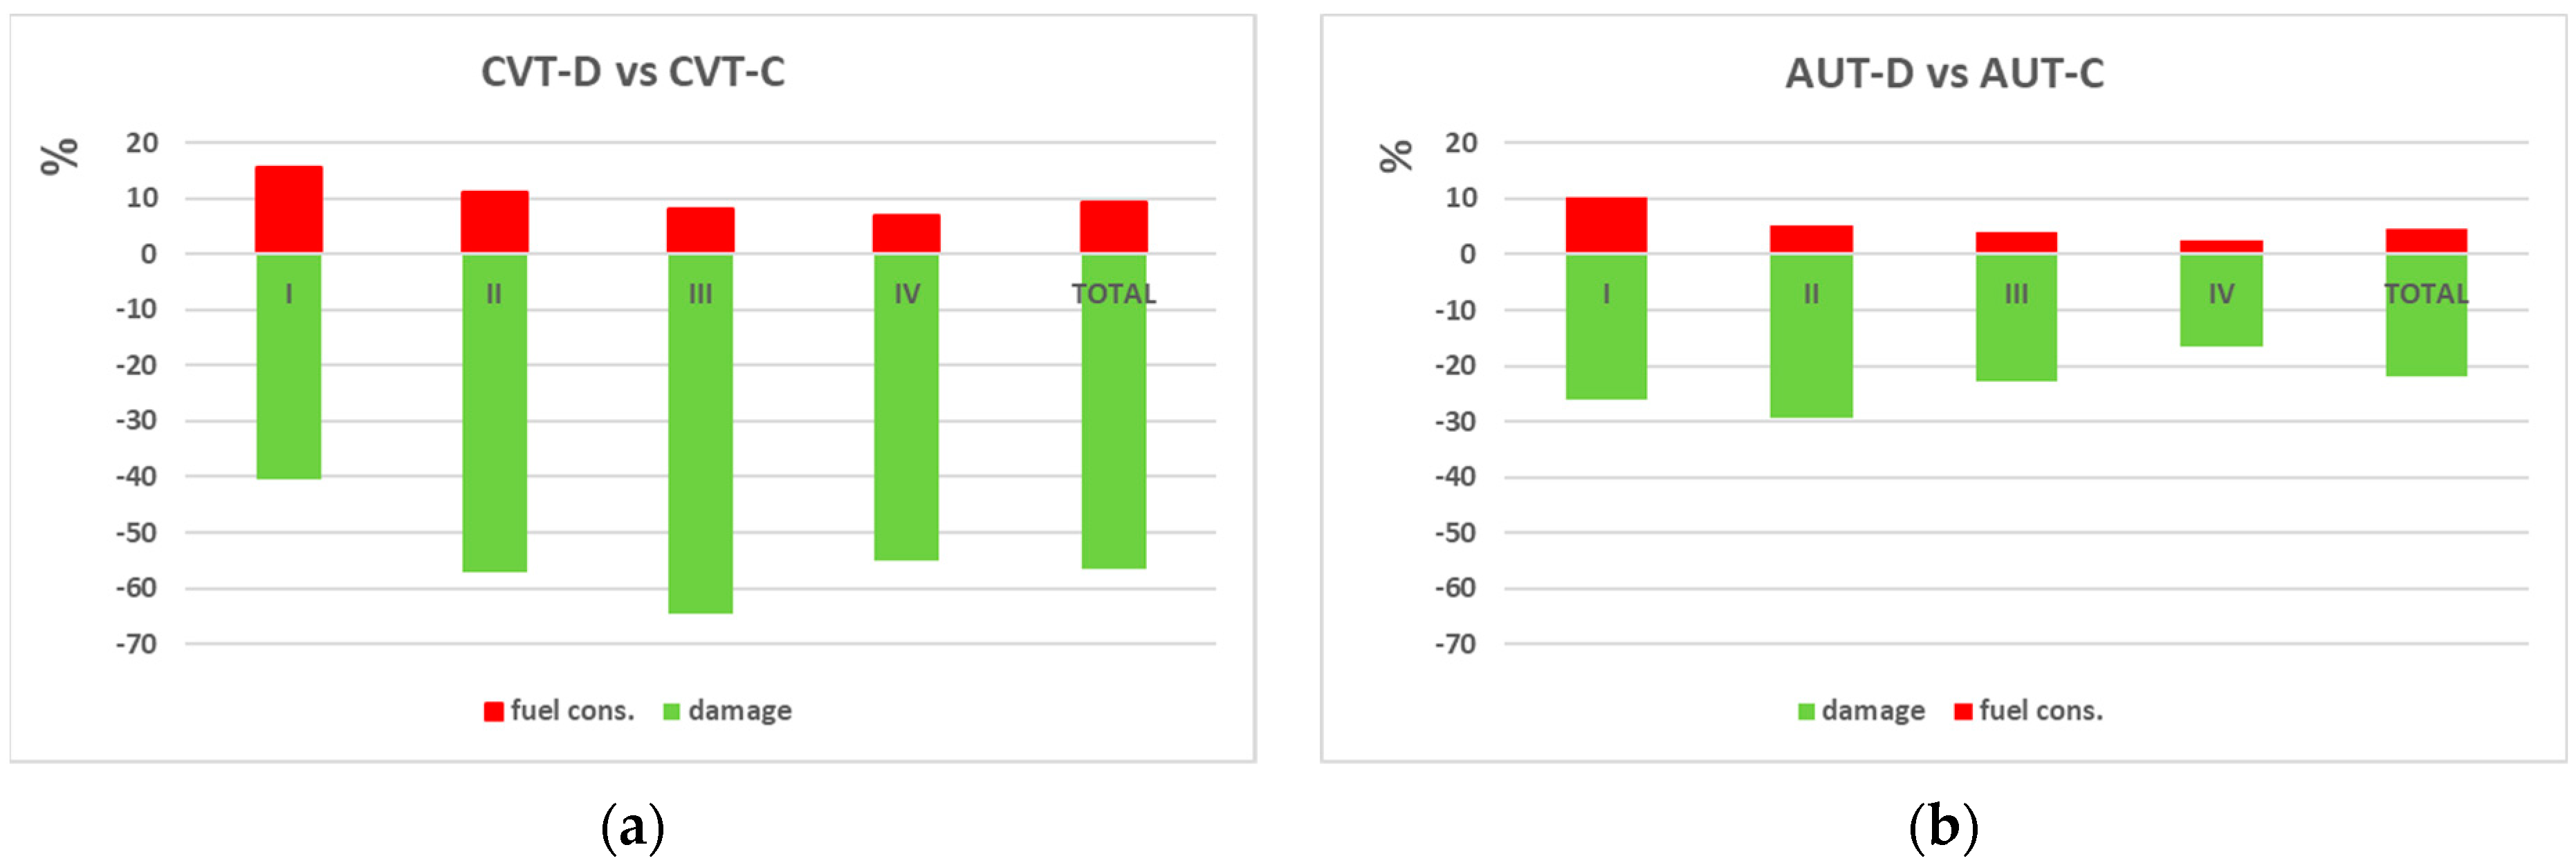
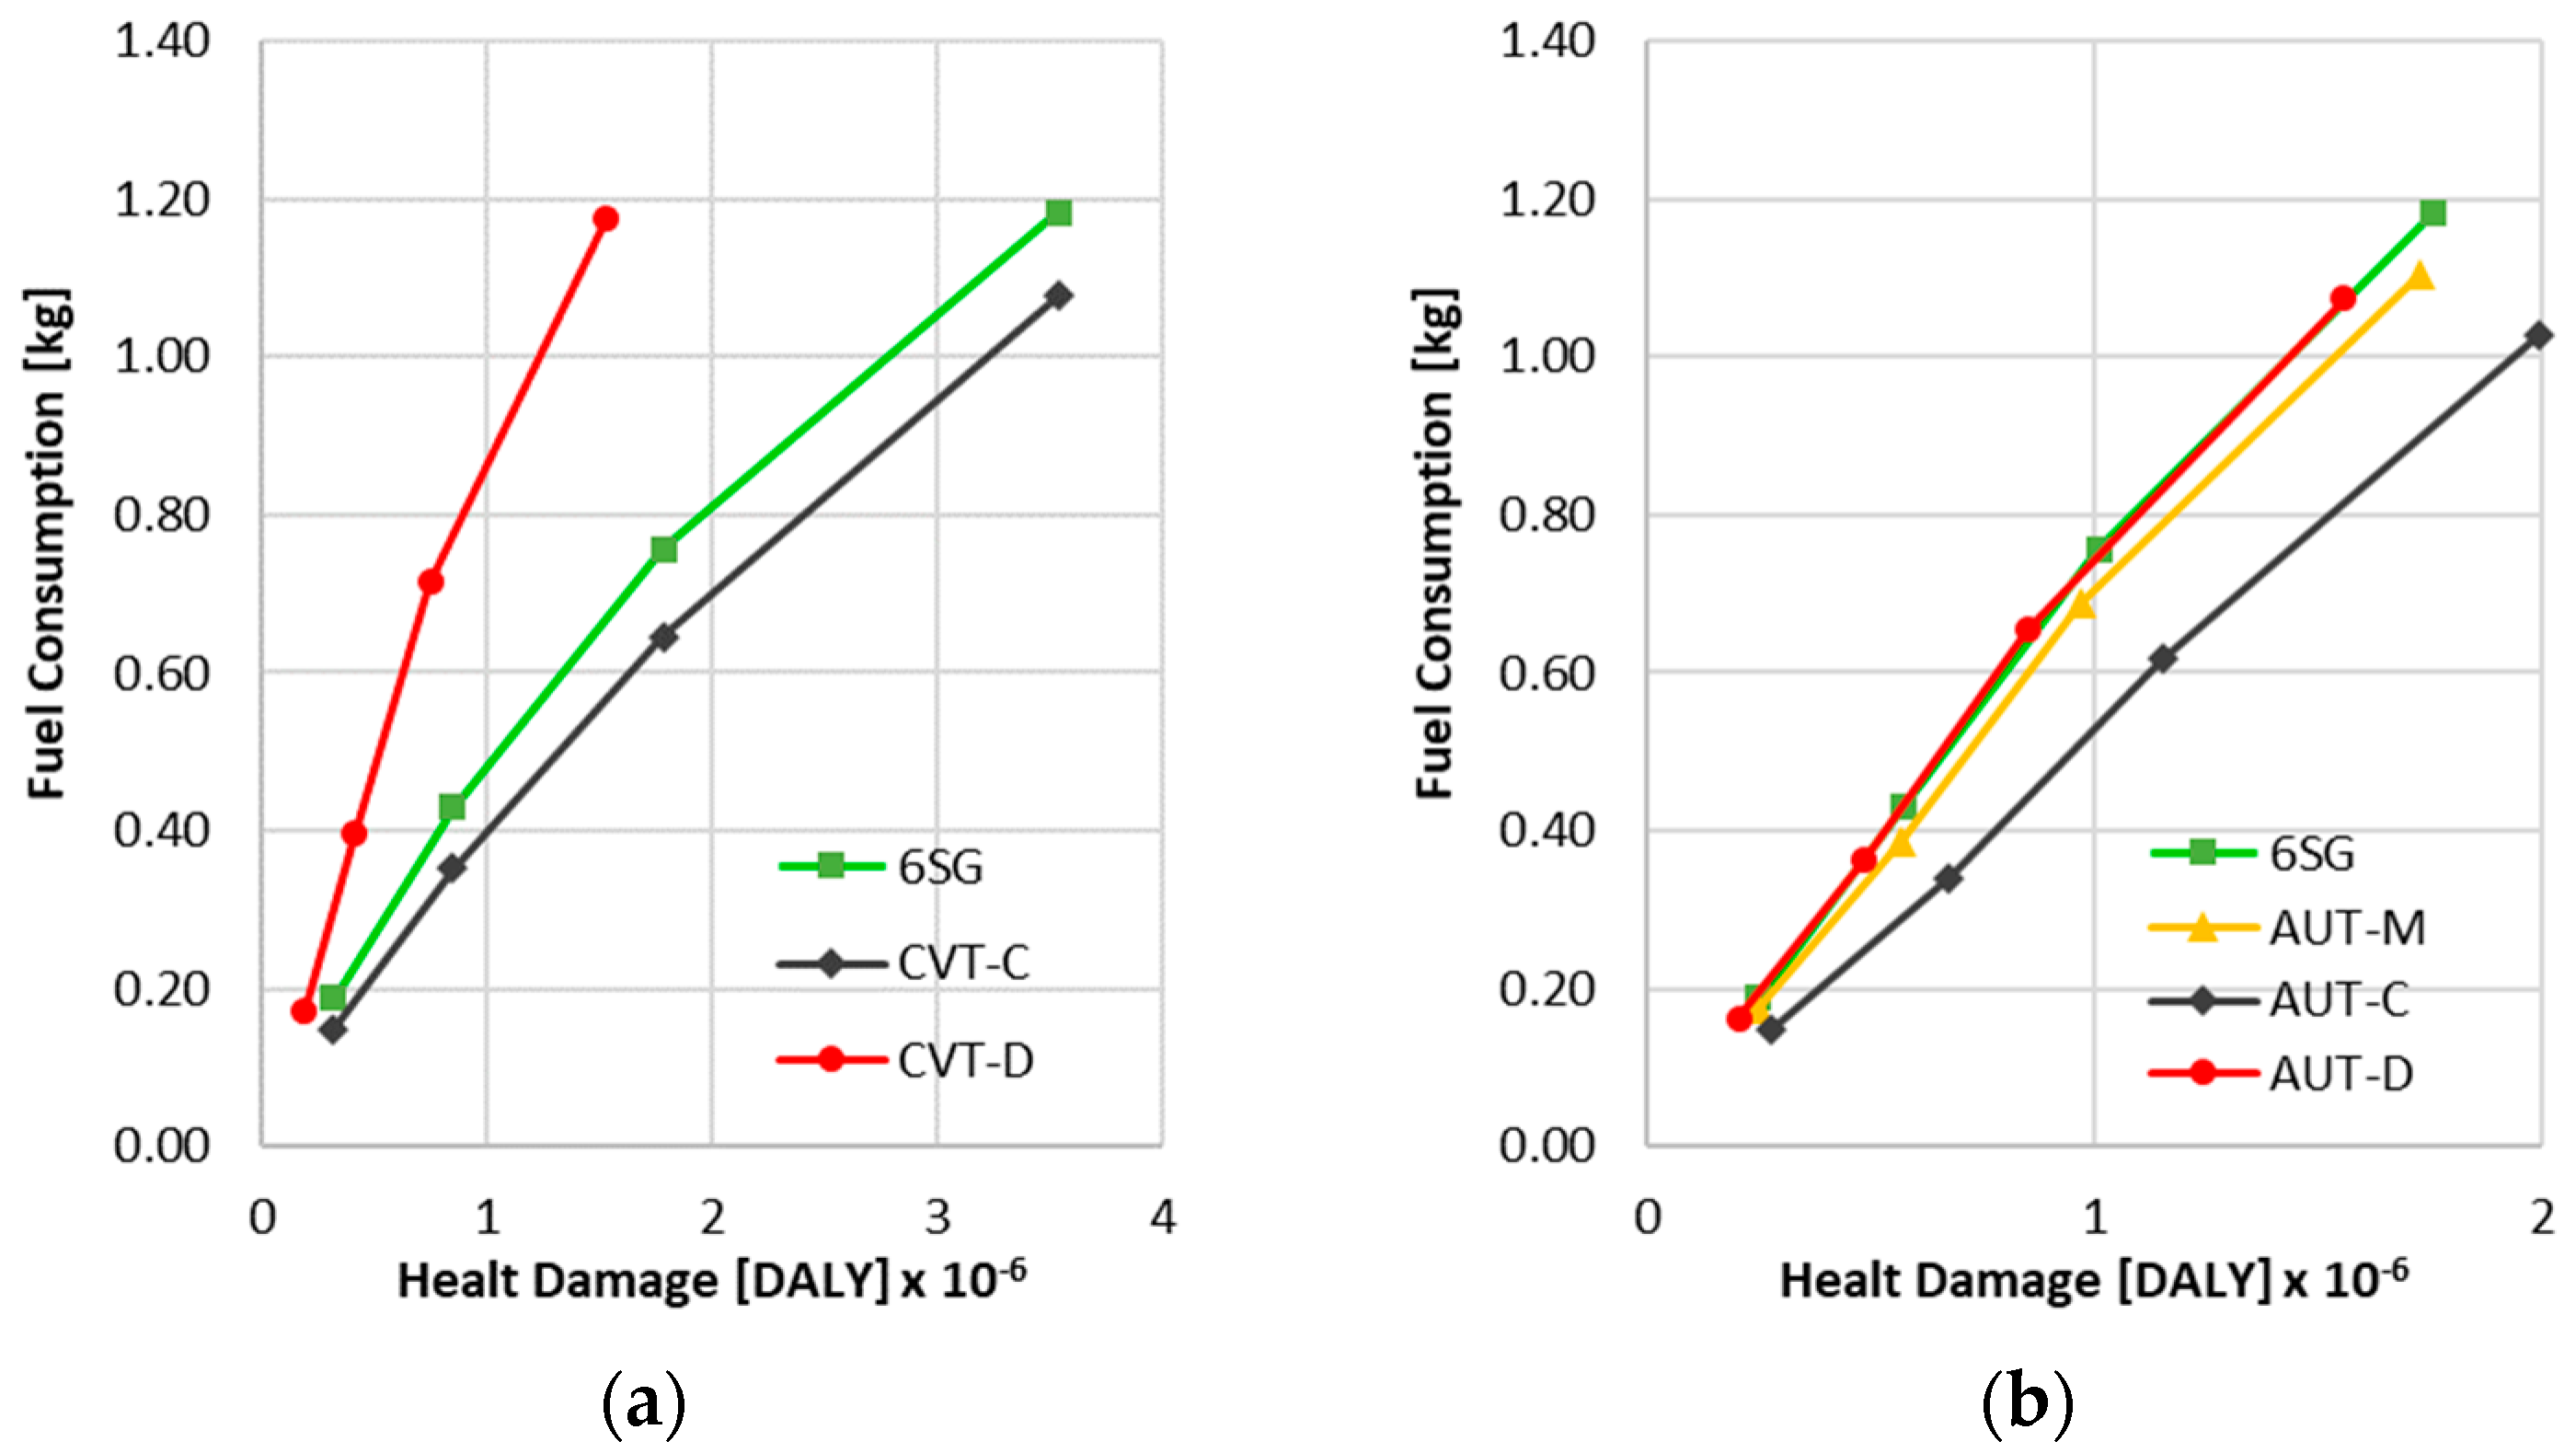
Diesel engine with automatic transmission managed according to the minimum consumption strategy (hereinafter referred to as AUT-C), the minimum damage strategy (AUT-D), and, for a fair comparison, the manual gear shift strategy (AUT-M);
-
Diesel engine with continuous transmission managed according to the minimum consumption strategy (hereinafter referred to as CVT-C) and the minimum damage strategy (CVT_D);
-
Reference powertrain: diesel engine with traditional 6-speed transmission (hereinafter referred to as 6SG).
It is worth underlining that the models of these powertrains are necessarily simplified, because their purpose is not simulation of a real-world application, but only the comparison between the emissions and the damage of different powertrains in order to highlight the behavior of the minimum damage criterion.

2.3.1. Vehicle Model

The main vehicle data are shown in Table 2.
The engine is a 1.9 L turbodiesel, 4 cylinders, 108 kW at 3900 rpm, EURO IV, whose map is shown in Figure 3 (the engine data were kindly provided by Institute of Sciences and Technologies for Sustainable Energy and Mobility (STEMS) of the National Research Council (via Guglielmo Marconi, 4, 80125, Napoli, Italy)). The iso-BSFC and the minimum BSFC line are reported in the same figure. The latter was identified according to the procedure of Section 2.
Figure 4 shows on the engine map the four regulated emissions, CO, HC, PM, and NOX, measured after the catalytic converter. The iso-level curves and curve of minimum emission were calculated for each emission according to the procedure of Section 2. The curves of minimum damage of each of the four emissions coincide with the curves of minimum emission since there is only a constant proportionality between the emission and damage values. For this reason, the former are not shown in Figure 4.
Finally, Figure 5 shows the iso-level curve of the total damage, calculated as the sum of the damage associated with individual emissions, and the curve of the minimum total damage.
It is worth remembering that the shape of the iso-level lines is related to the engine calibration. For this engine, while the CO, HC, and PM curves are close to each other, the NOX curve is lower than these (Figure 4d). Furthermore, the minimum total damage and the minimum NOX damage curves are not very far from one other; therefore, the damage caused by NOX is much greater than that caused by the other three emissions. This finding is not so much due to the NOX characterization factor, which is 0.127 versus 1 for PM (Table 1), but to the engine’s greater amount of produced NOX.

2.3.2. Transmission Modeling and Simulations

The baseline 6 step gear (6SG) was simulated assuming the gear ratios of 13.9, 7.2, 4.6, 3.6, 2.5, and 2.1, including the axle ratio (from Seat Ateca 85 kW [30]). The overall efficiency of 0.9 was assumed for the whole driveline.
The gear ratios for the AUT driveline, including the axle gear, are 16.0, 9.1, 7.5, 2.9, 3.0, 2.4, and 2.5 (from Seat Ateca DSG 110 kW [30]). The same average efficiency of the manual 6GS was assumed, equal to 0.9. The CVT driveline was supposed to be infinitely variable, such as the hydro-mechanical transmission or a chain belt CVT coupled with a torque converter with lock-up. The efficiency was then lowered to 0.8, considering the higher losses of these systems compared with mechanical gears.
The power request for a given mission instant P is obtained considering the inertial, drag, and rolling loads according to the values presented in Table 2.
Given the vehicle speed v, wheel radius rwheel, and loads, the ICE working point was computed according to the actual gear box ratio τ, the differential gear ratio τdiff, and the transmission average efficiency η [31]:
n = 30 π τ · τ d i f f   v r w h e e l
M = 1 τ · τ d i f f   P   r w h e e l η   v
The 6SG shifts were defined based on the actual engine speed assuming a maximum engine speed of 3000 rpm and a minimum of 1000 rpm, whereas the AUT and the CVT transmission were controlled to follow the minimum fuel consumption (-C) or health damage (-D). Whereas the CVT can precisely follow the optimum curve defined in Equation (4), the AUT driveline can only approximate this line by choosing one of the available gear ratios. The gear change was then set to adopt the gear realizing the minimum difference between the actual ICE speed and target value.
All numerical models were subjected to the standard WLTC cycle, which comprises four different segments, as shown in Table 3 [32].

3. Results and Discussion

The five powertrain models described above were simulated along with the four phases of the WLTC path and total path. For example, Figure 6 shows the shifting points, the instantaneous fuel consumption, and instantaneous damage of the 6SG powertrain along the WLTC path.
Observe the instantaneous damage peaks corresponding to the vehicle accelerations. These peaks are particularly high in the fourth part of the cycle, where the power demands are the highest. This behavior is due to the high damage values found in the engine map at high power levels (see Figure 5), which essentially depend on the high NOX emissions at high power levels, as seen from the diagram in Figure 4d.
The damage produced along the WLTC cycle as a function of fuel consumption is shown in Figure 7. It highlights the effects of the management criteria on the same powertrain: the CVT in Figure 7a and the AUT in Figure 7b. The damage curves of the 6GS powertrain are shown as references.
The CVT-C powertrain exhibits surprising behavior (Figure 7a) as it produces more than double the damage as criterion D. This behavior is a consequence of the shape of the minimum consumption and minimum damage curves (Figure 3 and Figure 5). When the engine follows the minimum consumption line, it operates in an area where NOX emissions are higher, whereas, when the engine follows the minimum damage curve, the consumption value is not very far from the minimum values, especially at high torques.
In Figure 7b, the shift from the manual criterion to the minimum consumption criterion implies a reduction in fuel consumption, as it should be, but also an increase in damage, as already seen for the CVT. In this case, however, the increase is less evident because the AUT-C operating points do not strictly follow the minimum consumption line but they can move halfway between the two minimum lines, in areas where the specific damage is lower (see Figure 3 and Figure 5). The change from manual to automatic gearbox (AUT-M vs. AUT-D) produces a reduction in damage of about 10%, as was to be expected.
The picture is completed with the comparison between the powertrains with a manual gearbox: 6SG (6-speed gearbox) vs. AUT_M (7-speed gearbox). Figure 7b shows that the change from 6 to 7 ratios does not substantially modify the damage produced but reduces consumption by about 7%.
To better understand the effects of strategy D, targeted comparisons will be conducted. At first, strategy D and strategy C will be compared based on the same powertrain. In this way, it will be possible to verify whether the damage reduction that strategy D ensures leads to excessive increases in consumption. Subsequently, strategies C and D will be compared using the traditional strategy to identify their possible strengths.
Strategies D and C are compared and summarized in Figure 8a,b for the CVT and AUT powertrains, respectively. The values in the two Figures refer to those of strategy C. For the CVT powertrain, the reduced damage exceeds 50% in every cycle phase, except in the congested one, where it settles at 40%. At the same time, increases in fuel economy range from 15 to 7%. For the AUT powertrain, criterion D involves lower damage reductions than in the previous case and lower fuel economy increases. To explain this difference in behavior, it must be remembered that the two transmissions have different average efficiency. The CVT transmission, which has lower efficiency, requires the engine to produce greater power for the same vehicle demand and, therefore, greater fuel consumption. The greater power demand causes the engine to work with higher BMEP values and, therefore, higher NOX emissions and consequently greater damage.
Figure 9 shows the percentage changes in fuel economy (kg/km) and kilometer damage (DALY/km) with respect to the values of the 6GS powertrain for both CVT and AUT powertrains. The values refer to each phase (red columns) and to the total path (green column) of the WLTC cycle.
The CVT-C (Figure 9a) produces consumption reductions ranging from 20% for the congested phase to a 1% increase in motorway conditions. However, as previously observed, the damage increases considerably instead of decreasing due to the reduced quantities burned, up to double in the high-speed sections.
The CVT-D (Figure 9b) produces negligible consumption reductions compared with the 6GS case (0.5% on average, with an increase of 8% in the motorway section); however, it leads to a 12% average damage reduction. Similar to CVT-C, AUT-C (Figure 9c) produces large reductions in fuel economy compared with 6SG (13%); however, it also produces a small increase in damage (13%).
On the other hand, AUT-D (Figure 9d) shows both a reduction in fuel economy (9%) and a reduction, albeit modest, in damage (11%).

4. Conclusions

This work proposes a new way to evaluate the emissions produced by a thermal machine. Our approach was based on damage to human health, which is expressed as the number of years of life lost by a population due to disability or early death caused by exposure to pollutants. Instead of considering the emissions by their individual concentrations, we propose using the sum of the damage caused by them. In this way, the emissions directly link to consequences on human health, and a single value identifies their dangerousness as immediately perceptible.
This paradigm shift suggests the possibility of managing an engine equipped with a continuous transmission under conditions of minimum damage; thus, offering an additional tool to make engines “cleaner”. To evaluate the effectiveness of this proposal, the criteria of minimum consumption and minimum damage were applied to both a continuous and an automatic transmission designed for an SUV vehicle. As a reference, the transmission with a 6-speed manual gearbox was kept.
Limited to the case examined here, our analyses highlighted the following points:
  • The minimum damage strategy can be easily implemented, as it does not require additional hardware, just a different calibration of the engine control system.
  • The minimum damage strategy involved significant reductions compared with the minimum fuel consumption strategy. These reductions were greater in CVT than in Automatic. In fact, the powertrain with CVT showed a 55% reduction in health damage, whereas the powertrain with automatic transmission only 20%. However, the reductions are associated with 9 and 4% increases in fuel consumption, respectively. Therefore, a compromise criterion between the two proposed strategies could be more advantageous for the powertrain with CVT.
  • By comparing the behaviors of the two strategies with the reference one, a rather surprising fact can be observed. While allowing for significant reductions in fuel consumption, the minimum fuel consumption strategy cannot guarantee damage reductions. On the contrary, it caused damage increases reaching up to 50%. On the other hand, the minimum damage strategy reduced both fuel consumption and damage for both powertrains considered.
These results should be considered to be strictly valid for the engine considered here. However, since the conformation of the engine map, which has the minimum consumption in high torque areas and minimum NOX emissions in low torque areas, follows the typical trends of engine maps, it can be concluded that these results still express a general behavior.
The minimum damage strategy, here applied to a light vehicle, can also be applied to heavy vehicles equipped with hydrostatic (forklifts, shunting locomotives, heavy vehicles, etc.) or hydromechanical transmissions (agricultural tractors, reach stackers, wheel loaders, etc.), which are transmissions that benefit most from the minimum damage strategy.

Author Contributions

Conceptualization, A.M., A.R. and N.A.; methodology, A.M., A.R. and N.A.; resources, N.A.; writing—review and editing, A.M., A.R. and N.A. All authors have read and agreed to the published version of the manuscript.

Funding

This research was funded by DOR 2020 of the University of Padua.

Institutional Review Board Statement

Not applicable.

Informed Consent Statement

Not applicable.

Data Availability Statement

Not applicable.

Conflicts of Interest

The authors declare no conflict of interest.

References

  1. IARC. Monographs on the Evaluation of the Carcinogenic Risks to Humans. 2022. Available online: https://monographs.iarc.who.int/agents-classified-by-the-iarc/ (accessed on 2 May 2022).
  2. Zhang, F.; Wang, L.; Coskun, S.; Pang, H.; Cui, Y.; Xi, J. Energy Management Strategies for Hybrid Electric Vehicles: Review, Classification, Comparison, and Outlook. Energies 2020, 13, 3352. [Google Scholar] [CrossRef]
  3. Huang, Y.; Wang, H.; Khajepour, A.; Lib, B.; Jic, J.; Zhao, K.; Hue, C. A review of power management strategies and component sizing methods for hybrid vehicles. Renew. Sustain. Energy Rev. 2018, 96, 132–144. [Google Scholar] [CrossRef]
  4. Shabbir, W.; Evangelou, S.A. Real-time control strategy to maximize hybrid electric vehicle powertrain efficiency. Appl. Energy 2014, 135, 512–522. [Google Scholar] [CrossRef]
  5. Hofman, T.; Steinbuch, M.; van Druten, R.M.; Serrarens, A.F.A. Rule-based energy management strategies for hybrid vehicle drivetrains: A fundamental approach in reducing computation time. IFAC Proc. Vol. 2006, 39, 740–745. [Google Scholar] [CrossRef] [Green Version]
  6. Bonsen, B.; Steinbuch, M.; Veenhuizen, P.A. CVT ratio control strategy optimization. In Proceedings of the 2005 IEEE Vehicle Power and Propulsion Conference, Chicago, IL, USA, 7 September 2005; ISBN 0-7803-9280-9. [Google Scholar] [CrossRef]
  7. Pfiffner, R.; Guzzella, L.; Onder, C.H. Fuel-optimal control of CVT powertrains. Control Eng. Pract. 2003, 11, 329–336. [Google Scholar] [CrossRef]
  8. Jiang, Q.; Ossart, F.; Marchand, C. Comparative Study of Real-Time HEV Energy Management Strategies. IEEE Trans. Veh. Technol. 2017, 66, 10875. [Google Scholar] [CrossRef] [Green Version]
  9. Srivastava, N.; Haque, I. A review on belt and chain continuously variable transmissions (CVT): Dynamics and control. Mech. Mach. Theory 2009, 44, 19–41. [Google Scholar] [CrossRef]
  10. Macor, A.; Rossetti, A. Fuel consumption reduction in urban buses by using Power Split transmissions. Energy Convers. Manag. 2013, 71, 159–171. [Google Scholar] [CrossRef]
  11. Macor, A.; Rossetti, A. Control strategies for a powertrain with hydromechanical transmission. Energy Procedia 2018, 148, 978–985. [Google Scholar] [CrossRef]
  12. Montazeri-Gh, M.; Mahmoodi-k, M. Development a new power management strategy for Power Split hybrid electric vehicles. Transp. Res. Part D 2015, 37, 79–96. [Google Scholar] [CrossRef]
  13. Hafner, M.; Isermann, R. Multiobjective optimization of feedforward control maps in engine management systems towards low consumption and low emissions. Trans. Inst. Meas. Control. 2003, 25, 57–74. [Google Scholar] [CrossRef]
  14. Tang, L.; Rizzoni, G. Energy Management Strategy Including Battery Life Optimization for a HEV with a CVT. In Proceedings of the 2016 IEEE Transportation Electrification Conference and Expo, Asia—Pacific (ITEC), Busan, Korea, 1–4 June 2016. [Google Scholar]
  15. Johri, R.; Filipi, Z. Optimal energy management of a series hybrid vehicle with combined fuel economy and low-emission objectives. Proc. IMechE Part D J. Automob. Eng. 2014, 228, 1424–1439. [Google Scholar] [CrossRef]
  16. Masih-Tehrani, M.; Ebrahimi-Nejad, S.; Dahmardeh, M. Combined fuel consumption and emission optimization model for heavy construction equipment. Autom. Constr. 2020, 110, 103007. [Google Scholar] [CrossRef]
  17. Kazemi, R.; Raf’at, M.; Reza Noruzi, A. Nonlinear Optimal Control of Continuously Variable Transmission Powertrain. Hindawi Publishing Corporation. ISRN Automot. Eng. 2014, 2014, 479590. [Google Scholar]
  18. Maddumage, W.; Perera, M.; Attalage, R.; Kelly, P. Power Management Strategy of a Parallel Hybrid Three-Wheeler for Fuel and Emission Reduction. Energies 2021, 14, 1833. [Google Scholar] [CrossRef]
  19. Anwar, H.; Vishwanath, A.; Chunodkar, A. Qadeer Ahmed Comprehensive Energy Footprint Benchmarking of Strong Parallel Electrified Powertrain. arXiv 2021, arXiv:2106.00243. [Google Scholar]
  20. Hu, X.; Zhang, X.; Tang, X.; Lin, X. Model predictive control of hybrid electric vehicles for fuel economy, emission reductions, and inter-vehicle safety in car-following scenarios. Energy 2020, 196, 117101. [Google Scholar] [CrossRef]
  21. Tang, X.; Chen, J.; Liu, T.; Qin, Y.; Cao, D. Distributed Deep Reinforcement Learning-Based Energy and Emission management Strategy for Hybrid Electric vehicles. IEEE Trans. Veh. Technol. 2021, 70, 9922–9934. [Google Scholar] [CrossRef]
  22. Thibault, L.; Sciarretta, A.; Degeilh, P. Reduction of pollutant emissions of diesel mild hybrid vehicles with an innovative energy management strategy. In Proceedings of the 2017 IEEE Intelligent Vehicles Symposium (IV), Redondo Beach, CA, USA, 11–14 June 2017. [Google Scholar]
  23. Zentner, S.; Asprion, J.; Onder, C.; Guzzella, L. An equivalent emission minimization strategy for causal optimal control of diesel engines. Energies 2014, 7, 1230–1250. [Google Scholar] [CrossRef] [Green Version]
  24. Nüesch, T.; Cerofolini, A.; Mancini, G.; Cavina, N.; Onder, C.; Guzzella, L. Equivalent Consumption Minimization Strategy for the Control of Real Driving NOx Emissions of a Diesel Hybrid Electric Vehicle. Energies 2014, 7, 3148–3178. [Google Scholar] [CrossRef] [Green Version]
  25. Babcock, L.R., Jr. A combined pollution index for measurement of total air pollution. J. Air Pollut. Control. Assoc. 1970, 20, 653–659. [Google Scholar] [CrossRef] [PubMed] [Green Version]
  26. Jolliet, O.; Margni, M.; Charles, R.; Humbert, S.; Payet, J.; Rebitzer, G.; Rosenbaum, R. IMPACT 2002+: A New Life Cycle Impact Assessment Methodology. Int. J. Life Cycle Assess. 2003, 8, 324. [Google Scholar] [CrossRef] [Green Version]
  27. Macor, A.; Benato, A. Regulated Emissions of Biogas Engines—On Site Experimental Measurements and Damage Assessment on Human Health. Energies 2020, 13, 1044. [Google Scholar] [CrossRef] [Green Version]
  28. Frischknecht, R.; Jungbluth, N.; Althaus, H.-J.; Bauer, C.; Doka, G.; Dones, R.; Hischier, R.; Hellweg, S.; Humbert, S.; Köllner, T.; et al. Implementation of Life Cycle Impact Assessment Methods; Ecoinvent Report No. 3, v2.0; Swiss Centre for Life Cycle Inventories: Dübendorf, Switzerland, 2007. [Google Scholar]
  29. SimaPro 7—PRé Consultants, The Netherlands. 2009. Available online: https://simapro.com/wp-content/uploads/2020/10/DatabaseManualMethods.pdf (accessed on 11 April 2022).
  30. Available online: https://www.seat.com/content/dam/public/seat-website/myco/2028/car-shopping-tools/brochure-download/brochures/ateca/other-shoppingtools-brochure-ateca-specs-final-october-2019.pdf (accessed on 7 December 2021).
  31. Grote, K.H.; Antonsson, E.K. Springer Handbook of Mechanical Engineering; Springer: Berlin/Heidelberg, Germany, 2009. [Google Scholar] [CrossRef]
  32. Available online: https://dieselnet.com/standards/cycles/index.php (accessed on 6 December 2021).
Figure 1. Structure of an LCIA procedure (adapted from [29]).
Energies 15 04386 g001
Figure 2. Engine map: iso-BSFC lines, iso-power lines, and optimal operating line.
Energies 15 04386 g002
Figure 3. Engine map with the iso-BSFC lines and the minimum BSFC line (white dotted line).
Energies 15 04386 g003
Figure 4. Iso-level and minimal emission curves for (a) CO; (b) HC; (c) PM; (d) NOX (white dotted lines).
Energies 15 04386 g004aEnergies 15 04386 g004b
Figure 5. Iso-level curve of the total damage and curve of the minimum total damage (white dotted line).
Energies 15 04386 g005
Figure 6. (a) WLTC cycle (blue line) and shifting points (red line) for the 6SG powertrain; (b) instantaneous fuel consumption (red line) and damage (blue line) for the 6SG powertrain.
Energies 15 04386 g006aEnergies 15 04386 g006b
Figure 7. Total cumulative damage over the WLTC cycle for CVT (a) and AUT (b) and 6SG powertrains. The dots refer to the end of the four phases of the WLTC cycle.
Energies 15 04386 g007
Figure 8. (a) Percentage difference in fuel economy (red bar) and kilometer damage (green bar) for the CVT-D powertrain compared to the CVT_C; (b) the same for the AUT-D powertrain compared to the AUT_C.
Energies 15 04386 g008
Figure 9. Percentage change in fuel economy and kilometer damage of the CVT (a,b) and AUT (c,d) powertrains compared to the 6GS powertrain. Red columns refer to the four phases of the WLTC cycle, and the green column refers to the total path of the cycle.
Energies 15 04386 g009
Table 1. Values of the coefficients for the damage calculation according to HIA [29].
Emissioncfunitsdunit
CO1.04 × 10−3kg PM2.5 eq/kg7.00 × 10−4DALY/kg PM2.5 eq
NOx1.27 × 10−1kg PM2.5 eq/kg7.00 × 10−4DALY/kg PM2.5 eq
PM2.51kg PM2.5 eq/kg7.00 × 10−4DALY/kg PM2.5 eq
VOCs6.07 × 10−1kg C2H4 eq/kg2.13 × 10−6DALY/kg C2H4 eq
Table 2. Main data of the vehicle.
Vehicle mass = 2500 kg.
Wheel radius = 0.35 m
Transmission ratio of the differential gear = 4
Frontal area of the vehicle = 3 m2
Air density = 1.2 kg/m3
Wheel road friction coefficient = 0.01
Drag coefficient = 0.6
Table 3. WLTC Class 3b (v_max ≥ 120 km/h) [32].
PhaseDurationStop DurationDistancep_stopv_maxv_ave w/o stopsv_ave w/stopsa_mina_max
ssm km/hkm/hkm/hm/s2m/s2
Low 3589156309526.5%56.525.718.9−1.471.47
Medium 3-243348475611.1%76.644.539.5−1.491.57
High 3-24553171626.8%97.460.856.7−1.491.58
Extra-High 3323782542.2%131.394.092.0−1.211.03
Total180024223,266
Publisher’s Note: MDPI stays neutral with regard to jurisdictional claims in published maps and institutional affiliations.

