Article

Wind Power Potential in Highlands of the Bolivian Andes: A Numerical Approach

1
Aero-Thermo-Mechanics, Université Libre de Bruxelles, Avenue F. D. Roosevelt 50, CP 165/41, 1050 Brussels, Belgium
2
Centro Universitario de Investigaciones en Energia, San Simon University, 2500 Cochabamba, Bolivia
*
Author to whom correspondence should be addressed.
Energies 2022, 15(12), 4305; https://doi.org/10.3390/en15124305
Submission received: 12 May 2022 / Revised: 7 June 2022 / Accepted: 9 June 2022 / Published: 12 June 2022
(This article belongs to the Collection Feature Papers on Wind, Wave and Tidal Energy)

Abstract

:
Wind resource assessment is a key factor for the development and implementation of wind farms with the purpose of generating green, eco-friendly and clean electricity. The Bolivian Andes, as a large dry region, represents an important source of renewable energy. However, the altitude and high wind energy resources of the Bolivian Andes require further knowledge and understanding of the wind energy resources. In this study, the GWA have been used to determine the total area available to install wind farms considering the protected areas, roads, cities and transmission lines. In addition, the Weather Research and Forecasting (WRF v3.8.1) model is employed to complement the results of the GWA based on the validation of WRF simulations with measurements from Qollpana wind farm. The main purpose is to estimate the wind power potential along the Bolivian Andes and its variability in time. The wind power simulations have been compared with the power generated by the Qollpana wind farm to verify the WRF’s performance. The wind power potential in the highlands of the Bolivian Andes could reach between 225 (WRF) and 277 (GWA) GW, distributed mainly over the Western and Eastern Cordillera of the Altiplano.

1. Introduction

Wind resource assessment is essential for developing clean and eco-friendly electricity. However, high quality data about wind speed and meteorology are required for the implementation of wind farms [1]. The implementation of wind farms in Latin America has been slower compared with the USA, Europe and China. The installed capacities of wind energy are: 117.7 GW (USA), 207.7 GW (Europe), 282 GW (China), and 34.6 GW (Latin America) [2]. Although, Latin America has high wind energy potential, the hydropower energy has been extensively exploited and accepted due to their dispatchability and the high potential in the region. However, wind and solar power will be needed as complementary sources of renewable energy under the context of decarbonization of electricity and climate change [3,4].
Wind energy potential has been estimated by different approaches, such as measurements with meteorological masts [5,6], numerical models or a combination of approaches [1]. Numerical Weather and Prediction models have been used for wind energy assessment, and Weather Research and Forecasting (WRF) [7], since version 3.8, has included a wind farm parameterization to represent the wind turbine’s momentum sink in the main wind flow as well as the transference of kinetic energy into electricity and turbulent kinetic energy [8]. WRF has been used for the wind energy assessment in Brazil [9], Chile [10], Tanzania [11], Portugal [12] and Alaska [13]. In regard to wind resource data, the Global Wind Atlas (GWA) was developed, which combines mesoscale and microscale modelling (downscaling process) to provide wind climate data at high horizontal resolution (250 m). During the downscaling process, the ERA5 dataset from the European Centre for Medium-Range Weather Forecasts (ECMWF), the WRF model and WAsP were employed [14]. The GWA has several advantages, such as being freely available online, high-resolution global onshore coverage, mean wind speed, mean wind power density maps and the use of a ruggedness index (RIX) layer over the maps.
The Bolivian Andes is a vast region with different climates and weather. This could be divided in three regions, Altiplano and the Western and Eastern Cordilleras [15]. The Altiplano is a high plateau with an altitude of 3800 masl characterized by its low temperature, low density, high radiation and dry weather. The Western Cordillera consist of high peaks and as an arid region that serves as the natural border with Chile. On the other hand, the Eastern Cordillera of the Bolivian Andes is mountainous, with variable altitudes and a moist climate [16]. Wind energy at high altitude is still under research with the implementations and studies of wind farms being carried out in Tibet [17]. However, there are challenges in the implementation of wind farms in such high-altitude conditions. The main challenges are related to the environmental conditions such as wind energy and power resources; the altitude, which implies high solar radiation; and lower density due to the lower atmospheric pressure. For instance, for the high radiance, an enhanced thermal insulation and protector against solar irradiation could be necessary. The lower air density means lower wind energy, less cooling capacity and also less wake effects. However, all these challenges could be solved by increasing the blade length, implementing a different cooling system in the converter and electric system and, finally, a lower wake effect could be considered as one point in favor because we could increase the density of wind turbines per land area [17,18].
Nowadays, the electricity generation system in Bolivia is based on thermoelectric (2478 MW), hydropower (735 MW), solar (165 MW), and wind (27 MW) plants [19]. The Qollpana wind farm is the only working wind plant in the Bolivian highlands and is located in the center of country at an altitude of 2860 m above sea level (masl) [18]. Recently, three wind farms were installed in Warnes, San Julian and El Dorado, with installed capacities of 14.4, 39.6 and 54 MW, respectively. These wind farms are located close to Santa Cruz city at an altitude of 340 masl [20,21]. The wind farms in Bolivia are distributed over the Andes (Qollpana) and the Amazon (Santa Cruz), which have different topographies and meteorologies. The operation of these wind farms will provide important perspectives for the development of wind energy in Bolivia. Currently, the wind energy potential in the Bolivian Andes has been insufficiently studied and analyzed for a sustainable energy development in the region.
In this study, suitable sites for wind farms in the Bolivian Andes are explored using GWA and WRF v3.8.1 models. The major objective of our work is to estimate the wind power potential over the Bolivian Andes considering different wind turbine arrangements and different numerical approaches and using the GWA and WRF models. Initially, sites with wind speeds higher than 7.5 m/s (high-wind sites) were identified using GWA, and unavailable lands are excluded to determine the available land for wind farms. Secondly, WRF simulations were run to build a wind speed map. Subsequently, high-wind sites were determined under the same conditions imposed in the GWA. The wind power was computed using wind speed and simulated using the wind farm parameterization. The simulations with the WRF model are verified with the wind speed and the wind power in Qollpana. Finally, the power and energy generation are analyzed and compared with the electricity generation in Bolivia.

2. Methodology

2.1. Description of the Site and Data

The area of interest in this study is the high-land of the Bolivian Andes. This region is located between 14 and 23 southern latitude and 63 and 70 western longitude. The Bolivian Andes could be divided into three regions: Altiplano, Western and Eastern Cordillera. The altitude in the Altiplano is homogeneous around 3900 m above sea level (masl), and that area is mostly flat. On the other hand, the Western Cordillera is a mountainous region with the highest peaks of the Bolivian Andes, also serves as a natural border with Chile. The Easter Cordillera is highly mountainous region that limits the Andes and the Amazon and its altitude varies between 6500 and 800 masl; however, for this study, high-altitude is considered places higher than 2000 masl. The reference year was selected in function of wind index in Uyuni (extracted from Mamani and Hendrick [22]). Uyuni was selected due to its representativeness taking into account that Uyuni city is located in the center of the Bolivian Altiplano. The year selected was 2020 because the wind index for that year was 1.04, and a comparison of the monthly mean wind speed of 2020 and 1980–2020 is shown in Figure 1.

2.2. Validation and Grid Sensitivity Analysis in WRF Model

The validation of the wind speed and wind power was performed at Qollpana wind farm, located in the Eastern Cordillera region ( 17.631 , 65.279 as the center of the domain). The simulations consisted of one-way nested simulations with 1, 3 and 9 km horizontal grid-spacing. The simulation was run for 9 days starting 2 April 2017 with 10 min sampling. Then, the wind speed at 80 m was compared with measurements at the same height. The physics models were configured according to Mamani and Hendrick [23], and the PBL scheme was the one by Mellor–Yamada Nakanishi Niino [24]. Additionally, wind power generated by Qollpana I was validated with the simulations because it was fully operational during the time of the simulations. The power generation by the wind farm was extracted from the National Committee of Dispatch’s web page [21].
Wind speed and wind power were analysed based on the MAE and RMSE. Additionally, wind power was analysed based on the wind energy generated by day and for the 9-day period under study. The power generated by the wind farm is available on the CNDC’s webpage [21], which reports the instantaneous power every hour.

2.3. Wind Power Potential in the Bolivian Andes by WRF Model

Nine consecutive days in April, July, September and December were simulated in the WRF v3.8.1 model. The simulations were between the second and eleventh days of each month, starting at 00 UTC, and those had an additional 12 h of spin-up. The simulations were executed using WRF-ARW v3.8.1 with a domain size of 300 grids × 300 grids ( 17.631 , 65.279 as center of the domain), 9 km of grid-spacing and 53 vertical levels. The wind speed at 100 m above ground level was computed to determine the high-wind sites over the Bolivian Andes.
The wind power generation in the Bolivian Andes was performed using the wind speed from WRF, the power curve of two different wind turbines, GW 121/2.5 and V 136/3.45, and two different wind turbine arrangements. The arrangements consisted of (spanwise) Sy = 3.49D and (streamwise) Sx1 = 7.85D and Sx2 = 5.24D. The wind farm efficiency was assumed to be 0.80. The wind speeds for high-altitude sites were corrected according to [25] to compute the wind power using the power curve of the GW 121/2.5 and V 136/3.45 wind turbines. Hereafter, the sx1v and sx1g arrangements mean Sx1 streamwise with V 136/3.45 and GW 121/2.5 wind turbine, respectively. sx2v or sx2g will be used when the Sx2 arrangement is employed.
Using the wind farm parameterization [8], the wind power (sx2v) was simulated in September and compared with power computed by using the wind speed and the wind power curve. Each grid with wind speeds higher than 7.5 m/s has 246 wind turbines (sx2v arrangement) and could be considered as a wind farm. To analyze the impact of neighboring wind farms, three adjacent grids are selected to compare wind power, wind direction and wind speed simulated with and without wind farm parameterization. This study used estimated thrust and power coefficients derived from the manufacturer power curve, although Fitch [26] highlights the importance of using the manufacturer data. Using constraints such as mean wind speed higher than 7.5 m/s and altitude higher than 2000 m above sea level provides two advantages. First, the high mean wind speed (7.5 m/s) ensures a low-level cost of electricity. Due to the variability in electricity prices, such as energy policy, legislation and wind power penetration, the cost assumptions for economic assessments would quickly become outdated. Second, the high-altitude condition (2000 masl) intends to avoid sites with forests, productive lands and biodiversity (plants and animals) because the high altitude prevents more birds and vegetation from being impacted.

2.4. Global Wind Atlas Evaluation in the Bolivian Andes

The Global Wind Atlas (GWA) 3.0 is a free, web-based application to identify high-wind areas. The GWA was analyzed to determine the wind power potential in the Andes. The conditions to determine the available area are 2000 m above sea level and wind speed higher than 7.5 m/s, without considering protected areas [27], cities [28], roads and transmission lines. The roads and transmission lines were excluded considering a buffer of 200 m based on [29,30]. However, cities were excluded indirectly using sub-transmission line data and a buffer of 100 m [28]. The buffer distances were considered according the European regulations [31] due to no regulations existing for wind farms in Bolivia.

3. The Wind Power Potential in the Bolivian Andes by GWA

The wind atlas developed by the GWA 3.0 shows, in Figure 2, the sites with high wind speed in the Bolivian Andes and the available sites, where the protected areas, roads, transmission lines and cities are excluded from the initial high-wind area.
The high wind speed area reached 32,544 km2. From that area, the protected area (5495 km2), transmission lines (78 km2), roads (127 km2) and populated areas (333 km2) were extracted to have an available area of 26,511 km2. The highest area to consider is the protected areas, and commonly, those spaces increase with time in a function of diversity under risk.
The high-wind regions in the Bolivian Andes are distributed from North to South along the Eastern and Western Cordilleras. These results are supported by previous works [22]. However, the GWA uses the WRF model, ERA5 datasets, the WAsP model and a 250 m resolution, which provide highly reliable estimations. In contrast to the advantage of a high spatial resolution, the disadvantage is the overestimation of wind speed when the terrain is mountainous and complex [32]. The complexity of the terrain could be evaluated using the Ruggedness index (RIX), as is shown in Figure 3. The highest RIX indices are over the Eastern Cordillera of the Andes, where important high-wind sites are located. To complement the reliability of the wind power potential, the WRF model has been employed.
Figure 2 displays the protected areas, transmission lines and medium tension lines (cities). The major unsuitable area consists of two protected locations: Eduardo Avaroa National Park (Southwest) and Tunari National Park (center of the country). The second area includes the populated areas concentrated in the central region of the country. The main cities at high altitude are La Paz, Oruro, Cochabamba, Sucre, Potosi and Tarija. However, only Cochabamba (center) and the towns around it have high wind energy potential.

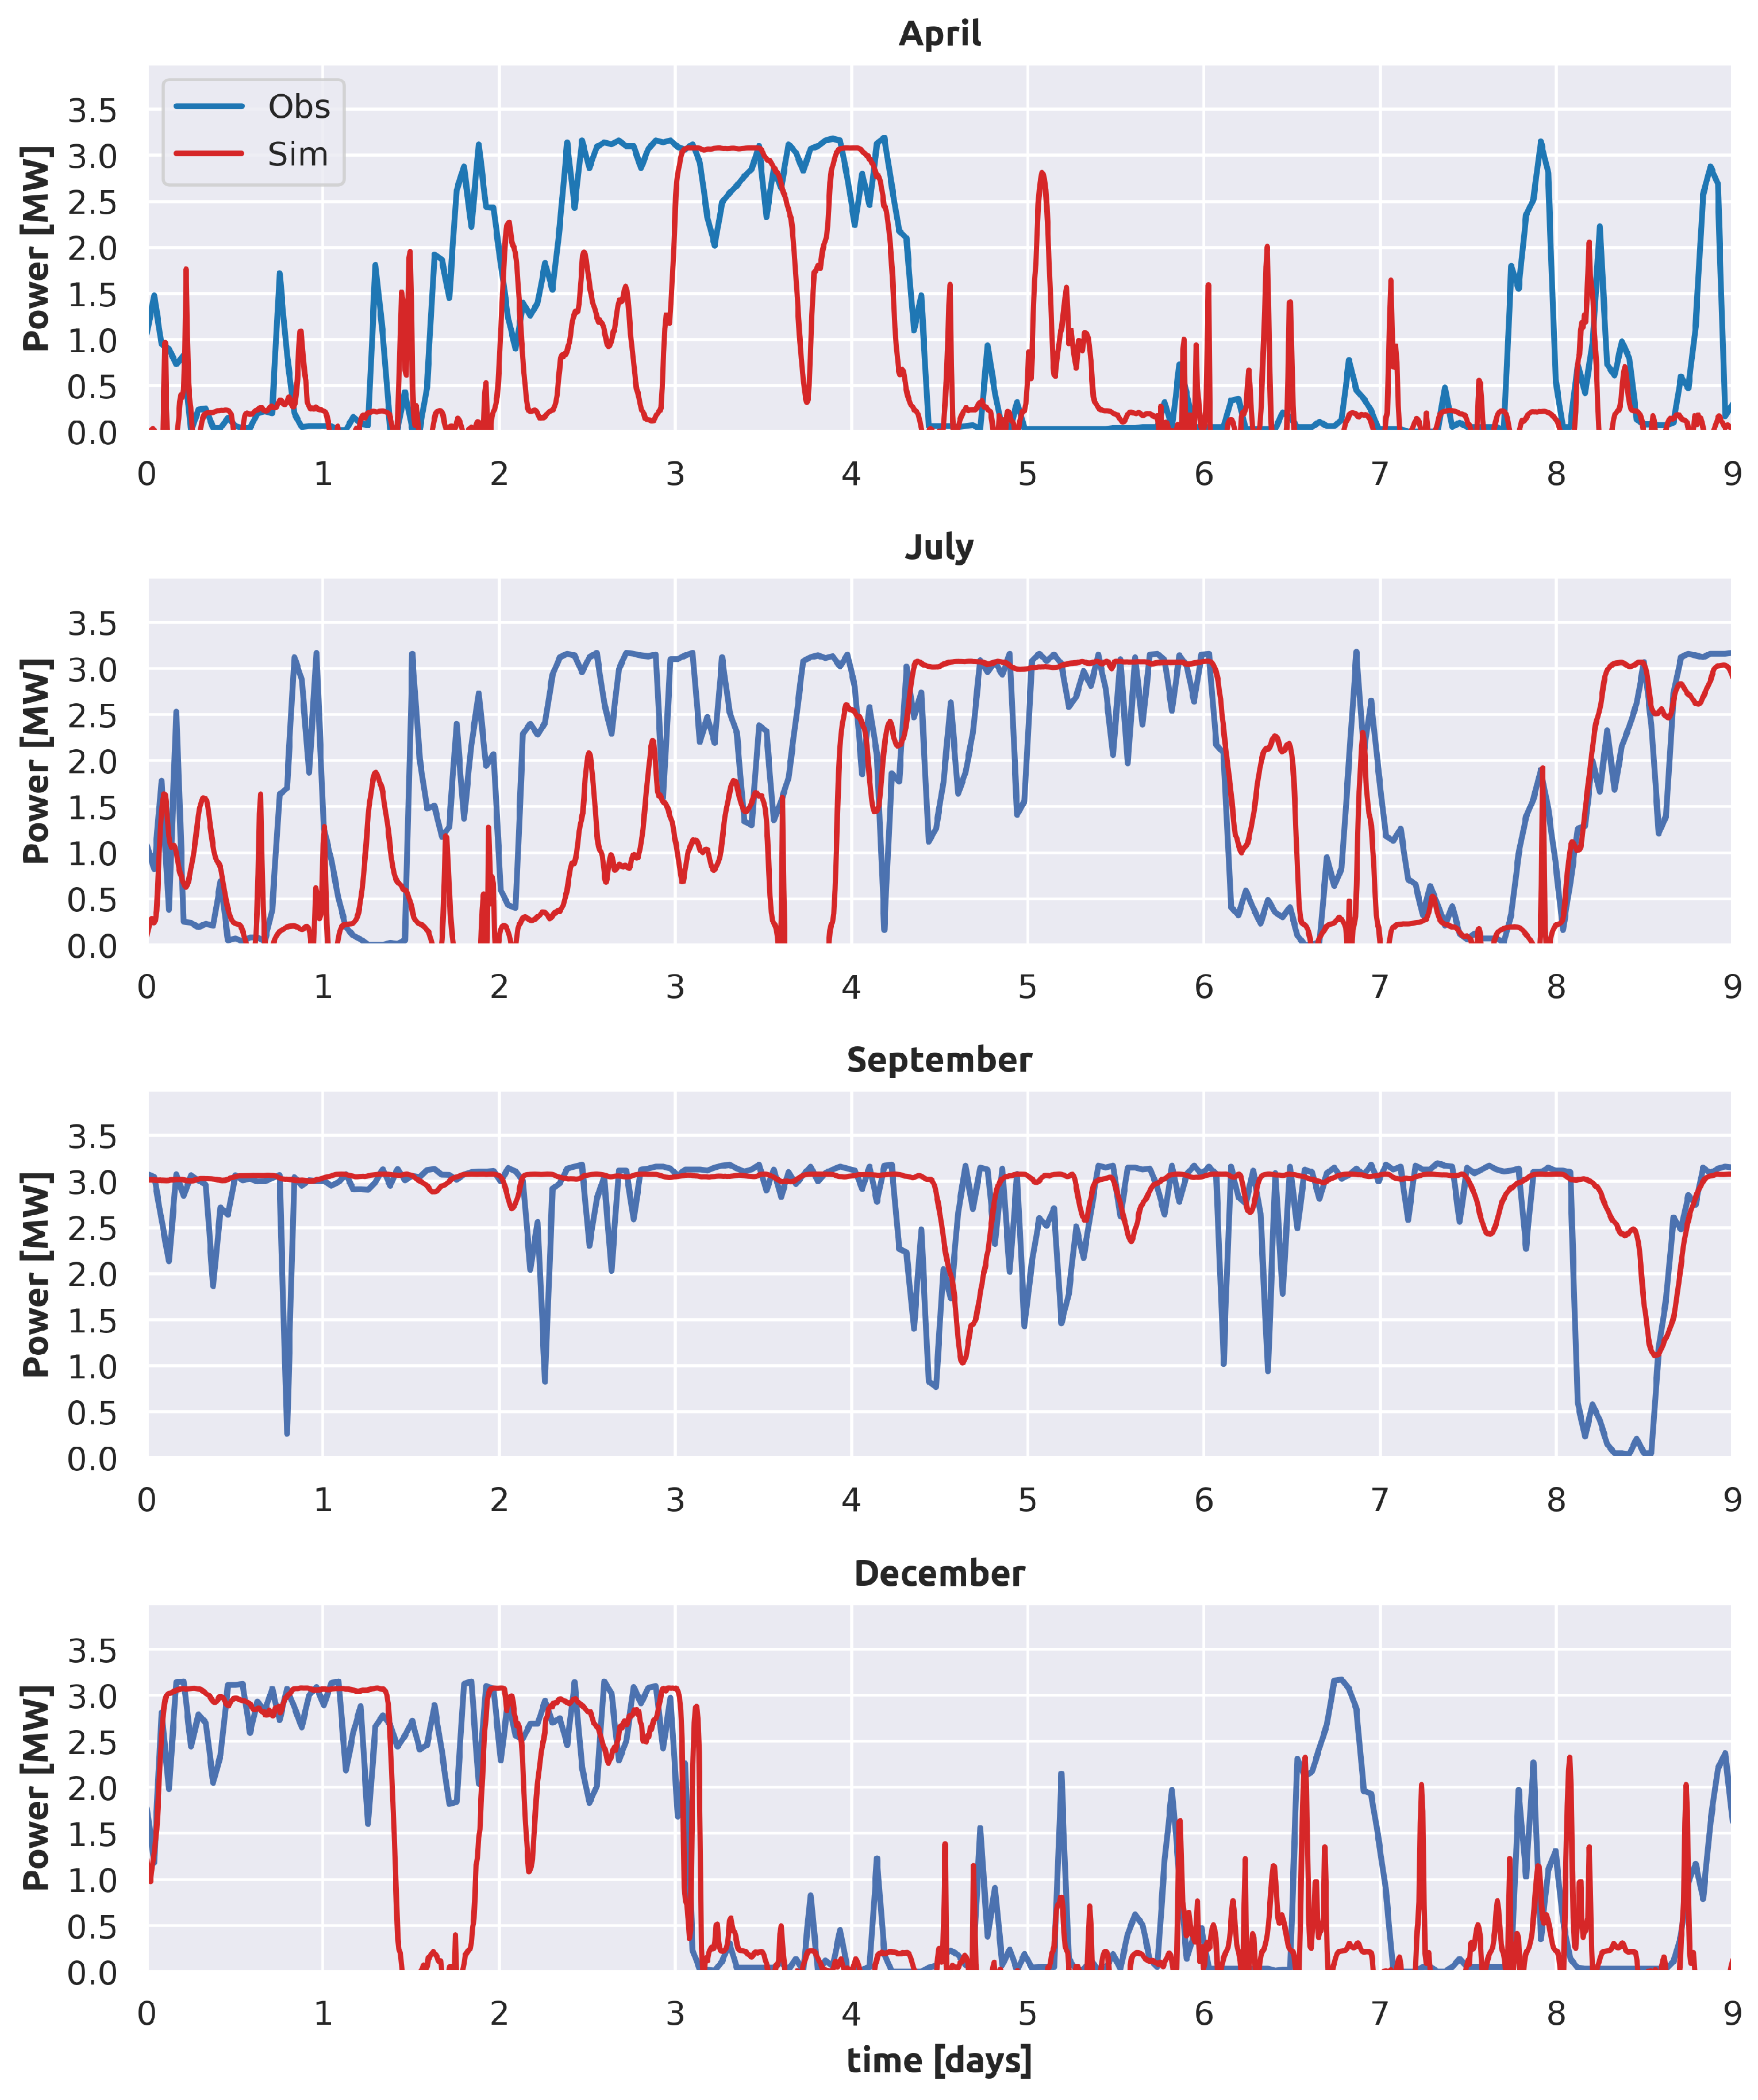
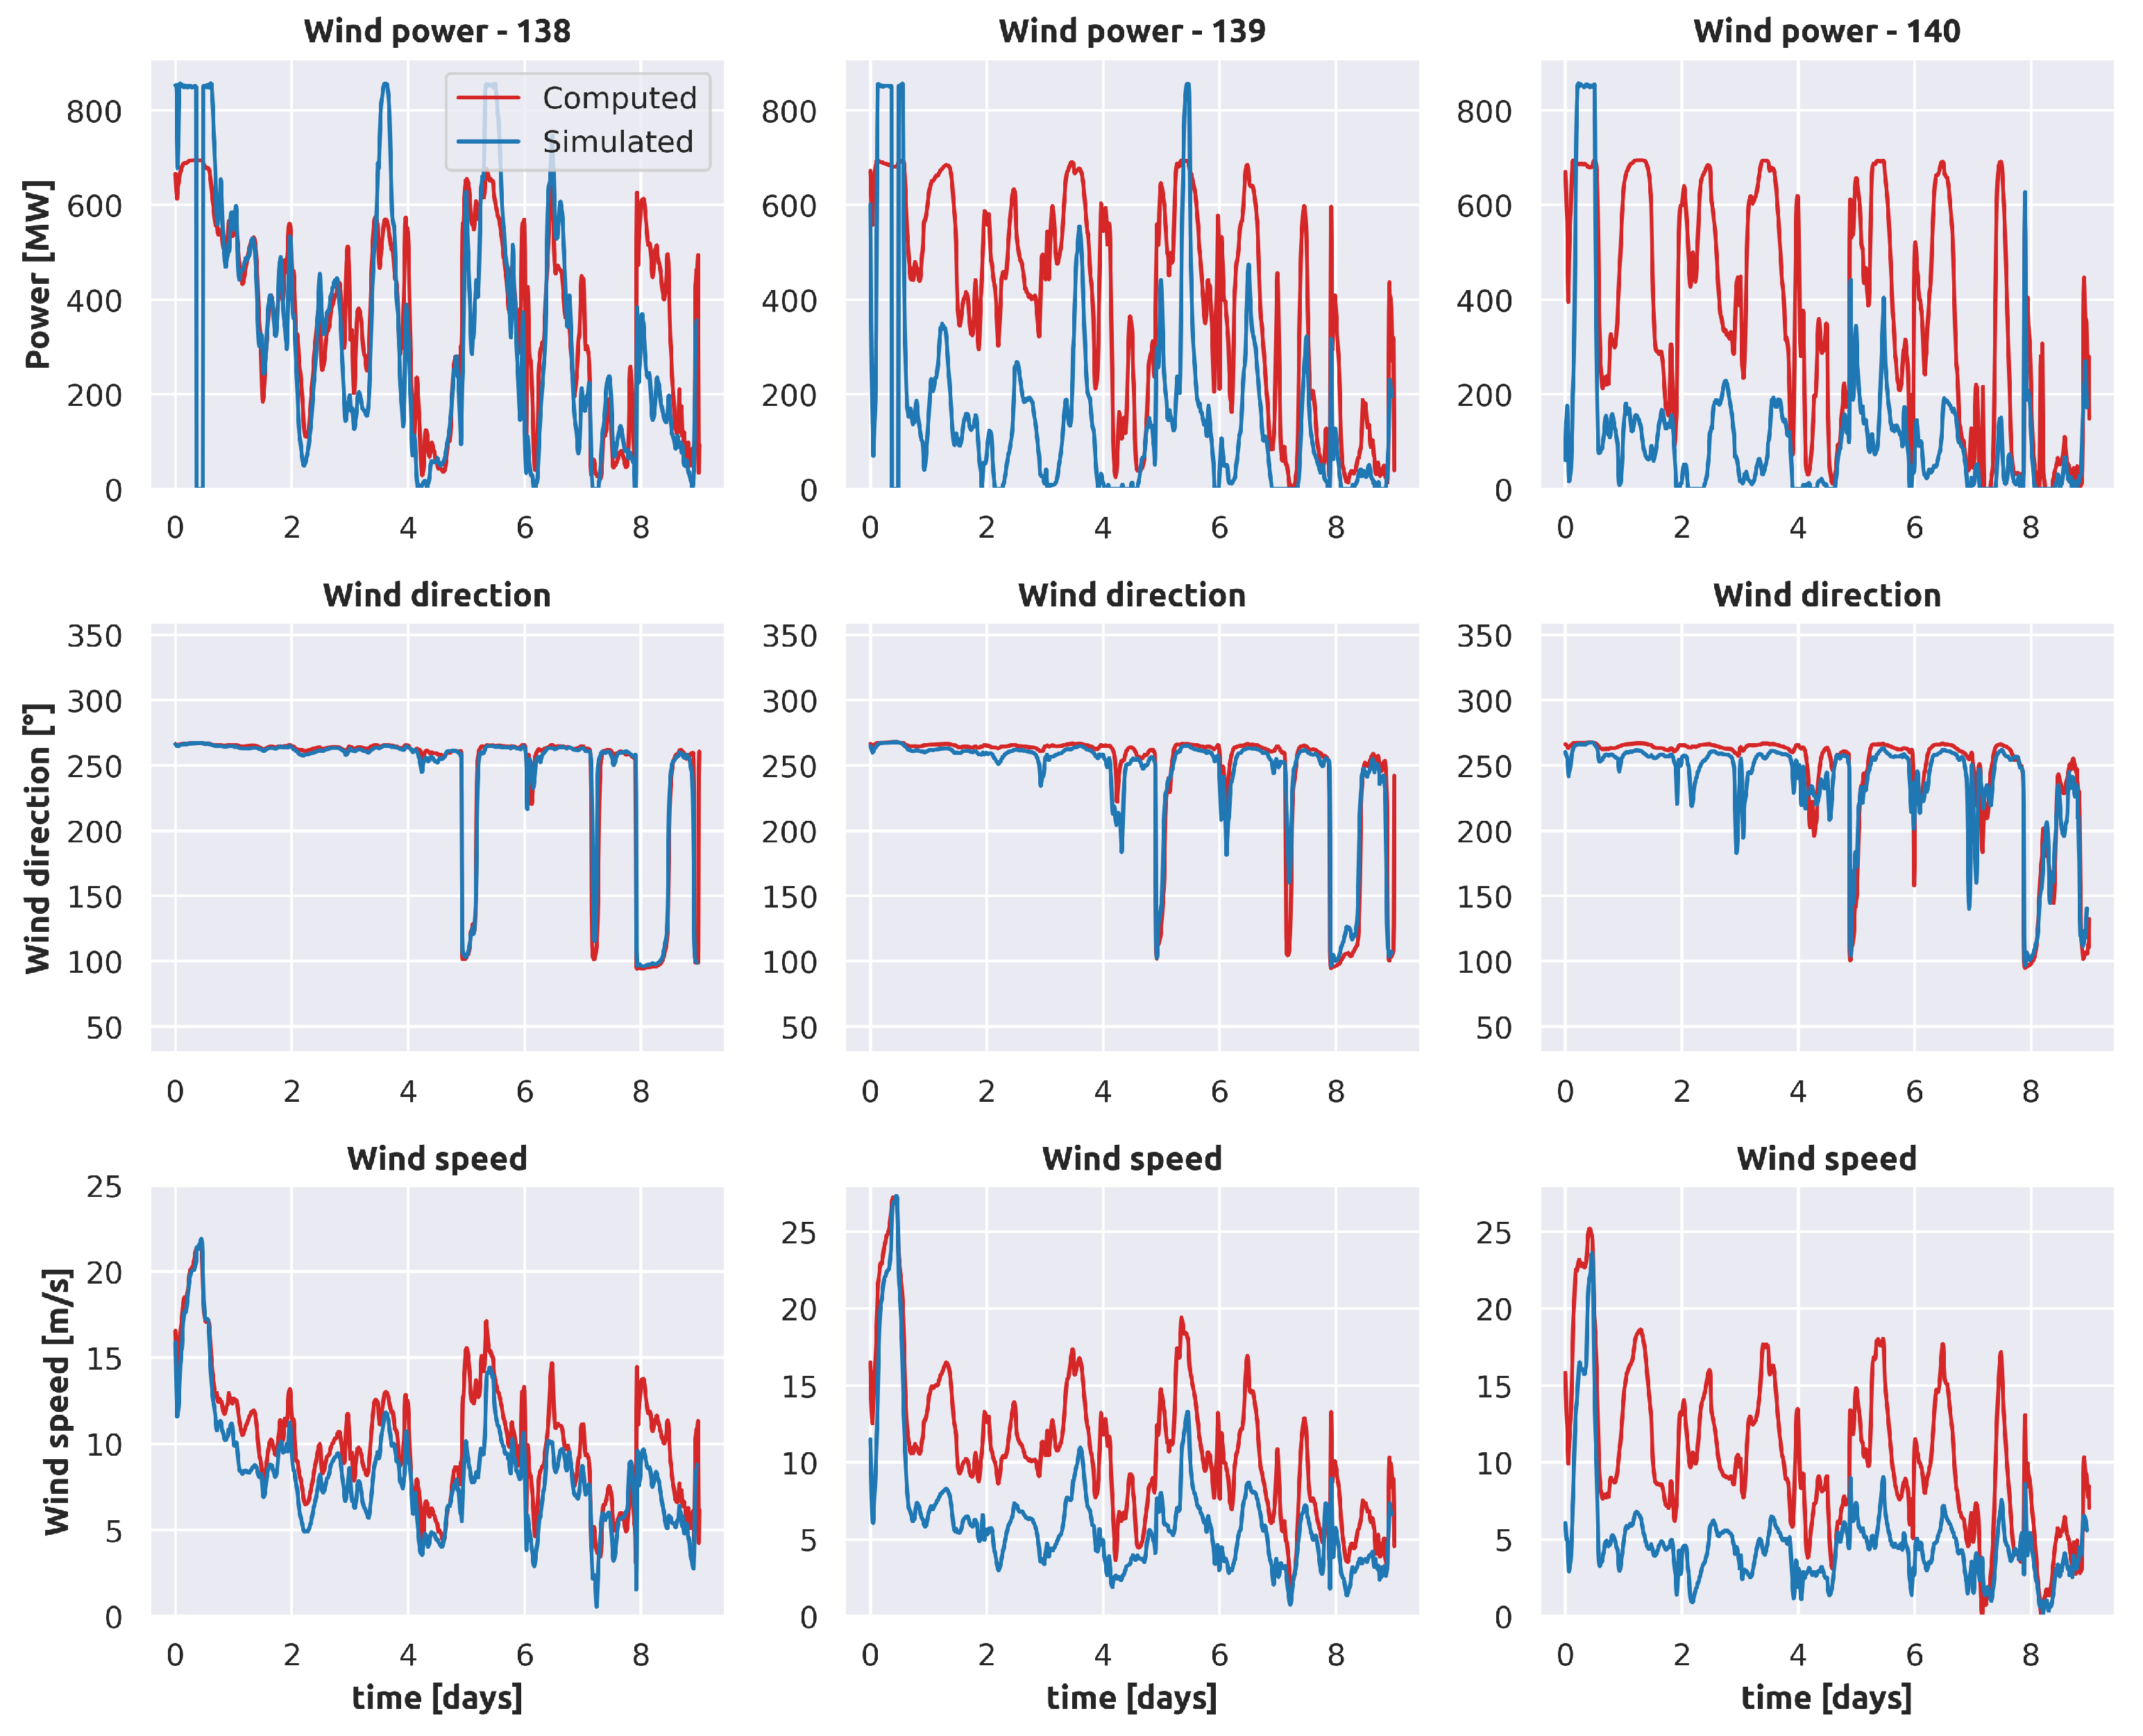
4. Grid Sensitivity and Validation in WRF for Wind Farms

One-way nested simulations with 9, 3 and 1 km grid spacings for the Qollpana wind farm were performed to determine the effect of grid sensitivity and to validate the WRF. The results showed 3.359, 3.733 and 3.967 m/s MAEs and 4.191, 4.570 and 4.874 m/s RMSEs for the 9, 3 and 1 km grids, respectively. The mean wind speed of the observations is 9.03 m/s and the mean wind speed of the simulations is 10.899 m/s for the 9 km grid. The high MAE and RMSE are related to the highly turbulent characteristics of the site. The difference in the mean wind speed is 1.864 m/s; however, the the high MAE and RMSE are mostly related to the ramp-winds and delays (out-of-phase) in wind speed. For wind power assessment the overestimation of wind speed over 12 m/s has minimum impact on power generation due to wind turbines producing constant power when their rated wind speed is reached. Figure 4 displays the wind power generation in Qollpana and the out-of-phase characteristics in the simulations.

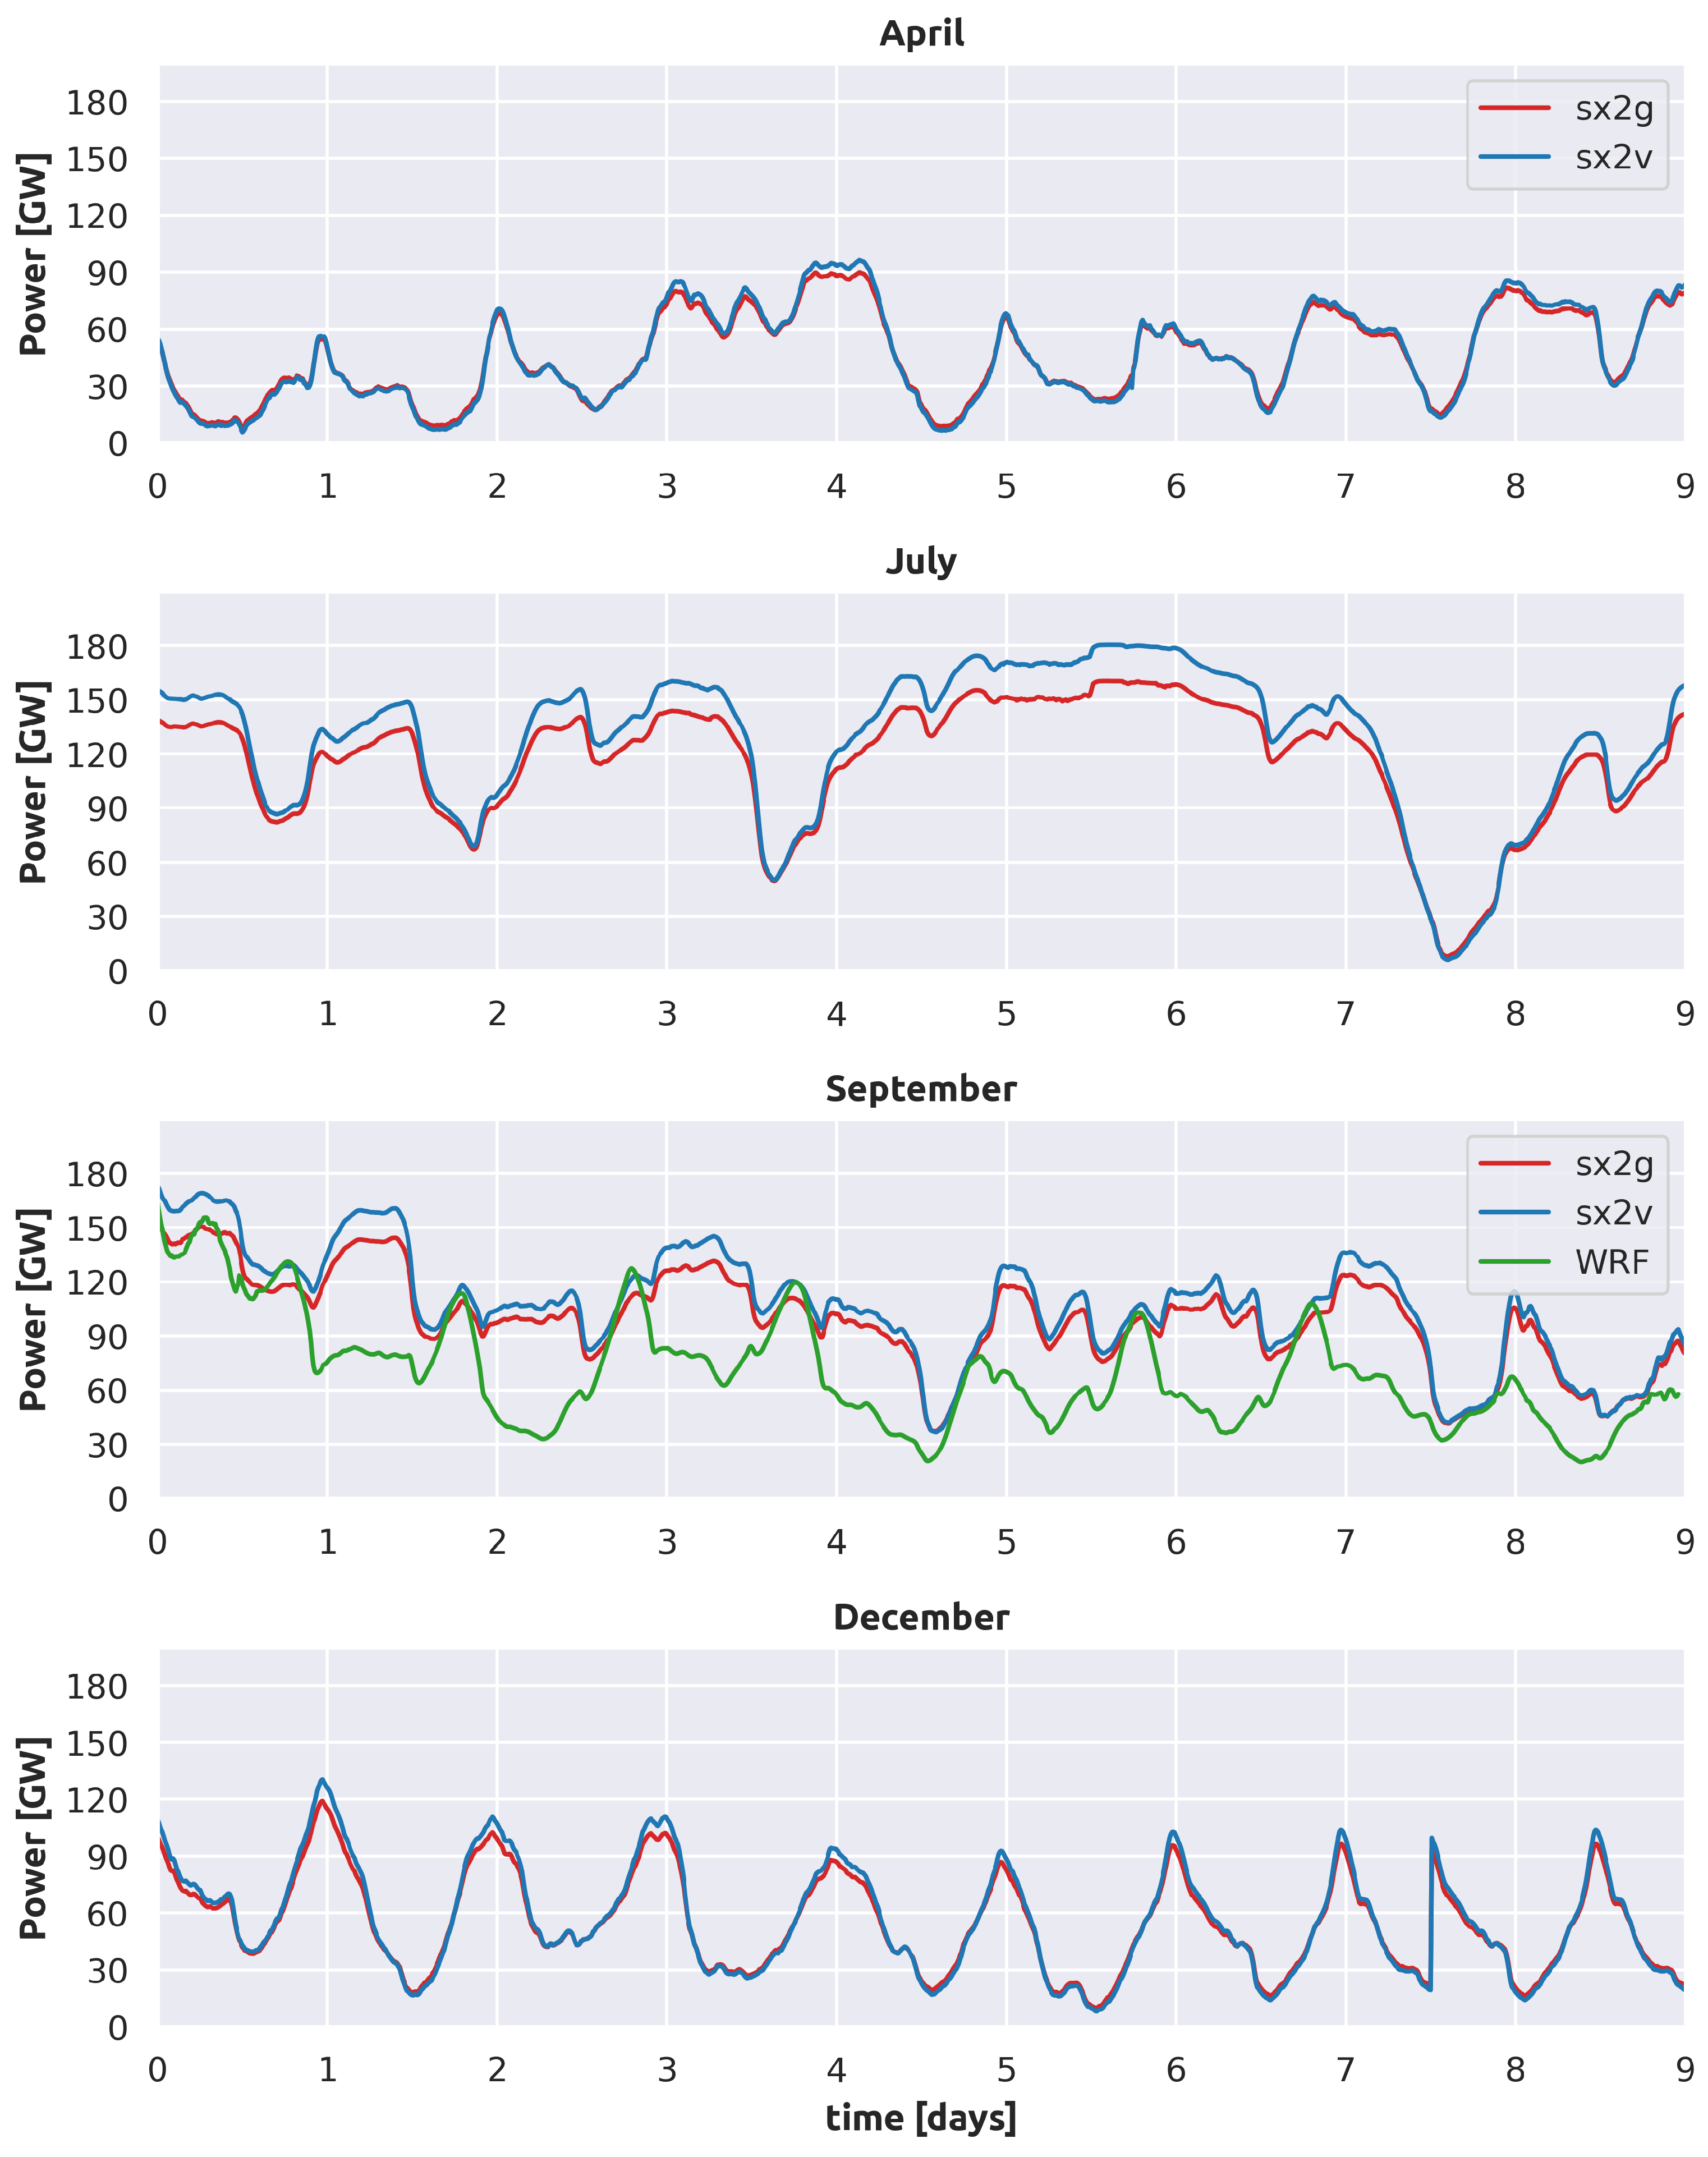
5. The Wind Power Potential in the Bolivian Andes by WRF Model

WRF simulations were performed to complement the results analysed with the GWA for nine consecutive days in April, July, September and December. There were reference simulations where the Qollpana wind farm was considered. These simulations were used to determine the sites for wind farms in the Andes. The wind power calculated with the WRF is compared with the wind power generated by Qollpana I (Figure 4). The wind power in April displayed an underestimation and out-of-phase wind power. The underestimation is noticed between day 1.5 and 3, and the out-of-phase is present at days 1.3, 2, 3, and 8. However, the difference in the time out-of-phase varied between 2 and 6 h. In July, the wind power was mostly underestimated between days 1 and 4 in combination with the out-of-phase prediction. In September, the simulated wind power displays an out-of-phase prediction at day 4.5 and a power underestimation at day 8.5. In December, the predicted wind power is underestimated at days 1.8 and 6.8. The absolute errors in energy generation in Qollpana I are 38.65%, 22.97%, 7.82% and 23.01% for April, July, September and December, respectively. As mentioned in Section 4, the wind speed showed out-of-phase prediction and slight overestimation of the wind speed.
Uyuni (20°28′ S, 66°52′ W) was selected as a reference site due to its location on the Central Altiplano. In terms of Uyuni’s monthly mean wind speed, April is the lowest period of the year, and September is the highest one. The monthly mean wind speeds in 2020 and during the period 1980–2020 were 4.28–4.17 m/s (April), 5.31–5.62 m/s (July), 5.60–5.70 m/s (September) and 4.96–4.45 m/s (December) (Figure 1). These wind speed characteristics throughout the year are related to the wind energy generation throughout the year.
Figure 5 displays the high-wind-speed sites in Bolivia, where the black sites have wind speeds higher than 7.5 m/s and the gray sites have wind speeds higher than 6.5 m/s. The regions with highest wind energy resources in the Bolivian Andes have been divided into three regions: the west side of the Altiplano (Border with Chile over longitude 68°30′ W), named as region I; the southwest side (border with Chile and Argentina), Eduardo Avaroa’s national park; and the East side of the Altiplano (over longitude 66° W), named as region II. Finally, region III is located in the interface between the Altiplano and the Amazon, as shown in Figure 5.
Each of the regions have different potentialities for wind energy projects. The most important are regions II and III due to their proximity to large cities and transmission lines. Region I has considerable wind energy potential, but this region is not near any Bolivian cities. However, it could be important for the lithium industrialisation in the Uyuni salt flats because one of the biggest reserves of lithium is nearby. The Uyuni salt flats contain approximately 10 million tonnes of lithium and are in the process of being industrialised [33]. The use of renewable energies could be the best method of industrialisation and to reduce the carbon footprint of lithium batteries. Finally, the southwest side of the country corresponds to the Eduardo Avaroa’s National Park, which is a protected area. This region cannot be considered for wind farms; however, the knowledge of considerable wind energy resources could be considered for the use of small wind turbines in isolated houses or communities.
The wind power assessment was computed on grids under the following conditions: wind speed higher than 7.5 m/s, altitude higher than 2000 masl and not being a protected area. Figure 5 displays the high-wind sites along the Bolivian Andes and is composed by 266 grids, corresponding to 21,546 km2 of land. According to the wind farm arrangement per grid, the installed capacity could reach 225.75 GW. The details for wind power density, wind turbine arrangement and the number of wind turbines are summarized in Table 1. The main regions of wind farms are marked in Figure 5 as region I (West Altiplano), region II (East Altiplano) and region III (nearby the Qollpana wind farm). The coordinates and altitudes of the 266 grids are in the Supplementary Data.
The capacity factor (CF) has been calculated along the Andes, and these are 0.204 (April), 0.567 (July), 0.473 (September), 0.249 (December) and 0.373 as the mean CF. In the Qollpana wind farm, the monthly CF in the years 2014 and 2016 were 0.30–0.60 (April), 0.50–0.65 (July), 0.28–0.40 (September) and 0.22–0.30 (December) [18]. The observed and estimated CFs in Qollpana I during the same period of these simulations were (Observed–Estimated): 0.352–0.217 (April), 0.595–0.460 (July), 0.898–0.972 (September) and 0.406–0.314 (December). Although Morales-Ruvalcaba et al. [34] reported that estimated CFs are higher than observed ones by 20 % in most cases, the results in Qollpana I show underestimation due to the grid-spacing used (9 km) and the wind farm having few wind turbines.
Two wind turbines were analyzed (GW 121/2.5 and V 136/3.45) with two wind turbine configurations (sx1 and sx2) corresponding to spanwise spacings of 7.85D and 5.24D, respectively, as shown in Table 1. Those combinations provided different wind turbine densities between 6.24 and 10.48 MW/km2. Additionally, Table 1 shows the number of wind turbines and the maximum wind power capacity that could be reached in the highlands of the Bolivian Andes. According to the wind turbines and their arrangement, the number of wind turbines could be between 43624 (sx1v) and 80332 (sx2v), and the total capacity could be between 133.66 GW (sx1g) and 225.75 GW (sx2v). Additionally, the annual wind energy generation could reach 470.70 GW (sx1g) and 738.29 GW (sx2v). Finally, the wind energy produced by wind turbines in one year is between 3.27 and 3.52 GWh/year-MW.
This estimation of wind energy generation is not considering maintenance, failure or other non-operational events. However, the wind energy could be estimated using the wind farm availability that varies between 95 and 99% for on-shore wind farms [35,36]. However, in case of failure in the Andes, the reparation of wind turbines could be challenging because components for reparation must be imported, and that could take longer than in Europe or the USA. However, considering the wind farm availability of the literature (95%) [36], the annual wind energy generation could reach 447.16 GW (sx1g) and 701.38 GW (sx2v).
Contrasting the sites with a high-rix index and high wind (Figure 3 and Figure 5), both are located in regions II and III. The rix index is directly proportional to terrain complexity, and studies have shown [32] that when the rix index is higher than 30%, the wind speed is overestimated at fine grid-spacing. The grid-spacing used in the WRF simulations was 9 km, and in GWA it was 250 m.
The maximum wind power potential in the Bolivian Andes estimated using the WRF is 225 GW. According the available high-wind area from the GWA, the wind power potential could reach 277.77 GW when the wind power density is 10.47 MW/km2 (available high-wind area is 26,511 km2). The wind turbine density for Europe can be between 8.33 and 18.6 MW/km2 [37]. Other countries in the world have reported wind power potentials of 71 GW in Mexico [38], 20 (on-shore) and 54 GW (including off-shore) in Colombia [39,40] and 70 GW (on-shore) in Spain [41].
Figure 6 shows the evolution of annual electricity generation in Bolivia since 2018 and the estimated wind energy in the Bolivian Andes. The electricity generation has been increasing continuously year by year, except for 2020. The annual amounts of electricity generation were 9211.9, 9532.8 and 9197.59 GWh for 2018, 2019 and 2020, respectively. The period of the highest electricity consumption is between October and January. In April 2020, there is a drop in the electricity generation related to the lockdown due to COVID-19. On the other hand, the wind energy generation has its peak between June and September, and its minimum between December and May (Figure 1 and Figure 6).
The annual wind energy in the Bolivian Andes could reach 738.29 TWh when the wind power capacity is 225.75 GW. For instance, in 2021 wind farms in Europe generated 437 TWh of electricity with a wind power capacity of 236 GW [42]. Additionally, the electricity generation in Bolivia in 2021 was 10.1 TWh, energy that could be covered by 895 V136/3.45 wind turbines.
To contrast the simulation with observations in other countries, Spain in 2016 had 23 GW of installed wind power, the wind energy production was 47.60 TWh [43] and its CF was 0.23. However, the CF depends mainly of the site, the wind turbine and the O&M strategy. The wind turbines selected (GW121/2.5 and V136/3.45) for the Bolivian Andes were an important factor for its high CF due to their larger blades and low rated wind speed. These technical specifications could increase the cost of wind farms [44], and additional studies should consider, for example, economic and financial analyses, life cycle assessments (LCA) and environmental impacts.
The wind power estimate in the Bolivian Andes should be considered as a maximum technical potential because economical feasibility, social acceptance and environmental impact are not considered in this study.

6. The Wind Power Dynamics in the Bolivian Andes

Figure 7 displays dynamically the wind power generation along the Andes in April, July, September and December, when all wind farms are generating electricity at their optimum arrangement. In September, the mesoscale effect of wind farms are analyzed, as the green line shows in Figure 7. The installed wind power in the Andes is 200 and 225 GW, represented by the red and blue lines, respectively. As the simulations started at 00 UTM, the ticks in time correspond to 8 p.m. local time.
The high-wind months are July and September; these coincide with the wind speed curve in Figure 1, where the high-wind period is between June and October. Meanwhile, the low-wind periods are December, January, March and April.
The wind power in April varied between 5.47 and 96.32 GW, with a minimum around 5 GW in 0.5, 1.5 and 4.5 days at 9–12 AM (local time). The highest wind power generation was in July. The wind power reached 180.34 GW; on day 7.5, the wind power decreases abruptly until 5.86 GW; and in less than 12 h, the power reaches 130 GW. However, for three consecutive days (days 4–7) the wind power was higher than 120 GW. In September, the maximum wind power reached 172.7 GW, and the minimum 36.68 GW. The maximum power occurred between 8 and 10 PM (local time). Finally, during December, the wind power varied between 8.09 and 130.5 GW. The maximum had a frequency of 24 h and reached the peak at 8 p.m. (local time).
Only during the high-wind months were the wind power differences noticed between the two wind turbine options, when the difference in installed wind power capacity is 25 GW. However, there are significant differences in the number of wind turbines. Sx2g and sx2v represent 80,332 and 65,436 wind turbines, respectively.
The wind power in September computed from wind speed simulated by WRF (blue line) and the wind power simulated by WRF using the wind farm parameterisation (green line) are compared in the third row of Figure 7. The computed wind power represents the wind power generated when the wind turbine arrangement is operating at its optimum and the impact of neighboring wind farms is negligible. The wind farm parameterisation considers the momentum sink in the wind mean flow and the wind farms’ impacts on their neighboring wind farms.
In September, the computed and simulated wind power have considerable differences, as shown in Figure 7. The computed and simulated CFs are 0.43 and 0.29, respectively. The energy generated during that period for the computed and simulated wind power was 23,066.45 and 12,123.46 GWh, respectively. Although, the simulated wind power is lower than the computed, there are short periods with the same amount of power.
The wind power differences are highly related to the impact of neighboring wind farms (neighboring grids with wind turbines). Figure 8 displays the arrangement of grids with wind turbines (wind farm) to analyze the impact of neighboring wind farms and wind direction. Figure 9 shows the wind power (computed and simulated), wind direction and wind speed (with and without wind turbines). The geographic position of the grid [123, 139] is [ 21.3287 lat, 66.1943 lon].
The first row in Figure 8 shows the computed (red) and simulated (blue) wind power. The first column [123, 138] shows the wind power with minimum impact from their neighboring wind farms. The wind power, wind direction and wind speed are quite similar, except when the wind direction changes by approx. 180° at day 8. During that short period of 8 h, the wind power and wind speed are impacted by grids [123, 139] and [122, 140].
Due to the predominant wind direction being towards the east (270°), grid [123, 138] is the least impacted in comparison to [123, 139] and [122, 140]. The high wind turbine density represents a high kinetic energy reduction (converted to electricity), and this impacts the neighboring wind flows. However, to implement that number of wind turbines is unrealistic for the Bolivian electricity market. This numerical analysis is important to assess the wind farm’s impact on the neighboring farms for better siting and environment changes.
The development of wind energy is linked and restricted by land use allocation. The implementation of wind farms will create different challenges for sustainable energy and sustainable land use development. Although, wind farms have low land use impact, their visual and biodiversity impact could be important [2]. For example, the Altiplano is mainly covered by bare areas (31%), sparse vegetation (16%), and shrubland (17%) [45]; this could be considered as advantage due to a lack of forests that can block wind and the minimum impact on biodiversity. However, the complexity of land could be related to land-use and land-tenure. The land use is mainly pasture and agricultural production, and land-tenure could be individual or communal [46].
On the other side, bird life and migration should also be analysed because the Important Bird and Biodiversity Areas (IBA) are identified mainly in region III and in the south of the Altiplano (Eduardo Avaroa’s National Park) (Figure 2) [47]. However, the results of this work could be useful for designing, sizing and implementing small wind turbines for families in rural communities in the Andes. Previously, WRF has been used to assess the renewable energy potential in an indigenous community to guarantee their access to electricity [48].
The main objective of implementing wind farms is decarbonise the energy system, and wind energy is only a component of the whole system. The decarbonisation of the energy systems require coordinated strategies using different technologies and resources. Some studies in Europe showed the benefits of multi-energy systems using solar energy, wind energy, hydrogen, storage systems and non-convectional technologies [49,50,51]. However, most of the challenges were related to the electrification of residential heating and industries. The challenges in Bolivia will be related to the electrification of the transportation sector due to the long distances, complex topographies and the economy. Additionally, the main challenge now is the digitisation of the information and generation of open access data to decarbonise the Bolivian system.
This study continues the discussion and analysis about storage systems, land-use planning [52], environmental impact, wind energy acceptance [53] and energy culture [54]. Although some of those studies could be performed with estimated data or information the accuracy of the results would be affected. However, there are projects in progress related to renewable energy integration [55], green-house gases reduction [56] and rural electrification [57]. Finally, the wind energy resources are known for their non-dispatchability and poor load following, which add challenges in the forecasting [58], operation of the transmission systems and planning future Energy Storage Systems (ESS) [59].

7. Conclusions

This study numerically evaluates the wind power potential in the Bolivian Andes using the GWA and WRF models. The wind power capacity could reach 225 (WRF) and 277 (GWA) GW distributed on 21,546 km2 (WRF) or 26,511 km2 (GWA) of land, when the wind turbine density is 10.48 MW/km2. Under the conditions of this study, the yearly wind energy generation could reach 701.38 TWh and a mean capacity factor of 0.3733 when wind farms are operating at their optimum. The main regions for wind energy in the Bolivian Andes were over the east and west of the Altiplano and close to the Qollpana wind farm (centre of Bolivia). The current findings contribute the understanding of wind energy and the dynamics of wind energy resources in high-altitude conditions in Bolivia. However, the main outcome is the identification of the high-wind sites and the wind power variability along large areas, which could be used for the optimization of green energy investments, the optimal selection of green technologies and to provide additional data for wind energy integration to the national electrical system and microgrids. Although the wind energy potential is high, there is a limit in the wind energy penetration related to the flexibility of the system. For sustainable development, coordinated strategies for the decarbonisation of the energy are essential, and for wind farms, it is relevant for implementation to select sites with minimum impact on the environment and that are in synergy with other green technologies.
Finally, this work contributes to the scarce existing knowledge about wind energy at high-altitude conditions, and this research will serve as a basis for further studies related to the planning of transmission lines, energy balance analysis, environmental impact and forecasting.

Supplementary Materials

The following are available online at https://www.mdpi.com/article/10.3390/en15124305/s1, File S1: Coordinates altitude high-wind sites.

Author Contributions

Conceptualization, R.M. and P.H.; methodology, R.M. and P.H.; software, R.M.; validation, R.M. and P.H.; formal analysis, R.M. and P.H.; modelling, R.M.; data curation, R.M. and P.H.; writing—original draft preparation, R.M.; writing—review and editing, R.M. and P.H.; visualization, R.M.; supervision, P.H.; funding acquisition, P.H. All authors have read and agreed to the published version of the manuscript.

Funding

This research and APC was funded by L’Académie de Recherche et d’Enseignement Supérieur (ARES-CCD).

Institutional Review Board Statement

Not applicable.

Informed Consent Statement

Not applicable.

Data Availability Statement

The authors confirm that the data supporting the findings of this study are available within the article and its Supplementary Materials.

Acknowledgments

The authors would like to thank to L’Académie de Recherche et d’Enseignement Supérieur (ARES-CCD) for supporting this work. We would also like to thank to Javier Sanz Rodrigo for his comments and recommendations to improve this work.

Conflicts of Interest

The authors declare no conflict of interest.

References

  1. Al-Yahyai, S.; Charabi, Y.; Gastli, A. Review of the use of Numerical Weather Prediction (NWP) Models for wind energy assessment. Renew. Sustain. Energy Rev. 2010, 14, 3192–3198. [Google Scholar] [CrossRef]
  2. IRENA. Renewable Capacity Statistics 2021; International Renewable Energy Agency (IRENA): Abu Dhabi, United Arab Emirates, 2021; p. 64. [Google Scholar]
  3. Gonzalez-Salazar, M.; Poganietz, W.R. Evaluating the complementarity of solar, wind and hydropower to mitigate the impact of El Niño Southern Oscillation in Latin America. Renew. Energy 2021, 174, 453–467. [Google Scholar] [CrossRef]
  4. Viviescas, C.; Lima, L.; Diuana, F.A.; Vasquez, E.; Ludovique, C.; Silva, G.N.; Huback, V.; Magalar, L.; Szklo, A.; Lucena, A.F.P.; et al. Contribution of Variable Renewable Energy to increase energy security in Latin America: Complementarity and climate change impacts on wind and solar resources. Renew. Sustain. Energy Rev. 2019, 113, 109232. [Google Scholar] [CrossRef]
  5. Wang, J.; Hu, J.; Ma, K. Wind speed probability distribution estimation and wind energy assessment. Renew. Sustain. Energy Rev. 2016, 60, 881–899. [Google Scholar] [CrossRef]
  6. Al Zohbi, G.; Hendrick, P.; Bouillard, P. Wind characteristics and wind energy potential analysis in five sites in Lebanon. Int. J. Hydrogen Energy 2015, 40, 15311–15319. [Google Scholar] [CrossRef]
  7. Skamarock, W.C.; Klemp, J.B.; Dudhia, J.; Gill, D.O.; Barker, D.M.; Wang, W.; Powers, J.G. A description of the Advanced Research WRF Version 3; NCAR: Boulder, CO, USA, 2008. [Google Scholar]
  8. Fitch, A.C.; Olson, J.B.; Lundquist, J.K.; Dudhia, J.; Gupta, A.K.; Michalakes, J.; Barstad, I. Local and Mesoscale Impacts of Wind Farms as Parameterized in a Mesoscale NWP Model. Mon. Weather Rev. 2012, 140, 3017–3038. [Google Scholar] [CrossRef]
  9. Tuchtenhagen, P.; de Carvalho, G.G.; Martins, G.; da Silva, P.E.; de Oliveira, C.P.; de Melo Barbosa Andrade, L.; de Araújo, J.M.; Mutti, P.R.; Lucio, P.S.; Silva, C.M.S.E. WRF model assessment for wind intensity and power density simulation in the southern coast of Brazil. Energy 2020, 190, 116341. [Google Scholar] [CrossRef]
  10. González-Alonso de Linaje, N.; Mattar, C.; Borvarán, D. Quantifying the wind energy potential differences using different WRF initial conditions on Mediterranean coast of Chile. Energy 2019, 188, 116027. [Google Scholar] [CrossRef]
  11. Kibona, T.E. Application of WRF mesoscale model for prediction of wind energy resources in Tanzania. Sci. Afr. 2020, 7, e00302. [Google Scholar] [CrossRef]
  12. Carvalho, D.; Rocha, A.; Santos, C.S.; Pereira, R. Wind resource modelling in complex terrain using different mesoscale–microscale coupling techniques. Appl. Energy 2013, 108, 493–504. [Google Scholar] [CrossRef]
  13. Lee, J.A.; Doubrawa, P.; Xue, L.; Newman, A.J.; Draxl, C.; Scott, G. Wind Resource Assessment for Alaska’s Offshore Regions: Validation of a 14-Year High-Resolution WRF Data Set. Energies 2019, 12, 2780. [Google Scholar] [CrossRef]
  14. DTU. Global Wind Atlas 3.0, a Free, Web-Based Application Developed, Owned and Operated by the Technical University of Denmark (DTU). The Global Wind Atlas 3.0 is Released in Partnership with the World Bank Group, Utilizing Data Provided by Vortex, Using Funding Provided by the Energy Sector Management Assistance Program (ESMAP). Available online: https://globalwindatlas.info (accessed on 20 October 2021).
  15. Lamb, S.; Hoke, L. Origin of the high plateau in the central Andes, Bolivia, South America. Tectonics 1997, 16, 623–649. [Google Scholar] [CrossRef]
  16. Garreaud, R.D. The Andes climate and weather. Adv. Geosci. 2009, 22, 3–11. [Google Scholar] [CrossRef]
  17. Ge, M.W.; Ke, W.M.; Chen, H.X. Pitch control strategy before the rated power for variable speed wind turbines at high altitudes. J. Hydrodyn. 2019, 31, 379–388. [Google Scholar] [CrossRef]
  18. Mamani, R.; Hackenberg, N.; Hendrick, P. Efficiency of High Altitude On-shore Wind Turbines: Air Density and Turbulence Effects—Qollpana Wind Farm (Bolivia). Proceedings 2018, 2, 487. [Google Scholar] [CrossRef]
  19. CNDC (Comité Nacional de Despacho de Carga). 2010. Available online: https://www.cndc.bo/agentes/generacion.php (accessed on 23 June 2021).
  20. ENDE. Empresa Nacional de Electricidad. 2015. Available online: https://www.ende.bo/proyectos/ejecucion (accessed on 3 June 2021).
  21. CNDC (Comité Nacional de Despacho de Carga). 2010. Available online: https://www.cndc.bo/estadisticas/index.php (accessed on 3 June 2021).
  22. Mamani, R.; Hendrick, P. Weather Research & Forecasting model and MERRA-2 data for wind energy evaluation at different altitudes in Bolivia. Wind Eng. 2021, 46, 177–188. [Google Scholar] [CrossRef]
  23. Mamani, R.; Hendrick, P. WRF Model Parameterization Around the Highland Titicaca Lake. Earth Space Sci. 2021, 8, e2021EA001649. [Google Scholar] [CrossRef]
  24. Nakanishi, M.; Niino, H. An Improved Mellor–Yamada Level-3 Model: Its Numerical Stability and Application to a Regional Prediction of Advection Fog. Bound. Layer Meteorol. 2006, 119, 397–407. [Google Scholar] [CrossRef]
  25. Liang, Y.; Ji, X.; Wu, C.; He, J.; Qin, Z. Estimation of the influences of air density on wind energy assessment: A case study from China. Energy Convers. Manag. 2020, 224, 113371. [Google Scholar] [CrossRef]
  26. Fitch, A.C. Notes on using the mesoscale wind farm parameterization of Fitch et al. (2012) in WRF. Wind Energy 2016, 19, 1757–1758. [Google Scholar] [CrossRef]
  27. SERNAP. Mapa de áreas Protegidas Nacionales de Bolivia. 2018. Available online: http://geo.gob.bo/portal/ (accessed on 27 October 2021).
  28. AE. Mapa Red Eléctrica de Media Tensión en Bolivia. 2017. Available online: http://geo.gob.bo/portal/ (accessed on 27 October 2021).
  29. ABC. Red Vial Fundamental de Bolivia. 2020. Available online: http://geo.gob.bo/portal/ (accessed on 27 October 2021).
  30. AETN. Mapa Red Eléctrica de alta Tensión en Bolivia. 2020. Available online: http://geo.gob.bo/portal/ (accessed on 27 October 2021).
  31. McKenna, R.; Pfenninger, S.; Heinrichs, H.; Schmidt, J.; Staffell, I.; Bauer, C.; Gruber, K.; Hahmann, A.N.; Jansen, M.; Klingler, M.; et al. High-resolution large-scale onshore wind energy assessments: A review of potential definitions, methodologies and future research needs. Renew. Energy 2022, 182, 659–684. [Google Scholar] [CrossRef]
  32. Fernández-González, S.; Martín, M.L.; García-Ortega, E.; Merino, A.; Lorenzana, J.; Sánchez, J.L.; Valero, F.; Rodrigo, J.S. Sensitivity Analysis of the WRF Model: Wind-Resource Assessment for Complex Terrain. J. Appl. Meteorol. Climatol. 2018, 57, 733–753. [Google Scholar] [CrossRef]
  33. Sanchez-Lopez, M.D. From a White Desert to the Largest World Deposit of Lithium: Symbolic Meanings and Materialities of the Uyuni Salt Flat in Bolivia. Antipode 2019, 51, 1318–1339. [Google Scholar] [CrossRef]
  34. Morales-Ruvalcaba, C.F.; Rodríguez-Hernández, O.; Martínez-Alvarado, O.; Drew, D.R.; Ramos, E. Estimating wind speed and capacity factors in Mexico using reanalysis data. Energy Sustain. Dev. 2020, 58, 158–166. [Google Scholar] [CrossRef]
  35. Carroll, J.; McDonald, A.; Dinwoodie, I.; McMillan, D.; Revie, M.; Lazakis, I. Availability, operation and maintenance costs of offshore wind turbines with different drive train configurations. Wind Energy 2017, 20, 361–378. [Google Scholar] [CrossRef]
  36. Taboada, J.V.; Diaz-Casas, V.; Yu, X. Reliability and Maintenance Management Analysis on OffShore Wind Turbines (OWTs). Energies 2021, 14, 7662. [Google Scholar] [CrossRef]
  37. McKenna, R.; Hollnaicher, S.; vd Leye, P.O.; Fichtner, W. Cost-potentials for large onshore wind turbines in Europe. Energy 2015, 83, 217–229. [Google Scholar] [CrossRef]
  38. Alemán-Nava, G.S.; Casiano-Flores, V.H.; Cárdenas-Chávez, D.L.; Díaz-Chavez, R.; Scarlat, N.; Mahlknecht, J.; Dallemand, J.F.; Parra, R. Renewable energy research progress in Mexico: A review. Renew. Sustain. Energy Rev. 2014, 32, 140–153. [Google Scholar] [CrossRef]
  39. Rueda-Bayona, J.G.; Guzmán, A.; Eras, J.J.C.; Silva-Casarín, R.; Bastidas-Arteaga, E.; Horrillo-Caraballo, J. Renewables energies in Colombia and the opportunity for the offshore wind technology. J. Clean. Prod. 2019, 220, 529–543. [Google Scholar] [CrossRef]
  40. Perdomo Delgado, D.A.; Jaimes Herrera, M.T.; Almeira, J.E. La energía eólica como energía alternativa para el futuro de colombia. El Centauro 2014, 6, 111–120. [Google Scholar]
  41. Fueyo, N.; Sanz, Y.; Rodrigues, M.; Montañés, C.; Dopazo, C. High resolution modelling of the on-shore technical wind energy potential in Spain. Wind Energy 2010, 13, 717–726. [Google Scholar] [CrossRef]
  42. Wind Europe. Wind Energy in Europe: 2021 Statistics and the Outlook for 2022–2026. 2022. Available online: https://windeurope.org/intelligence-platform/product/wind-energy-in-europe-2021-statistics-and-the-outlook-for-2022-2026/ (accessed on 27 March 2021).
  43. Ramírez, F.J.; Honrubia-Escribano, A.; Gómez-Lázaro, E.; Pham, D.T. The role of wind energy production in addressing the European renewable energy targets: The case of Spain. J. Clean. Prod. 2018, 196, 1198–1212. [Google Scholar] [CrossRef]
  44. Sedaghat, A.; Hassanzadeh, A.; Jamali, J.; Mostafaeipour, A.; Chen, W.H. Determination of rated wind speed for maximum annual energy production of variable speed wind turbines. Appl. Energy 2017, 205, 781–789. [Google Scholar] [CrossRef]
  45. Satgé, F.; Bonnet, M.P.; Timouk, F.; Calmant, S.; Pillco, R.; Molina, J.; Lavado-Casimiro, W.; Arsen, A.; Crétaux, J.F.; Garnier, J. Accuracy assessment of SRTM v4 and ASTER GDEM v2 over the Altiplano watershed using ICESat/GLAS data. Int. J. Remote Sens. 2015, 36, 465–488. [Google Scholar] [CrossRef]
  46. Damonte, G.; Glave, M.; Rodríguez Castañeda, S.; Ramos Bonilla, A. The Evolution of Collective Land Tenure Regimes in Pastoralist Societies: Lessons from Andean Countries; IDS Working Paper 480; Institute of Development Studies: Brighton, UK, 2016. [Google Scholar] [CrossRef]
  47. BirdLife-International. Country Profile: Bolivia. 2021. Available online: http://www.birdlife.org/datazone/country/bolivia (accessed on 3 June 2021).
  48. Mamani, R.; Sanchez, C.; Cardozo, E.; Hendrick, P. Evaluación numérica de diferentes alternativas de energías renovables en Raqaypampa. Cient. UMSS 2019, 1, 8–15. [Google Scholar]
  49. Elavarasan, R.M.; Pugazhendhi, R.; Irfan, M.; Mihet-Popa, L.; Khan, I.A.; Campana, P.E. State-of-the-art sustainable approaches for deeper decarbonization in Europe – An endowment to climate neutral vision. Renew. Sustain. Energy Rev. 2022, 159, 112204. [Google Scholar] [CrossRef]
  50. Arenas, J.G.; Hendrick, P.; Henneaux, P. Optimisation of Integrated Systems: The Potential of Power and Residential Heat Sectors Coupling in Decarbonisation Strategies. Energies 2022, 15, 2638. [Google Scholar] [CrossRef]
  51. Morabito, A.; Spriet, J.; Vagnoni, E.; Hendrick, P. Underground Pumped Storage Hydropower Case Studies in Belgium: Perspectives and Challenges. Energies 2020, 13, 4000. [Google Scholar] [CrossRef]
  52. Kati, V.; Kassara, C.; Vrontisi, Z.; Moustakas, A. The biodiversity-wind energy-land use nexus in a global biodiversity hotspot. Sci. Total Environ. 2021, 768, 144471. [Google Scholar] [CrossRef]
  53. Ellis, G.; Ferraro, G. The Social Acceptance of Wind Energy: Where We Stand and the Path Ahead; Publications Office of European Union: Luxembourg, 2016. [Google Scholar]
  54. Stephenson, J.; Barton, B.; Carrington, G.; Gnoth, D.; Lawson, R.; Thorsnes, P. Energy cultures: A framework for understanding energy behaviours. Energy Policy 2010, 38, 6120–6129. [Google Scholar] [CrossRef]
  55. Navia, M.; Orellana, R.; Zaráte, S.; Villazón, M.; Balderrama, S.; Quoilin, S. Energy Transition Planning with High Penetration of Variable Renewable Energy in Developing Countries: The Case of the Bolivian Interconnected Power System. Energies 2022, 15, 968. [Google Scholar] [CrossRef]
  56. Villarroel-Schneider, J.; Höglund-Isaksson, L.; Mainali, B.; Martí-Herrero, J.; Cardozo, E.; Malmquist, A.; Martin, A. Energy self-sufficiency and greenhouse gas emission reductions in Latin American dairy farms through massive implementation of biogas-based solutions. Energy Convers. Manag. 2022, 261, 115670. [Google Scholar] [CrossRef]
  57. Balderrama, S.; Lombardi, F.; Stevanato, N.; Peña, G.; Colombo, E.; Quoilin, S. Surrogate models for rural energy planning: Application to Bolivian lowlands isolated communities. Energy 2021, 232, 121108. [Google Scholar] [CrossRef]
  58. Mamani, R.; Hendrick, P. Wind farm power short-term prediction using WRF model and Kalman filtering. In Proceedings of the 32nd International Conference on Efficiency, Cost, Optimization, Simulation and Environmental Impact of Energy Systems, Wrocław, Poland, 23–28 June 2019; p. 9. [Google Scholar]
  59. Tan, K.M.; Babu, T.S.; Ramachandaramurthy, V.K.; Kasinathan, P.; Solanki, S.G.; Raveendran, S.K. Empowering smart grid: A comprehensive review of energy storage technology and application with renewable energy integration. J. Energy Storage 2021, 39, 102591. [Google Scholar] [CrossRef]
Figure 1. Monthly wind speed comparison for Uyuni city for 2020 and the period 1980 to 2020.
Energies 15 04305 g001
Figure 2. Wind Atlas at 100 m above ground level of the sites with high-wind speed in the Bolivian Andes. (Left) Sites with mean wind speed higher than 7.5 m/s and higher than 2000 masl. (Right) High-wind sites overlayed with protected areas (orange), roads (green) and transmission lines (red) [14].
Energies 15 04305 g002
Figure 3. Ruggedness Index (RIX) index in Bolivia and mean wind speed at 100 m above ground level [14].
Energies 15 04305 g003
Figure 4. Comparison of hourly wind power observations and simulations in April, July, September and December.
Energies 15 04305 g004
Figure 5. Sites with mean wind speed higher than 7.5 m/s in black. The coordinates and their altitudes of the high-wind sites are in the Supplementary Materials.
Energies 15 04305 g005
Figure 6. Electricity generation (GWh) in 2018, 2019 and 2020 by month in Bolivia (green, purple and red) and Estimated wind energy (TWh) over the Andes with sx1v (olive) and sx2v (blue).
Energies 15 04305 g006
Figure 7. Estimated wind power (GW) over the Andes in April, July, September and December. Comparison between sx2g (red) and sx2v (blue) over the Bolivian Andes.
Energies 15 04305 g007
Figure 8. Grids with wind turbines (thicker squares) in the range [122–126, 138–143]. Blue grids are analyzed in Figure 9 and the central grid [123, 139] corresponds to [ 21.3287 lat, 66.1943 lon].
Energies 15 04305 g008
Figure 9. Computed and simulated wind power, wind direction and wind speed for [123, 138], [123, 139] and [123, 134] grids.
Energies 15 04305 g009
Table 1. Summary of wind turbine arrangements and installed capacity over the Bolivian Andes.
Turbine ArrangementNumber of TurbinesTotal Capacity [GW]Density MW/km2Energy per Year TWh/YearEnergy per WT GWh/Year-MW
sx1g53,466133.6656.204470.703.52
sx1v43,624150.5026.985504.503.35
sx2g80,332200.8309.320689.983.43
sx2v65,436225.75410.477738.293.27
Publisher’s Note: MDPI stays neutral with regard to jurisdictional claims in published maps and institutional affiliations.

