Article

State Regulation of Energy Transition and Economic Development

Institute of Economics and Industrial Engineering SB RAS, 630090 Novosibirsk, Russia
Energies 2022, 15(12), 4304; https://doi.org/10.3390/en15124304
Submission received: 15 May 2022 / Revised: 5 June 2022 / Accepted: 10 June 2022 / Published: 12 June 2022
(This article belongs to the Section C: Energy Economics and Policy)

Abstract

:
Government regulation with respect to the reduction of greenhouse gas emissions has been actively developing in the world in the past three decades, mainly in form of carbon taxation and emission trading systems with a carbon price as their basic representation. With more than 50 countries already applying such regulation and many others looking in that direction due to their obligations under the Paris Agreement, the question of suitable carbon price is still open. The aim of this paper is to form groups of countries according to the chosen economic, environmental and regulation factors to facilitate decision-making regarding the formation of energy transition regulation policies. Clustering analysis was carried out to identify countries with similar features in the research area. Five clusters with average carbon price ranging from USD 5.3 to 49.2 per t were obtained. The hypothesis of the study regarding direct connection between the level of economic development and state regulation was partially confirmed. It was revealed that most of the countries with active carbon regulation depend on the external supply of fossil energy sources. The results of the clustering could serve as a benchmark for the countries with similar indicators.

1. Introduction

The issue of state regulation and the degree of intervention in the economy remains one of the most important in modern economic research. The next important problem is the choice of directions of state policy, followed by specific measures, tools and methods of regulation.
Within the framework of the study, the main issue is the problem of state regulation and the choice of specific measures against the background of a global change in the structure of production, distribution and consumption of energy resources, as well as challenges of climate change.
Undoubtedly, the environmental agenda has become a firm priority in regard to the goals and objectives of many countries in the short and long term. One of the key areas of development is the desire to implement so-called energy transition, where the role of the fossil fuels should decrease and renewable energy sources should become one of the key energy sources. Another important direction within this concept is the continued trend of developed countries moving towards an increase in energy efficiency.
However, the readiness of countries for such transition as a whole, as well as for the application of its individual postulates, is at a fundamentally different level in many aspects. The opinions of the expert community, on assessments for developed and developing countries as well as for importers and exporters of the energy resources, on this issue differ, which is also due to the extremely controversial possible consequences of a rapid energy transition. Therefore, the idea of this study is to provide an insight to possible interconnections between the level of economic development and the degree of carbon regulation of the country to facilitate decision-making in this area for different countries. The study could provide specific benchmark levels for the countries planning to implement some form of carbon pricing. Pricing mechanisms usually include economic, fiscal, technological and other specific conditions. However, comparison analysis based on the expected results of the research could improve the regulation mechanism, as many countries seek guidance regarding the establishment of carbon policies. Moreover, identification of the groups characterized by regulation levels could provide insight regarding the possible carbon underpricing or overpricing for certain territories.
External challenges from major trading partners and the overall positioning of different countries within the framework of the Paris Agreement form the need for active actions towards the green economy. However, such actions, at first glance, directly threaten the key production sectors of the economies oriented to the production and export of fossil fuels. Moreover, the global petroleum industry is already operating in the face of a deteriorating mineral base, a shifting geography of production and ambiguous positions on refining and export issues, as well as a constantly changing institutional environment [1]. Moreover, the climate change agenda brought up new challenges for the industry [2]. Thus, internal overdue contradictions and problems in the resource sector could intensify under the pressure of the need for an energy transition. In addition to this, the potential for production of renewable sources of energy for countries is quite different. Brockway et al. (2019) argued that the estimates of energy-return-on-investment for renewable sources is quite close to the same for fossil fuels [3].
The need for state regulation for the energy transition essentially comes from the motivation for such a transition. Studies on the history of previous transitions allow for a better understanding of the main mechanisms. Chabrol (2016) showed that the transition to fossil fuels was the necessary condition for the development of the urban and transportation sectors; however, the current transition to renewable and/or nuclear energy is more complex in terms of motivation and competition with fossil fuels [4]. Carley and Konisky (2016) gave a detailed analysis of possible outcomes of energy transition, pointing out a number of consequences such as negative externalities and distortion of the labor market, as well as general economic and social effects for different societies [5].
Capellán-Pérez et al. (2019) found that in the case of a fast transition to a renewable-based energy system by 2060, the energy-return-on-investment will decrease below the levels needed for sustainable industrial development [6]. Nieto et al. (2020) gave a strong argument against the high potential of the green growth strategies to sustain economic development and resource usage [7]. However, Garcia-Casals et al. (2019) showed that energy transition in the period up to 2050 could lead to an increase in global GDP, countries’ GDP and employment worldwide [8].
Carley et al. (2017) gave a thorough analysis of policy instruments regarding renewable energy generation and concluded that the standalone increase in the usage of renewable sources of energy does not allow for the transition to a clean energy economy [9]. Other authors gave a significant contribution to the research on the factors and consequences of the usage of renewables [10,11,12]. The second important concept of the current energy transition is energy efficiency [13,14]. Alberini et al. (2018) received qualitative estimates of EU countries’ willingness to pay for emissions avoided in the context of energy efficiency policy [15].
The theoretical and methodological basis of environmental taxation was laid out in classic papers by A. Pigou, R. Coase, G. Tullock, L. H. Goulder, J. Stiglitz, W. Baumol and others. The initial conceptual approaches to the collection of environmental taxes are based on A. Pigou’s theory of external costs, which states that the rates of the environmental tax should correspond to the unit of the pollutant and be the sum of the marginal social costs. The problem of negative external costs from the standpoint of law was reflected in the works of R. Coase. The main conclusion of the work was the substantiation of the hypothesis that there is no need for state regulation in the form of taxes at minimal costs, since the owners will be able to independently resolve the problems that have arisen from, among other things, external effects. Discussion on these standpoints still continues [16,17,18].
Another interesting issue considers the international or global nature of the regulation [19]. As it was mentioned, the need for implementation of environmental measures lies within the International Paris Agreement and corresponding nationally determined contributions [20]. Another example of international regulation is adoption of so-called cross-border taxes, such as the European Carbon Border Adjustment Mechanism, which has serious implications for all trading partners of the EU [21,22,23,24].
Solomon and Krishna (2011) studied specific cases of transition regulations for France in the electricity supply sector and Brazil in the transportation sector and concluded that these examples show successful government management of energy transition, but only in the detached sectors [25]. Another block of papers covers environmental regulations in specific industries, such as automotive, where authors specifically studied the promotion of innovations supporting green transition in the industry [26,27].
Bergquist et al. (2013) reviewed two main directions of carbon regulation: administrative (taxes and restrictions on emissions and technologies used) and market (quota trading) for the industrial sector. These approaches are compared and described through modeling of different cases to find out the best method [28]. Hájek et al. (2019) provided an insight to the specifics of the carbon taxation in EU countries and concluded that tax is more efficient than an ETS system in the long run [29]. Brink et al. (2016), analyzing possible reforms of the EU ETS system, concluded that economies of new members (which are usually countries with a lower level of economic development) are affected more than other economies by this mechanism in the situation of high prices [30]. Cao et al. (2019) tested a hybrid system of simultaneous usage of tax and ETS, which lead to the conclusion that ETS is an attribute of developed countries, but a hybrid system can show efficient results in developing countries [31].
Connection between environmental aspects and economic development were extensively studied by different scientists in the framework of sustainable development [32,33,34], as well as the development of policies to reach environmental goals within the stable trajectory of economic growth [35,36].
The aim of this paper is to form groups of countries according to the chosen economic, environmental and regulation factors to facilitate decision-making regarding the formation of energy transition regulation policies for different countries. Therefore, the research objectives include analysis of the past and current changes of the energy mix; consideration of the countries’ dependence on the fossil fuel exports; clustering of countries according to the chosen economic and environmental indicators and discussion of the results. The main hypothesis of the study is about the direct connection between the level of economic development and the level of carbon regulation of a country.

2. Materials and Methods

At the first stage of research, the past and current energy mix of the world and main macroregions was analyzed to identify the current stage of energy transition. The history of carbon regulation was studied to identify the experience and possible motivation of different countries.
The net external energy demand for fossil fuels was calculated as the summarized net demand for crude oil, natural gas and coal. Net demand refers to the difference between production and consumption of the energy source within the studied area in the form of primary energy. Such an indicator could help to understand the resource background of the certain economies and their motivation to implement carbon regulation.
During the next stage of research, cluster analysis was applied to the chosen groups of countries to identify the groups with common features. Cluster analysis is related to the methods of multivariate analysis and allows for splitting data into groups with similar parameter values. After the main methods of hierarchical clustering were studied, the dispersion method of Ward was selected and adapted. The Ward method of clustering considers growth of the sum of squared distances from objects to cluster centers, obtained as a result of their union. Thus, the method minimizes the average sum of squared Euclidean distances from cluster objects to their cluster centers. At each step, two clusters that give the smallest increase in the cluster dispersion of the new cluster are combined. This method aims to combine closely spaced clusters and tends to create clusters of small size [37].
Another important methodical aspect was the application of the linear normalization of the data. Some countries had extreme values of the indicators and were deleted from the sample. The countries and regions were: Alberta, Canada with CO2 emissions of 62.1 t/person (average of the group was 7.2); Sweden with a carbon price of 137.2 USD (average was 17.7); Norway with a fossil fuel external supply of 1.3 terajoules per person and Singapore with an external demand of −0.6 terajoules per person (average was −0.02). Countries were later added to clusters by analytical analysis, which is mentioned in the results.
Clustering was successfully applied for the cross-country research in the field of economic development and energy industry. Yu et al. (2015) studied energy intensity and identified clusters of countries with similar convergence patterns [38]. Skovgaard et al. (2019) conducted a cluster analysis with a purpose similar to this study; however, they focused more on the time and quality of the carbon policy implementation [39]. Parobek et al. (2016) analyzed European countries in respect to the usage of the renewable sources of energy in energy consumption and production [40].
For the analysis, 40 countries and regions with available data on regulation of energy transition for the past five years were considered. Level of regulation was represented by the price of carbon obtained as an effective tax rate of carbon tax or price formed at ETS.
The factors and indicators for the clustering analysis were chosen according to the aim of the research, as well as based on the literature analysis. Per capita variables were considered in respect to the influence of the population on the chosen variables (Table 1).
Two rounds of clustering were carried out with the first one based on the level of state (regional) regulation, economic development and emissions. This stage of clustering included country and regional data. For the second round of clustering, fossil fuel dependence was added. This stage included only countries as a whole with average levels of indicators where applicable due to the availability of the data.
Thus, the research framework can be formulated as follows:
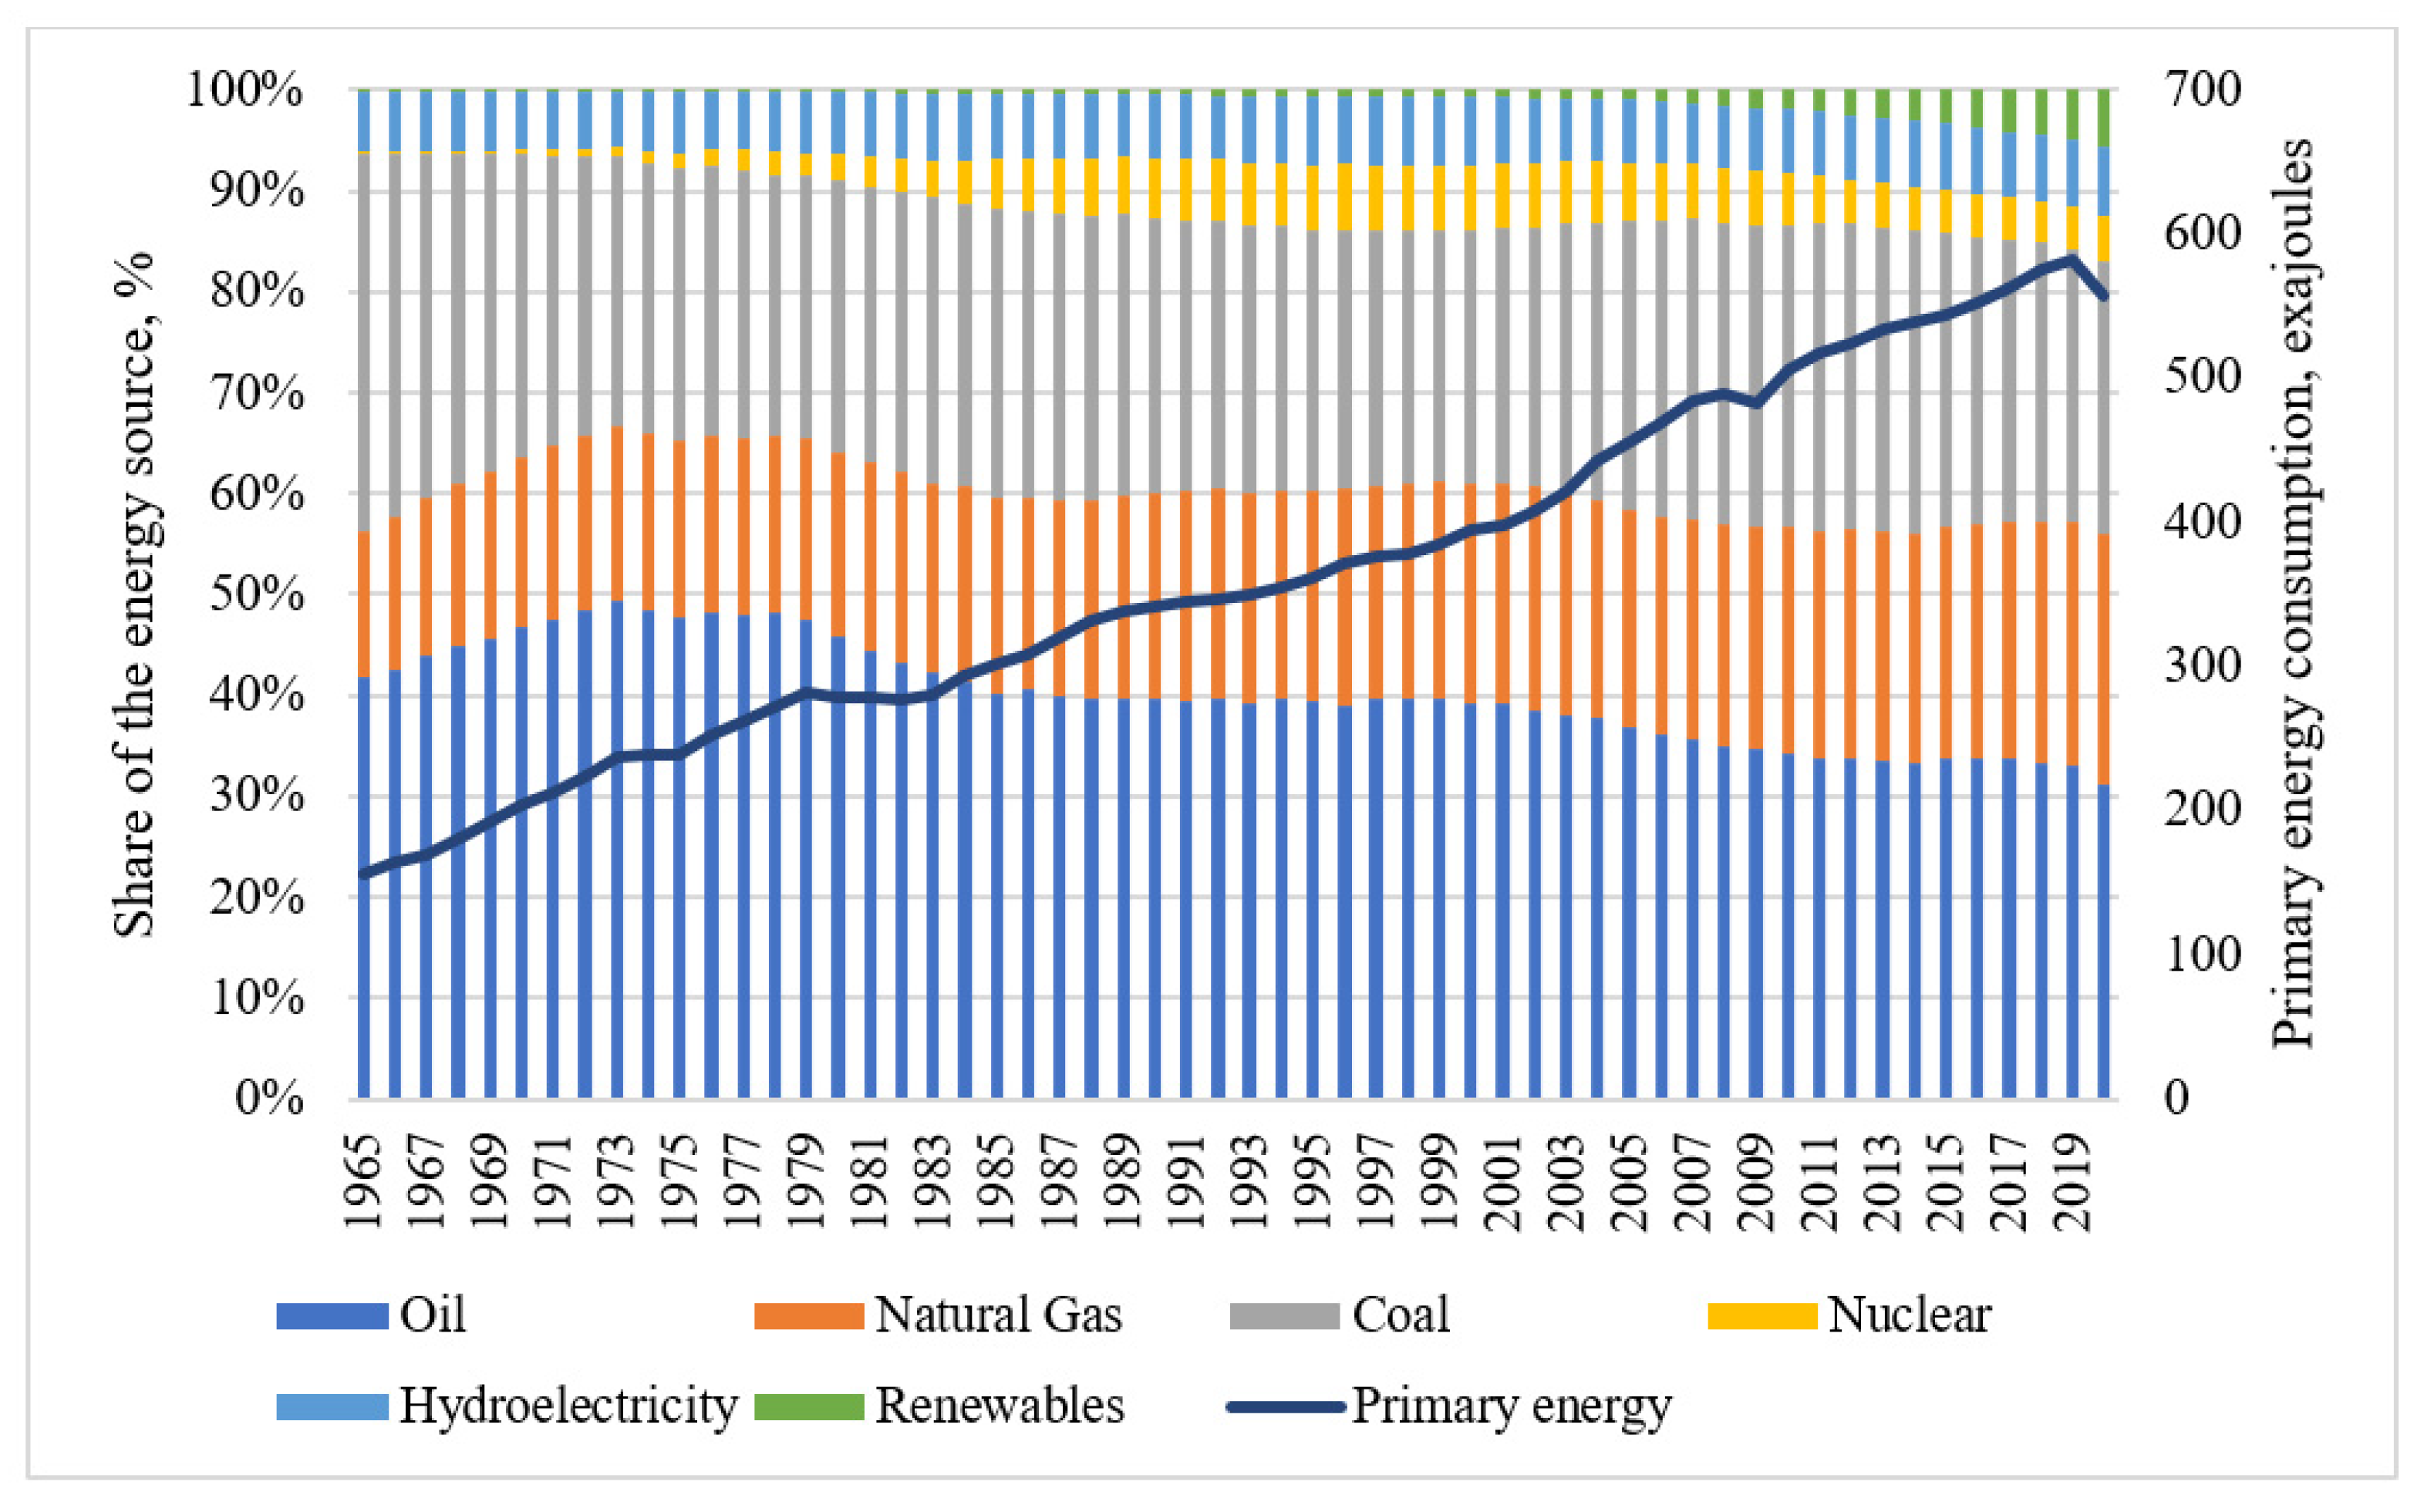
  • Analysis of the structure of the primary energy consumption data in the retrospective to evaluate the stage of the current energy transition as well as potential need for state regulation.
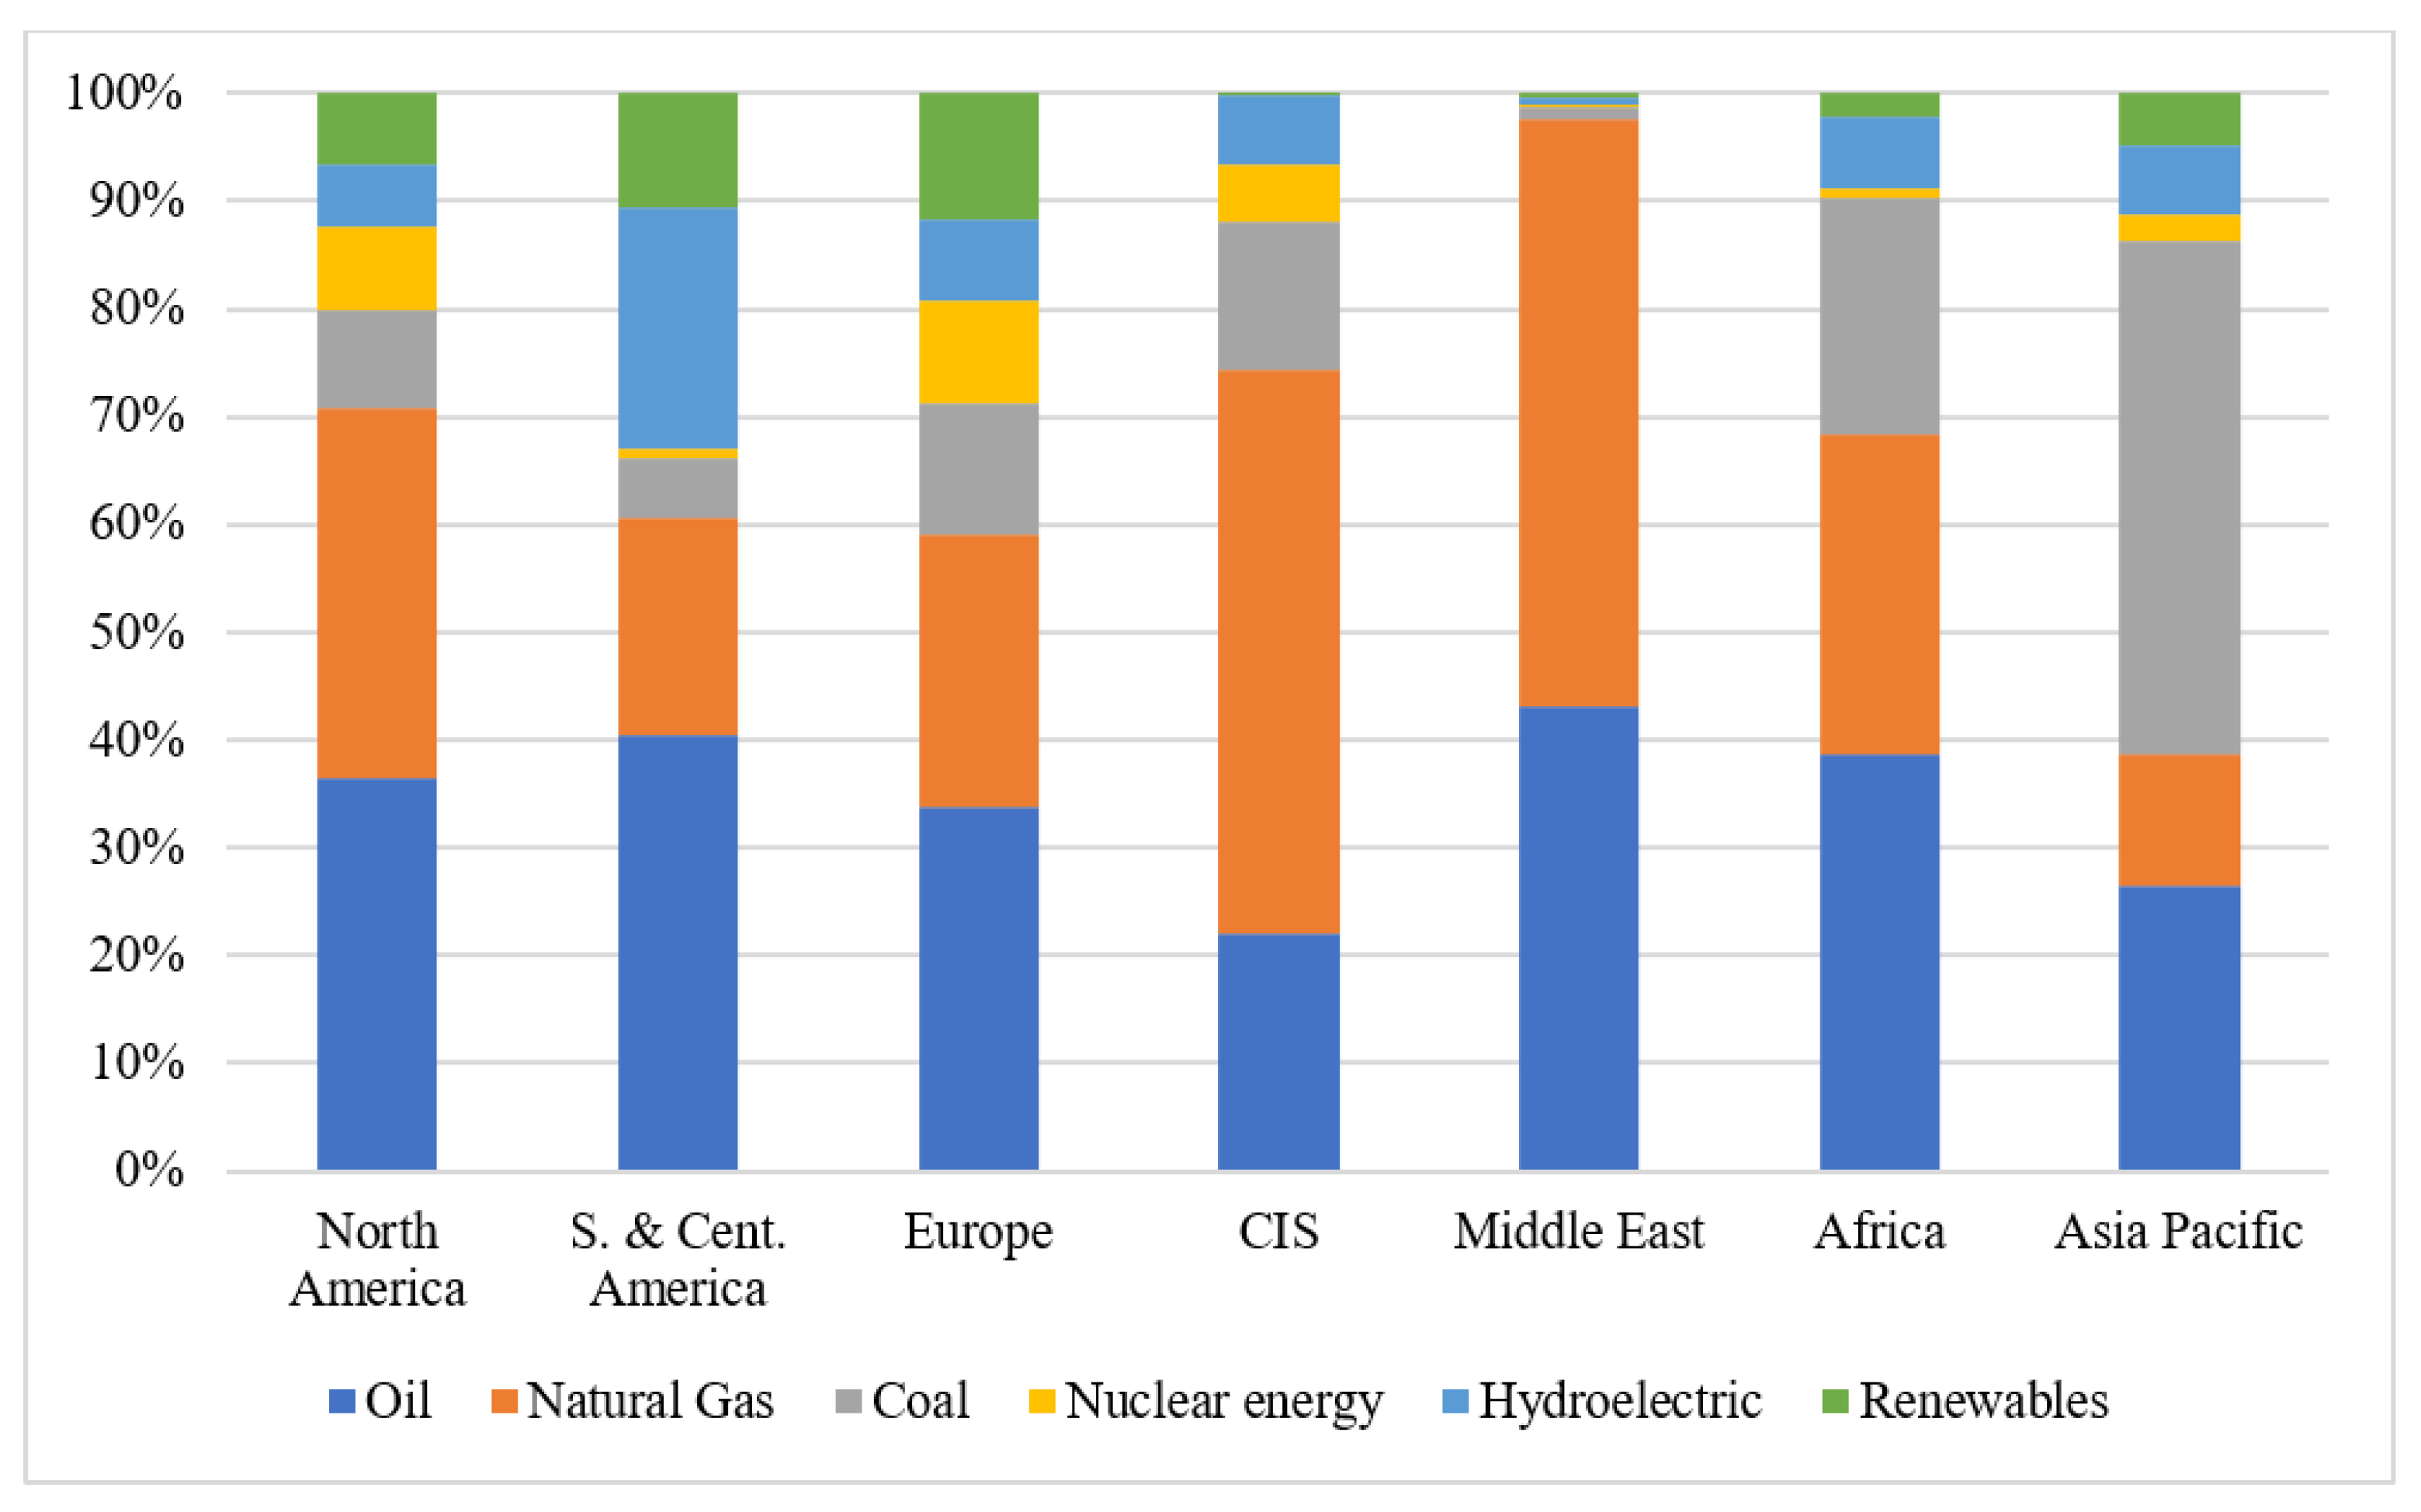
  • Analysis of the primary energy consumption by main macroregion and main types of energy sources to identify differences in the fuel and energy balances as basis for regulation.
  • Identification of the specific objects of further research, such as countries, provinces and regions of the countries, and intergovernmental unions that can be associated with the active application of carbon regulation.
  • Calculation of the net external demand (supply) of the fossil fuels for the chosen countries as a potential factor that can influence the level of regulation.
  • Cluster analysis of the chosen objects based on the main proposed factors for regulation.
The R free software environment was used to carry out the calculations. Data for carbon prices and emissions were obtained from the open source database Carbon Pricing Dashboard (World Bank). Data for indicators of economic development and population were obtained from the open source database of World Bank. Data on the energy production and consumption were obtained from the open source database Statistical Review of World Energy (BP). Most data were gathered from 2019 as the latest available data under business-as-usual operations. The coronavirus pandemic had a significant influence on the energy mix and economic development in 2020, and for 2021, not all numbers are yet available to form a complex understanding of the permanency of the change.

3. Results

3.1. Global Energy Mix and Carbon Taxes

For the past 55 years the fuel and energy balance did not have drastic changes based on the data of the global energy consumption by the type of energy source (Figure 1). Fossil fuels dominated the balance and their share stayed within the 83–86% range for the past decades. For example, in 2020 oil was accountable for 31.3% of the energy mix, whereas natural gas and coal were 24.7 and 27.2, respectively. Nuclear energy had a large increase in usage from 1980 to the 1990s; however, due to the controversy over the safety regulations and possible repercussions after emergency situations, the share was only 4.3% in 2020. Hydroelectricity is considered as another alternative to fossil energy; however, it also holds some limitations and the share of this source was 6.9% in 2020. RES, of which development and consumption is one of the key points of the current energy transition, was accountable for only 5.7%. It is worth mentioning that for different macroregions and specific countries, these shares and their dynamics over the years deviate to a great extent.
The energy and fuel mix of the main macroregions of the world was analyzed in order to determine regions most active in energy transition (Figure 2). Classification of the macroregions was carried out according to the BP data, where the CIS abbreviation refers to the Commonwealth of Independent States, which mostly consists of the former Soviet Union countries. The largest share of fossil fuels was consumed in the Middle East (98.7% of total primary energy consumption of the region) and the share in Africa was also quite high at 90.4%. CIS (88.2) and Asia Pacific (86.4%) tended to be in a higher range and North America (80.0%) was just below average for the world. The lowest share of consumption of fossil fuels was in Europe (71.2%) and South and Central America (66.2%).
The first carbon tax was introduced in Finland in 1990. That initiative was closely followed by other European countries such as Poland, Norway, Sweden and Denmark from 1990 to 1992, Slovenia in 1996, Estonia in 2000 and Latvia in 2004, as well as EU ETS introduced in 2005. First Canadian carbon regulation occurred in Alberta in form of ETS in 2007. Starting from 2008, new regulations started to develop in other countries yearly and is mainly connected with the Kyoto Protocol, which provided target levels for the emission reduction entering into force in 2005.
Geography of regulation (both tax and ETS) is quite uneven. From the perspective of the macroregions, Europe has the largest representation with the EU being one of the leaders in energy transition. Most of the European counties have special taxes or other types of carbon payments, as well as the overall EU ETS. It is followed by the largest three countries of North America. Argentina, Chili and Colombia are the countries from South and Central America with relatively new regulations, established 2017–2018. Within the Asia Pacific region, the countries with carbon regulation are Singapore, Japan, New Zealand and South Korea. Africa is represented only by South Africa, where a carbon tax came in to place in 2019. No countries in the Middle East have official regulation in the form of carbon tax or ETS. It is important to note that Canada and China have the most developed and long-lasting regional carbon regulations.

3.2. Demand for External Energy Sources

One of the factors calculated for further analysis was the intercountry demand and supply of fossil fuels. It should not be confused with official trading data on export and import of energy resources, which often can include further transportation of the goods, such as through re-export. This situation is quite common for the EU, where crude oil exports come through the Rotterdam port in the Netherlands, and after it is either refined and exported or re-exported in the crude form. The same happens for natural gas, where so called reverse or virtual-reverse gas supply within pipelines occurs on a regular basis. Therefore, it is important to understand the actual external demand for the fossil fuels in the countries with active carbon regulation policies.
Table 2 presents net demand and supply of the countries with active carbon regulation chosen for the cluster analysis. Regarding crude oil, the majority of the countries need to import this energy source to cover domestic consumption with only Canada, Norway, Mexico, Argentina and Colombia being net suppliers. A similar picture can be observed for natural gas, where a majority of the countries have a demand for the resource except for Canada, the USA, Colombia and Norway. As for coal, only Canada, the USA, Colombia, Poland and New Zealand have a positive balance of production and consumption. Therefore, it can be concluded that it is mainly the positive experience of the mentioned countries, especially Canada and Norway, that can be a basis for the formation of carbon policy in the countries oriented on the production and export of the fossil fuels.

3.3. Clustering of the Countries Based on Economic Development and Carbon Price

Cluster analysis was carried out for the chosen countries and regions according to the algorithms described in Section 2. It is important to note that at this stage, the sample included independent countries, as well as regions and provinces of some countries (the USA, Japan, Canada, China and Mexico) and one intergovernmental union (the EU). This was due to the understanding that, oftentimes, carbon regulation has a tendency to be focused in specific regions, especially in the situation of spatial inequality of different natures within the country. Thus, regions can be treated as independent cases of regulation. The EU is an example of a very strong transnational regulation and was included as a unified object as well. All of the indicators were gathered and recalculated for the chosen territories where needed. Data on the carbon prices were provided by the Carbon Pricing Dashboard of World Bank for each object. As a result of the analysis, five clusters were obtained (Table 3).
Cluster 3 is characterized by the lowest values of the GDP per capita (average is USD 11.3 thsd), with also the lowest level of emission (3.8 t/person) and carbon price (USD 5.3). Within the research design, this appears to be a group with balanced results as of now. However, such developing countries have a potential risk of increasing per capita emissions under extensive economic growth and, therefore, should carefully consider carbon policy.
It is important to clarify that the term “lowest” refers to the values within this research, as the lowest GDP per capita among analyzed countries is USD 3097, and only four objects in the sample had values below the average for the world, with the average for the sample being USD 34.8 thousand. Thus, mainly countries with higher levels of economic development tend to apply carbon regulation.
Cluster 4 tends to have higher per capita CO2 emission (7.7 t/person), which is quite higher than the average of the world at 4.76 t/person in 2019. At the same time, the average of the carbon price is USD 8.6, which corresponds to the level of economic development of USD 23.4 thsd/person. Overall, clusters 3, 4 and 2 form a linear increase in all parameters.
Clusters 1 and 5 have countries with the highest levels of economic development. However, their characteristics of emission and carbon price are quite opposite. Cluster 5, consisting of the European countries, is characterized by one of the lowest average emissions (6.2 t) and, at the same time, the highest level of carbon price (49.2 USD). At the same time, cluster 1 has the highest value for emission (14.2 t), but a carbon price (13.8 USD) below average for the sample. However, there is a possibility that regulation occurs in other forms outside of the carbon pricing mechanisms.
Some of the regions of Canada and China fell into different clusters, which highlights the importance of directional policy in countries with high regional inequality.

3.4. Clustering of the Countries Based on Economic Development and Fossil Fuels Demand

Due to the availability of the data, the clustering analysis was carried out on the country level. The main addition consisted of the application of the factor of dependence on foreign fossil fuels via the indicator of the net external demand/supply of fossil fuels per capita. Among the sample only Canada, Colombia and the USA had a positive balance between fossil fuel production and consumption. Thus, only clusters 1 and 2 include countries with positive values of these indicators. The USA and Canada, due to the proximity in the levels of the indicators, formed cluster 2 and were characterized by the highest emission levels among the groups (15.37 t) and average levels of carbon regulation. Cluster 1 consists of the countries with moderate economic development, emission and carbon price, as well as a low level of external fossil fuel dependence. Clusters 3, 5 and 4 progressively increase in the dependence on imported fossil fuels. Clusters 3 and 5 tend to have lower emission levels, and a level of carbon pricing corresponding to the level of economic development. However, countries in cluster 4 show higher emission levels with carbon prices below average of the sample (Table 4).
Singapore and Sweden were added to the clusters analytically with their main characteristics fitting the profile of the clusters. Norway could not be added to any clusters due to the unique combination of the chosen indicators: extremely high net supply of fossil fuels, high level of carbon price and economic development, and average emission value. This makes Norway an important case study for countries whose economies are focused on the export of fossil fuels.

4. Discussion

Overall, the studied papers proved the importance of state intervention, such as fiscal and monetary regulations for the reduction of CO2 emissions [41,42].
Active carbon regulation started only in the last decade of the 20th century. Moreover, in the 1990s it was the prerogative of European countries and only after the Kyoto Protocol entered into force in 2005 did other countries follow the lead. However, it was shown that European countries still depend on fossil fuels to a large extent, which was supported by previous research results [43].
Canada is one of the examples of the countries with active carbon regulation and oil production and export at the same time. According to the results of this research, Canadian provinces in most cases form a separate cluster, which highlights the specifics of this country and possible good practices for resource-oriented countries. Moreover, Stringer and Joanis (2022) showed that energy transition could have a positive influence on the provinces with a higher share of fossil fuel consumption [44].
For the case of the USA, it was shown that state regulation in the form of taxation, as well as government expenditures, has a great effect on CO2 emissions [45].
Stepanov and Makarov discussed specifics of carbon regulation in countries exporting fossil fuels and concluded that such regulation has a different motivation from that of importing countries; thus, they should follow different principles [46].
As it was mentioned, the countries of Africa and the Middle East do not apply active carbon regulations as of now, and at the same time have the highest overall share of fossil fuel consumption (98.7%), almost equally divided between oil and gas. Tagliapietra (2019) discussed the influence of the energy transition on the MENA countries, specifically on their petroleum producers. It was revealed that as of now, countries of the region over-rely on petroleum; however, they plan to diversify the structure of national economies to decrease the dependence on economic rent [47]. Sinha et al. (2020) studied cases of the top 10 polluted MENA countries and concluded that environmental goals still have a very low preference even in more developed countries of the region, which could have a drastic negative impact on different aspects of social-economic development in the future [48].
Moz-Christofoletti and Pereda (2021) studied the case of Brazil regarding the possible levels of carbon taxation at 40–80 USD/tCO2 and concluded that, despite a reduction in emissions, such tax would decrease the country’s welfare as well. However, it is mentioned that the carbon tax burden is already one of the highest among developing countries [49].
Inoue et al. (2021) studied the case of Japan and concluded that, despite the taxation level being relatively low in the country at the moment, it could grow in the upcoming years. In addition, the results of the higher tax level could unequally burden different regions due to the difference of their development [50]. Gokhale (2021) suggested that the carbon tax in Japan should be increased in some areas to provide funding for state projects [51].
Kuo et al. (2016) discussed the optimal level of carbon tax on the microlevel, concluding that the level of the tax and its alternative in a form of expenses to improve the production process should be comparable [52].
Elliott and Fullerton (2016) uncovered the ability of unilateral carbon tax to reduce the negative effect of carbon leakage, such as when businesses with high emissions are moved to avoid regulation in a certain area. This could specifically affect less developed countries [53]. Best et al. (2020) received a quantitative assessment on the positive influence of the presence of state regulation on the reduction of CO2 emissions [54]. The main limitation of research consists of the focus on the primary energy sector, of which regulation is indeed the essence of energy transition. However, in the context of climate change, other industries such as metallurgy, glass and ceramics, and chemical production have a high influence on greenhouse gas emissions. Thus, the analysis of the output and parameters of these industries, as well as applied state regulation could give important insights regarding the choice of instruments, especially for countries with low production of primary energy sources. In addition, the main analysis did not consider the dynamic of the chosen indicators of the countries, which could provide more insight.
Another interesting development could be the analysis of existing indicators of regulation, such as the Regulatory Indicators for Sustainable Energy (World Bank); however, these indicators were left out on purpose due to the aim of the research being to study primary factors at this stage.

5. Conclusions

Within the paper, parameters of energy transition and state regulation for countries with different levels of economic development were analyzed. The hypothesis of the study regarding direct connection between the level of economic development and state regulation was partially confirmed based on the cluster analysis.
Three out of five formed clusters of the countries showed an increase in carbon price alongside higher economic development and greenhouse gas emissions. The specific levels of carbon prices in these clusters could serve as benchmarks for the countries planning for such regulation.
Two other clusters did not follow the linear connection between the parameters. One of these clusters represents the situation of carbon overpricing within the scope of research. As this group mainly consists of the developed EU countries, higher carbon prices might represent a strong and long-lasting commitment to the energy transition. The other cluster, which includes two provinces of Canada; California and the RGGI system from the USA; Tokyo (Japan) and Singapore, shows the features of carbon underpricing and which was supported by the literature review. Therefore, these countries and regions should pay more attention to their regulation in this field of action.
In conclusion, it is important to note that carbon regulation is still actively developing and will continue to be implemented in a lot of countries which have stated their plans in this regard. At the moment such regulation is the prerogative of the more developed countries, which are mainly highly dependent on the imports of fossil fuels. However, their experience should be carefully studied and applied only after consideration to countries with different production and export structures, patterns of energy consumption and levels of economic development. The cases of Norway and Canada can be good starting points for development of carbon policies in countries oriented towards fossil fuel production and export. Consequences of any proposed policy should be forecasted to avoid the negative impact on economic development and other indicators of sustainable growth.

Funding

This research was funded by the Russian Science Foundation, grant number 21-78-00101.

Data Availability Statement

Restrictions may apply to the availability of these open source data. Data were obtained from BP’s Statistical Review of World Energy and are available at https://www.bp.com/en/global/corporate/energy-economics/statistical-review-of-world-energy.html (accessed on 25 April 2021); Carbon Pricing Dashboard of World Bank at https://carbonpricingdashboard.worldbank.org/ (accessed on 25 April 2021); data on GDP per capita at https://data.worldbank.org/indicator/NY.GDP.PCAP.PP.KD (accessed on 25 April 2021).

Acknowledgments

The author would like to thank Alexander Novikov for technical support during the study.

Conflicts of Interest

The author declares no conflict of interest.

References

  1. Kryukov, V.; Tokarev, A. Spatial trends of innovation in the Russian oil and gas sector: What does patent activity in Siberia and the Arctic reflect? Reg. Sci. Policy Pract. 2022, 14, 127–146. [Google Scholar] [CrossRef]
  2. Skjærseth, J.B.; Skodvin, T. Climate Change and the Oil Industry; Manchester University Press: Manchester, UK, 2018. [Google Scholar] [CrossRef]
  3. Brockway, P.E.; Owen, A.; Brand-Correa, L.I.; Hardt, L. Estimation of global final-stage energy-return-on-investment for fossil fuels with comparison to renewable energy sources. Nat. Energy 2019, 4, 612–621. [Google Scholar] [CrossRef] [Green Version]
  4. Chabrol, M. Re-examining historical energy transitions and urban systems in Europe. Energy Res. Soc. Sci. 2016, 13, 194–201. [Google Scholar] [CrossRef]
  5. Carley, S.; Konisky, D.M. The justice and equity implications of the clean energy transition. Nat. Energy 2020, 5, 569–577. [Google Scholar] [CrossRef]
  6. Capellán-Pérez, I.; de Castro, C.; Miguel González, L.J. Dynamic Energy Return on Energy Investment (EROI) and material requirements in scenarios of global transition to renewable energies. Energy Strateg. Rev. 2019, 26, 100399. [Google Scholar] [CrossRef]
  7. Nieto, J.; Carpintero, Ó.; Miguel, L.J.; de Blas, I. Macroeconomic modelling under energy constraints: Global low carbon transition scenarios. Energy Policy 2020, 137, 111090. [Google Scholar] [CrossRef] [Green Version]
  8. Carley, S.; Baldwin, E.; MacLean, L.M.; Brass, J.N. Global Expansion of Renewable Energy Generation: An Analysis of Policy Instruments. Environ. Resour. Econ. 2017, 68, 397–440. [Google Scholar] [CrossRef]
  9. Garcia-Casals, X.; Ferroukhi, R.; Parajuli, B. Measuring the socio-economic footprint of the energy transition. Energy Transit. 2019, 3, 105–118. [Google Scholar] [CrossRef] [Green Version]
  10. Can Şener, Ş.E.; Sharp, J.L.; Anctil, A. Factors impacting diverging paths of renewable energy: A review. Renew. Sustain. Energy Rev. 2018, 81, 2335–2342. [Google Scholar] [CrossRef]
  11. Bourcet, C. Empirical determinants of renewable energy deployment: A systematic literature review. Energy Econ. 2020, 85, 104563. [Google Scholar] [CrossRef]
  12. Darmani, A.; Arvidsson, N.; Hidalgo, A.; Albors, J. What drives the development of renewable energy technologies? Toward a typology for the systemic drivers. Renew. Sustain. Energy Rev. 2014, 38, 834–847. [Google Scholar] [CrossRef]
  13. Strielkowski, W.; Volkova, E.; Pushkareva, L.; Streimikiene, D. Innovative Policies for Energy Efficiency and the Use of Renewables in Households. Energies 2019, 12, 1392. [Google Scholar] [CrossRef] [Green Version]
  14. Gökgöz, F.; Güvercin, M.T. Energy security and renewable energy efficiency in EU. Renew. Sustain. Energy Rev. 2018, 96, 226–239. [Google Scholar] [CrossRef]
  15. Alberini, A.; Bigano, A.; Ščasný, M.; Zvěřinová, I. Preferences for Energy Efficiency vs. Renewables: What Is the Willingness to Pay to Reduce CO2 Emissions? Ecol. Econ. 2018, 144, 171–185. [Google Scholar] [CrossRef]
  16. Simpson, B.A.W. Coase v. Pigou’ Reexamined. J. Legal Stud. 1996, 25, 53–97. [Google Scholar]
  17. Deryugina, T.; Moore, F.; Tol, R.S.J. Environmental applications of the Coase Theorem. Environ. Sci. Policy 2021, 120, 81–88. [Google Scholar] [CrossRef]
  18. Diswandi, D. A hybrid Coasean and Pigouvian approach to Payment for Ecosystem Services Program in West Lombok: Does it contribute to poverty alleviation? Ecosyst. Serv. 2017, 23, 138–145. [Google Scholar] [CrossRef]
  19. Kingsbury, B.; Krisch, N.; Stewart, R.B. The Emergence of Global Administrative Law. Law Contemp. Probl. 2005, 68, 15–61. [Google Scholar] [CrossRef] [Green Version]
  20. Vogt-Schilb, A.; Hallegatte, S. Climate policies and nationally determined contributions: Reconciling the needed ambition with the political economy. Wiley Interdiscip. Rev. Energy Environ. 2017, 6, e256. [Google Scholar] [CrossRef] [Green Version]
  21. Mehling, M.A.; Ritz, R.A. Going beyond Default Intensities in an EU Carbon Border Adjustment Mechanism; Energy Policy Research Group, University of Cambridge: Cambridge, UK, 2020. [Google Scholar]
  22. Lockwood, B.; Whalley, J. Carbon-motivated Border Tax Adjustments: Old Wine in Green Bottles? World Econ. 2010, 33, 810–819. [Google Scholar] [CrossRef]
  23. Sanctuary, M. Border carbon adjustments and unilateral incentives to regulate the climate. Rev. Int. Econ. 2018, 26, 826–851. [Google Scholar] [CrossRef]
  24. Meckling, J. The Globalization of Carbon Trading: Transnational Business Coalitions in Climate Politics. Glob. Environ. Polit. 2011, 11, 26–50. [Google Scholar] [CrossRef]
  25. Solomon, B.D.; Krishna, K. The coming sustainable energy transition: History, strategies, and outlook. Energy Policy 2011, 39, 7422–7431. [Google Scholar] [CrossRef]
  26. Dechezleprêtre, A.; Neumayer, E.; Perkins, R. Environmental regulation and the cross-border diffusion of new technology: Evidence from automobile patents. Res. Policy 2015, 44, 244–257. [Google Scholar] [CrossRef]
  27. Bergek, A.; Berggren, C. The impact of environmental policy instruments on innovation: A review of energy and automotive industry studies. Ecol. Econ. 2014, 106, 112–123. [Google Scholar] [CrossRef] [Green Version]
  28. Bergquist, A.K.; Söderholm, K.; Kinneryd, H.; Lindmark, M.; Söderholm, P. Command-and-control revisited: Environmental compliance and technological change in Swedish industry 1970–1990. Ecol. Econ. 2013, 85, 6–19. [Google Scholar] [CrossRef]
  29. Hájek, M.; Zimmermannová, J.; Helman, K.; Rozenský, L. Analysis of carbon tax efficiency in energy industries of selected EU countries. Energy Policy 2019, 134, 110955. [Google Scholar] [CrossRef]
  30. Brink, C.; Vollebergh, H.R.J.; van der Werf, E. Carbon pricing in the EU: Evaluation of different EU ETS reform options. Energy Policy 2016, 97, 603–617. [Google Scholar] [CrossRef] [Green Version]
  31. Cao, J.; Ho, M.S.; Jorgenson, D.W.; Nielsen, C.P. China’s emissions trading system and an ETS-carbon tax hybrid. Energy Econ. 2019, 81, 741–753. [Google Scholar] [CrossRef]
  32. Filimonova, I.V.; Nemov, V.Y.; Komarova, A.V.; Mishenin, M.V.; Kozhevin, V.D. Relationship of Renewable Energy Consumption to Economic, Environmental and Institutional Factors in Europe. Energy Rep. 2021, 7, 358–365. [Google Scholar] [CrossRef]
  33. Giddings, B.; Hopwood, B.; O’Brien, G. Environment, economy and society: Fitting them together into sustainable development. Sustain. Dev. 2002, 10, 187–196. [Google Scholar] [CrossRef]
  34. Adams, B. Green Development; Routledge: London, UK, 2008. [Google Scholar] [CrossRef]
  35. Cooke, P. Green governance and green clusters: Regional & national policies for the climate change challenge of Central & Eastern Europe. J. Open Innov. Technol. Mark. Complex. 2015, 1, 1. [Google Scholar] [CrossRef] [Green Version]
  36. Gibbs, D.; Jonas, A.; While, A. Changing governance structures and the environment: Economy–environment relations at the local and regional scales. J. Environ. Policy Plan. 2002, 4, 123–138. [Google Scholar] [CrossRef]
  37. Gan, G.; Ma, C.; Wu, J. Data Clustering: Theory, Algorithms, and Applications; ASA-SIAM Series on Statistics and Applied Mathematics; Society for Industrial and Applied Mathematics: Philadelphia, PA, USA, 2007. [Google Scholar] [CrossRef]
  38. Yu, Y.; Zhang, Y.; Song, F. World Energy Intensity Revisited: A Cluster Analysis. Appl. Econ. Lett. 2015, 22, 1158–1169. [Google Scholar] [CrossRef]
  39. Skovgaard, J.; Ferrari, S.S.; Knaggård, Å. Mapping and Clustering the Adoption of Carbon Pricing Policies: What Polities Price Carbon and Why? Clim. Policy 2019, 19, 1173–1185. [Google Scholar] [CrossRef] [Green Version]
  40. Parobek, J.; Paluš, H.; Kalamárová, M.; Loučanová, E.; Šupín, M.; Križanová, A.; Štofková, K.R. Energy Utilization of Renewable Resources in the European Union—Cluster Analysis Approach. BioResources 2016, 11, 984–995. [Google Scholar] [CrossRef] [Green Version]
  41. Mughal, N.; Kashif, M.; Arif, A.; Guerrero, J.W.G.; Nabua, W.C.; Niedbała, G. Dynamic effects of fiscal and monetary policy instruments on environmental pollution in ASEAN. Environ. Sci. Pollut. Res. 2021, 28, 65116–65126. [Google Scholar] [CrossRef]
  42. Mahmood, H.; Adow, A.H.; Abbas, M.; Iqbal, A.; Murshed, M.; Furqan, M. The Fiscal and Monetary Policies and Environment in GCC Countries: Analysis of Territory and Consumption-Based CO2 Emissions. Sustainability 2022, 14, 1225. [Google Scholar] [CrossRef]
  43. Martins, F.; Felgueiras, C.; Smitkova, M.; Caetano, N. Analysis of Fossil Fuel Energy Consumption and Environmental Impacts in European Countries. Energies 2019, 12, 964. [Google Scholar] [CrossRef] [Green Version]
  44. Stringer, T.; Joanis, M. Assessing energy transition costs: Sub-national challenges in Canada. Energy Policy 2022, 164, 112879. [Google Scholar] [CrossRef]
  45. Halkos, G.E.; Paizanos, E.A. The Effects of Fiscal Policy on CO2 Emissions: Evidence from the U.S.A. Energy Policy 2016, 88, 317–328. [Google Scholar] [CrossRef]
  46. Stepanov, I.A.; Makarov, I.A. Greenhouse Gas Emissions Regulation in Fossil Fuels Exporting Countries: Opportunities and Challenges for Russia. Post-Communist Econ. 2021, 1–28. [Google Scholar] [CrossRef]
  47. Tagliapietra, S. The impact of the global energy transition on MENA oil and gas producers. Energy Strateg. Rev. 2019, 26, 100397. [Google Scholar] [CrossRef]
  48. Sinha, A.; Shah, M.I.; Sengupta, T.; Jiao, Z. Analyzing technology-emissions association in Top-10 polluted MENA countries: How to ascertain sustainable development by quantile modeling approach. J. Environ. Manag. 2020, 267, 110602. [Google Scholar] [CrossRef]
  49. Moz-Christofoletti, M.A.; Pereda, P.C. Winners and Losers: The Distributional Impacts of a Carbon Tax in Brazil. Ecol. Econ. 2021, 183, 106945. [Google Scholar] [CrossRef]
  50. Inoue, N.; Matsumoto, S.; Morita, M. Inequalities in the Impact of the Carbon Tax in Japan. In Carbon Pricing in Japan; Arimura, T.H., Matsumoto, S., Eds.; Economics, Law, and Institutions in Asia Pacific; Springer: Singapore, 2021; pp. 217–234. [Google Scholar] [CrossRef]
  51. Gokhale, H. Japan’s Carbon Tax Policy: Limitations and Policy Suggestions. Curr. Res. Environ. Sustain. 2021, 3, 100082. [Google Scholar] [CrossRef]
  52. Kuo, T.C.; Hong, I.-H.; Lin, S.C. Do Carbon Taxes Work? Analysis of Government Policies and Enterprise Strategies in Equilibrium. J. Clean. Prod. 2016, 139, 337–346. [Google Scholar] [CrossRef]
  53. Elliott, J.; Fullerton, D. Can a Unilateral Carbon Tax Reduce Emissions Elsewhere? Resour. Energy Econ. 2014, 36, 6–21. [Google Scholar] [CrossRef] [Green Version]
  54. Best, R.; Burke, P.J.; Jotzo, F. Carbon Pricing Efficacy: Cross-Country Evidence. Environ. Resour. Econ. 2020, 77, 69–94. [Google Scholar] [CrossRef]
Figure 1. Global energy and fuel mix and energy consumption, 1965–2020. Source: compiled by author based on the BP’s Statistical Review of World Energy.
Energies 15 04304 g001
Figure 2. Energy and fuel mix by macroregions in 2020. Source: compiled by author based on the BP’s Statistical Review of World Energy.
Energies 15 04304 g002
Table 1. Main factors and indicators used for clustering.
FactorIndicatorDescription
Level of state (regional) regulationPrice of carbonPrice of carbon obtained as effective tax rate of carbon tax or price formed at ETS
Economic developmentGDP (GRP) per capita Total gross domestic or regional product of the considered area divided by the population
EmissionsCO2 emission per capitaTotal emissions of greenhouse gasses in CO2 equivalent divided by the population
Fossil fuel dependenceNet external demand (supply) of the fossil fuels per capitaDifference between the production and consumption of the primary energy sources (crude oil, natural gas, coal) divided by the population
Table 2. Net external demand (−) and supply (+) of fossil fuels in 2019, exajoules.
CountryOilNatural GasCoalTotal
Canada6.631.840.508.97
Mexico0.93−2.04−0.31−1.42
USA−4.272.912.951.59
Argentina0.09−0.18−0.03−0.12
Chile−0.76−0.23−0.31−1.31
Colombia1.36−0.012.223.57
Denmark−0.100.01−0.04−0.13
Estonia−0.06−0.02−0.12−0.20
Finland−0.39−0.07−0.15−0.61
France−3.14−1.57−0.27−4.98
Iceland−0.040.00−0.00−0.04
Ireland−0.32−0.19−0.04−0.55
Latvia−0.08−0.05−0.00−0.13
Norway3.003.95−0.036.91
Poland−1.36−0.610.01−1.96
Portugal−0.50−0.22−0.05−0.78
Slovenia−0.11−0.03−0.04−0.18
Spain−2.70−1.30−0.09−4.08
Sweden−0.60.0−0.1−0.7
Switzerland−0.44−0.12−0.00−0.57
Ukraine−0.48−0.32−0.49−1.29
United Kingdom−0.82−1.36−0.15−2.34
China−19.78−4.71−2.03−26.52
Japan−7.32−3.89−4.89−16.10
New Zealand−0.36−0.180.02−0.52
Singapore−3.0−0.50.0−3.5
South Korea−5.16−2.02−3.42−10.60
Source: Calculated by author based on the BP’s Statistical Review of World Energy.
Table 3. Clustering according to the economic and environmental factors.
ClusterCountryIndicator *MeanMaxMin
1Newfoundland and Labrador, Canada; RGGI, USA; California, USA; Tokyo, Japan; Singapore
Alberta, Canada **
Carbon price13.823.93.7
CO2 emission14.221.38.4
GDP per capita66.869.963.1
2Quebec, Canada; Canada (country); Prince Edward Island, Canada; Denmark; UK; New Zealand; Korea; British Columbia, CanadaCarbon price25.535.815.9
CO2 emission9.815.55.4
GDP per capita47.361.633.4
3Argentina; Guangdong, China; Fujian, China; Hubei, China; Shenzhen, China; Colombia; Latvia; Mexico; Zacatecas, Mexico; Chile; UkraineCarbon price5.314.10.4
CO2 emission3.85.11.6
GDP per capita11.317.83.1
4Beijing, China; Saitama, Japan; Japan; Estonia; Slovenia; Portugal; Poland; Spain; Tianjin, China; Chongqing, China; Shanghai, ChinaCarbon price8.628.20.1
CO2 emission7.713.74.0
GDP per capita23.439.810.6
5Switzerland; Ireland; Iceland; EU; Finland; France; Norway
Sweden **
Carbon price49.272.834.8
CO2 emission6.28.04.4
GDP per capita61.286.435.7
* The units of measurement are: USD per t of CO2 (carbon price), t of CO2 per person (CO2 emission), thousand USD per person (GDP per capita). ** Countries and regions that were excluded from the sample.
Table 4. Clustering according to the economic, environmental and fossil fuel demand factors.
ClusterCountryIndicator *MeanMaxMin
1China; Argentina; Colombia; Latvia; Mexico; Ukraine; Chile; PolandCarbon price4.6014.100.08
CO2 emission4.638.241.60
GDP per capita13.3323.183.10
Net demand−0.020.07−0.07
2USA; CanadaCarbon price20.2631.838.69
CO2 emission15.3715.5015.24
GDP per capita54.7663.0646.45
Net demand0.120.240.01
3UK; Denmark; New Zealand; Spain; Portugal; SloveniaCarbon price24.1428.1917.62
CO2 emission5.816.774.84
GDP per capita37.9861.5923.55
Net demand−0.07−0.11−0.02
4Korea; Estonia; Japan
Singapore **
Carbon price6.9515.892.35
CO2 emission11.0212.228.74
GDP per capita32.0939.8123.05
Net demand−0.16−0.13−0.21
5EU; Finland; France; Ireland; Iceland; Switzerland
Sweden **
Carbon price49.2172.8334.83
CO2 emission6.228.044.40
GDP per capita61.2086.3935.73
Net demand−0.09−0.07−0.12
* The units of measurement are: USD per t of CO2 (carbon price), t of CO2 per person (CO2 emission), thousand USD per person (GDP per capita). ** Countries and regions that were excluded from the sample.
Publisher’s Note: MDPI stays neutral with regard to jurisdictional claims in published maps and institutional affiliations.

