Article

Sustainable Development According to Resource Productivity in the EU Environmental Policy Context

Faculty of Mining, Ecology, Process Control and Geotechnologies, Institute of Earth’s Resources, Technical University of Kosice, Letna 9, 042 00 Kosice, Slovakia
*
Author to whom correspondence should be addressed.
Energies 2022, 15(12), 4291; https://doi.org/10.3390/en15124291
Submission received: 5 May 2022 / Revised: 1 June 2022 / Accepted: 9 June 2022 / Published: 11 June 2022
(This article belongs to the Special Issue Energy for Sustainable Development and Circular Economy)

Abstract

:
The constant rise in the consumption of resources puts the environment under pressure. Most resources are non-renewable in nature, which is why they must be utilized with great care. For this reason, the European Union devotes increasingly more attention to their efficient use. It deals with these aspects, making an effort to maintain the long-term competitiveness and to secure sustainable development in line with all of the related environmental impacts. In this context, several goals have been set out, to which the individual EU member states are bound. A method for monitoring resource efficiency was developed, consisting of indicators, the aim of which is to assess the efficiency of the use of soil, water, energy, with the most fundamental one being resource productivity. The results of the efficiency of use of the individual resources in the member states greatly differ, even without further investigating the links and correlations between the indicators. Research on the interrelationships of the individual indicators in terms of mutual influence has not yet been completed. The aim of our study was to define the correlation between the main indicator, resource productivity, and the other indicators at the level of the EU and its member states. For this purpose, we prepared a database with data which, for the sake of uniformity, were obtained from the publicly available Eurostat database. Subsequently, the data were analyzed and evaluated using the statistical software JMP 15 by a regression and correlation analysis. By using the multiple regression analysis, we created a model describing the significance of the impact of the observed variables on the resulting resource productivity of the EU member states. Generally, there is a positive correlation between the resource productivity and the Eco-Innovation index, as well as the utilization rate of recycled materials. For the sake of comparison, we developed a regression model at the level of the V4 countries, with the aim of evaluating the impact of the historical background of the countries on their contemporary ability to reach the goals set out by the environmental policy. The V4 countries are lagging far behind in meeting all of the environmental policy objectives, not only in tracking the main indicator (resource productivity) on which the multiple regression analysis is based. It was interesting to find that the multiple regression model at the V4 level does not include the indicators defined by the EU level model, the key ones, in this case, being water productivity, energy dependence, energy productivity, and environmental tax. This finding may also, after further analyses, be the key for other countries joining the EU in the future, in defining the weaknesses of the newly acceding states in terms of the EU’s move towards a circular economy.

1. Introduction

The present-day global population and economic growth have a considerable impact on the environment. The incessant need for resources puts the environment under pressure, not only due to their depletion, but also as a result of the resource processing, which produces waste, emissions and immissions. Arguably, their amount greatly depends on the resource efficiency. In order to secure long-term sustainable development on a global scale, the resource efficiency must be as high as possible. Several legislative instruments have been approved on the EU and national level for this purpose.
The fundamental document we built upon is the “Europe 2020” strategy [1,2]. It is a strategy for delivering smart, sustainable and inclusive growth, and sustainable growth may be achieved by promoting a more resource-efficient, greener and more competitive economy. This strategy is related to the Seventh Environment Action Programme, entitled “Living well, within the limits of our planet” [3], which is a part of a long-term vision and strategy of the EU in the field of environmental protection until 2050 [4,5]. The goal of the EU is to live in line with the ecological limits of the planet until 2050. The Seventh Environment Action Program concerns the period until 2020, and its key objective is “to protect, conserve and enhance the European Union’s natural capital, to safeguard the European Union’s citizens from environment-related pressures and risks, to protect health and natural capital and to provide sound knowledge-base for the environment”. Based on these documents, it may be assumed that the protection of the environment gains more awareness not only in the EU, but also all over the world. The “OECD Green Growth Strategy” addresses the quality of the environment, as well as the optimal use of natural resources, with the future generations in mind.
Nowadays, environmental policy is included in the economic policy of almost all countries. Its objective is to enter into the production and consumption decisions in the business area, as well as the decisions of consumers, with the aim to make changes in the consumer behavior which will benefit the environment. Before the environmental policy of a state can be formulated, it is necessary to identify the problems of the environment. The environmental policy must also take several economic factors into consideration, including the economic growth, its material and energy intensity, the structure of the economy and its structural changes, as well as the environmental legislation [6,7].
The following principles apply in the environmental policies of the developed countries:
The “polluter pays” principle;
The principle of support (of public burden);
The precautionary principle;
The principle of subsidiarity;
The principle of economic efficiency;
The principle of justice;
The immediacy principle;
The sustainability principle [8].
The EU environmental policy has several dimensions with economic, political and ethical aspects. The economic aspect is crucial, especially when adopting decisions on how to meet the environmental objectives with the efficient use of environmental resources. When evaluating the impacts on the environment, the EU considers ethical and moral principles to be an integral part of its decision-making processes. The political aspect of securing the environmental policy requires countries to implement the same procedures, which allows them to formulate their objectives in a transparent manner and to maximize the efficiency of the adopted measures [9].
The need to shape the environmental policy first appeared during the existence of the EEC, after the common consumer protection standards were defined with regard to several types of dangerous substances. Later, environmental action programs would be developed, formulating the principles and priorities of the EU environmental policy [10,11].
The first action program (1975–1977) put the emphasis on the need for a scientific evaluation of the impact of waste on the environment.
The second action program (1977–1981) defined four priority areas:
  • reducing the environmental pollution;
  • the rational use of natural resources;
  • protecting and improving the quality of the environment;
  • protecting the environment on an international scale.
The third action program (1982–1986) defined the need to integrate environmental problems into other economic policies and to implement the “polluter pays” principle.
The fourth action program (1987–1992) highlighted the need to comply with the environmental legislation, to regulate pollution and to raise awareness on the state of the environment.
The fifth action program (1992–1996) coined the term “sustainable development”. Furthermore, it addressed the need to develop environmental and economic policy which would allow the meeting of the present-day needs, without reducing the ability to meet the needs of the future generations. The program specified problems, which required special attention, including:
climate change;
acidification and air quality;
urban environment;
coastal zones;
waste management;
management of water resources;
protection of nature and biodiversity [12].
The sixth action program (2002–2012) set out the intent to reflect the protection of the environment into sector policies.
The priority areas of the program include:
stabilization of greenhouse gases in the atmosphere;
the protection and restoration of natural systems, bringing the loss of biodiversity to a halt;
minimizing the environmental pollution produced by people;
better resource efficiency, minimizing waste [12].
The seventh environment action program (2012–2020) set out three key objectives:
to protect, preserve and enhance the natural capital of the European Union;
to transform the European Union into a green and competitive, resource-efficient, low-carbon economy;
to protect European Union citizens from environmental pressures and risks to health and well-being.
This long-term oriented program defines a vision beyond its application period and presents an idea of how the European Union might appear by 2050:
In 2050, we will live well, within the ecological limits of the planet. Our prosperity and healthy environment are based on an innovative circular economy in which nothing is wasted and in which the natural resources are managed sustainably and biodiversity is protected, enhanced and restored in a way that increases the resilience of our society. Our low-carbon growth has long been decoupled from resource use and sets the pace for a secure and sustainable global society [13].
The common characteristic of all of the environment action programs is the effort to use resources rationally and efficiently. Our survival depends on natural resources–metals, minerals, fuels, water, soil, wood, fertile land, clean air and biodiversity. All of these are vital for the functioning of the economies of all countries. At present, so-called critical raw materials are added to them. The European Commission has recently moved from policy concerns to its Critical Raw Materials Action Plan. The criticality of these materials requires their recycling and the improvement of technologies that do not rely on CRM, which are two pillars of a broad approach to the safety of minerals [14].
Resource efficiency means the sustainable use of the limited resources of the Earth, along with the minimization of the impacts on the environment. Enhancing resource efficiency is the key to ensuring growth and increasing the number of work opportunities in Europe, as well as in the whole world. It brings forward economic opportunities, reduces costs and improves competitiveness. This is why it is necessary to find new methods of managing production stocks, to reduce inputs, optimize production processes, management and business methods, to enhance the logistics, to change the consumption formulas and to minimize waste. It is equally important to develop new products and services, which are less input-demanding. This will allow us to produce more with a smaller volume of production factors and to provide added value with a smaller input. In connection with the above, the term ‘The Material Metabolism’ has also been introduced. The material metabolism indicators are most relevant to the current policy debate surrounding the European Green Deal–namely, material supply risk and the contribution of recycled materials to the total supply [15].
Resource efficiency will help to stimulate technological innovations, improve employability in the quickly developing sector of green technologies, open new export markets and bring benefits to consumers in the form of more sustainable products.
One of the parts of the Europe 2020 strategy, which is an EU strategy for the growth of the smart, inclusive and sustainable economy, is its main initiative “Resource-efficient Europe”. It supports the transition to sustainable growth by means of a low-carbon, resource-efficient economy.
The plan for the resource-efficient Europe is one of the key documents of the main initiative for resource efficiency. It outlines the structural and technological changes that must take place by 2050, including the milestones to be reached by 2020.
The “Towards a Circular Economy” report advocates for the final transition of the EU from the linear economy to a circular economy. It identifies the measures leading to better resource efficiency and waste reduction. It changes the usual method of the use of resources, which, after extraction, use in production, consumption and end of life as a product, return back to the loop as a production factor [14].
As a part of monitoring resource efficiency, an assessment chart was prepared, summarizing indicators, which are progressively counted and reported for the individual EU member states and subsequently published in the Eurostat databases. It includes a set of indicators related to water, soil, materials, coal, as well as the main indicator in the form of resource productivity. Further indicators were added into the monitoring, depending on the thematic areas based on the EU priorities.
Our ambition was to assess to what extent the individual states meet the objectives and how the results influence the whole progress of the European Union, based on eight basic indicators contributing to the evaluation of resource efficiency and seven indicators from thematic areas reflecting other possible impacts. Part of the research was the assessment of the impact of the fulfillment of individual indicators on the fulfillment of the other indicators, and at the same time on the fulfillment of the main indicator–the resource productivity (Table 1).
The aim of the paper is to use multiple regression to identify the indicators with the strongest impact on the key indicator, resource productivity, which is one of the main objectives of the EU environmental policy. By also repeating the methodology at the level of the V4 countries—Slovakia, Czech Republic, Poland, Hungary—we want to show the influence of the historical background of a country on the overall level of environmental performance and the related impacts.

2. Materials and Methods

The aim of this paper was to evaluate resource efficiency at the level of the EU member states, with regard to the EU environmental policy, as well as to develop a multiple linear regression model for estimating the resource productivity parameters at the level of the EU. The analysis was repeated at the level of the V4 countries—Czech Republic, Slovakia, Hungary, Poland, former Eastern bloc countries—as these are countries with lower values of resource productivity. Our aim was to verify the influence of historical background on the direction of these countries towards achieving the environmental policy goals.
The resource productivity indicator is included in the table of resource efficiency indicators. It is used for monitoring the progress towards the resource-efficient Europe. Resource productivity is the main indicator of the assessment chart.
It is expressed as the ratio of gross domestic product (GDP) and domestic material consumption (DMC). The DMC measures the total amount of materials that are directly consumed in the economy. It is defined as the annual quantity of raw materials extracted from the domestic territory plus all of the physical imports minus all of the physical exports. It should be noted that the term “consumption”, as used in the DMC, denotes the apparent consumption and not the final consumption. DMC does not include the upstream flows related to the imports and exports of raw materials and products which originate outside of the local economy.
RESOURCE   PRODUCTIVITY = GDP DMC   [ PPS · kg 1 ]
DMC   = EXTRACTION + IMPORT EXPORT   [ kg ]
Resource   productivity = GDP EXTRACTION + IMPORT EXPORT   [ PPS · kg 1 ]
PPS—Purchasing power standards are artificial “currency” units, which remove the differences in the purchasing power; thus, eliminating the differences between the price levels in the individual countries, and are used for making comparisons between countries.
Multiple linear regression allows us to examine the correlation between response (Y) and several independent variables at the same time. It is a suitable tool for a prediction analysis, the result of which will be a model for estimating future mean response values (Y) based on its correlations with other prediction variables (Xs), where β parameters are unknown parameters of the regression model and ε is a random observational error.
Y = β 0 + β 1 X 1 + +   β k X k + ε  
At the same time, it has an analytical function explaining the relations between the response variable and the predictor variable. In our case, the response (Y) is the “resource productivity” indicator, which is, at the same time, a summarizing indicator reflecting the total resource efficiency of the individual countries as well as the EU as a whole. All of the other indicators were considered as prediction variables. By using the multiple regression, we derived a linear regression model for predicting the resource productivity of the whole EU. We then examined the strength of the impact of individual predictors on the response itself, which allowed us to define the key factors affecting resource productivity in the EU. We repeated this methodology in the analysis of the V4 countries, in an effort to verify the influence of the historical background of the countries on the low values of resource productivity and to compare which factors are key for productivity growth in the former Eastern bloc countries—Czech Republic, Slovakia, Poland, Hungary. These models were then analyzed and we studied the differences in the significance of the individual input parameters and their effect on the resource productivity.
The data were collected by continuously noting the published values of selected variables from the portal at https://ec.europa.eu/eurostat/data/database (accessed on 9 March 2022) for all of the years and the member states available. We compiled the records of the collected data, which we sorted out and modified in a database created in the sheet editor MS Excel, based on the requirements of the statistical software JMP; the modified data were transferred into the software and analyzed. The collected data present the results of 15 indicators for the period of 1990–2020 (Table 2). The final database comprises 21,033 pieces of data, with each indicator defined for a specific EU member state and a specific year. As shown in Table 2, the quantity of the published data differs between the individual indicators, and the differences in the volume of data result from the fact that some of the countries provided incomplete records or published data for certain indicators only every other year, such as in the case of the waste recycling rate, waste production rate and landfill rate. The analyses were selected and the conclusions were formulated based on the extent and the structure of the data obtained.

3. Results

3.1. Multiple Linear Regression Analysis on the EU Level

By analyzing the 14 input parameters and the effect on the output variable “resource productivity” for all of the EU member states, we discovered that the Domestic material consumption per capita, the utilization rate of recycled materials, the Eco-Innovation index, water productivity and greenhouse gas emissions per capita contributed the most to the total resource productivity (Table 3).
The insignificant parameters were gradually excluded from the models, and the process of developing the model was repeated until only the significant parameters remained, ordered by their statistical significance (Table 4). The most significant parameters of the model were the Domestic material consumption per capita, Circular material use rate and Eco-Innovation index.
The following figure describes the impact of the individual parameters on the resulting resource productivity, and the angle of the line clearly shows that two variables have a negative effect, namely, the Domestic material consumption and the Recycling rate, with the remaining parameters having a positive effect on the resulting resource productivity value (Figure 1), which is equally reflected in the prediction model itself.
A surprising finding is the fact that increasing the recycling rate of materials has a negative impact on the overall productivity of the country ’s resources. Of course, it is necessary to take into account the mutual influence of other indicators. As can be seen from Figure 1, domestic per capita material consumption has a concurrent effect on the resulting resource productivity. It is clear that, in the case of these two parameters, it is necessary to examine in more detail the extent of the impact of the Domestic consumption of materials on the intensity of the slope of the line representing the Recycling rate. To this end, we are conducting further research. The Recycling rate should have a positive effect on the resource productivity rate. On the contrary, we consider the negative impact of the consumption growth on the overall resource productivity to be the correct result of the analysis.
The model interprets the statistically significant part of variability (Table 5). The p-value is <0.05, which means that the zero hypothesis H0 is valid (H0 = the model interprets the statistically significant part of variability (p-value = 0.0001 *)).
By including all of the statistically significant parameters (indicators), the model will describe 94% of the variability (Rsquare = 0.94) in Table 6, which means that the model delivers reliable predictions.
The resulting model (Figure 2) represents a mathematical relation between the inputs and the response. The analysis defined 8 out of the 14 indicators significantly contributing to the resource productivity results, analyzed on the Pan-European level. The inputs with a statistically significant impact on the resource productivity include: Domestic material consumption per capita; Circular material use rate; Energy productivity; Greenhouse gas emissions per capita; Eco-Innovation index; Recycling rate and Water productivity.

3.2. Multiple Linear Regression Analysis on the V4 Level

In this case, we only repeated the multiple linear regression analysis for the V4 countries, in order to examine whether there is any substantial deviation from the existing multiple linear regression analysis model for the whole of the EU. Just as in the previous chapter, the resource productivity was the dependent variable, and the independent variables were the same 14 input parameters. We analyzed the statistical significance of the impact of the input variables, and we discovered that the Domestic material consumption per capita and Energy productivity (Table 7) contributed the most significantly to the total resource productivity in the V4 countries.
Using the same method of increasing the significance of parameters, as described in the previous section, we ordered the significant parameters by their statistical significance (Table 8) The most significant parameters of the model are: Domestic material consumption per capita; Water productivity; Energy dependence; Energy productivity and Environmental tax.
The impact of the individual parameters on the resulting resource productivity is described in Figure 3, and the angle of the line clearly suggests that three variables have a negative impact—the Domestic material consumption per capita, Energy dependence and Environmental tax, with the remaining parameters having a positive impact on the resulting value of the resource productivity. As in the case of the EU analysis, the Domestic consumption of materials per capita has the greatest negative impact on overall resource productivity. It is followed by Energy dependence, which is also confirmed historically. It is also interesting to note that while within the EU, the environmental taxes have a statistically insignificant impact on the overall resource productivity, within the V4 countries, increasing the environmental taxes has a clear negative impact on the resulting indicator. In this case, the reason may also be the aforementioned Energy dependence and the efforts of the V4 countries to maximize the use of their own energy resources, which are mostly non-ecological.
The model also interprets the statistically significant part of variability (Table 9) in this case. The p-value is <0.05, which means that the zero hypothesis H0 is valid (H0 = the model interprets the statistically significant part of variability (p-value = 0.0001 *)).
By including all of the statistically significant parameters (indicators), the model will describe 98% of the variability (Rsquare = 0.98) in Table 10, which in this case also means that the model delivers reliable predictions
The resulting model (Figure 4) represents a mathematical relationship between the input indicators and resource productivity at the level of the V4 countries. We analyzed 14 input indicators, and the model excluded 9 of the indicators which were statistically insignificant. The analysis defined five indicators with a statistically significant contribution to the resource productivity results analyzed at the level of the V4 countries—Water productivity; Energy productivity; Domestic material consumption per capita; Energy dependence; Environmental tax.
After comparing both models, it may be concluded that a considerable difference was identified between these two models, with the historical background of the countries possibly having the most substantial influence. Major limitations in the progress of the V4 countries were detected. Europe has pursued the path of the circular economy by means of implementing green innovations or using waste as a secondary resource, but the V4 countries fall short in implementing these principles. This provides space for further research by the scientific community in the areas of eco-innovations and the ecologization of technologies.

4. Discussion and Conclusions

Haider and Bhat (2020) studied the link between the material and energy efficiency on the one side and the total factor productivity on the other and found out that not all of the countries have the same energy demands. Increasing the total factor productivity is associated with decreased energy levels per a unit of input [27,28]. This was also confirmed in our research, but the impact of energy productivity is more significant in the case of regression analysis at the level of the V4 countries.
Neither does the consumption of materials and energy have a causal link with the gross domestic product [29], which must be monitored due to sustainable development. The afore-mentioned finding was also validated by the study of Belke et al. (2011), who attempted to find a long-term relationship between the consumption of materials and energy and the GDP [30,31].
The findings of the research conducted for the presented paper point out to the need to focus not only on the final goal, but also on the associated factors which influence its achievement. This means that the correlations discovered may help the countries with major differences to redirect their funds to areas seemingly unrelated to a specific goal but which may ultimately accelerate its achievement. For instance, by increasing the recycling rate, the countries will contribute not only to achieving the goal of the decreased landfill rate, but they may also enable the decrease in the Domestic material consumption per capita or to increase the Energy productivity of the state.
It is also necessary to study the productivity in the field of recycling materials [32], which contributes to the improvements in the disposal of solid municipal waste. In addition, it is crucial to take into consideration the use of materials and their recycling, especially in the civil engineering [33], which is affected by factors such as the energy consumption, carbon footprint and the total construction productivity.
If strategies involving the best practices in waste collection were implemented, 18 mil. tons of waste could be collected in Europe on top of the present-day volumes, which would lead to a 13% decrease in the greenhouse gas emission production related to packaging and its waste. Although the high performance of the collection is decisive for resource efficiency, simply improving the systems of the collection of wastes separated from resources will not be sufficient for reaching recycling goals and the goals of decreased greenhouse gas emissions’ production; the material losses must be decreased in the entire value chain, i.e., in the phase of the separation of the recycling [34,35].
The results of the analyses confirm the above-mentioned hypothesis and suggest that countries focusing solely on decreasing the production of emissions associated with fossil energy and transport may not attain the desired progress, if they fail to provide an equally intense support for the innovative processes and research and development activities aimed at the ecologization of processes.
Kuhl et al. [36] discuss business models for the circular economy (CE) with potential environmental benefits and resource productivity. The circular business models, based on refurbishing and reusing, promise significant savings in costs as well as major decreases of the negative impact on the environment [37,38,39]. Resource processing must change radically from the linear-use model based on the purpose to a more sustainable, circular model. In this context, Velenturf et al. (2020) developed a model that acknowledges the complex character of our resource flows [40,41,42]. The environmental sustainability must be interconnected with the concepts of the green economy, the circular economy and the bioeconomy [43,44].
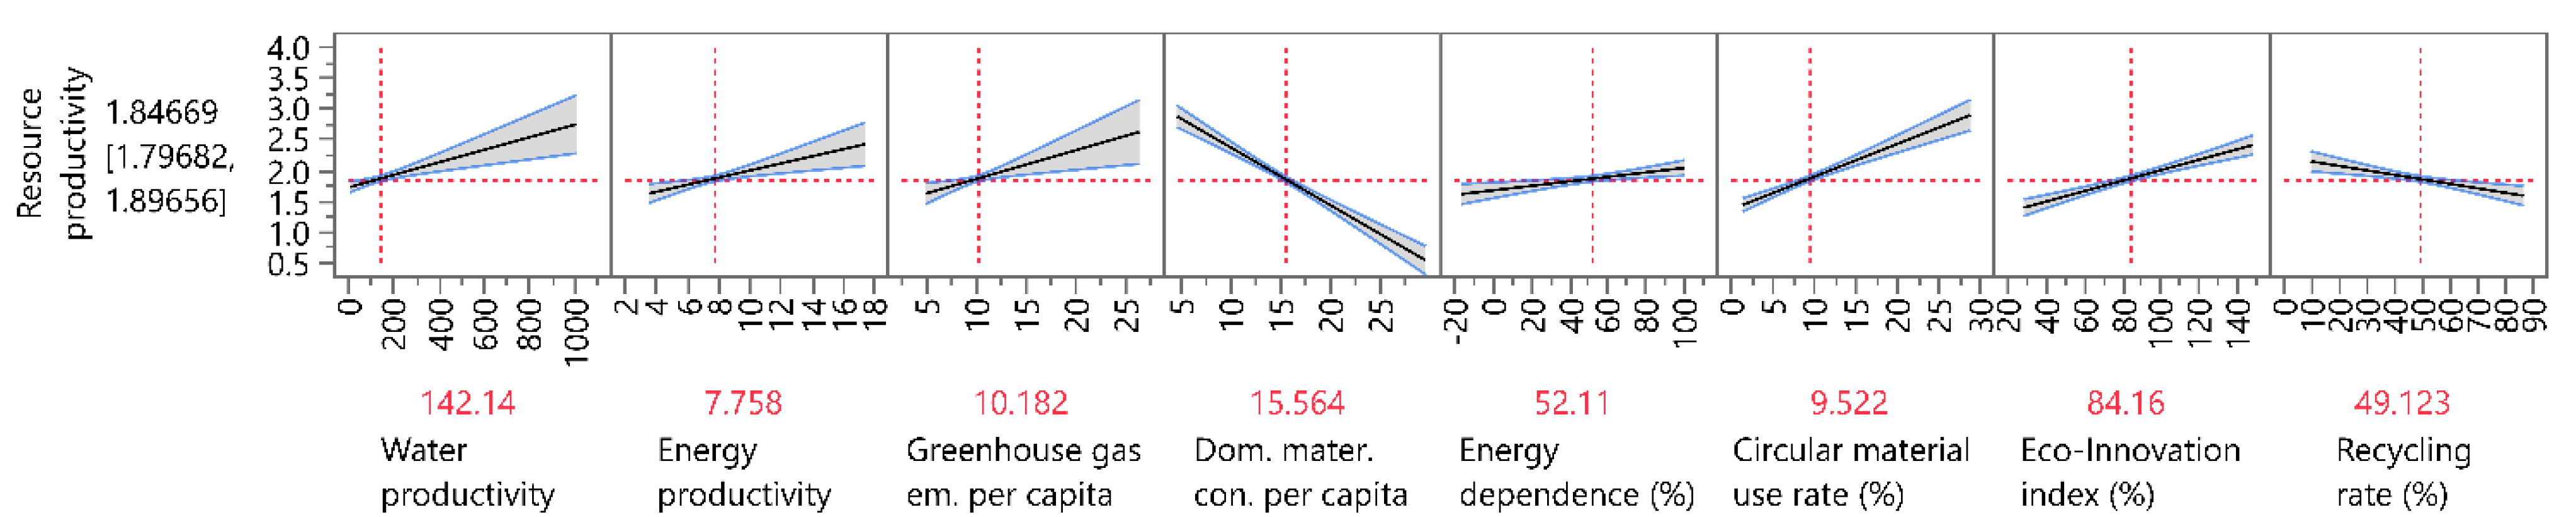
The multiple linear regression model of resource productivity (Figure 2) suggests that if we intend to increase resource productivity, it is vital to develop and support other areas, such as water productivity, energy dependence, use of renewable energy sources and recycling. The results of the paper include mathematical models pointing out the significance of the individual factors, with the reliability of their impact within the created model being up to 94%.
However, according to Loiseau et al., the links with sustainability are not always clear since there are various degrees of substitutability, compromises between environmental and economic advantages are allowed, and they require more-or-less structural changes to our way of living [45,46,47]. In addition, the circular economy needs to be linked to the approach to human development (HD), as one of the discussions concerns the missing social and human dimension of the circular economy. Schroder et al. (2020) include the socio–economic elements of the transformation from linear to circulating economic models in combination with HD from social science and development studies [48,49].
This may be related to the application of the results of analyses in the area of the impact of taxes on citizens and entrepreneurs. Resource productivity in a country may also become more efficient if the energy and environmental taxes are set correctly. Such taxes also include a carbon tax. Implementing low-carbon operations across supply chains is vital for a cleaner, more sustainable world [50].
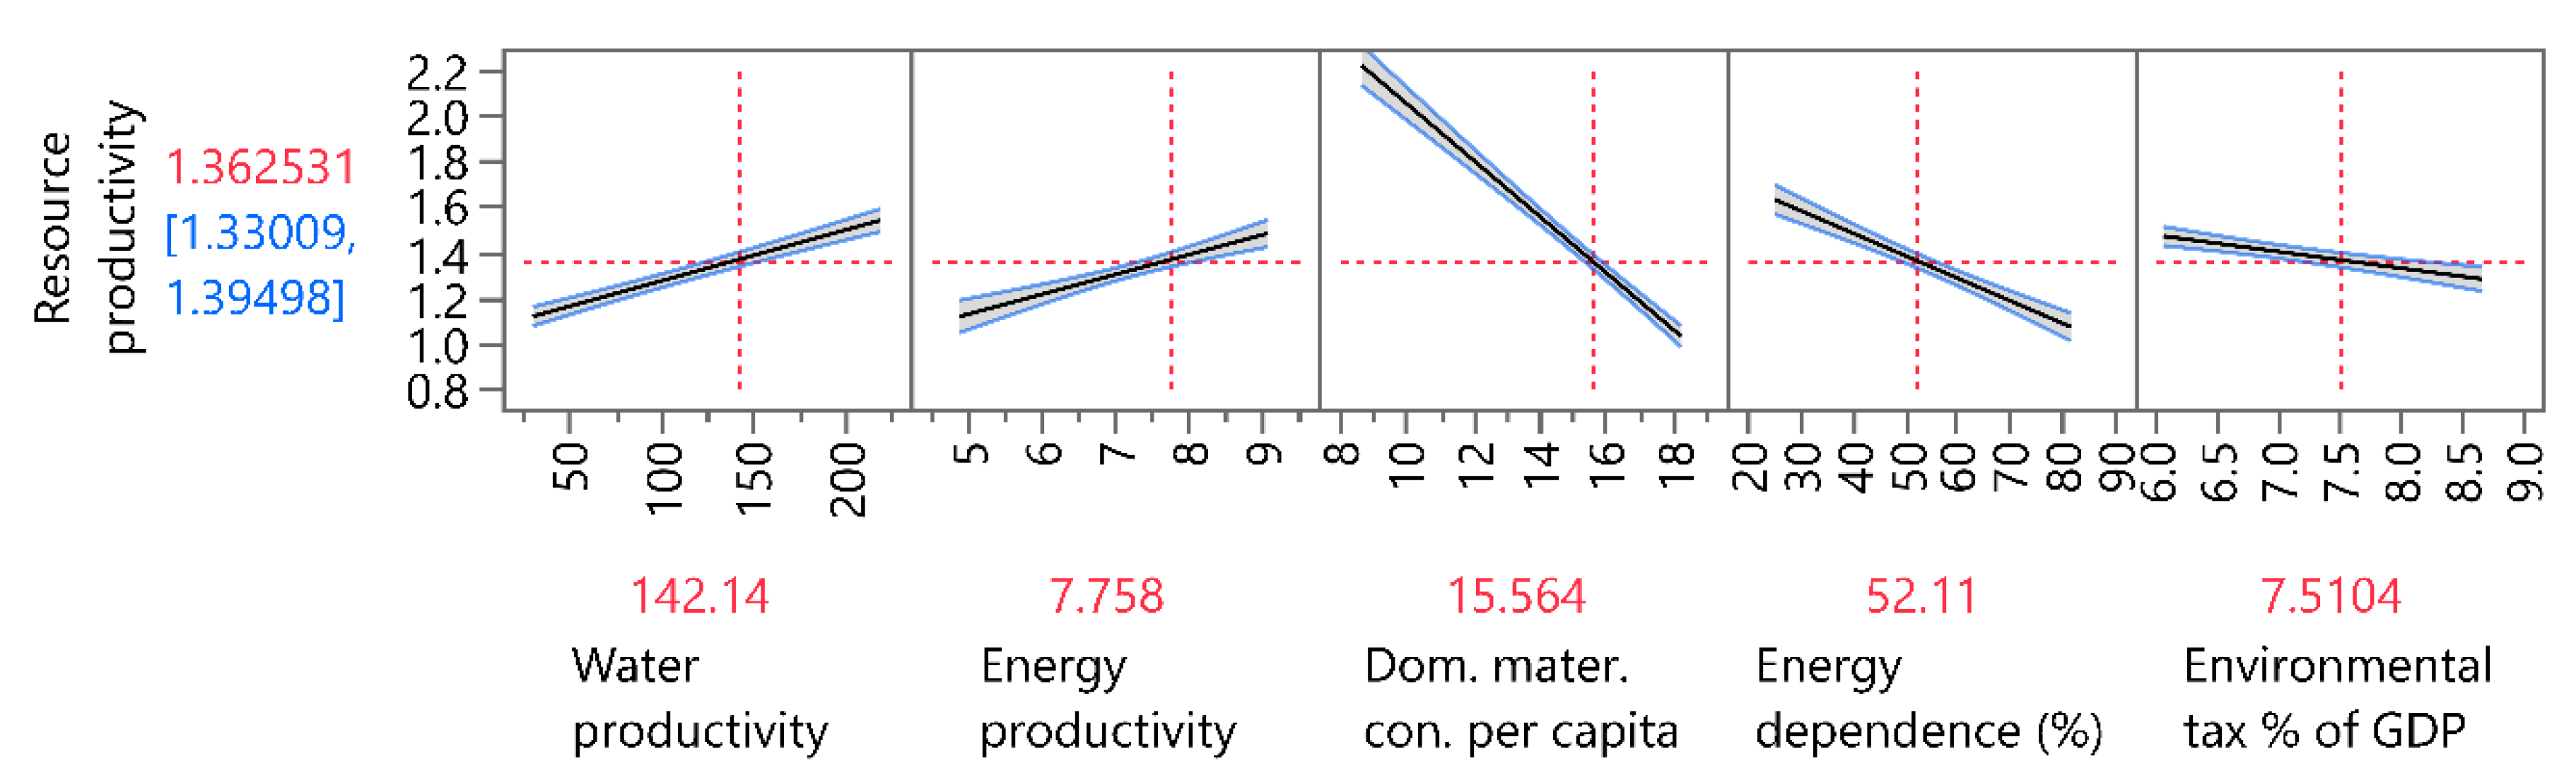
By means of a multiple regression model, we expressed the mathematical relation between the main indicator of “Resource productivity” and the other indicators, both at the level of the EU and at the level of the V4 countries, and we identified a substantial difference between these two models. Major constraints in the development of the V4 countries have been identified. Europe is moving towards a circular economy through the introduction of eco-innovations or the use of waste as a secondary resource. The model at the V4 level does not mention these factors or defines their impact as insignificant; here, the insufficient level of moving these countries towards a circular economy is reflected. It identifies water productivity, energy dependence, energy productivity and environmental tax as the most significant factors. These findings may also be valuable in terms of defining the key drivers of inadequacy of the newly acceding countries to the EU.
In order to reach the goals of the sustainable development with the focus on the circular economy, it is vital to scrutinize every possible sustainable alternative in various fields. This is important for the future development plans of policy-makers [51,52].
The results of the study suggest that setting out long-term goals in sustainable development is a complex process, which, apart from technical and economic knowledge, requires an understanding of the statistical data processing and evaluation, and ultimately the skill of their usable presentation. Within the presented analyses, it was proved that it is necessary to examine in detail, not only the influence of individual parameters on the resulting productivity of resources, but also the effects of the parameters between each other. Further research will focus on the analysis of such interrelationships, and on the determination of the methodology (behavior pattern) for their prediction. By setting out the correct determination of the indicators’ plan, on the basis of knowledge of their interaction, it will be possible to optimize the overall resource productivity more effectively.
It is clear that, by scrutinizing the effects of all of the indicators based on the highest amount of highly detailed data possible, we are able to define models of their dependence affecting the achievement of goals, with a reliability of almost 100%. Individual countries, as well as organizations such as the European Union, should therefore expand the processes of data collection and evaluation to facilitate reaching goals in the field of the sustainable development for all of the stakeholders and to make it more realistic.

Author Contributions

Conceptualization, M.T. and P.T.; methodology, M.T.; software, M.T.; validation, L.D. and P.T.; formal analysis, M.T.; investigation, M.T.; resources, P.T.; data curation, L.D. and P.T.; writing—original draft preparation, M.T.; writing—review and editing, P.T.; visualization, M.T.; supervision, L.D.; project administration, L.D.; funding acquisition, L.D. All authors have read and agreed to the published version of the manuscript.

Funding

This research was funded by VEGA, grant number 1/0797/20.

Institutional Review Board Statement

Not applicable.

Informed Consent Statement

Not applicable.

Data Availability Statement

Not applicable.

Acknowledgments

Contribution presents the partial result of grant project VEGA 1/0797/20.

Conflicts of Interest

The authors declare no conflict of interest.

References

  1. Barbier, E.B. The Green Economy Post Rio+. Science 2012, 338, 887–888. [Google Scholar] [CrossRef] [PubMed]
  2. Environmental Policy—Resource Efficiency. Available online: https://ec.europa.eu/environment/resource_efficiency/index_en.htm (accessed on 9 March 2022).
  3. Living Well, within the Limits of Our Planet. Available online: http://ec.europa.eu/environment/pubs/pdf/fact-sheets/7eap/en.pdf (accessed on 11 March 2019).
  4. The Lisbon Strategy. European Parliament resolution of 20 February 2008 on the input for the 2008 Spring Council as regards the Lisbon Strategy. Off. J. Eur. Union 2009, C184, 30–38. Available online: https://eur-lex.europa.eu/LexUriServ/LexUriServ.do?uri=OJ:C:2009:184E:0030:0038:SK:PDF (accessed on 7 March 2022).
  5. European Union. 2050 Long-Term Strategy. European Union. Available online: https://ec.europa.eu/clima/policies/strategies/2050_en (accessed on 9 March 2022).
  6. Loiseau, E.; Saikku, L.; Antikainen, R.; Droste, N.; Hansjürgens, B.; Pitkänen, K.; Leskinen, P.; Kuikman, P.; Thomsen, M. Green economy and related concepts: An overview. J. Clean. Prod. 2016, 139, 361–371. [Google Scholar] [CrossRef]
  7. Act, no. 17/1992 Coll. on the Environment, Sec. 2. Available online: https://zakony.judikaty.info/predpis/zakon-17/1992 (accessed on 7 March 2022).
  8. Romančíková, E. Ekonómia a Životné Prostredie; EKONÓMIA, Ed.; Iura Edition: Bratislava, Slovenia, 2011; ISBN 978-80-8078-426-3. [Google Scholar]
  9. Lieskovská, Z. Pár slov o histórii integrácie v európskom priestore a vývoji environmentálnej politiky. Enviromagazín 2004, 9, 14–15. [Google Scholar]
  10. European Parliament. Directive 2009/28/EC of the European Parliament and of the Council, of 23 April 2009, on the Promotion of the Use of Energy from Renewable Sources and Amending and Subsequently Repealing Directives 2001/77/EC and 2003/30/EC. Available online: https://eur-lex.europa.eu/legal-content/EN/ALL/?uri=CELEX:32009L0028 (accessed on 9 March 2022).
  11. The Fifth Environmental Action Programme. Available online: https://ec.europa.eu/environment/archives/action-programme/5th.htm (accessed on 7 March 2022).
  12. The Sixth Environment Action Programme—SEAP for the Period of 2002. Available online: https://ec.europa.eu/environment/archives/action-programme/intro.htm (accessed on 7 March 2022).
  13. European Union (EU). The 7th Environment Action Programme (7th EAP); European Union: Bruseels, Belgium, 2014; Available online: https://eur-lex.europa.eu/legal-content/EN/TXT/?uri=CELEX:32013D1386 (accessed on 7 March 2022).
  14. Pommeret, A.; Ricci, F.; Schubert, K. Critical raw materials for the energy transition. Eur. Econ. Rev. 2021, 141, 103991. [Google Scholar] [CrossRef]
  15. Peiró, L.T.; Martin, N.; Méndez, G.V.; Madrid-López, C. Integration of raw materials indicators of energy technologies into energy system models. Appl. Energy 2021, 307, 118150. [Google Scholar] [CrossRef]
  16. Eurostat Metadata on Resource Productivity. Available online: https://ec.europa.eu/eurostat/cache/metadata/en/t2020_rl100_esmsip2.htm (accessed on 12 March 2022).
  17. Eurostat Metadata on Domestic Material Consumption per Capita. Available online: https://ec.europa.eu/eurostat/cache/metadata/en/t2020_rl110_esmsip2.htm (accessed on 12 March 2022).
  18. Eurostat Metadata on the Productivity of Artificial Land. Available online: https://ec.europa.eu/eurostat/cache/metadata/en/t2020_rd100_esmsip2.htm (accessed on 12 March 2022).
  19. Eurostat Metadata on Built-Up Areas. Available online: https://ec.europa.eu/eurostat/cache/metadata/en/t2020_rd110_esmsip2.htm (accessed on 12 March 2022).
  20. Directive 2000/60/EC of the European Parliament and of the Council of 23 October 2000 Establishing a Framework for Community Action in the Field of Water Policy. Available online: https://eur-lex.europa.eu/legal-content/SK/TXT/PDF/?uri=CELEX:02000L0060-20090625&from=ET (accessed on 9 March 2022).
  21. Eurostat Metadata on the Water Exploitation Index. Available online: https://ec.europa.eu/eurostat/cache/metadata/en/t2020_rd220_esmsip2.htm (accessed on 12 March 2022).
  22. Eurostat Metadata on Water Productivity. Available online: https://ec.europa.eu/eurostat/cache/metadata/en/t2020_rd210_esmsip2.htm (accessed on 12 March 2022).
  23. Eurostat Metadata on Greenhouse Gas Emissions per Capita. Available online: https://ec.europa.eu/eurostat/cache/metadata/en/t2020_rd300_esmsip2.htm (accessed on 12 March 2022).
  24. Eurostat Metadata on Energy Productivity. Available online: https://ec.europa.eu/eurostat/cache/metadata/en/t2020_rd310_esmsip2.htm (accessed on 12 March 2022).
  25. Eurostat Metadata on Energy Dependence. Available online: https://ec.europa.eu/eurostat/cache/metadata/en/t2020_rd320_esmsip2.htm (accessed on 12 March 2022).
  26. Eurostat Metadata on the Share of Renewable Energy in Gross Final Energy Consumption. Available online: https://ec.europa.eu/eurostat/cache/metadata/en/t2020_rd330_esmsip2.htm (accessed on 12 March 2022).
  27. Allwood, J.M. Squaring the circular economy: The role of recycling within a hierarchy of material management strategies. In Handbook of Recycling: State-of-the-Art for Practitioners, Analysts, and Scientists; Elsevier: Amsterdam, The Netherlands, 2014; pp. 445–477. [Google Scholar]
  28. Haider, S.; Bhat, J.A. Does total factor productivity affect the energy efficiency: Evidence from the Indian paper industry. Int. J. Energy Sect. Manag. 2020, 14, 108–125. [Google Scholar] [CrossRef]
  29. Al-Iriani, M.A. Energy–GDP relationship revisited: An example from GCC countries using panel causality. Energy Policy 2006, 34, 3342–3350. [Google Scholar] [CrossRef]
  30. Belke, A.; Dobnik, F.; Dreger, C. Energy consumption and economic growth: New insights into the cointegration relationship. Energy Econ. 2011, 33, 782–789. [Google Scholar] [CrossRef]
  31. Andersen, M.S. An introductory note on the environmental economics of the circular economy. Sustain. Sci. 2006, 2, 133–140. [Google Scholar] [CrossRef]
  32. Silva, H. The Ergonomics of Sorting Recyclable Materials: A Case Study of a Brazilian Cooperative. Adv. Intell. Syst. Comput. 2019, 970, 256–265. [Google Scholar] [CrossRef]
  33. Peshkov, V.V. Some aspects of construction industry development in 2018. IOP Conf. Ser. Mater. Sci. Eng. 2019, 687, 044010. [Google Scholar] [CrossRef]
  34. Blomsma, F.; Brennan, G. The Emergence of Circular Economy: A New Framing Around Prolonging Resource Productivity. J. Ind. Ecol. 2017, 21, 603–614. [Google Scholar] [CrossRef]
  35. Environment of the Slovak Republic. Strategy, Principles and Priorities of the State Environmental Policy; The Ministry of the Environment of the Slovak Republic: Bratislava, Slovakia, 2004.
  36. Kuhl, C.; Tjahjono, B.; Bourlakis, M.; Aktas, E. Implementation of circular economy principles in PSS operations. Procedia CIRP 2018, 73, 124–129. [Google Scholar] [CrossRef]
  37. Linder, M.; Williander, M. Circular Business Model Innovation: Inherent Uncertainties. Bus. Strat. Environ. 2015, 26, 182–196. [Google Scholar] [CrossRef]
  38. Geissdoerfer, M.; Savage, P.; Bocken, N.M.P. The circular economy—A new sustainability paradigm? J. Clean. Prod. 2017, 143, 757–768. [Google Scholar] [CrossRef]
  39. Wright, C.Y.; Godfrey, L.; Armiento, G.; Haywood, L.K.; Inglesi-Lotz, R.; Lyne, K.; Schwerdtle, P.N. Circular economy and environmental health in low- and middle-income countries. Glob. Heal. 2019, 15, 1–5. [Google Scholar] [CrossRef]
  40. Kirchherr, J.; Reike, D.; Hekkert, M. Conceptualizing the circular economy: An analysis of 114 definitions. Resour. Conserv. Recycl. 2017, 127, 221–232. [Google Scholar] [CrossRef]
  41. Bocken, N.M.P.; Olivetti, E.A.; Cullen, J.M.; Potting, J.; Lifset, R. Taking the Circularity to the Next Level: A Special Issue on the Circular Economy. J. Ind. Ecol. 2017, 21, 476–482. [Google Scholar] [CrossRef]
  42. Velenturf, A.P.M.; Purnell, P.; Macaskie, L.E.; Mayes, W.M.; Sapsford, D.J. A new perspective on a global circular economy (book chapter). RCS Green Chem. 2020, 2020, 3–22. [Google Scholar]
  43. Borel-Saladin, J.M.; Turok, I.N. The green economy: Incremental change or transformation? Environ. Policy Gov. 2013, 23, 209–220. [Google Scholar] [CrossRef]
  44. Buchta, M. Praktické pojetí pojmu externality. Externality a Možnosti Jejich Rěšení. Sborník Referátov z Teoretického Semi-náře; Masaryková Univerzita v Brne: Brno, Czech Republic, 1998; pp. 21–25. [Google Scholar]
  45. Schröder, P.; Lemille, A.; Desmond, P. Making the circular economy work for human development. Resour. Conserv. Recycl. 2020, 156, 104686. [Google Scholar] [CrossRef]
  46. D’Amato, D.; Droste, N.; Allen, B.; Kettunen, M.; Lahtinen, K.; Korhonen, J.; Leskinen, P.; Matthies, B.D.; Toppinen, A. Green, circular, bio economy: A comparative analysis of sustainability avenues. J. Clean. Prod. 2017, 168, 716–734. [Google Scholar] [CrossRef]
  47. Zhou, X.; Wei, X.; Lin, J.; Tian, X.; Lev, B.; Wang, S. Supply chain management under carbon taxes: A review and bibliometric analysis. Omega 2020, 98, 102295. [Google Scholar] [CrossRef]
  48. D’Amato, D.; Droste, N.; Chan, S.; Hofer, A. The green economy: Pragmatism or revolution? Perceptions of young researchers on social ecological transformation. Environ. Values 2017, 26, 413–435. [Google Scholar] [CrossRef]
  49. Šauer, P.; Livingston, M. Ekonomie Životního Prostředí a Ekologická Politika—Vybrané Klasické Stati. Praha—Mineapolis—Grelly—Bratislava; Technical University of Ostrava: Ostrava, Czech Republic, 1996; pp. 17–23. [Google Scholar]
  50. Hranaiová, M. Kvantifikácia externalít environmentálneh charakteru. Životné prostredie 2002, 36, 14–16. [Google Scholar]
  51. Dini, W.; Irwan, B.; Mangara, T. Alternative selection in reducing wood scarp with green productivity approach. E3S Web Conf. 2018, 73, 70233. [Google Scholar] [CrossRef]
  52. Ježek, P. Externality, problémy a jejich řešení. In Externality a Možnosti Jejich Řešení. Sborník Referátov z Teoretického Semináře; Masarykova Univerzita v Brne: Brno, Czech Republic, 1998; pp. 27–35. [Google Scholar]
Figure 1. Impact of the individual parameters on the resource productivity value—EU (analyzed by the authors based on the EC data in the JMP software).
Energies 15 04291 g001
Figure 2. Multiple linear regression model of resource productivity for the EU (analyzed by the authors based on the EC data in the JMP software).
Energies 15 04291 g002
Figure 3. Impact of the individual parameters on the resource productivity value—V4 (analyzed by the authors based on the EC data in the JMP software).
Energies 15 04291 g003
Figure 4. Multiple linear regression model of resource productivity for the V4 (analyzed by the authors based on the EC data in the JMP software).
Energies 15 04291 g004
Table 1. Selected indicators of the Assessment chart of resource efficiency (processed by the authors based on the Eurostat data).
Name of the IndicatorObjective
Resource productivityIncrease
Domestic material consumption per capitaDecrease
Water exploitation indexDecrease
Water productivityIncrease
Greenhouse gas emissions per capitaDecrease
Energy productivityIncrease
Energy dependenceDecrease
Share of renewable energy in gross final energy consumptionIncrease
Circular material use rateIncrease
Eco-Innovation indexIncrease
Recycling rateIncrease
Generation of waste excluding major mineral waste per GDPDecrease
Landfill rateDecrease
Environmental tax % of GDP
Energy tax % of GDP
Table 2. Structure of the collected data (Source: processed by the authors in the Excel interface) [16,17,18,19,20,21,22,23,24,25,26].
Name of the IndicatorNumber of DataReported Period
Resource productivity7422000–2020
Domestic material consumption per capita8321990–2020
Water exploitation index13811990–2019
Water productivity10921990–2019
Greenhouse gas emissions per capita6802000–2019
Energy productivity15461990–2020
Energy dependence46361990–2020
Share of renewable energy in gross final energy consumption6432004–2020
Circular material use rate3402004–2020
Eco-Innovation index2872010–2019
Recycling rate1382010, 2012, 2014, 2016, 2018
Generation of waste excluding major mineral waste per GDP2862004, 2006, 2008, 2010, 2012, 2014, 2016, 2018
Landfill rate1382010, 2012, 2014, 2016, 2018
Environmental tax % of GDP41461995–2020
Energy tax % of GDP41461995–2020
Total21,0331990–2020
Table 3. Estimation of the parameters of the model, ordered by their statistical significance—EU (analyzed by the authors based on the EC data in the JMP software).
Sorted Parameter Estimates
TermEstimateStd Errort Ratio Prob > |t|
Domestic material consumption per capita (t)−0.0998660.012525−7.97 Energies 15 04291 i001<0.0001
Circular material use rate (%)0.05134180.0078876.51 Energies 15 04291 i002<0.0001
Eco-Innovation index (%)0.00911880.0016775.44 Energies 15 04291 i003<0.0001
Water productivity0.00114890.0004762.42 Energies 15 04291 i0040.0189
Greenhouse gas emissions per capita0.05175650.0231882.23 Energies 15 04291 i0050.0295
Energy dependence (%)0.00333350.0019391.72 Energies 15 04291 i0060.0910
Energy productivity0.0446950.0260821.71 Energies 15 04291 i0070.0919
Environmental tax % of GDP0.04687440.0285071.64 Energies 15 04291 i0080.1055
Energy tax % of GDP−14.789111.15977−1.33 Energies 15 04291 i0090.1903
Share of renewable energy in gross final energy consumption (%)0.00596170.0069440.86 Energies 15 04291 i0100.3941
Recycling rate (%)−0.0046290.006708−0.69 Energies 15 04291 i0110.4929
Landfill rate (%)0.00139560.0059410.23 Energies 15 04291 i0120.8151
Water exploitation index0.00079420.0036180.22 Energies 15 04291 i0130.8270
Generation of waste excluding major mineral waste per GDP (kg/1000€)−0.0000230.000458−0.05 Energies 15 04291 i0140.9602
Table 4. Significant parameters of the model for the EU (analyzed by the authors based on the EC data in the JMP software).
SourceLogworth p Value
Domestic material consumption per capita (t)17.020 Energies 15 04291 i0150.00000
Circular material use rate (%)11.327 Energies 15 04291 i0160.00000
Eco-Innovation index (%)9.397 Energies 15 04291 i0170.00000
Water productivity3.429 Energies 15 04291 i0180.00037
Recycling rate (%)3.199 Energies 15 04291 i0190.00063
Energy productivity2.679 Energies 15 04291 i0200.00210
Energy dependence (%)2.547 Energies 15 04291 i0210.00283
Greenhouse gas emissions per capita2.333 Energies 15 04291 i0220.00465
Table 5. Test of the statistically significant parameters of the model—EU (analyzed by the authors based on the EC data in the JMP software).
Analysis of Variance
SourceDFSum of SquaresMean SquareF Ratio
Model849.8510856.23139133.4926
Error663.0808550.04668Prob > F
C. Total7452.931940 <0.0001
Table 6. Descriptive ability of the model—% of the variability described by the model for the EU (analyzed by the authors based on the EC data in the JMP software).
Summary of Fit
RSquare0.941796
RSquare Adj0.934741
Root Mean Square Error0.216055
Mean of Response1.848779
Observations (or Sum Wgts.)75
Table 7. Estimation of the regression model parameters, ordered by their statistical significance—V4. (analyzed by the authors based on the EC data in the JMP software).
Sorted Parameter Estimates
TermEstimateStd Errort Ratio Prob > |t|
Domestic material consumption per capita (t)−0.162520.034653−4.69 Energies 15 04291 i0230.0054
Energy productivity0.18234760.0575893.17 Energies 15 04291 i0240.0249
Recycling rate (%)−0.0204960.012463−1.64 Energies 15 04291 i0250.1610
Water productivity0.00204570.0013341.53 Energies 15 04291 i0260.1857
Landfill rate (%)−0.0166020.011076−1.50 Energies 15 04291 i0270.1942
Greenhouse gas emissions per capita0.08234710.0557961.48 Energies 15 04291 i0280.2000
Energy dependence (%)−0.0073550.005851−1.26 Energies 15 04291 i0290.2643
Eco-Innovation index (%)0.0041040.003467−1.18 Energies 15 04291 i0300.2898
Water exploitation index−0.0161190.023417−0.69 Energies 15 04291 i0310.5218
Energy tax % of GDP10.8097522.86250.47 Energies 15 04291 i0320.6563
Environmental tax % of GDP−0.0357760.089371−0.40 Energies 15 04291 i0330.7055
Share of renewable energy in gross final energy consumption (%)0.00618480.0205780.30 Energies 15 04291 i0340.7758
Generation of waste excluding major mineral waste per GDP (kg/1000 €)0.00055480.0024420.23 Energies 15 04291 i0350.8293
Circular material use rate (%)0.00499760.0387540.13 Energies 15 04291 i0360.9024
Table 8. Statistically significant parameters of the model—V4 (analyzed by the authors based on the EC data in the JMP software).
SourceLogworth p Value
Domestic material consumption per capita (t)11.530 Energies 15 04291 i0370.00000
Water productivity8.400 Energies 15 04291 i0380.00000
Energy dependence (%)7.544 Energies 15 04291 i0390.00000
Energy productivity4.943 Energies 15 04291 i0400.00001
Environmental tax % of GDP4.068 Energies 15 04291 i0410.00009
Table 9. Test of the statistically significant parameters of the model—V4 (analyzed by the authors based on the EC data in the JMP software).
Analysis of Variance
SourceDFSum of SquaresMean SquareF Ratio
Model51.33366380.266733142.4866
Error140.02620780.001872Prob > F
C. Total191.3598716 <0.0001
Table 10. Descriptive ability of the model—% of the variability described by the model for the V4 + Lithuania (analyzed by the authors based on the EC data in the JMP software).
Summary of Fit
RSquare0.980728
RSquare Adj0.973845
Root Mean Square Error0.043266
Mean of Response1.44534
Observations (or Sum Wgts.)20
Publisher’s Note: MDPI stays neutral with regard to jurisdictional claims in published maps and institutional affiliations.

