Essay

Wettability of Tight Sandstone Reservoir and Its Impacts on the Oil Migration and Accumulation: A Case Study of Shahejie Formation in Dongying Depression, Bohai Bay Basin

1
State Key Laboratory of Petroleum Resources and Prospecting, China University of Petroleum, Bejing 102249, China
2
College of Geosciences, China University of Petroleum, Beijing 102249, China
3
Exploration and Development Institute, Shengli Oilfield Company, SINOPEC, Dongying 257015, China
*
Authors to whom correspondence should be addressed.
Energies 2022, 15(12), 4267; https://doi.org/10.3390/en15124267
Submission received: 24 April 2022 / Revised: 29 May 2022 / Accepted: 5 June 2022 / Published: 10 June 2022
(This article belongs to the Special Issue Advances in Oil and Gas Migration and Accumulation)

Abstract

:
The migration and accumulation of oil in tight sandstone reservoirs are mainly controlled by capillary force. Due to the small pore radius and complex pore structure of tight sandstone reservoirs, the capillary force is very sensitive to wettability, so wettability significantly affects oil migration and accumulation. However, the study of oil migration and accumulation in tight sandstone reservoirs often needs to combine multiple methods, the process is complex, and the research methods of wettability are not uniform, so the mechanism of wettability affecting oil migration and accumulation is not clear. Taking the tight sandstone of the Shahejie Formation in the Dongying sag, Bohai Bay Basin, as the research object, the wettability characteristics of a tight sandstone reservoir and their influence on oil migration and accumulation were analyzed by means of a pore permeability test, XRD analysis, micro-CT experiment, contact angle tests, spontaneous imbibition experiments, and physical simulation experiments on oil migration and accumulation. The results show that the reservoir is of the water-wet type, and its wettability is affected by the mineral composition. Wettability in turn affects the spontaneous imbibition characteristics by controlling the capillary force. Oil migration in tight sandstone reservoirs is characterized by non-Darcy flow, the oil is in the non-wetting phase and subject to capillary resistance. The key parameters to describe the oil migration and accumulation characteristics include the kickoff pressure gradient, the critical pressure gradient, and ultimate oil saturation. Wettability affects oil migration characteristics by controlling the capillary force. The more oil-wet the reservoir is, the more favourable it is to oil migration and oil accumulation and therefore the higher the reservoir’s ultimate oil saturation is.

1. Introduction

Tight sandstone oil reservoirs generally refer to sandstone reservoirs with permeability less than 0.1 mD and porosity less than 10% [1,2] and are characterized by poor physical properties, a complex pore structure, and strong heterogeneity [3,4]. However, tight oil reserves are abundant, and in 2012, the amount of recoverable tight oil in China ranged from 13 × 108 t to 14 × 108 t [5]. With the continued development of hydrocarbon exploration and development, hydrocarbon exploration and the development of technology have continued to progress [6,7,8]. In recent years, many researchers have studied the distribution and accumulation of tight oil. Xu et al. (2022) established a new full-scale pore-throat characterization method that combined water flooding experiments to obtain the distribution characteristics of the movable fluid in pores of different sizes, providing a theoretical basis for predicting the recoverable reserves in tight reservoirs [9]. Xi et al. (2016) studied the pore throat size distribution of tight sandstone by means of SEM and PMI, clarified the specific contribution of the different sized pore throats to pore permeability, and obtained the threshold for pore throat radius for oil charging [10]. Li et al. (2022) established an oil saturation growth model of a tight sandstone reservoir based on NMR and physical simulation experiments as well as on pore structure and the physical properties of rocks and evaluated the accumulation effect of tight sandstone reservoirs [11]. Zhang et al. (2018) studied the influence of permeability and crude oil viscosity on oil migration and accumulation in tight sandstone and predicted the scale of tight oil accumulation [12]. However, most of these achievements analyzed the accumulation characteristics of tight oil from the perspective of the pore throat structure, and a few analyzed the influence of the physical properties of rock and crude oil on tight oil accumulation without considering the influence of wettability on tight oil accumulation.
Wettability refers to the tendency of a certain phase in a multiphase fluid to expand or adsorb on a solid surface and is an important index in the study of multiphase fluid [13]. Studies on wettability mainly focus on its application in oil and gas development but ignore its role in oil and gas accumulation [14,15,16,17]. Because related studies of oil accumulation often need to combine a variety of mineralogical and geochemical characterization techniques, experiments are difficult, and the process is tedious [10]. Additionally, there are many ways to measure the contact angle, including the Young–Laplace method, circle and polynomial fitting, the mask method, the sessile drop method, the captive bubble method, etc [18,19]. Therefore, it is necessary to choose an appropriate method to measure the contact angle. Oil migration and accumulation are largely restricted by capillary force [20], which is related to the pore throat radius, pore throat distribution, and the interaction between the fluid and solids in the reservoir. Because the pore throat radius of tight sandstone is small, mainly on a nanometer or micron scale, fluid-solid interaction mainly determines capillary force. In other words, the micro-wettability of tight sandstone reservoirs is the main influencing factor of the capillary force, so it is necessary to clarify the internal relationship between tight sandstone reservoir wettability and oil migration and accumulation.
The influencing factors of tight oil accumulation are complex. Due to the limitation of experimental conditions and research methods, it is difficult to study the migration and accumulation mechanism of tight oil. Furthermore, oil saturation, as a key parameter for evaluating tight oil reservoirs [12], has rarely been studied. Therefore, further research on oil migration and accumulation is necessary, which is closely related to the reservoir reserve predictions [21,22].
The Bohai Bay Basin is one of the most important tight oil research areas in China, with multiple sets of source rocks and multiple types of oil and gas reservoir spaces [23]. Due to the geological evolution of the sedimentation, structure, and diagenesis, the tight reservoirs in the Dongying Depression, Bohai Bay Basin, are characterized by low porosity and low permeability. The pore structure is complex, and the pore throat radius is small, which means that the formations are dominated by micro- and nano-pores. The main oil-bearing strata are the upper sub-members of the third member of the Shahejie Formation; [24] in terms of the organic matter type, the source rocks are mainly of the oil generation type; chloroform asphalt content is higher in crude oil, and the crude oil viscosity is relatively high [25]. Therefore, wettability plays a major role in the oil charging process in this area.
Based on the study of seven tight sandstone reservoir samples from the third member of the Shahejie Formation in the Dongying Depression, Bohai Bay Basin, the physical properties, petrological characteristics, and pore throat size distribution of the reservoir in the study area were determined by means of the pore permeability test, the XRD test, and the micro-CT test. Through the contact angle test and spontaneous imbibition experiments, it is confirmed that the wettability of tight sandstone reservoirs in this area is mainly of the water-wet type, and the influence of wettability on spontaneous imbibition is clarified. Finally, one-dimensional physical migration and accumulation simulation experiments were carried out on three representative samples to conduct a quantitative analysis of the correlation between wettability and tight oil migration and accumulation.

2. Geological Settings

Bohai Bay Basin, located in eastern China, is a large pre-Mesozoic rift basin that is abundant in oil and gas. The basin is dustpan-shaped [26] with an area of about 2.0 × 10⁵ km2. It is bounded by uplift and fault zones, including the Luxi uplift in the south, the Chenjiazhuang uplift in the north, the Taihang Mountain fault zone in the west, and the Tanlu fault zone in the east [26,27]. The basin can be divided into six first-order structural units (Figure 1a): the Jizhong depression, Huanghua depression, Bozhong depression, Liaohe depression, Jiyang depression, and Linqing depression [28].
In the study area, the Dongying Depression is located in the southeast of the Jiyang depression in Bohai Bay Basin and is a secondary tectonic unit [28] (Figure 1b). The depression is bounded by uplifts on all sides. The western boundary is the Qingcheng uplift; the eastern boundary is the Qingtuozi uplift; the northern boundary is the Chenjiazhuang uplift; and the southern boundary is the Luxi uplift. The area can be divided into four parts: the north steep slope belt, the south gentle slope belt, the sag belt, and the central anticline belt. Additionally, the area is mainly composed of lower Paleozoic Marine carbonate rocks, Upper Paleozoic Marine and continental clastic rocks, and Mesozoic terrigenous clastic rocks. The sedimentary environment mainly ranges from shore-shallow lacustrine to a deep lacustrine environment, and the sedimentary facies mainly consist of the delta, offshore subaqueous fan, slump turbidite flow, fan delta, and beach bar types [29]. Sedimentary strata in the Dongying Depression include the Paleogene Shahejie Formation (Es Group), Dongying Formation (Ed Group), Neogene Guantao Formation (Ng Group), Minghuazhen Formation (Nm Group), and Kongdian Formation (Ek Group). The source rocks mainly originate from the first member of the Shahejie Formation and the third member of the Shahejie Formation. The main reservoir rocks are delta sandstones from the Paleogene Shahejie Formation and have a thick thickness [23] (Figure 1c). The reservoir in the Shahejie Formation mainly developed in the third member of the Shahejie Formation [30]. The overall lithology of the lower member of the Shahejie Formation is dark grey mudstone and interbedded mudstone and sandstone with an unequal thickness. The middle member is composed of fine sandstone and mudstone, and the upper member is composed of sandstone, dark grey mudstone, and sandy mudstone, that is rich in organic matter content.

3. Methods

3.1. Sample Information, Porosity and Permeability Measurements

A total of seven samples were collected from the third member of The Paleogene Shahejie Formation in Dongying Depression, Bohai Bay Basin (Table 1), including one coarse-grain sandstone sample, two medium-grain sandstone samples, and four fine-grain sandstone samples. All of the samples were cylindrical plug samples that were drilled vertically from the original sample and were 2.5–6.0 cm in length and 2.51–2.53 cm in diameter. Residual oil and salt were removed from the samples. Then, the samples were dried for 24 h before porosity and permeability measurements. The experimental instrument used for the porosity and permeability measurements could take measurements automatically. The porosity was measured by the gas expansion method, and the permeability was measured by the pressure transient method. The confining pressure was about 2.0 MPa.

3.2. XRD

After measuring the porosity and permeability, small pieces were taken from each sample and ground into a powder, with the grains measuring 10 microns in size. The samples were then subjected to whole-rock analysis using a Ringaku MiniflexII X-ray. The scanning range was set from 3° to 45°. The temperature of the distilled water in the water tank was 18 °C, and the ambient temperature was room temperature. After the experiment, the whole-rock analysis energy spectrum was obtained. The high peak values in each sample were obtained by means of energy spectrum observation. Then, the content of each mineral in the rock could be quantitatively analyzed [31].

3.3. X-ray Micro-CT Scanning

Cylindrical strips that were 4 mm in diameter were drilled from samples No. 3, No. 5, and No. 7 (Table 1). The cylindrical strips were scanned using micro-CT equipment from the State Key Laboratory at the China University of Petroleum (Beijing), and the resolution was 10 μm. The scanning voltage and scanning current of this experiment were set to 120 Kev and 10 μA. After the experiment, 2D tomographic images were obtained, then they needed to be processed by the back-projection algorithm, and finally, 3D Grayscale images were obtained [32]. The Avizo® 9 graphics software package was used for the grey segmentation of the 3D grayscale images [33]. When materials have different densities, it leads to different X-ray penetration effects. Based on this principle, pore systems could be extracted from the rock matrix [34,35]. Finally, the computer connected to the scanning system outputs the pore-throat distribution frequency table.

3.4. Contact Angle Experiment

The contact angle of the seven sandstone samples was tested at 25 °C and in 1.01 MPa experimental conditions. In addition, to analyze the wettability sensitivity of a single mineral, seven different single mineral samples (quartz, feldspar, illite, chlorite, smectite, calcite, and kaolinite) were collected from the Bohai Bay Basin. The contact angle of the single mineral was tested under the same temperature and pressure conditions, and the purity of each single mineral sample was above 98%. The 14 samples were dried in an oven for 24 h to prepare them for the contact angle test. The contact angle measuring instrument at the State Key Laboratory of the China University of Petroleum (Beijing) was used to measure the contact angle of each sample. The contact angle was measured using the captive bubble method. Additionally, in this experiment, all of the contact angles that were measured were oil contact angles. A crude oil originating from Bohai Bay Basin was used in this study. The oil was centrifuged and filtered carefully, and then it was analyzed to determine its physical and chemical properties (Table 2). Before the experiment, 14 samples were processed to be cylindrical in shape, and the sample surface was ground with a cutting machine and polished to eliminate the influence of the roughness on the measurement results [36]. Contact angle measurements were repeated twice for each sample. After the first measurement, the sample was dried in an oven for 24 h, and then the second experiment was carried out. The measuring accuracy of the contact angle determined by the testing instrument was 0.1°, with a measurement error of ±2°.

3.5. Spontaneous Imbibition Experiment

Spontaneous imbibition experiments were carried out with the imbibition experiment device at the laboratory of the Unconventional Research Institute, China University of Petroleum (Beijing). After the contact angle experiment, the selected samples were polished into seven small cubes with 1 cm sides and dried for 24 h. After drying, the length, width, height, and other parameters of the small cube were measured and recorded, and the small cubes were then hung directly under the balance of the experimental device for the experiment [37]. In this experiment, water is the wetting phase, and the air is the non-wetting phase. After the spontaneous imbibition experiment, imbibition data were obtained, including those regarding the initial weight of the cubes, the final weight of the cubes, etc. The data obtained from the experiment were used to determine pore throat connectivity [38].

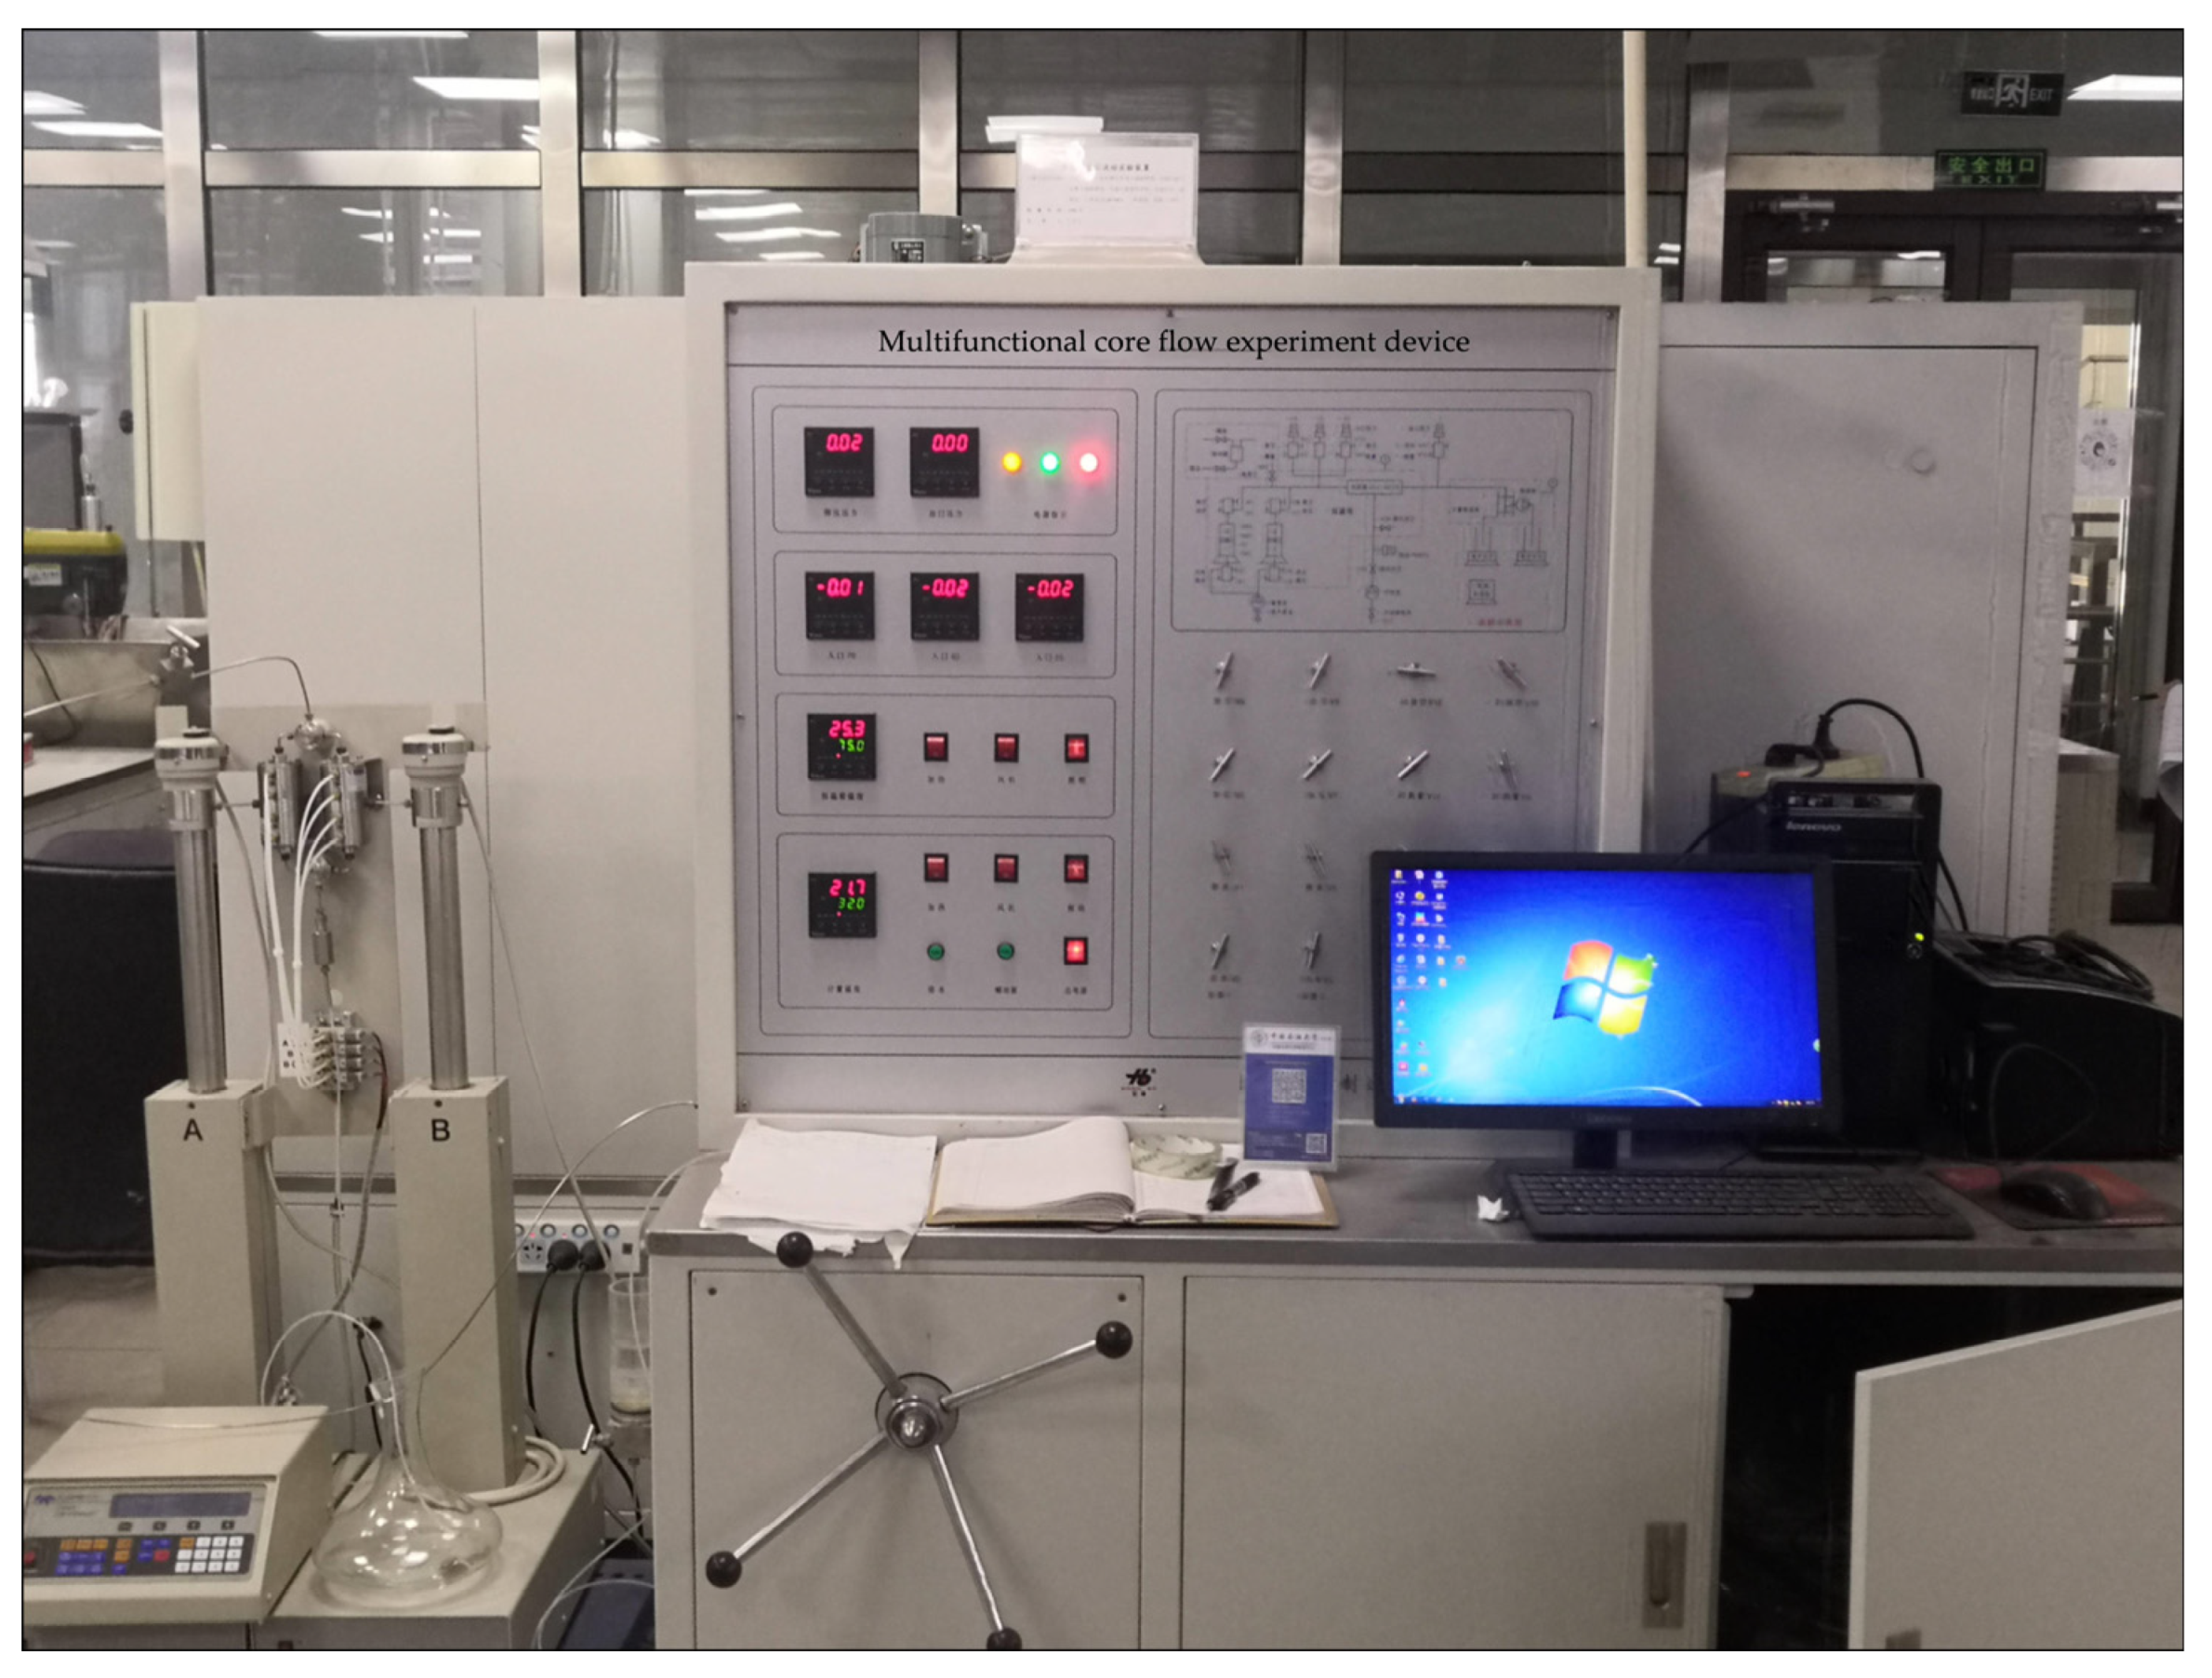
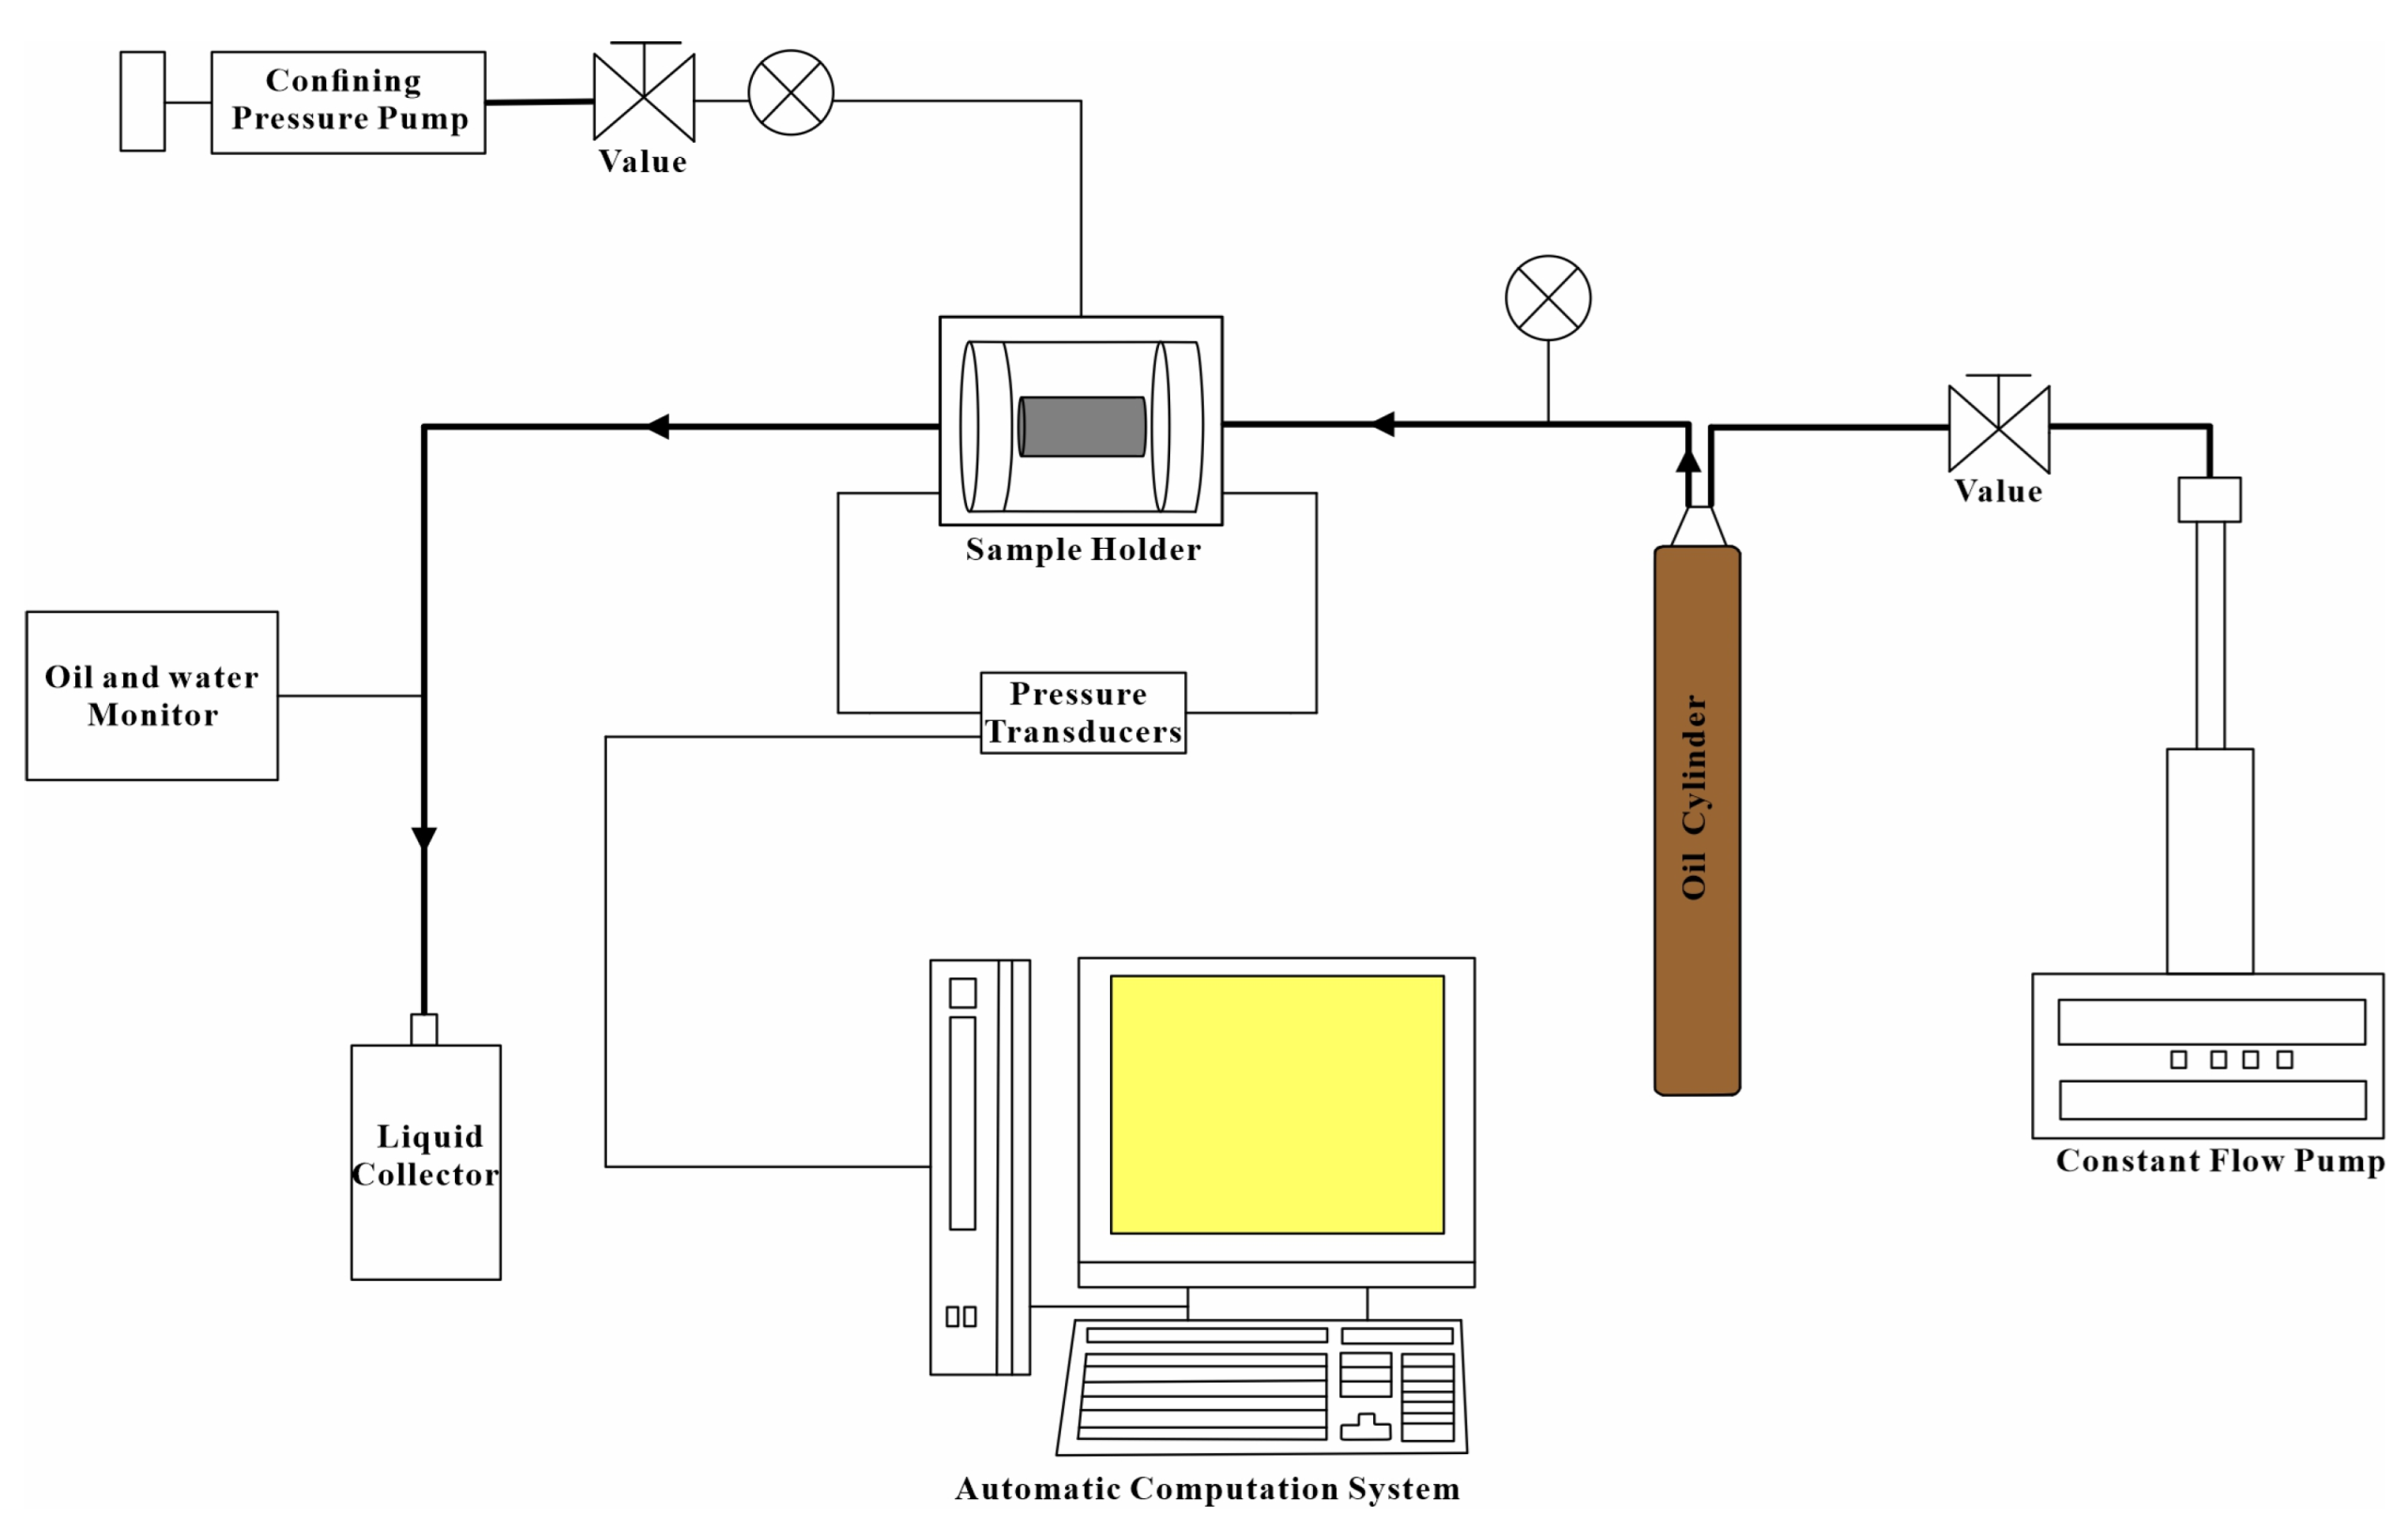
3.6. Physical Simulation of Oil Migration and Accumulation

The multi-functional core flow experiment device from the state Key Laboratory at the China University of Petroleum (Beijing) was used to simulate oil migration and accumulation (Figure 2).
The experimental parameters were set according to the actual geological conditions. The experimental temperature was set at 60 °C and the confining pressure was set at 20 MPa. Samples No. 3, No. 5, and No. 7 were selected for the experiment. The crude oil used was the same as the crude oil from the contact angle experiment (Table 2). First, the dry weights of the samples were measured. Additionally, the sample was pressurized in a saturated water instrument, its wet weight was measured, and its porosity (effective porosity) was calculated. Then, the length, diameter, and effective porosity of the sample were fed into the automatic computation system (Figure 3) for subsequent calculation of the incoming oil volume. The automatic computation system was used to record and process all of the data. The sample was placed in the holder, and the pressure of the regulating valve was adjusted to ensure that the inlet pressure gradually increased, and this was maintained for a while. When a steady flow of oil was detected at the outlet, the pressure should be increased at intervals, and after the pressure stabilizes, the operation should be repeated. As the pressure increases, the calculation system automatically records and calculates a series of data points, including the time, pressure gradient, flow velocity, and oil saturation. When the outlet no longer produces water and the inlet and outlet flow rate are equal, the experiment is stopped. Finally, the pressure gradient, flow velocity, and oil saturation data were used to study the oil migration and accumulation characteristics in tight sandstone (In Section 4.5).

4. Results

4.1. Petrological Characteristics

The XRD results show that the mineral composition of sandstone in the third member of the Shahejie Formation is mainly composed of feldspar and quartz with high compositional maturity. The quartz content ranges from 52% to 78%, with an average content of 65.5%. The feldspar content ranges from 13% to 24%, with an average content of 18.9% (Table 3). The composition of clay minerals is complex, and the total content of clay minerals ranges from 2% to 17%, with an average content of 9.5%, and is dominated by kaolinite.

4.2. Distribution of Pore Throat Size

The pore throat distribution map was obtained by processing the pore throat distribution frequency table. Additionally, it can be seen that the pore radius of the tight sandstone reservoir ranged from several microns to dozens of microns in size and was concentrated in the range from 1 to 7 μm (Figure 4). The pore distribution varied among the different samples (Table 4). The pore radius of sample No. 3 ranges from 1 μm to 42 μm, with an average size of 8.42 μm. The pore radius of sample No. 5 ranged from 1 μm to 22 μm, with an average size of 4.36 μm. The pore radius of sample No. 7 ranged from 1 μm to 19 μm, with an average size of 2.62 μm.
The throat radius ranged from several microns to dozens of microns in size and was concentrated in the range from 0.5 to 4 μm. There are differences in throat distribution among the different samples (Table 4). The throat radius of sample No. 3 ranged from 1 μm to 32 μm, with an average radius of 3.84 μm. The throat radius of sample No. 5 ranged from 0.5 μm to 17 μm, with an average radius of 2.12 μm. The throat radius of sample No. 7 was in the range from 0.5 μm to 7 μm, with an average radius of 1.81 μm.

4.3. Wettability Characteristics

Few differences were observed between the two measurements (Table 5); therefore, the average value of the two contact angle measurements was chosen as the final result. The results of the contact angle experiment (Table 5) show that the contact angles of the seven sandstone samples range between 31° and 57°, with an average size of 40°. According to the petroleum industry standard, the contact angle of the sample is water-wet when it is in the range of 0°–75°, neutral-wet when it is in the range of 75°–105°, and oil-wet when it is in the range of 105°–180°. It can be judged that the overall wettability of the third member of the Shahejie Formation reservoir is water-wet. Therefore, the contact angle test determined that in the seven sandstone samples, water is the wetting phase and oil is the non-wetting phase. The contact angles of the seven single minerals are as follows (Table 5). It can be seen that quartz, feldspar, illite, chlorite, and smectite are water-wet minerals, while calcite and kaolinite are oil-wet minerals.

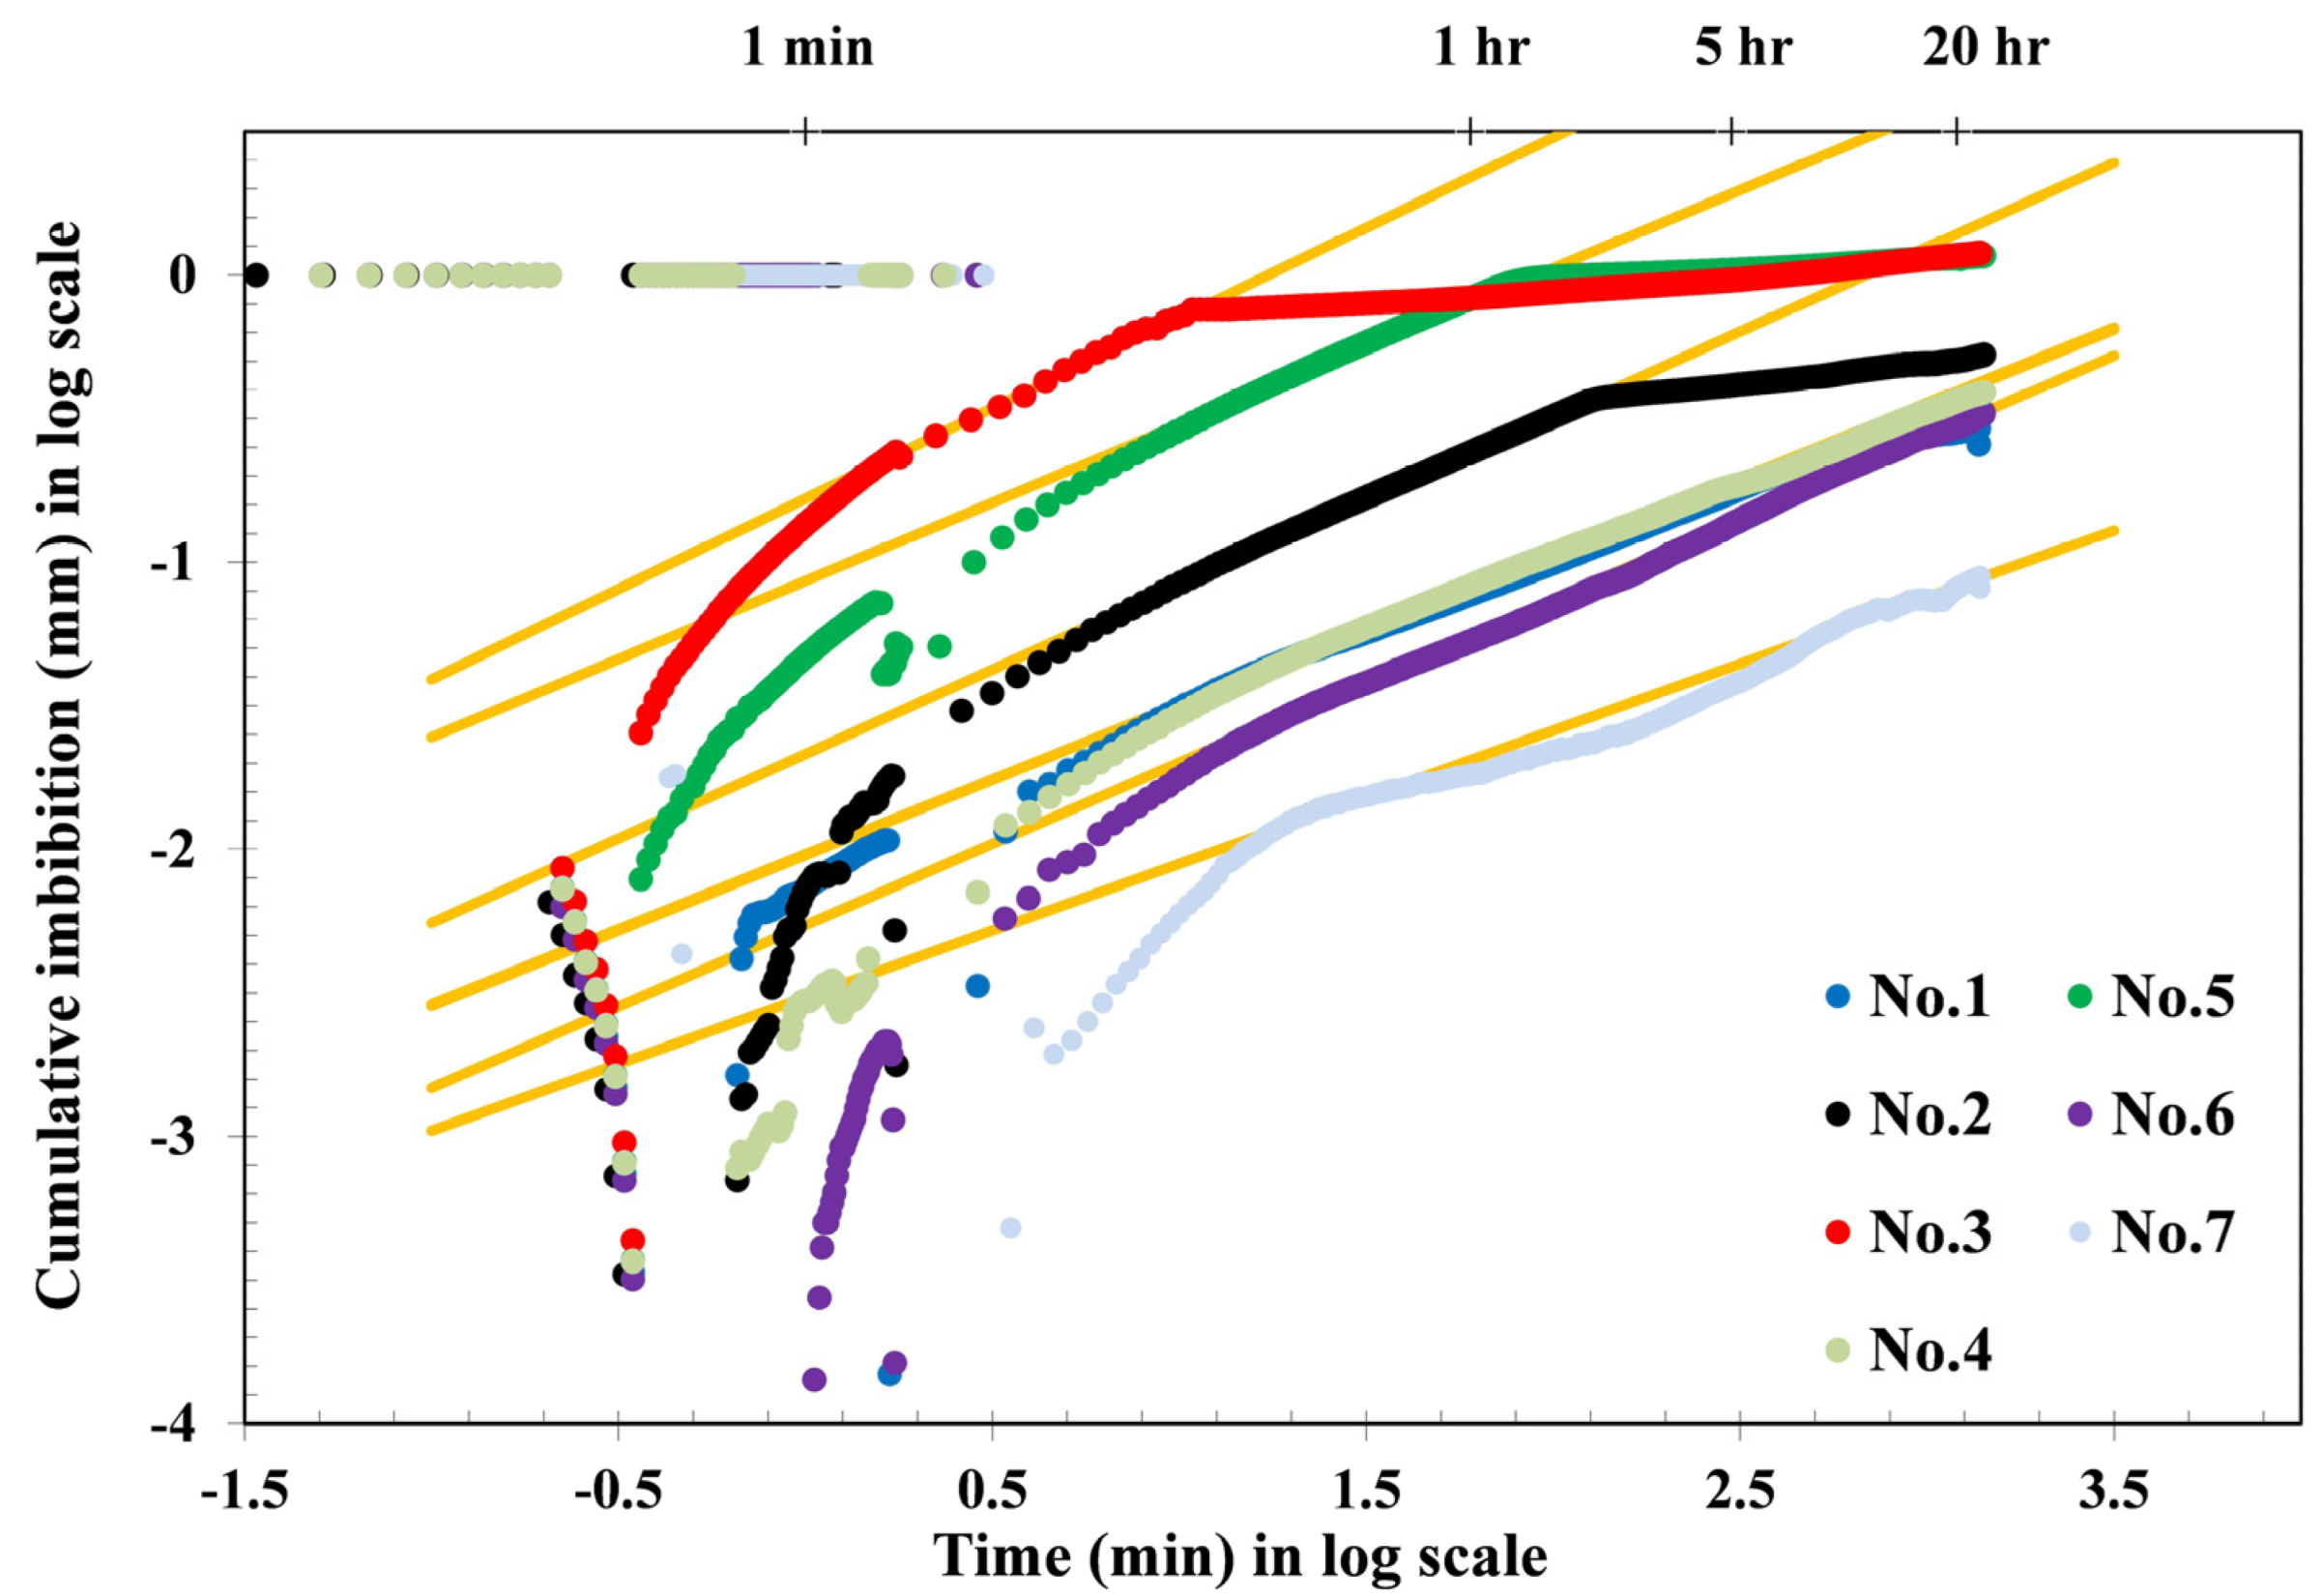
4.4. Characteristics of Spontaneous Imbibition

Spontaneous imbibition is a multiphase flow process in which the wetting phase fluid spontaneously enters the porous medium under capillary force action and displaces the non-wetting phase fluid inside [39]. The imbibition data were input into the imbibition mapping template to calculate the cumulative imbibition volume, and seven diagrams of the relationship between the cumulative imbibition volume and time were obtained. The cumulative imbibition volume was normalized by the sectional area [40], and the diagrams of the relationship between the cumulative imbibition height and time were obtained. In the spontaneous imbibition process of each sample, the imbibition process in the first 30 s was not stable, meaning that there was a large fluctuation during that stage and the curve in this stage can be ignored. After that, a linear segment representing logarithmic cumulative imbibition height is visible [41,42]. For sample No. 7 (Figure 5), there was a stable fluctuation at the end of the imbibition curve, which is a normal phenomenon, and the spontaneous imbibition rate was mainly calculated according to the stable imbibition stage before the stable fluctuation occurred. The slope of the stable imbibition stage is the spontaneous imbibition rate.
Theoretically, the imbibition rate of the cube with better pore throat connectivity should be 0.5 [43,44]. If the imbibition rate is greater than 0.5, it indicates that the sample may have cracks in the imbibition process. If the imbibition rate is less than 0.5, it indicates that the pore throat connectivity of the sample is poor [45]. The spontaneous imbibition experiment using water shows that the pore throat connectivity of tight sandstone in this area is generally good (Table 6). For samples No. 1, No. 2, No. 3, No. 4, No. 5, and No. 6, the spontaneous imbibition results showed that the spontaneous imbibition rate and pore throat connectivity of these five samples were good. Sample No. 7 had a low spontaneous imbibition rate and poor pore throat connectivity.

4.5. Characteristics of Tight Oil Migration and Accumulation

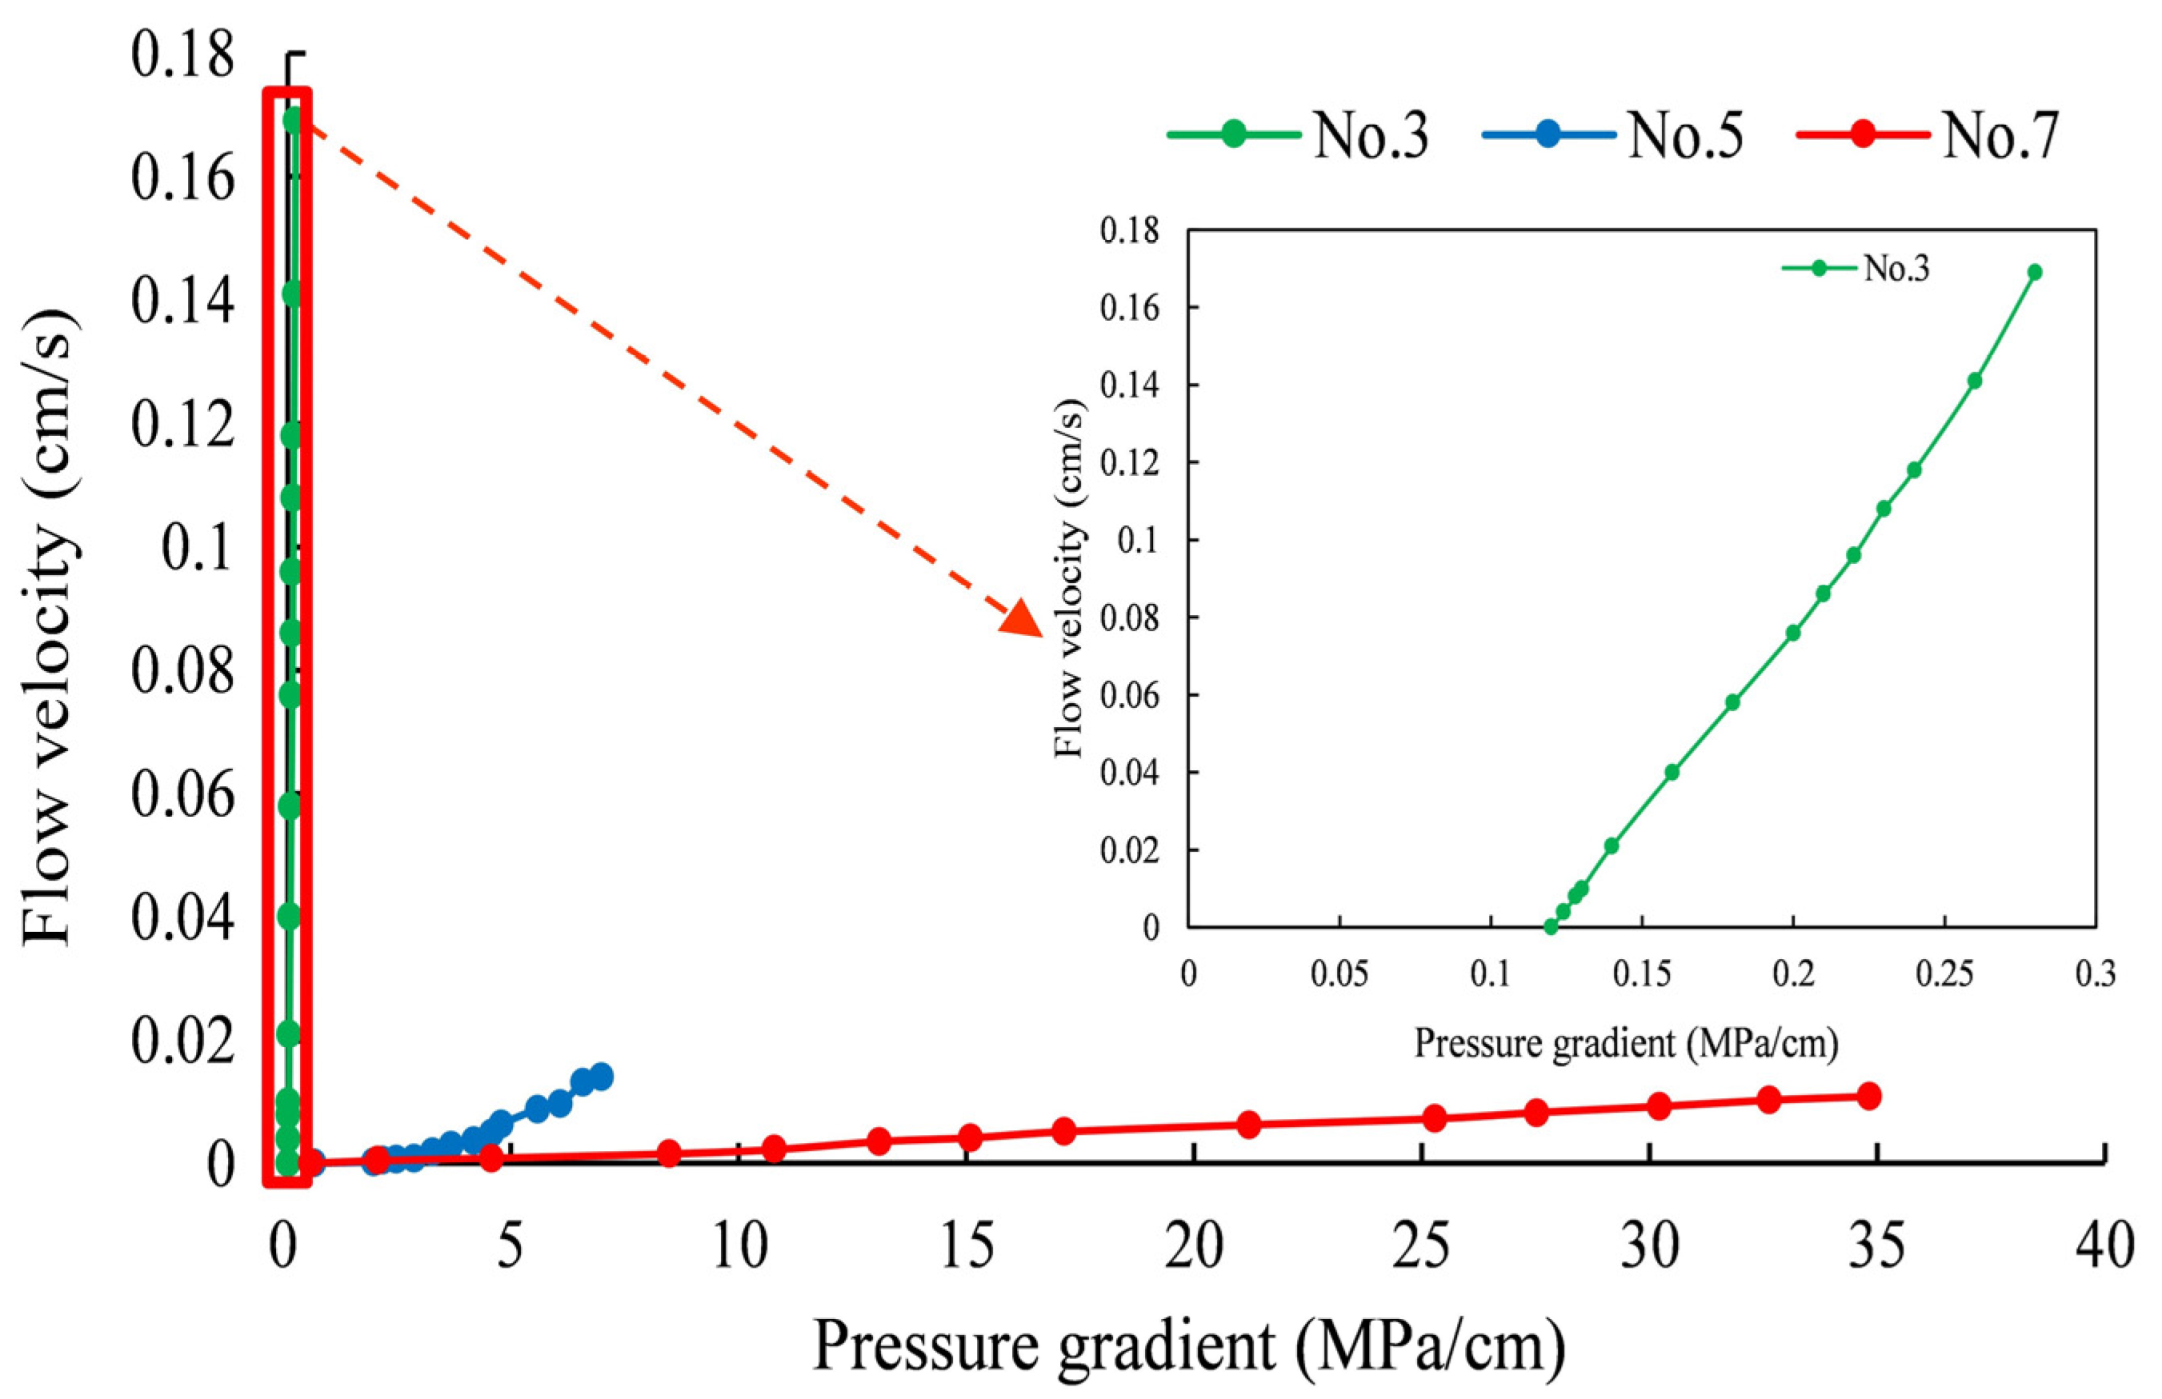
4.5.1. Characteristics of Tight Oil Migration

In tight sandstone reservoirs, oil migration is a process in which oil constantly replaces water formation in the pores and throats and is driven by overpressure [11]. By placing pressure gradient and flow velocity data into the linear coordinate, seepage curves of three sandstone samples can be obtained. The seepage curves show that there are two migration fluid models: Darcy flow and non-Darcy flow (Figure 6). Non-Darcy flow has two flow states in the oil migration process, including nonlinear flow at a low-speed stage and linear flow at a relatively high-speed stage. The overall flow curve is a concave flow curve, which can be described by segmented function [11,46]. The bending section of the seepage curve is represented by a power function, and the linear section is represented by a linear function [46]. The intersection point of the seepage curve and the pressure gradient axis is the kickoff pressure gradient, which represents the minimum driving forces required to overcome resistance such as capillary force and start the fluid flow. And the intersection point of the nonlinear segment and the linear segment is the critical pressure gradient, which represents the minimum driving forces required for stable migration of fluid [47]. Different flow models have significant differences in their kickoff pressure gradient and seepage velocity (Figure 6). In general, non-Darcy flow (No. 5 and No. 7) has a higher kickoff pressure gradient and a lower seepage velocity than Darcy flow (No. 3) [48].
In single-phase liquid flow, the kickoff pressure gradient and critical pressure gradient are the key parameters to characterize the non-Darcy flow. The kickoff pressure gradient and critical pressure gradient of the oil migration in each sample can be obtained by mathematical fitting. The porosity of Sample No. 3 is greater than 20%, the permeability is greater than 10 mD, and the flow characteristic is Darcy flow. Using MATLAB software for mathematical fitting [48,49], we determined that the kickoff pressure gradient of sample No. 3 was about 0.12 MPa·cm−1. The flow characteristics of sample No. 5 and sample No. 7 had non-Darcy flow. After data fitting, we could also determine that the kickoff pressure gradient of sample No. 5 was about 0.70 MPa·cm−1 and the critical pressure gradient was about 6.5 MPa·cm−1. The kickoff pressure gradient of sample No. 7 was about 0.62 MPa·cm−1, and the critical pressure gradient was about 1.27 MPa·cm−1(Table 7).

4.5.2. Characteristics of Tight Oil Accumulation

During the charging process of tight sandstone, oil overcomes capillary pressure and enters the pores, replaces water formation, accumulates in the pores, increasing oil saturation in the reservoir [11]. By placing pressure gradient and oil saturation data into the linear coordinate, the oil saturation growth curves of three sandstone samples were obtained. In tight sandstone, oil saturation increases as the pressure gradient increases and reaches a stable value at the end (Figure 7). In addition, different tight sandstone samples have different oil saturation growth trends. The oil saturation of sample No. 5 increased rapidly, and the ultimate oil saturation was about 66.66%. The oil saturation of sample No. 7 increased slowly, and the ultimate oil saturation was about 68.67%. It is noteworthy that sample No. 3 is a conventional sandstone sample and had the fastest increase in oil saturation, with an ultimate oil saturation of about 62.77%, less than sample No. 5 and Sample No. 7 (Table 8).

5. Discussion

5.1. Wettability Analysis of Single Minerals

The mineral composition of rocks is an important factor that affects the wettability of sandstone reservoirs, and different minerals have different wettabilities [50,51,52]. The wettability test of the single minerals showed that quartz, feldspar, illite, chlorite, and smectite are water-wet minerals, while calcite and kaolinite are oil-wet minerals (Table 5). The surface of calcite crystals carries a large amount of electric charge [17,53], and it is easy for these crystals to adsorb polar substances in crude oil, resulting in calcite exhibiting oil-wetting characteristics [36,54]. A large number of hydroxyl groups are distributed on the surface of quartz crystal, and the hydroxyl groups are water-wet groups, causing quartz to exhibit water-wetting characteristics [55]. The ionic bond found in feldspar crystals has weak bond energy and is easy to fracture. As a result, oxygen atoms and aluminium atoms have high atomic activity, and they are easily absorbed into electron-rich groups in water, causing feldspar to exhibit water-wetting characteristics [56]. The crystal structure of kaolinite is composed of a silicon oxide tetrahedron sheet and a hydroxyl balumite octahedron sheet, and it is easy for hydrogen bonds to form between the layers. Polar small molecules can enter the layers and destroy the hydrogen bonds and increase the distance between the layers, so that the polar substances in the crude oil can be adsorbed between the layers, resulting in kaolinite showing oil-wetting characteristics. The crystal structure of illite belongs to the dioctahedral structure of the 2:1 type structural unit layer. There are interlayer cations sandwiched between the two adjacent structural units, so it is easy to absorb negative charges, making illite show water-wetting characteristics. The crystal structure of smectite is the same as that of illite, and the layers are connected by molecular attraction. The connection is easily dispersed when exposed to water, and the ion exchange capacity of smectite is stronger than that of illite [57,58]. Therefore, smectite also shows water-wetting characteristics. Similar to illite and smectite, chlorite also exhibits water-wetting characteristics due to ion exchange [57,58].

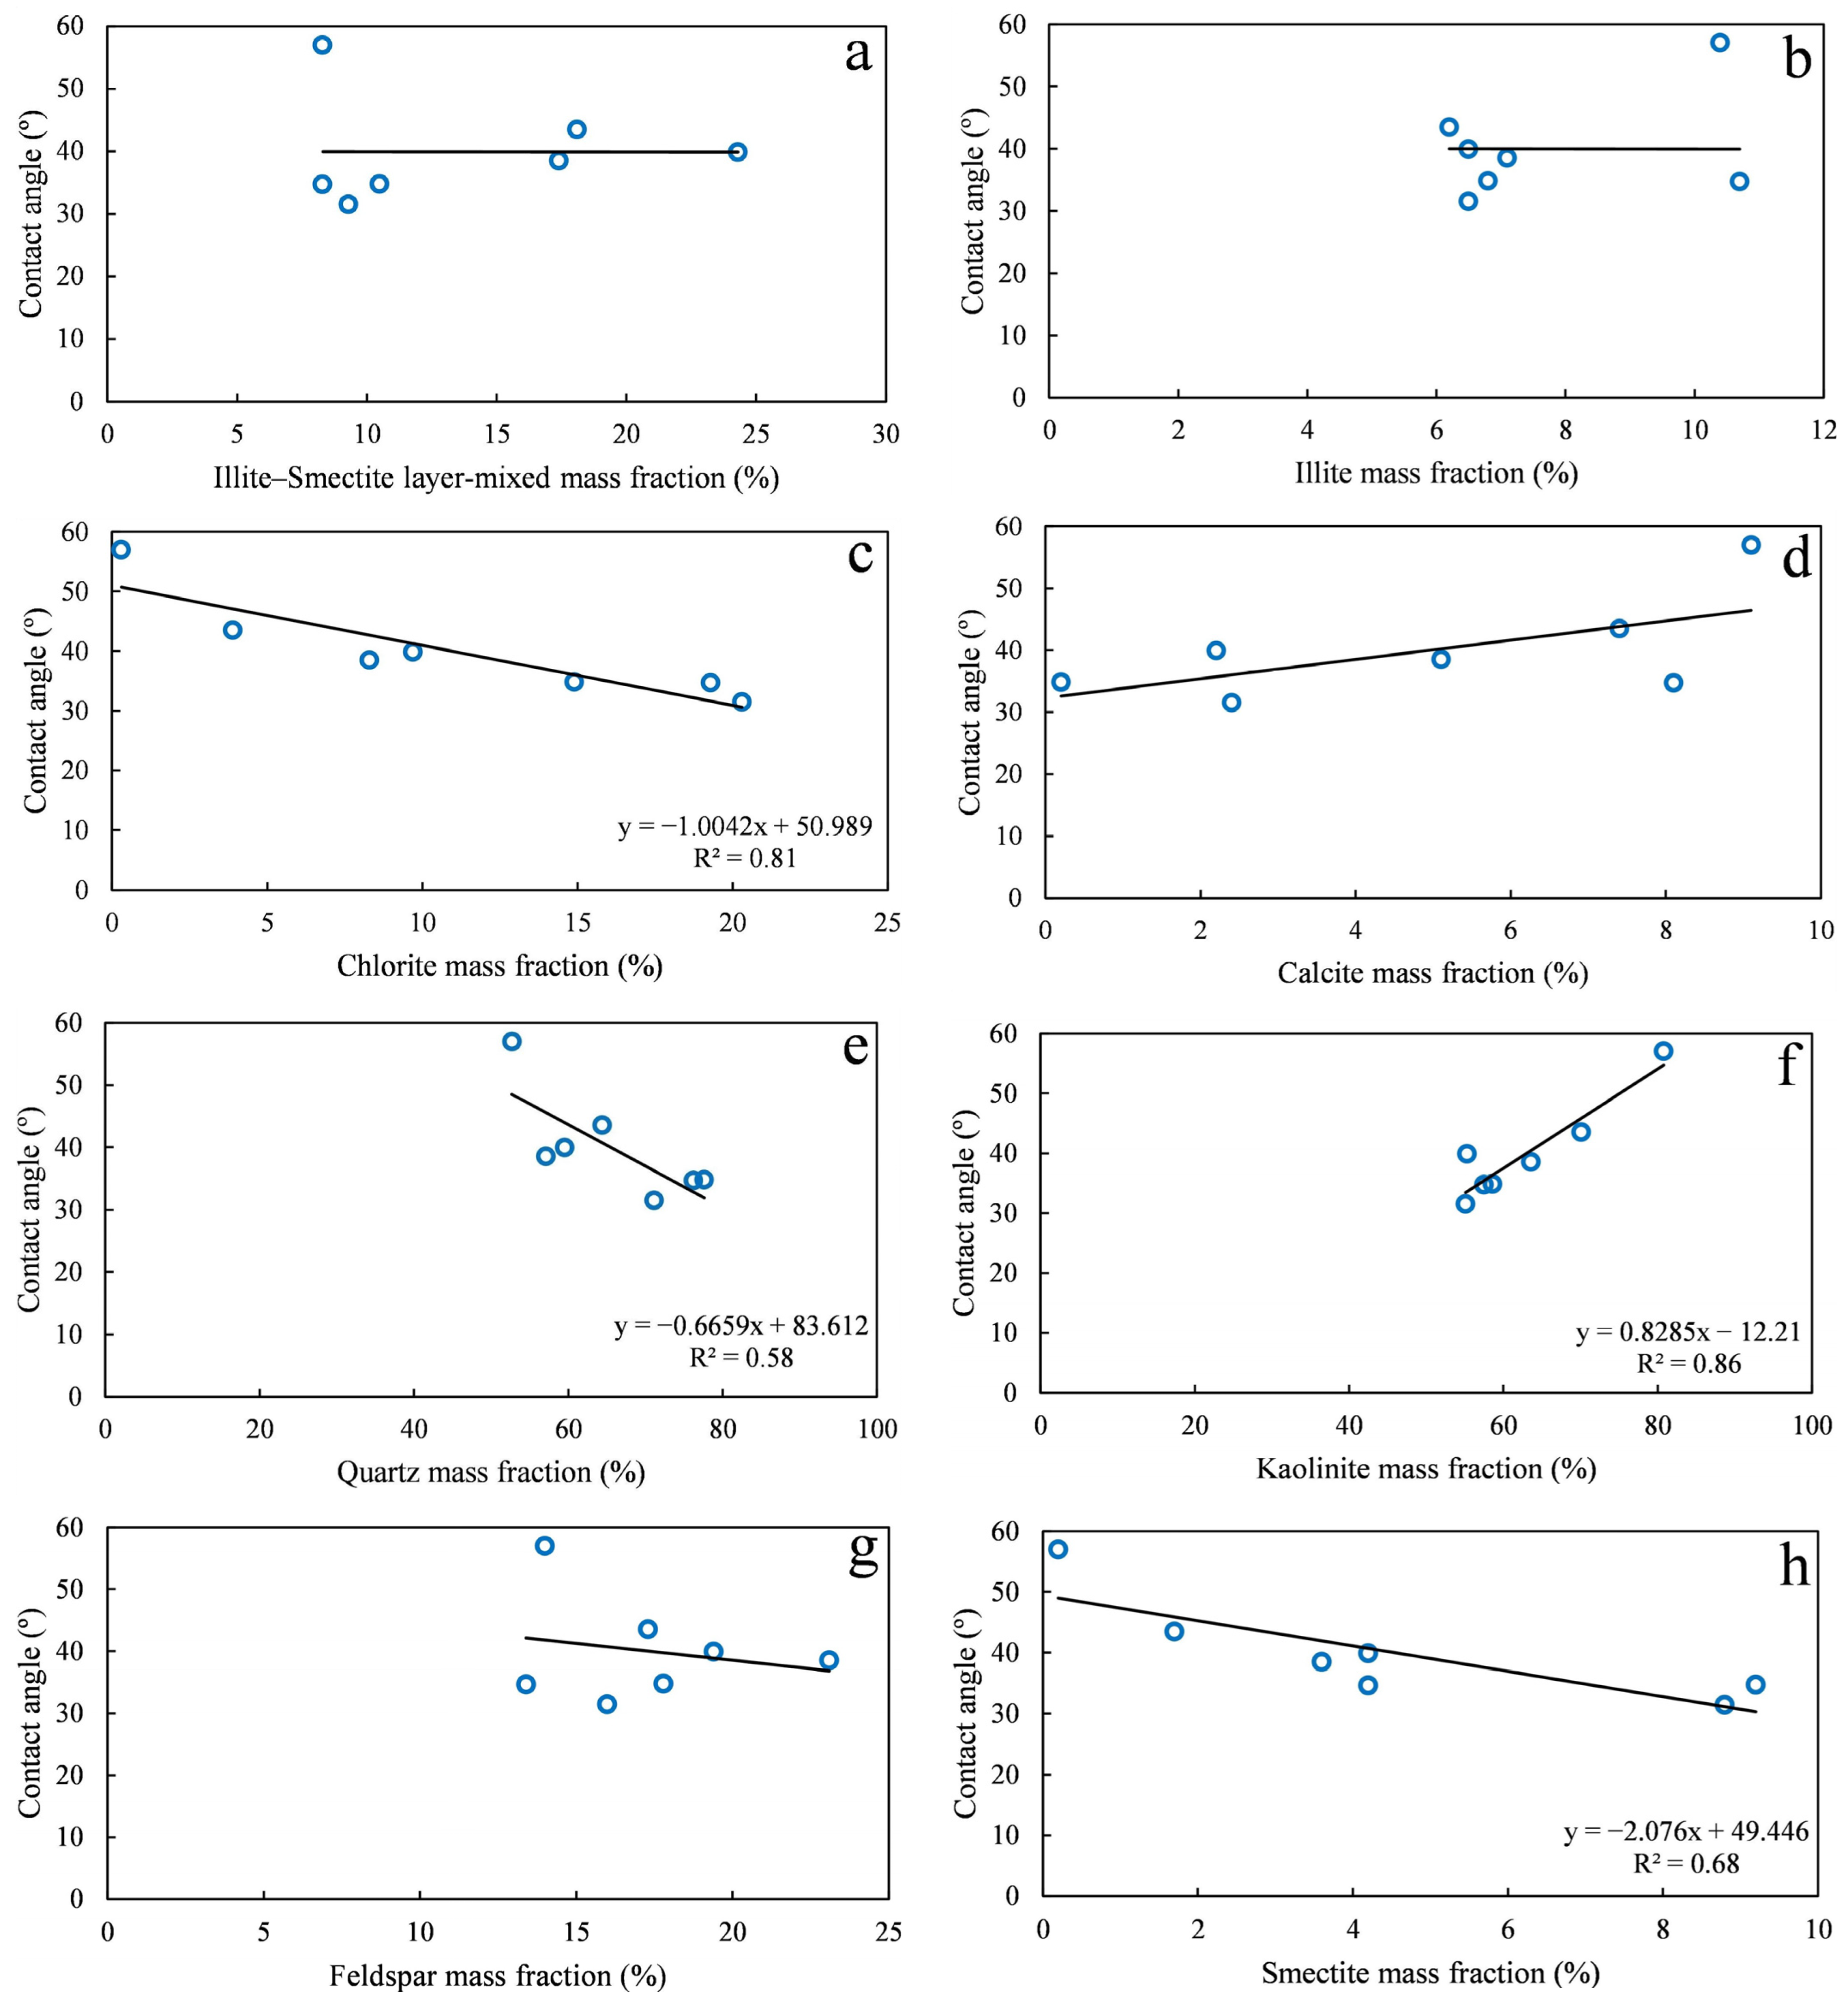
5.2. Wettability Controlled by Mineral Composition

The mineral composition of sandstone controls the rock contact angle [59]. By analyzing the correlation between different mineral mass fractions and contact angle, it can be seen that (Figure 8) among the common minerals, quartz has the greatest influence on the rock contact angle, and the correlation reaches 0.58. As the quartz content increases, the contact angle becomes smaller because quartz itself is water-wet, and quartz occupies the highest proportion in the sample (Table 3). Clay minerals also affect the wettability of rocks [58]. Among clay minerals, kaolinite has the greatest influence on the contact angle, and the correlation reaches 0.86. As the kaolinite content increases, the contact angle becomes larger. The reason is that kaolinite itself is oil-wet, and its content accounts for a high proportion of the mineral content in the rock (Table 3), so it has a strong adsorption effect on the active substances found in crude oil. Chlorite and smectite also have a strong correlation with the contact angle, with the correlation reaching 0.81 and 0.68; both are positively correlated with the contact angle. The reason for this is that chlorite itself is water-wet and is present in a high content (Table 3) and has a strong ion exchange capability with water molecules [57]. As for smectite, it occupies a relatively low proportion of clay minerals (Table 3) and presents weak water-wetting characteristics. Its ion exchange capability [57] is weaker than that of chlorite, so the correlation between smectite and the contact angle is lower than the correlation observed in chlorite. The degree of influence of the other mineral components on the contact angle is relatively small, which may be due to the low mineral content [11].

5.3. Characteristics of Spontaneous Imbibition Controlled by Mineral Composition

Spontaneous imbibition is a process in which the wetting phase displaces the non-wetting phase through capillary force, and capillary force is the main mechanism of imbibition [60]. For the seven sandstone samples, the common point between the contact angle experiment and spontaneous imbibition experiment was that in the two systems, water is the wetting phase, so correlation analysis can be carried out. The analytical results show that the contact angle has a good negative correlation with the spontaneous imbibition rate of water (Figure 9a). According to Handy’s gas–water imbibition model [44], the spontaneous imbibition rate is related to the capillary force. Therefore, it can be seen that the more oil-wet the cube is, the lower the spontaneous imbibition rate of water is, the smaller the capillary force of the wetting phase (water) is, and the smaller the capillary resistance of the non-wetting phase (air) is. In other words, wettability affects spontaneous imbibition characteristics by changing the capillary force. Furthermore, by analyzing the correlation between the mineral mass fraction and spontaneous imbibition rate, it can be seen that the mineral composition affects the spontaneous imbibition characteristics. The water-wet mineral mass fraction and spontaneous imbibition rate are positively correlated (Figure 9b), and the oil-wet mineral mass fraction and spontaneous infiltration rate have a good negative correlation (Figure 9c).

5.4. Influence of Wettability on Tight Oil Migration and Accumulation

5.4.1. Influence of Wettability on Tight Oil Transport

In conventional and tight sandstone reservoirs, due to the differences in the pore and throat size of sandstone, wettability has different effects on the capillary force, which leads to the flow characteristics of Darcy flow and non-Darcy flow. The capillary force can be determined as follows [61,62]:
P c = 2 σ c o s θ r  
where Pc is the capillary force (MPa); σ is the interfacial tension (mN/m); θ is the contact angle (°); r is the pore throat radius (μm).
The effect of wettability on capillary force is ignored when the pore throat size is large, while the effect of wettability on capillary force is magnified when the pore throat size is small. Therefore, the pore throat size in conventional sandstone reservoirs is large, so the capillary force Pc can be ignored, indicating that wettability has little influence on oil migration in conventional reservoirs. The small pore throat size in tight sandstone reservoirs means that the capillary force Pc cannot be ignored. According to the Young–Laplace equation [63,64], the smaller the pore-throat radius, the more sensitive the capillary force is to wettability, and the greater the influence of wettability on oil migration in tight reservoirs is. During the charging process in water-wet samples, oil is in the non-wetting phase. According to the discussion in Section 5.3, the capillary force that is enacted on oil (non-wetting phase) as it flows through the pores is resistance. According to the micro-CT results, the maximum pore radius of sample No. 3 is 42 μm, which is much larger than those of sample No. 5 and sample No.7. Therefore, the capillary resistance of sample No. 3 is very small, and the kickoff pressure gradient is much smaller than that of sample No. 5 and sample No. 7. The influence of wettability on capillary force can be ignored, so the influence of wettability on oil migration in sample No. 3 is very small. Sample No. 5 and sample No. 7 are tight sandstone samples with a small pore throat radius, and wettability has a great influence on the capillary force. Sample No. 7 has strong lipophilicity and a small cosθ value, and according to formula (1), its capillary resistance is smaller than that of sample No. 5, and the kickoff pressure gradient and critical pressure gradient of the oil in sample No. 7 are also smaller than in sample No. 5.

5.4.2. Influence of Wettability on Tight Oil Accumulation

Wettability in tight sandstone reservoirs affects crude oil adsorption on the rock surface, so wettability plays an important role in tight oil accumulation [65,66]. Among the three filled samples, sample No. 3 had the best porosity and permeability, but the lowest ultimate oil saturation. Because sample No. 3 has the strongest hydrophily (Figure 10), during the crude oil charging process, the rock surface has the weakest adsorption capacity for the polar molecules in crude oil, and the accumulation effect of crude oil is the worst, so the ultimate oil saturation is the lowest. Sample No. 7 had the worst porosity and permeability, but the highest oil saturation. Because sample No. 7 has the strongest lipophilicity (Figure 11), during the crude oil charging process, the rock surface had the strongest adsorption capacity for the polar molecules in crude oil, and the accumulation effect of crude oil was the best, meaning that it had the highest ultimate oil saturation. The wettability of sample No. 5 is between that of sample No. 3 and sample No. 7, and the accumulation effect of crude oil is medium. In addition, compared to sample No. 7 which has the same small pore throat size, sample No. 5 has stronger hydrophily, increasing the thickness of the water film on the pore throat surface, a decrease in the throat, an increase in bound water saturation, and decreased oil saturation [67]. Therefore, the ultimate oil saturation of sample No. 5 is between that of sample No. 3 and sample No. 7.

6. Conclusions

Through comprehensive studies on the wettability and migration and accumulation characteristics of the tight sandstone reservoirs of the Shahejie Formation in the Dongying Depression, Bohai Bay Basin, the following conclusions can be drawn:
(1)
The wettability of a tight sandstone reservoir is mainly controlled by the rock mineral composition. When there are more oil-wet minerals, the reservoir is more oil-wet. Conversely, when there are more water-wet minerals, the reservoir is more water-wet. The reason why different minerals exhibit different wettability characteristics lies in their different ion-exchange mechanism with oil and water.
(2)
The mineral composition of the rock affects the wettability, controls the capillary force, and affects the spontaneous imbibition characteristics of the rock. During imbibition, when water is in the wetting phase, it drives the non-wetting phase (air) via capillary force. The more lipophilic the rock is, the less capillary force there is during the wetting phase, the less capillary resistance there is during the non-wetting phase, and the less the spontaneous imbibition rate of the wetting phase is.
(3)
When oil is in the non-wetting phase, the charging process is subjected to capillary resistance. The pore throat size of tight sandstone reservoirs is very small, and wettability greatly influences capillary force. The more oil-wet the reservoir is, the less capillary resistance the oil is subjected to, and the lower the kickoff pressure gradient and the critical pressure gradient are, resulting in more favourable migration. Wettability affects oil accumulation in the reservoir by controlling the adsorption capacity of the rock surface to oil. The stronger the oil affinity, the better the oil accumulation and the higher the ultimate oil saturation is.

Author Contributions

Methodology, K.J. and X.W.; investigation, K.J. and K.W.; supervision, J.Z.; formal analysis, B.L. and X.G. All authors have read and agreed to the published version of the manuscript.

Funding

This research was funded by the National Natural Science Foundation of China, grant number 41972147, and the Article Processing Charges (APC) was funded by 41972147.

Institutional Review Board Statement

Not applicable.

Informed Consent Statement

Not applicable.

Data Availability Statement

All data included in this study are available upon request by contact with the corresponding author.

Acknowledgments

This study is supported by the National Natural Science Foundation of China (grant no. 41972147). We sincerely appreciate all anonymous reviewers and the handling editor for their comments and suggestions.

Conflicts of Interest

The authors declare no conflict of interest.

References

  1. Mustafa, A.A.; Mahmoud, M.; Abdulraheem, A. A Review of Pore Structure Characterization of Unconventional Tight Reservoirs. In Proceedings of the Abu Dhabi International Petroleum Exhibition & Conference 2019, Abu Dhabi, United Arab Emirates, 11–14 November 2019. [Google Scholar]
  2. Zou, C.; Zhu, R.; Songtao, W.U.; Yang, Z.; Wang, L. Types, characteristics, genesis and prospects of conventional and unconventional hydrocarbon accumulations:taking tight oil and tight gas in China as an instance. Shiyou Xuebao/Acta Pet. Sin. 2012, 33, 173–187. [Google Scholar]
  3. Aguilera, R. Flow Units: From Conventional to Tight-Gas to Shale-Gas to Tight-Oil to Shale-Oil Reservoirs. SPE Reserv. Eval. Eng. 2014, 17, 190–208. [Google Scholar] [CrossRef]
  4. Wu, Y.; Tahmasebi, P.; Lin, C.; Munawar, M.J.; Cnudde, V. Effects of micropores on geometric, topological and transport properties of pore systems for low-permeability porous media. J. Hydrol. 2019, 575, 327–342. [Google Scholar] [CrossRef]
  5. Jia, C.; Zheng, M.; Zhang, Y. Unconventional hydrocarbon resources in China and the prospect of exploration and development. Pet. Explor. Dev. 2012, 39, 139–146. [Google Scholar] [CrossRef]
  6. Zhao, H.; Ning, Z.; Wang, Q.; Zhang, R.; Zhao, T.; Niu, T.; Zeng, Y. Petrophysical characterization of tight oil reservoirs using pressure-controlled porosimetry combined with rate-controlled porosimetry. Fuel 2015, 154, 233–242. [Google Scholar] [CrossRef]
  7. Cao, Z.; Liu, G.; Zhan, H.; Li, C.; You, Y.; Yang, C.; Jiang, H. Pore structure characterization of Chang-7 tight sandstone using MICP combined with N2GA techniques and its geological control factors. Sci. Rep. 2016, 6, 36919. [Google Scholar] [CrossRef]
  8. Liu, G.; Bai, Y.; Gu, D.; Lu, Y.; Yang, D. Determination of static and dynamic characteristics of microscopic pore-throat structure in a tight oil-bearing sandstone formation. AAPG Bull. 2018, 102, 1867–1892. [Google Scholar] [CrossRef]
  9. Xu, T.; Pu, J.; Qin, X.; Wei, Y. Experimental analysis of matrix moveable oil saturation in tight sandstone reservoirs of the south Ordos Basin, China. Energy Geosci. 2022. [Google Scholar] [CrossRef]
  10. Xi, K.; Cao, Y.; Haile, B.G.; Zhu, R.; Jahren, J.; Bjørlykke, K.; Zhang, X.; Hellevang, H. How does the pore-throat size control the reservoir quality and oiliness of tight sandstones? The case of the Lower Cretaceous Quantou Formation in the southern Songliao Basin, China. Mar. Pet. Geol. 2016, 76, 1–15. [Google Scholar] [CrossRef]
  11. Li, C.; Liu, G.; Cao, Z.; Sun, M.; You, Y.; Liu, N. Oil charging pore throat threshold and accumulation effectiveness of tight sandstone reservoir using the physical simulation experiments combined with NMR. J. Pet. Sci. Eng. 2021, 208, 109338. [Google Scholar] [CrossRef]
  12. Zhang, Y.; Zeng, J.; Dai, Z.; Viswanathan, H.; Xiao, T.; Ma, Y.; Feng, X. Experimental investigation on oil migration and accumulation in tight sandstones. J. Pet. Sci. Eng. 2018, 160, 267–275. [Google Scholar] [CrossRef]
  13. Zhang, Y. The Wettability in Tight Sandstone Formations and Its Effects on Oil Migration and Accumulation. Master’s Thesis, The China University of Petroleum, Beijing, China, 2019. [Google Scholar] [CrossRef]
  14. Meybodi, H.E.; Kharrat, R.; Araghi, M.N. Experimental studying of pore morphology and wettability effects on microscopic and macroscopic displacement efficiency of polymer flooding. J. Pet. Sci. Eng. 2011, 78, 347–363. [Google Scholar] [CrossRef]
  15. Sun, Y.-P.; Xin, Y.; Lyu, F.-T.; Dai, C.-L. Experimental study on the mechanism of adsorption-improved imbibition in oil-wet tight sandstone by a nonionic surfactant for enhanced oil recovery. Pet. Sci. 2021, 18, 1115–1126. [Google Scholar] [CrossRef]
  16. Hadia, N.J.; Ashraf, A.; Tweheyo, M.T.; Torsaeter, O. Laboratory investigation on effects of initial wettabilities on performance of low salinity waterflooding. J. Pet. Sci. Eng. 2013, 105, 18–25. [Google Scholar] [CrossRef]
  17. Mahani, H.; Keya, A.L.; Berg, S.; Bartels, W.-B.; Nasralla, R.; Rossen, W.R. Insights into the Mechanism of Wettability Alteration by Low-Salinity Flooding (LSF) in Carbonates. Energy Fuels 2015, 29, 1352–1367. [Google Scholar] [CrossRef]
  18. Akbari, R.; Antonini, C. Contact angle measurements: From existing methods to an open-source tool. Adv. Colloid Interface Sci. 2021, 294, 102470. [Google Scholar] [CrossRef]
  19. Xiao, M.; Yang, F.; Im, S.; Dlamini, D.S.; Jassby, D.; Mahendra, S.; Honda, R.; Hoek, E.M. Characterizing surface porosity of porous membranes via contact angle measurements. J. Membr. Sci. Lett. 2022, 2, 100022. [Google Scholar] [CrossRef]
  20. Peng, S.; Ren, B.; Meng, M. Quantifying the Influence of Fractures for More-Accurate Laboratory Measurement of Shale Matrix Permeability Using a Modified Gas-Expansion Method. SPE Reserv. Eval. Eng. 2019, 22, 1293–1304. [Google Scholar] [CrossRef]
  21. Amiri, M.; Ghiasi-Freez, J.; Golkar, B.; Hatampour, A. Improving water saturation estimation in a tight shaly sandstone reservoir using artificial neural network optimized by imperialist competitive algorithm—A case study. J. Pet. Sci. Eng. 2015, 127, 347–358. [Google Scholar] [CrossRef]
  22. Nordeng, S.H. The Bakken Petroleum System: An example of a continuous petroleum accumulation. NDGS Newsl. 2009, 36, 21–24. [Google Scholar]
  23. Zhang, Q.; Zhu, X.; Steel, R.J.; Zhong, D. Variation and mechanisms of clastic reservoir quality in the Paleogene Shahejie Formation of the Dongying Depression, Bohai Bay Basin, China. Pet. Sci. 2014, 11, 200–210. [Google Scholar] [CrossRef] [Green Version]
  24. Dou, L.; Hou, J.; Liu, Y.; Zhang, L.; Song, S.; Wang, X. Sedimentary infill of shallow water deltaic sand bodies controlled by small-scale syndepositional faults related paleogeomorphology: Insights from the paleogene Shahejie formation in the Dongying depression, Bohai Bay Basin, Eastern China. Mar. Pet. Geol. 2020, 118, 104420. [Google Scholar] [CrossRef]
  25. Liu, T. Optimization of Development Parameters for Horizontal Wells Multi-Stage Fracturing in Tight Oil Reservoir in JIYANG Depression, Bohai Bay Basin. Master’s Thesis, China University of Geosciences, Beijing, China, 2021. [Google Scholar] [CrossRef]
  26. Ma, L.; Zheng, H. Structural characteristics of the Central Uplift Belt of The Dongying Depression, Bohai Bay Basin. Pet. Geol. Exp. 2006, 28, 103. [Google Scholar]
  27. Lu, S.; Chen, G.; Wu, K.; Feng, D. Tectonic feature and evolution mechanism of central anticline belt of Dongying Depression, Bohai Bay Basin. Pet. Geol. Exp. 2013, 35, 274–279. [Google Scholar]
  28. Kra, K.L.; Qiu, L.; Yang, Y.; Yang, B.; Ahmed, K.S.; Camara, M.; Khan, D.; Yeli, W.; Kouame, E.M. Sedimentological and diagenetic impacts on sublacustrine fan sandy conglomerates reservoir quality: An example of the Paleogene Shahejie Formation (Es4s Member) in the Dongying Depression, Bohai Bay Basin (East China). Sediment. Geol. 2021, 427, 106047. [Google Scholar] [CrossRef]
  29. Zhang, X.; Zhu, X.; Lu, Z.; Lin, C.; Wang, X.; Pan, R.; Geng, M.; Xue, Y. An early Eocene subaqueous fan system in the steep slope of lacustrine rift basins, Dongying Depression, Bohai Bay Basin, China: Depositional character, evolution and geomorphology. J. Asian Earth Sci. 2019, 171, 28–45. [Google Scholar] [CrossRef]
  30. Yang, Y.; Li, Y. The Geochemical Characteristics and Distribution of Source Rocks of the Bozhong Sag in the Bohai Bay Basin. J. Mineral. Petrol. 2012, 32, 65–72. [Google Scholar]
  31. Hillier, S. Quantitative Analysis of Clay and other Minerals in Sandstones by X-Ray Powder Diffraction (XRPD). Clay Miner. Cem. Sandstones 2003, 213–251. [Google Scholar]
  32. Wang, D.; Li, Y.; Liu, C.; Zhan, L.; Lu, H.; Li, C.; Sun, J.; Meng, Q.; Liu, L.-L. Study of hydrate occupancy, morphology and microstructure evolution with hydrate dissociation in sediment matrices using X-ray micro-CT. Mar. Pet. Geol. 2019, 113, 104138. [Google Scholar] [CrossRef]
  33. Xia, Y.; Cai, J.; Perfect, E.; Wei, W.; Zhang, Q.; Meng, Q. Fractal dimension, lacunarity and succolarity analyses on CT images of reservoir rocks for permeability prediction. J. Hydrol. 2019, 579, 124198. [Google Scholar] [CrossRef]
  34. Liu, X.; Wang, J.; Ge, L.; Hu, F.; Li, C.; Li, X.; Yu, J.; Xu, H.; Lu, S.; Xue, Q. Pore-scale characterization of tight sandstone in Yanchang Formation Ordos Basin China using micro-CT and SEM imaging from nm- to cm-scale. Fuel 2017, 209, 254–264. [Google Scholar] [CrossRef]
  35. Markussen, Ø.; Dypvik, H.; Hammer, E.; Long, H.; Hammer, Ø. 3D characterization of porosity and authigenic cementation in Triassic conglomerates/arenites in the Edvard Grieg field using 3D micro-CT imaging. Mar. Pet. Geol. 2018, 99, 265–281. [Google Scholar] [CrossRef]
  36. Tetteh, J.T.; Barimah, R.; Korsah, P.K. Ionic Interactions at the Crude Oil–Brine–Rock Interfaces Using Different Surface Complexation Models and DLVO Theory: Application to Carbonate Wettability. ACS Omega 2022, 7, 7199–7212. [Google Scholar] [CrossRef] [PubMed]
  37. Zhu, W.; Ju, Y.; Zhao, M. Spontaneous Imbibition Mechanism of Flow Through Porous Media and Waterflooding in Low Permeability Fractured Sandstone Reservoir. Acta Pet. Sin. 2002, 23, 56–59. [Google Scholar]
  38. Wickramathilaka, S.; Howard, J.J.; Morrow, N.R.; Buckley, J. An Experimental Study of Low Salinity Waterflooding and Spontaneous Imbibition. J. Hazard Mater. 2011, 265, 89–95. [Google Scholar]
  39. Andersen, P.O.; Ahsan, R.; Evje, S.; Bratteli, F.; Madland, M.V.; Hiorth, A. A Model for Brine-dependent Spontaneous Imbibition Experiments with Porous Plate—(SPE-164901). In Proceedings of the 75th EAGE Conference & Exhibition incorporating SPE EUROPEC 2013. European Association of Geoscientists & Engineers, London, UK, 10–13 June 2013. [Google Scholar] [CrossRef]
  40. Cai, J.; You, L.; Hu, X.; Wang, J.; Peng, R. Prediction of Effective Permeability in Porous Media Based on Spontaneous Imbibition Effect. Int. J. Mod. Phys. C 2012, 23, 1250054. [Google Scholar] [CrossRef]
  41. Xia, Y.; Tian, Z.; Xu, S.; Wei, W.; Cai, J. Effects of microstructural and petrophysical properties on spontaneous imbibition in tight sandstone reservoirs. J. Nat. Gas Sci. Eng. 2021, 96, 104225. [Google Scholar] [CrossRef]
  42. Ge, H.-K.; Yang, L.; Shen, Y.-H.; Ren, K.; Meng, F.; Ji, W.-M.; Wu, S. Experimental investigation of shale imbibition capacity and the factors influencing loss of hydraulic fracturing fluids. Pet. Sci. 2015, 12, 636–650. [Google Scholar] [CrossRef] [Green Version]
  43. Hunt, A.; Ewing, R. Percolation Theory for Flow in Porous Media, 2nd ed.; Lecture Notes in Physics; Springer: Berlin/Heidelberg, Germany, 2014; p. 880. [Google Scholar] [CrossRef] [Green Version]
  44. Handy, L.L. Determination of effective capillary pressures for porous media from imbibition data. Trans. AIME 1960, 219, 75–80. [Google Scholar] [CrossRef]
  45. Gao, Z.; Hu, Q. Initial water saturation and imbibition fluid affect spontaneous imbibition into Barnett shale samples. J. Nat. Gas Sci. Eng. 2016, 34, 541–551. [Google Scholar] [CrossRef]
  46. Huang, Y. Nonlinear percolation feature in low permeability reservoir. Spec. Oil Gas Reserv. 1997, 4, 9–14. [Google Scholar]
  47. Qiao, J. Distribution Characteristics and Formation Mechanisms of Gas-Water Distribution in the Tight Sandstone Gas Reservoirs. Master’s Thesis, China University of Petroleum, Beijing, China, 2020. [Google Scholar] [CrossRef]
  48. Qiao, J.; Zhao, X.; Zeng, J.; Han, G.; Jiang, S.; Feng, S.; Feng, X. The Impacts of Nano-Micrometer Pore Structure on the Gas Migration and Accumulation in Tight Sandstone Gas Reservoirs. Energies 2019, 12, 4102. [Google Scholar] [CrossRef] [Green Version]
  49. Cheng, S.; Xu, L.; Zhang, D. Type curve matching of well test data for non-Darcy flow at low velocity. Pet. Explor. Dev. 1996, 23, 50–53. [Google Scholar]
  50. Fauziah, C.A.; Al-Yaseri, A.Z.; Beloborodov, R.; Siddiqui, M.A.Q.; Lebedev, M.; Parsons, D.; Roshan, H.; Barifcani, A.; Iglauer, S. Carbon dioxide/brine, nitrogen/brine and oil/brine wettability of smectite, illite and kaolinite at elevated pressure and temperature. Energ Fuel 2018, 33, 441–448. [Google Scholar] [CrossRef]
  51. Afekare, D.A.; Radonjic, M. From Mineral Surfaces and Coreflood Experiments to Reservoir Implementations: Comprehensive Review of Low-Salinity Water Flooding (LSWF). Energy Fuels 2017, 31, 13043–13062. [Google Scholar] [CrossRef]
  52. Kumar, K.; Dao, E.; Mohanty, K. AFM study of mineral wettability with reservoir oils. J. Colloid Interface Sci. 2005, 289, 206–217. [Google Scholar] [CrossRef]
  53. Tetteh, J.T.; Brady, P.V.; Ghahfarokhi, R.B. Review of low salinity waterflooding in carbonate rocks: Mechanisms, investigation techniques, and future directions. Adv. Colloid Interface Sci. 2020, 284, 102253. [Google Scholar] [CrossRef]
  54. Gomari, K.R.; Denoyel, R.; Hamouda, A.A. Wettability of calcite and mica modified by different long-chain fatty acids (C18 acids). J. Colloid Interface Sci. 2006, 297, 470–479. [Google Scholar] [CrossRef]
  55. Ulusoy, U.; Yekeler, M.; Hiçyılmaz, C. Determination of the shape, morphological and wettability properties of quartz and their correlations. Miner. Eng. 2003, 16, 951–964. [Google Scholar] [CrossRef]
  56. Sathish, P.; Beena, R.; Jyotsna, T. Surface and Flotation Characteristics of Spodumene:A Molecular Modeling Approach. Miner. Min. 2006. [Google Scholar]
  57. Li, F. Influence of clay minerals in sandstone reservoir on reservoir properties. Pet. Explor. Dev. 1980, 6, 67–79. [Google Scholar]
  58. Schrader, M.E.; Yariv, S. Wettability of clay minerals. J. Colloid Interface Sci. 1990, 136, 85–94. [Google Scholar] [CrossRef]
  59. Zhang, X.; Ge, J.; Kamali, F.; Othman, F.; Wang, Y.; Le-Hussain, F. Wettability of sandstone rocks and their mineral components during CO2 injection in aquifers: Implications for fines migration. J. Nat. Gas Sci. Eng. 2020, 73, 103050. [Google Scholar] [CrossRef]
  60. Yang, L.; Bing, L.X.; Kui, G.H.; Yu, L.H.; Chen, C.J.; Zhang, C.Q. The Relationship between Imbibition Characteristics and Pore Size Distribution. Sci. Technol. Eng. 2019. [Google Scholar]
  61. Washburn, E.W. The Dynamics of Capillary Flow. Phys. Rev. 1921, 17, 273–283. [Google Scholar] [CrossRef]
  62. Sukee, A.; Nunta, T.; Haruna, M.A.; Kalantariasl, A.; Tangparitkul, S. Influence of sequential changes in the crude oil-water interfacial tension on spontaneous imbibition in oil-wet sandstone. J. Pet. Sci. Eng. 2021, 210, 110032. [Google Scholar] [CrossRef]
  63. Habibi, A.; Binazadeh, M.; Dehghanpour, H.; Bryan, D.; Uswak, G. Advances in Understanding Wettability of Tight Oil Formations. In Spe Technical Conference & Exhibition; OnePetro: Richardson, TX, USA, 2016. [Google Scholar]
  64. Chaturvedi, T.; Schembre, J.; Kovscek, A. Spontaneous imbibition and wettability characteristics of Powder River Basin coal. Int. J. Coal Geol. 2009, 77, 34–42. [Google Scholar] [CrossRef]
  65. Xi, K.; Chao, Y.; Liu, K.; Jahren, J.; Zhu, R.; Yuan, G.; Hellevang, H. Authigenic minerals related to wettability and their impacts on oil accumulation in tight sandstone reservoirs: An example from the Lower Cretaceous Quantou Formation in the southern Songliao Basin, China. J. Asian Earth Sci. 2019, 178, 173–192. [Google Scholar] [CrossRef]
  66. Zha, M.; Wang, S.; Ding, X.; Feng, Q.; Xue, H.; Su, Y. Tight oil accumulation mechanisms of the Lucaogou Formation in the Jimsar Sag, NW China: Insights from pore network modeling and physical experiments. J. Southeast Asian Earth Sci. 2018, 178, 204–215. [Google Scholar] [CrossRef]
  67. Liu, D.; Sun, W.; Ren, D.; Zhang, Q.; Ming, H.; Chen, B. Features of Pore-throat structures and movable fluid in tight gas reservoir: A case from the 8th member of Permian Xiashihezi Formation and the 1st member of Shanxi Formation in the western area of Sulige Gasfield, Ordos Basin. Nat. Gas Geosci. 2016, 27, 2136–2146. [Google Scholar]
Figure 1. Geological background of the study area: (a) Oil generation sag map of Bohai Bay Basin; (b) Tectonic distribution map of Dongying Depression; (c) Geological section of Shahejie Formation in Dongying Depression, Bohai Bay Basin.
Energies 15 04267 g001
Figure 2. The photograph of the experimental setup of physical simulation of oil migration and accumulation.
Energies 15 04267 g002
Figure 3. The sample flooding facility for physical simulation of oil migration and accumulation.
Energies 15 04267 g003
Figure 4. The pore size distributions (a) and the throat size distributions (b) of the three chosen samples.
Energies 15 04267 g004
Figure 5. Cumulative imbibition versus time of 7 samples.
Energies 15 04267 g005
Figure 6. The conventional oil seepage curves of oil flow in migration for the 3 sandstone samples.
Energies 15 04267 g006
Figure 7. Plots of oil saturation vs. pressure gradient reflecting the oil accumulation process in sandstone reservoirs.
Energies 15 04267 g007
Figure 8. Relationship between the mass fraction of different minerals and the oil contact angle of samples: (a) Illite–Smectite layer-mixed, (b) Illite, (c) Chlorite, (d) Calcite, (e) Quartz, (f) Kaolinite, (g) Feldspar, (h) Smectite.
Energies 15 04267 g008
Figure 9. The correlation between different parameters and spontaneous imbibition slope: (a) contact angle; (b) water-wet minerals; (c) oil-wet minerals.
Energies 15 04267 g009
Figure 10. Adsorption of water on the water-wet surface of the rock.
Energies 15 04267 g010
Figure 11. Adsorption of oil on the oil-wet surface of the rock.
Energies 15 04267 g011
Table 1. Sample information.
Sample IDSampleWellDepth (m)FormationPorosity (%)Permeability (mD)
1S127-8S1273110.6Es36.2440.003
2N35-61N353080.5Es36.150.048
3N116-16N1163111.4Es324.4632.907
4S127-13S1273053.6Es33.0140.078
5S112-16S1123046.1Es314.910.23
6N105-16N1053103.6Es37.1110.153
7A5-23A53106.5Es32.0620.043
Table 2. Physical and chemical properties of crude oil.
Density (g/cm3) at 25 °CViscosity (cP) at 25 °CAsphalthene (%)Saturated Hydrocarbon (%)Aromatic Hydrocarbon (%) Non-Hydrocarbon (%)
0.874623.476.6061.2114.2517.94
Table 3. Mineral content distribution in the sample.
Sample IDMineral Content(%)
QuartzFeldsparCalcitePyriteAnhydriteClay MineralsK1I/S2S3I4C5
176.213.48.1 2.357.58.34.210.719.3
259.519.42.2 4.314.655.324.34.26.59.7
377.617.80.2 4.458.610.59.26.814.9
457.123.15.1 3.511.263.617.43.67.18.3
564.417.37.4 1.79.270.118.11.76.23.9
671.1162.4 1.78.855.19.38.86.520.3
752.7149.12.35.716.280.88.30.210.40.3
K1: Kaolinite; I/S2: Illite–Smectite layer-mixed mineral; S3:Smectite; I4: Illite; C5: Chlorite.
Table 4. Pore-throat size distribution information.
Sample IDMaximum Radius
(Pore/Throat, μm)
Minimum Radius
(Pore/Throat, μm)
Average Radius
(Pore/Throat, μm)
342/321/18.42/3.84
522/171/0.54.36/2.12
719/71/0.52.62/1.81
Table 5. Measurement results of contact angle of samples and single minerals.
Sample IDSample and Single MineralTemperature (°C)Pressure (MPa)Contact Angle
(Average/First/Second, °)
1S127-8251.0134.7/34.9/34.5
2N35-61251.0139.9/39.5/40.3
3N116-16251.0134.8/35.3/34.3
4S127-13251.0138.5/37.5/39.5
5S112-16251.0143.5/43.7/43.3
6N105-16251.0131.5/31.4/31.6
7A5-23251.0157/57.1/56.9
/quartz251.0136.7/36.6/36.8
/feldspar251.0145.4/45.2/45.6
/kaolinite251.01107.8/108.1/107.5
/illite251.0157.8/58.4/57.2
/chlorite251.0157/56.8/57.2
/calcite251.01105.3/105.4/105.2
/smectite251.0184.6/84.1/85.1
Table 6. Spontaneous imbibition rate of 7 samples.
Sample IDSample Shape Porosity (%)Permeability (mD)Spontaneous Imbibition Rate
1S127-8cube6.2440.0030.52
2N35-61cube6.150.0480.59
3N116-16cube24.4632.9070.62
4S127-13cube3.0140.0780.52
5S112-16cube14.910.230.54
6N105-16cube7.1110.1530.57
7A5-23cube2.0620.0430.46
Table 7. Fitting equations and key migration pressure gradients of oil flow in migration.
Sample IDSample Porosity (%)Permeability (mD)Kickoff Pressure
Gradient (MPa·cm−1)
Critical Pressure
Gradient (MPa·cm−1)
3N116-1624.4632.9070.12/
5S112-1614.910.230.706.50
7A5-232.0620.0430.621.27
Table 8. Ultimate oil saturation parameters of sandstone.
Sample IDSample Porosity (%)Permeability (mD)Ultimate Oil Saturation (%)
3N116-1624.4632.90762.77
5S112-1614.910.2366.66
7A5-232.0620.04368.67
Publisher’s Note: MDPI stays neutral with regard to jurisdictional claims in published maps and institutional affiliations.

