Abstract
In order to improve the combustion performance of a ramjet under low temperature and pressure, a gliding arc plasma actuator was designed based on a typical evaporation flameholder. The discharge characteristics, as well as the activating effect of single-channel and three-channel gliding arc plasma under different carrier gas flow rates, were studied. Results show that with the increase in the carrier gas flow rate, the average duration of the gliding arc discharge becomes shorter, while the average power increases, and the specific input energy decreases. Compared with single-channel discharge, three-channel discharge has higher discharge power and energy injection rate, which makes a bigger actuated space. Through gliding arc plasma, the kerosene is cracked and H2, CH4, C2H2, C2H4, C3H6 and other small molecule components are produced. For three-channel gliding arc discharge, the effective cracking rate and the production rate of each component are higher than those of the single-channel discharge; both of them gradually increase with the increase in the carrier gas flow rate. The experiment results indicate that three-channel gliding arc plasma can effectively widen the ignition boundary and improve the combustion efficiency of ramjet combustion. The ignition pressure boundary is expanded from 60 kPa to 50 kPa under 390 K; the combustion efficiency is increased from 76% to 82%.
1. Introduction
The TBCC (turbine-based combined cycle) engine has several advantages such as horizontal take-off and landing, wide flight envelope, low fuel consumption, reusability, and high economic performance, which is considered as one of the ideal power sources for hypersonic vehicles [1,2]. However, the combustion efficiency of a TBCC engine is much lower during the transition between turbine mode and ramjet mode; it results in some problems such as insufficient net thrust and unpowered flying, and both of them can badly influence flight safety. By widening the lower speed boundary for ignition of the ramjet, the net thrust of the TBCC engine during modal transition can be significantly increased and flight performance can be improved [3]. Unfortunately, aviation kerosene’s activity is insufficient at low temperatures and pressures, making it difficult to accomplish consistent ignition and efficient combustion in the ramjet combustor [4].
Cracking of aviation kerosene can effectively enhance its activity and is expected to solve the above problem. Traditional cracking methods include pyrolysis and catalytic cracking. Jiankun Shao and Ronald K. Hanson et al. have pyrolyzed jet fuel at high temperatures and pressures, and measured the content of methane and ethylene with lasers at a temperature range of 1000–1400 K and a pressure range of 12–40 atm [5]. X.J. Fan et al. catalyzed the cracking of Jet-3 aviation kerosene using a zeolite catalyst under supercritical conditions and measured the content of products below C5 [6]. However, pyrolysis requires an additional heat source; the catalyst is inefficient and mostly toxic, so a clean and efficient way of cracking fuel is urgently needed. Through its significant thermal, chemical, and aerodynamic characteristics, plasma can be used for mixing intensification [7], flow structure modification [8], improving ignition and combustion [9,10,11] et al., Especially as a recognized novel technique for combustion regulation around the world [12,13], plasma has demonstrated good effects in broadening the ignition boundary [14,15], catalytically cracking fuel molecules [16,17], boosting flame combustion efficiency [18,19], and reducing combustion instability [20,21]. The plasma is able to function even in high-speed flow. Sergey B. Leonov believed that it can give a possibility of fast, inertia-less control of external and internal flows, guiding of separation processes, and control of the high-speed combustion [22]. Axel Vincent-Randonnier revealed the role of the large-scale motion of the flame on its anchoring by the plasma [23]. Alexander Firsov’s research shows that the use of plasma technology may potentially lead to reduction in total pressure losses when operating the combustor under non-optimal conditions, enhancement of operation stability and, consequently, expanding the air-breathing corridor of ramjet/scramjet operation range [24].
Gliding arc discharge plasma [25] has been widely adopted in assisted combustion [26,27], kerosene activation [28] and other industries [29] due to its high energy density and large action range [30,31]. In recent years, a lot of research has been carried out on fuel activation with gliding arc plasma. Thierry Paulmier and Laurent Fulcheri used a dual-channel series gliding arc plasma reactor to investigate the influence of oil–gas ratio, air and steam ratio, and ambient pressure on the cracking effect in gasoline reforming. The feasibility of reforming gasoline into hydrogen-rich gas with gliding arc plasma was also studied [32]. Zhu cracked toluene with swirling gliding arc plasma in nitrogen, and results show that H2 and C2H2 are the two primary gas products, and the greatest cracking rate is up to 95% [33]. Song and Xu investigated the cracking of n-decane with a gliding arc plasma in the air and argon environment. It was found that hydrogen, ethylene, and acetylene are three main components of cracking gas in the argon, while the cracking products in the air contain a lot of hydrogen, ethylene, acetylene, methane, and other active components. Moreover, parts of the chemical reaction pathways have been detailed [34,35].
So far, the research on kerosene activation by gliding arc plasma is mainly focused on the mechanism. In addition, plasma is usually used to treat only a single component, whereas aviation kerosene is a mixture of several components [36]. When using plasma for kerosene activation, many components of the kerosene are involved in the cracking reaction and their cracking effects need to be investigated. In this paper, the characteristics of gliding arc plasma, as well as its activating effect on kerosene, are studied. The experimental validation was fulfilled on a ground ramjet combustion facility. Results show that with gliding arc plasma, the ignition boundary can be extended, and the combustion efficiency is also improved.
2. Experimental Setup
2.1. The Evaporative Flameholder with Plasma Actuator
The basic structure of evaporative flameholder is shown in Figure 1, in which the electrodes, as well as distribution of kerosene spray are also given. The aviation kerosene first flows into the evaporation chamber, then mixes with the air. Through the evaporation hole, the oil–air mixture enters the ignition area, which is ignited to generate a pilot flame. As anode of the actuator, three tungsten needles are radially fixed in the evaporative chamber, while the flameholder wall is grounded as cathode. To realize multi-channel discharge, each tungsten needle is connected in series with a 255pF capacitor [37,38].
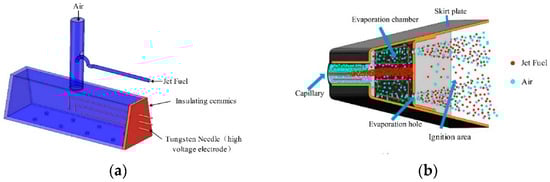
Figure 1.
Evaporative flameholder’s (a) basic configuration and electrode layout and (b) oil and gas distribution.
2.2. The Diagnose System for Electric and Cracking Characteristics of Gliding Arc
Figure 2 depicts the testing system for kerosene activation using gliding arc plasma. It comprises an evaporative flameholder with a plasma actuator, a gas supply system, an oil supply system, a gas chromatograph, an electrical characteristic test system, and a high-speed camera. The plasma power source is an AC gliding arc power source that can generate a sine wave with a maximum peak voltage of 20 kV and a 15 kHz actuation frequency. High-pressure nitrogen with a purity of 99.99 percent is used as the carrier gas. A gas heater regulates the carrier gas’s temperature (the gas of 1000 L/min can be heated from room temperature to 800 K), and a mass flow controller regulates the carrier gas’s flow rate (error 2%). The high-voltage probe and current probe collect the waveform of the gliding arc plasma discharge, which is then recorded and evaluated by the oscilloscope. A gas chromatograph (Agilent 7890B) is used to evaluate the components of the cracked gas. It can measure the quantity of H2, CO2, CO, O2, N2, and gaseous light hydrocarbons in the cracked gas. A high-speed camera (Phantom UHS v2512) was used to image the spatial evolution process of the gliding arc plasma at a frequency of 10,000 Hz, a resolution of 1280 × 720, and the minimum exposure period of 100 ns.
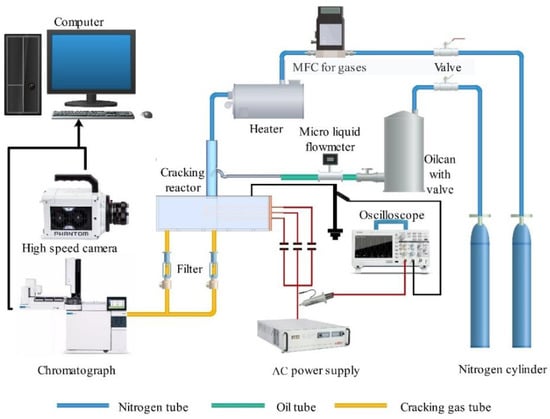
Figure 2.
The testing system for kerosene activation using gliding arc plasma.
During the experiment, the gas was heated and passed through the flameholder for 10 s to exhaust the air, preventing oxygen from influencing the results. Then, the aviation kerosene was injected into the evaporation chamber. Then, 5 s later, the gliding arc was triggered to crack the kerosene. After that, the gas collection lasted for 5 s to improve the experiment’s accuracy and stability. The Agilent 7890B gas chromatograph was adopted to measure the products. In order to minimize the experimental error, each experiment was conducted three times and the data were averaged.
2.3. The Ramjet Testbed
The sketch of ramjet testbed is shown in Figure 3. The mass flow rate of the testbed is up to 1.5 kg/s, the temperature can be varied from 290 K to 450 K, the lower boundary of airflow is about 5 kPa, and the Mach number on testing section ranges from 0.1–0.3. With this facility, the stable experiment can last for as long as 10 s.
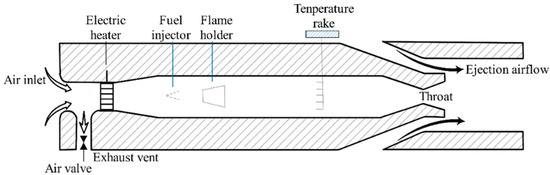
Figure 3.
The sketch of ramjet testbed.
During the experiment, the air is pressurized and preheated to simulate the parameters of incoming flow. An injector is placed 15 cm upstream the flameholder, through which the fuel is injected into the channel. After being vaporized and mixed with air, the ignition and combustion can be achieved. For further analysis, 24 thermocouples are fixed uniformly downstream the flameholder to acquire gas temperature. At the end of the channel, there is an ejector, by which the pressure of high flying altitude is simulated.
3. Results and Discussion
3.1. Electrical Characteristics of Gliding Arc Plasma
With room temperature of 298 K, the voltage–current–power plots of gliding arc discharge under different nitrogen flow rates are shown in Figure 4, the electrode gap is set to be 6 mm, and no kerosene is supplied.
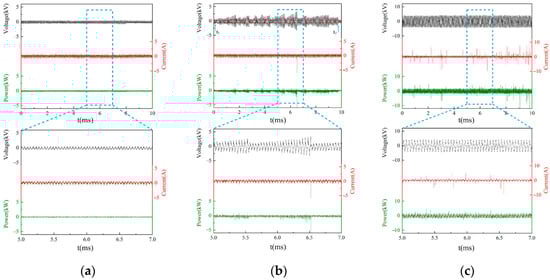
Figure 4.
The current, voltage, and power waveforms of (a) 25 L/min, single-channel discharge, (b) 200 L/min, single-channel discharge and (c) 200 L/min, three-channel discharge.
It can be found in Figure 4a that with lower gas flow rate, all the voltage, current, and power plots fluctuate within a narrow range, the sinusoidal voltage waveform is distorted, and the basic waveforms of current and power are sawtooth waves with fewer spikes, as shown.
In Figure 4b, it can be seen that envelope curve of the voltage of single-channel gliding arc discharge is triangular with higher carrier gas flow rate. A complete discharge cycle occurs between t1 and t2. The voltage across the electrodes lowers fast at the start of the discharge, and a pulsed peak current on the order of amperes is generated at the same time. Peak voltage rises as the arc slides and stretches. When the arc column reaches a particular length, it disappears and regenerates, and a new discharge cycle begins. The electrical breakdown between the arc column and the arc wall, or between the arc column and the arc column, is known as the arc shunt phenomenon [39]. The arc-shunting phenomenon occurred several times in a single gliding cycle, and one distinguishing feature is that the peak voltage lowers rapidly but does not reach the minimum value (marked by red dotted line). The expanded waveform shows that the voltage waveform is distorted in a single discharge cycle, and the basic current and power waveforms are still sawtooth waves with peaks appearing when regeneration or arc shunting happens.
Figure 4c shows that, in comparison to a single-channel discharge, the capacitor in the three-channel discharge branch has a voltage-stabilizing effect, ensuring that each channel’s voltage peak value remains constant, the voltage amplitude remains relatively constant, and the voltage waveform remains undistorted, but the number of current spikes increases significantly.
The average discharge power, also known as the active power, is defined as the energy output by the gliding arc discharge per unit time, which may be computed using the Formula (1).
The current and voltage at time t are represented by U(t) and I(t), respectively, with V and A as the units.
The energy injected by the gliding arc plasma in the carrier gas per unit volume flow is referred to as specific input energy (SIE), and the unit is J/L, which can be computed using the Formula (2).
indicates the gliding arc discharge’s average power in W, and F represents the carrier gas’s volume flow in L/s in the formula. Specific input energy, which is an important metric, can measure gliding-arc discharge intensity.
The average power and SIE of single-channel and three-channel gliding-arc discharges under varied gas flow rates are presented in Figure 5 when the flow rate of kerosene is 0, the temperature is room temperature (298 K), and the minimum electrode spacing is 6 mm. With increasing carrier gas flow rate, the average power of single-channel gliding arc discharge and three-channel gliding arc discharge increased. When the carrier gas flow increased from 25 L/min to 200 L/min, the average power of single-channel gliding arc discharge grew from 41.56 W to 111.90 W, and the average power of three-channel gliding arc discharge climbed from 61.46 W to 202.38 W. The average power of the three-channel gliding arc discharge is always greater than the single-channel gliding arc discharge when the carrier gas flow is the same. When the carrier gas flow is 200 L/min, the average power of the three-channel gliding arc discharge is 81% higher than the single-channel gliding arc.
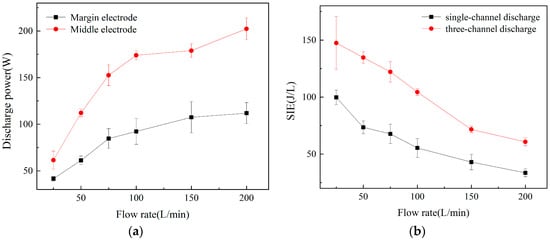
Figure 5.
The (a) average power and (b) SIE under different gas flow rates.
The variation trend of SIE with carrier gas flow is the polar opposite of the average power variation trend. With increasing carrier gas flow, the SIE of single-channel gliding-arc discharge and three-channel gliding-arc discharge both decrease. When the carrier gas flow increased to 200 L/min, the SIE of the single-channel gliding arc discharge decreased to 33.57 J/L, while the SIE of the three-channel gliding-arc discharge was lowered to 60.71 J/L. The SIE of the three-channel gliding arc discharge is greater than that of the single-channel gliding-arc discharge when the carrier gas flow is the same. The SIE of the three-channel gliding-arc discharge is 81 percent greater than the single-channel gliding-arc discharge when the carrier gas flow is 200 L/min.
3.2. Gliding Arc Plasma’s Spatial Evolution
Figure 6 depicts the arc development process of a single-channel AC gliding arc discharge in one cycle when the nitrogen flow rate is 200 L/min, the kerosene flow rate is 0, the temperature is room temperature (298 K), and the minimum electrode separation is 6 mm. The initial position of the arc breakdown, as indicated in ① in Figure 6, is between the left edge of the tungsten needle and the bottom sidewall plate, due to airflow inside the plasma actuator. Following that, the arc is gradually stretched by the carrier gas blowing. The tip effect affects the needle-shaped anode; thus, it has a high ability to stabilize the arc. As a result, the position of the arc root at the anode remains essentially static, while the arc root at the cathode slides along the wall. The arc rotates and slides due to the action of the vortex in the flameholder’s evaporation chamber.
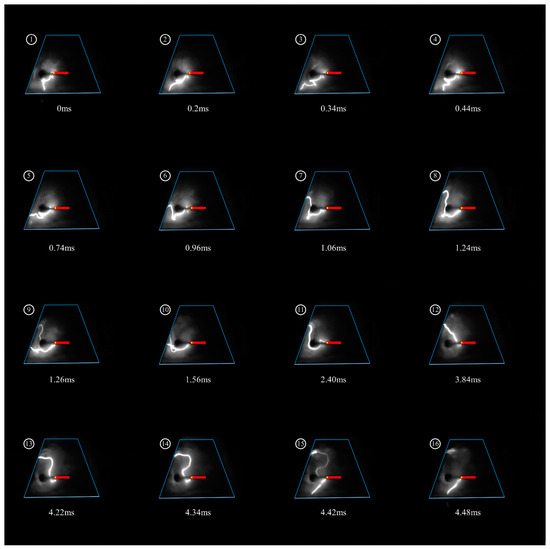
Figure 6.
Arc development process with a flow rate of 150 L/min in 0–4.48 ms.
It is important to note that the gliding arc is a well-established term, characterizing the plasma filament between two electrodes in a self-sustained convective flow. However, we compared our measured waveform with a typical gliding-arc waveform and found no significant difference. Therefore, we believe that the discharge in our experiment is also a form of gliding-arc discharge.
②–④ depict the cathode arc root gliding down the bottom wall, while ⑤–⑭ depict the cathode arc root gliding along the left wall. Multiple arc-shunting events happened during the arc’s gliding process, with ④, ⑨, and ⑩ representing the re-breakdown between the arc column and the arc wall, also known as large-scale shunting, and ⑫ representing the breakdown between the arc columns, also known as small-scale shunting. On the one hand, the arc’s gliding, stretching, and shunting phenomena can increase the arc’s effective area, making it easier to treat more oil mist. The continual changing of the negative electrode position, on the other hand, lowers the ablation of the flameholder surface. ⑮ shows that when the arc is stretched to the limit length, it cannot obtain enough energy from the power source to maintain thermodynamic equilibrium; therefore, it transitions into a non-equilibrium condition and dissipates gradually. Then, a new arc is produced between the anode tungsten needle and the bottom wall under the influence of high voltage.
Figure 7 shows the arc development process of a single-channel AC gliding arc discharge in one cycle when the nitrogen flow rate is 50 L/min and all other working parameters are held constant. When the carrier gas flow rate is low, the initial position of the breakdown discharge is the tip of the anode tungsten needle and the right-hand wall, the arc extension length is short, arc shunting does not occur, and the gliding period increases to 38.44 ms.
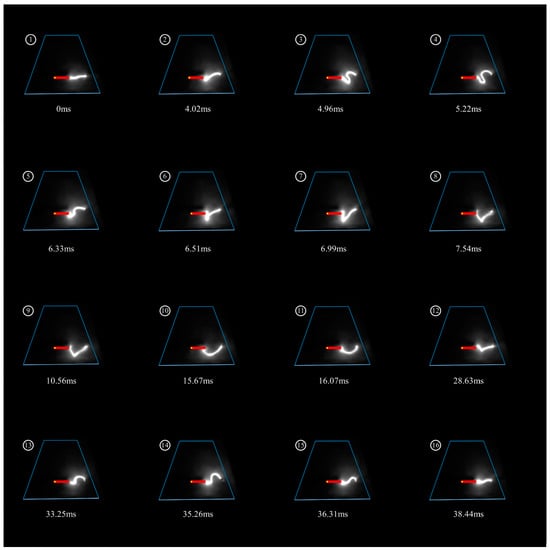
Figure 7.
Arc development process with a flow rate of 50 L/min in 0–38.44 ms.
Table 1 shows the arc’s sliding periods as a function of carrier gas flow rate. When the carrier gas flow is constant, the length of each arc-sliding cycle is somewhat random. However, as the carrier gas flow rate increases, the arc’s sliding speed increases, and the arc’s average sliding period steadily reduces. The average sliding duration dropped from 63.93 ms to 6.51 ms when the carrier gas flow increased from 25 L/min to 200 L/min.

Table 1.
The arc’s sliding periods as a function of carrier gas flow rate.
The arc development process of any one of the discharge channels during three-channel discharge is similar to that of single-channel discharge. Figure 8 shows pseudo-color images of single-channel and three-channel discharges under the identical working conditions. The arc in Figure 8a and the rightmost arc in Figure 8b are both stretched to their maximum lengths; the arc length in Figure 8a is 28.25 mm, and the rightmost arc in Figure 8b is 24.36 mm. The brightness of the arc is quantified by the average gray value in the 5 mm width range with the arc as the center, which is 136.53 for single-channel discharge and 111.70 for three-channel discharge. Despite the fact that the three-channel discharge’s arc covers a larger area, the brightness and maximum stretching length of the arc are slightly lower than those of the single-channel discharge due to limitation of the power supply.
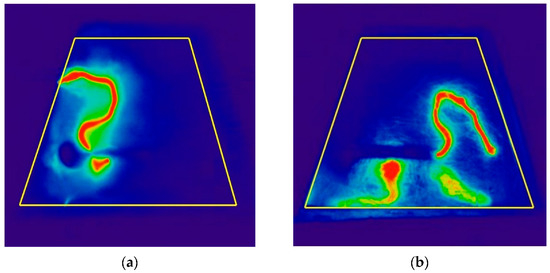
Figure 8.
Pseudo-color images of (a) single-channel and (b) three-channel gliding arc discharge.
In conclusion, because the average power and SIE of the three-channel gliding arc discharge are higher than those of the single-channel gliding arc discharge, and the plasma distribution is wider, the three-channel gliding arc discharge is better suited to the activation and cracking of kerosene.
3.3. Activation and Cracking with Gliding Arc Plasma
The cracking gas was collected and analyzed at a minimum electrode spacing of 6 mm, a temperature of 390 K, a kerosene flow rate of 40 mL/min, and a nitrogen flow rate of 25–200 L/min. The concentration of each active product in the pyrolysis gas created by the three-channel gliding arc plasma actuation is shown in Figure 9 at a flow rate of 200 L/min of nitrogen gas. Hydrogen, acetylene, ethylene, and methane are the four active components with the largest quantities in the fractured gas, accounting for 52.98 percent, 23.43 percent, 10.89 percent, and 7.49 percent, respectively.
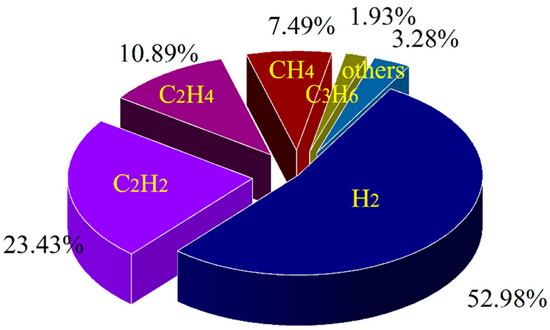
Figure 9.
The concentration of each active product in the pyrolysis gas.
The cracking effect of kerosene is evaluated using two criteria in this paper: effective cracking rate and production rate. Effective cracking rate (ECR) refers to the proportion of kerosene that is cracked to gaseous products as a percentage of the total input kerosene and can be computed using the Formula (3).
In the formula, denotes the mass flow rate of hydrogen in the input kerosene (in g/s), denotes the molar mass of H (in 1 g/mol), and is the molar flow rate of hydrogen in the fractured gas (which may be determined using the Formula (4)).
denotes a hydrocarbon with the number of carbon elements x and y, indicates volume percentage, (L/min) indicates volume flow, and indicates gas molar volume, which is 22.4 L/mol in the ordinary atmospheric state.
The production rate of each component in the cracked gas in the kerosene cracking process is referred to as production rate (PR), and it is the most straightforward index to evaluate the yield of each component, which can be computed using Formula (5).
The molar mass of CxHy and H2 is represented by (g/mol) in the formula.
Figure 10 depicts the variation law of effective cracking rate with carrier gas flow rate. At the same carrier gas flow rate, the ECR of the three-channel gliding arc plasma is higher than that of the single-channel gliding arc plasma. The ECR of the three-channel gliding arc plasma increased from 0.6% to 3.3% when the carrier gas flow was raised from 25 L/min to 200 L/min. The ECR of a single-channel gliding arc plasma grew at first, then declined, reaching a maximum of 1.65% at 150 L/min.
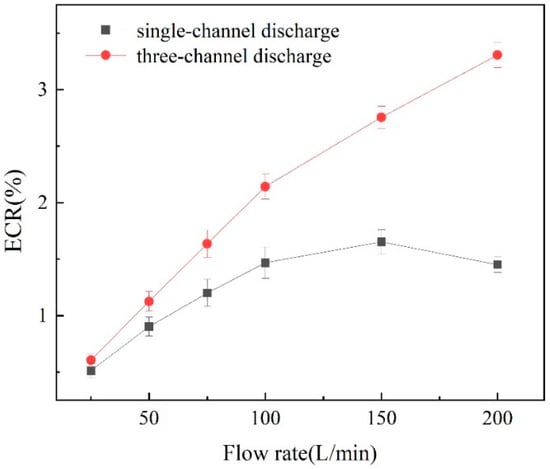
Figure 10.
The variation law of ECR with the flow rate of carrier gas.
Hydrogen, methane, acetylene, ethylene, and propylene are the five components in the cracking gas with the highest production rate. Figure 11 depicts the relationship between the carrier gas flow rate and the rate of generation of various components. When three-channel gliding arc plasma actuation was used, the production rate of the five main components increased as the carrier gas flow increased. As the carrier gas flow rate increased from 25 L/min to 200 L/min, the PR of hydrogen increased from 0.28 mg/s to 1.22 mg/s, a 336% increase, while the PR of acetylene grew from 1.32 mg/s to 7.00 mg/s, a 430% increase. When a single-channel gliding arc plasma was employed for actuation, the PR of acetylene remained rising throughout, whereas the PR of the other four components grew at first, then declined, reaching a maximum when the carrier gas flow was 150 L/min. Under the same carrier gas flow rate, the PR of each component under three-channel gliding arc actuation is greater than that under single-channel gliding arc actuation. The higher the carrier gas flow, the larger the difference.
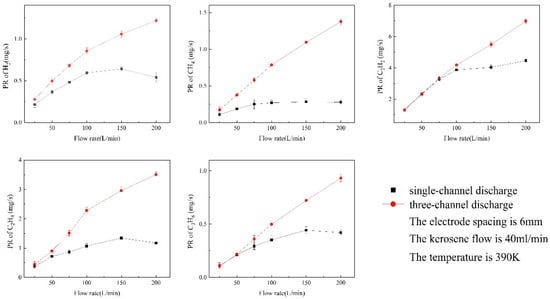
Figure 11.
The variation in the PR of various components with the flow rate of the carrier gas.
The residence time of kerosene in the plasma zone and the energy of the gliding-arc discharge can both be used to analyze the aforesaid variation law of effective cracking rate and production rate. Although an increase in carrier gas flow results in a shorter kerosene residence time, the change in kerosene residence time is minimal due to the presence of a vortex in the evaporation chamber. At the same time, when the carrier gas flow rate rises, the gliding arc discharge’s power rises, the plasma dispersion expands, and more high-energy particles are created to break the kerosene molecules’ chemical bonds. Because of the high power of the three-channel gliding-arc discharge, the energy factor becomes more important as the carrier gas flow rate increases, increasing the ECR and PR of each component. The shortening of residence time prevails because the power of the single-channel gliding-arc discharge is low. When the carrier gas flow is high, some kerosene deviates from the discharge region due to the tiny plasma action area, lowering the ECR rate and PR of each component.
In conclusion, the three-channel gliding arc plasma is more suitable for ignition and combustion in the ramjet than the single-channel gliding arc plasma because it has a stronger kerosene activate ability.
3.4. Widening Ignition Boundaries and Improving Combustion Efficiency with Gliding Arc Plasma
Under the operating conditions of 1.38 kg/s incoming flow rate, 390 K temperature, and 0.5 equivalence ratio, a high-energy spark plug igniter with ignition energy of 12 J and frequency of 10 Hz was utilized to investigate the effect of gliding arc plasma widening the ignition boundary. The ignition failed in the experiment when the combustion chamber pressure was decreased to 50 kPa without plasma actuation, as illustrated in Figure 12.
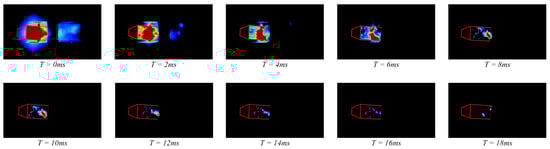
Figure 12.
The flame development process when the ignition fails.
The spark plug discharge generates an initial fire core in the flameholder at T = 0 s. Under the influence of the airflow, the original fire core progressively traveled to the downstream recirculation zone of the flameholder. The energy in the fire core is dispersed during the movement, and the fire core’s size is gradually diminished. The activity of kerosene is so low at low temperatures and low pressures that it is difficult to ignite by the fire core, resulting in ignition failure.
Successful ignition in the combustion chamber can be performed under the same conditions after applying plasma actuation, and the flame development process is depicted in Figure 13. It demonstrates that with the airflow moving downstream, the fire core generated by the high-energy spark plug in the flameholder will continue to propagate. The active tiny molecules contained in the kerosene are ignited at T = 6 ms, the volume of the fire core rises, and the energy is boosted, causing the kerosene spray to burn to form a flame. The flame is stable and has spread across the entire combustion chamber at T = 18 ms, indicating that the ignition was successful.
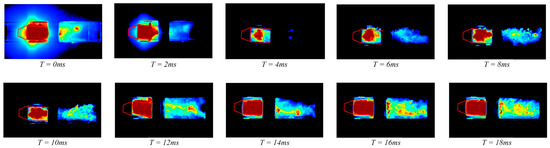
Figure 13.
The flame development process when the ignition succeeds.
The ignition pressure boundary was measured before and after plasma actuation at incoming flow temperatures of 390 K and 420 K, as shown in Figure 14. When the inflow temperature is 390 K, the ignition pressure boundary is enlarged from 60 kPa to 50 kPa after applying plasma actuation, with a 16.7% expansion rate. When the inflow temperature is 420 K, the ignition pressure boundary is enlarged from 45 kPa to 39 kPa after applying plasma actuation, with a 13.3% expansion rate.
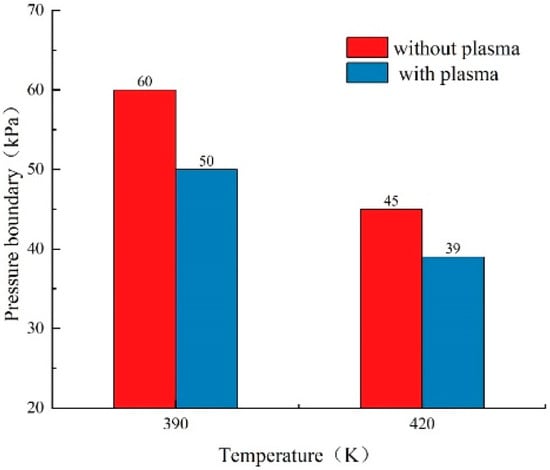
Figure 14.
The ignition pressure boundary before and after the application of plasma actuation.
In order to verify the effect of gliding arc plasma on improving the combustion efficiency, the average temperature of the flow field after combustion was measured by the temperature rake under the working conditions of the incoming flow rate of 1.38 kg/s, the temperature of 390 K and 420 K, the combustion chamber pressure of 70 kPa, and the equivalency ratio of 0.5. The combustion efficiency is determined using Formula (6).
In the formula, Hf is the calorific value of aviation kerosene in kJ/kg; ht3 is the specific enthalpy of the combustion chamber inlet; ht4 is the specific enthalpy of the combustion chamber outlet, both in kJ/kg; Qma is the air flow; and Qmf is the kerosene flow, both in kg/s. In order to simplify the calculation, we ignored the difference in specific enthalpy between kerosene and air. Additionally, because the plasma power is lower compared to Qf*Hf, we did not consider its effect in our calculations.
The results of the calculation are shown in Figure 15. When the temperature of the incoming flow was 390 K, the temperature at the back end of the combustion chamber was 1230 K; the combustion efficiency was 76% calculated by Formula (6) before applying the gliding arc plasma actuation. When the incoming flow temperature was raised to 420 K, the back end of the combustion chamber was 1325 K; the combustion efficiency increased by 7.89% to 82%. The combustion efficiency after plasma actuation reached 82% under the 390 K working condition, which is 7.89% greater than without actuation; the combustion efficiency under the 420 K working condition reached 87%, which is 6.10% higher than without actuation.
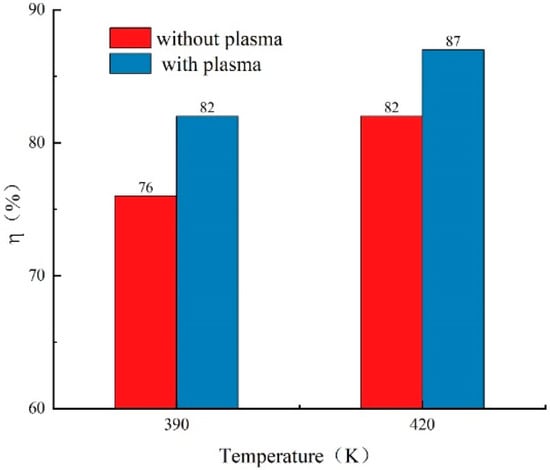
Figure 15.
The combustion efficiency before and after the application of plasma actuation.
4. Conclusions
The discharge characteristics of the gliding arc plasma and the effect of kerosene activate are studied in this paper by arranging the gliding arc plasma actuation in the evaporative flameholder, and the effect of the plasma actuation in the auxiliary combustion of ramjet is verified. The main conclusions are as follows:
(1) Arc breakdown–stretching–re-breakdown is a cyclic process in gliding arc discharge. As the carrier gas flow increases, the average period of the gliding arc discharge shortens, the average power increases, and the specific input energy drops. Three-channel discharge has a wider range of action, higher discharge power and energy injection rate, and higher application value than single-channel discharge.
(2) Small molecular components such as H2, CH4, C2H2, C2H4, and C3H6 were produced by the gliding arc plasma cracking of aviation kerosene. Because the effective cracking rate and production rate of each component are higher than those of the single-channel gliding arc discharge, the three-channel gliding arc discharge is more suitable for ignition and combustion support in ramjet.
(3) The effective cracking rate and production rate of each component of the three-channel gliding arc discharge gradually increased as the carrier gas flow rate increased, while the effective cracking rate and production rate of each component of the single-channel gliding arc discharge first increased and then decreased, reaching a maximum when the carrier gas flow rate was 150 L/min.
(4) The gliding arc plasma can widen the ignition boundary of the combustion chamber when the inflow temperature is 390 K or 420 K, and the expansion rate is higher when the inflow temperature is 390 K.
(5) The ram combustion chamber’s combustion efficiency can be considerably improved by using gliding arc plasma. The combustion efficiency can be enhanced by 7.89% at 390 K and 6.10% at 420 K after using gliding arc plasma actuation.
Through this study, the role of gliding arc plasma in combustion modulation in ramjet has been demonstrated. However, the significance of this study goes beyond that. The improved combustion efficiency of gliding arc plasma makes it possible to be useful in a wider range, such as improving the combustion efficiency of internal combustion engines to reduce exhaust emissions and improving the combustion efficiency of coal to reduce power plant pollution.
We must acknowledge that there is still scope for further expansion of our research. First, the plasma temperature has an important effect on fuel cracking; however, due to the limitations of the test methods, we are currently unable to accurately measure the temperature of the gliding arc plasma, which will be solved soon with the update of the test methods. Secondly, there are still many problems to be solved from the engineering application, such as the fact that the power supply is too heavy, and the discharge efficiency is minimal. The above questions will be the focus of our research in the next phase.
Author Contributions
Investigation, S.H. and W.C.; data curation, K.Z. and J.S.; validation, D.J., X.C. and S.H.; writing—original draft preparation, J.S.; writing—review and editing, D.J. All authors have read and agreed to the published version of the manuscript.
Funding
This research received no external funding.
Data Availability Statement
Not applicable.
Acknowledgments
The authors are thankful for the experimental equipment and technical support provided by Science and Technology on Plasma Dynamics Laboratory.
Conflicts of Interest
The authors declare no conflict of interest.
References
- Walker, S.; Tang, M.; Mamplata, C. TBCC propulsion for a Mach 6 hypersonic airplane. In Proceedings of the 16th AIAA/DLR/DGLR International Space Planes and Hypersonic Systems and Technologies Conference, Bremen, Germany, 19–22 October 2009; p. 7238. [Google Scholar]
- Chen, M.; Tang, H.; Zhang, K.; Hui, O.; Wang, Y. Turbine-based combined cycle propulsion system integration concept design. Proc. Inst. Mech. Eng. Part G J. Aerosp. Eng. 2013, 227, 1068–1089. [Google Scholar] [CrossRef]
- Huang, W.; Yan, L.; Tan, J. Survey on the mode transition technique in combined cycle propulsion systems. Aerosp. Sci. Technol. 2014, 39, 685–691. [Google Scholar] [CrossRef]
- Miao, J.; Fan, Y.; Liu, T. Influence of strut on cavity at subsonic speeds: Ignition characteristics. Proc. Inst. Mech. Eng. Part G J. Aerosp. Eng. 2020, 234, 1369–1379. [Google Scholar] [CrossRef]
- Shao, J.; Zhu, Y.; Hanson, R.K. A shock tube study of jet fuel pyrolysis and ignition at elevated pressures and temperatures. Fuel 2018, 226, 338–344. [Google Scholar] [CrossRef]
- Fan, X.J.; Zhong, F.Q.; Yu, G. Catalytic Cracking and Heat Sink Capacity of Aviation Kerosene Under Supercritical Conditions. J. Propuls. Power 2009, 25, 6. [Google Scholar] [CrossRef]
- Leonov, S.; Isaenkov, Y.; Firsov, A. Mixing intensification in high-speed flow by unstable pulse discharge. In Proceedings of the 40th AIAA Plasmadynamics and Lasers Conference, San Antonio, TX, USA, 22–25 June 2009; p. 4074. [Google Scholar]
- Boeuf, J.P.; Lagmich, Y.; Unfer, T.; Callegari, T.; Pitchford, L.C. Electrohydrodynamic force in dielectric barrier discharge plasma actuators. J. Phys. D Appl. Phys. 2007, 40, 652–662. [Google Scholar] [CrossRef]
- Dechaumphai, E.; Barton, J.L.; Tesmer, J.R.; Moon, J.; Wang, Y.; Tynan, G.R.; Chen, R. Near-surface thermal characterization of plasma facing components using the 3-omega method. J. Nucl. Mater. 2014, 455, 56–60. [Google Scholar] [CrossRef]
- Fridman, A. Plasma Chemistry; Cambridge University Press: Cambridge, UK, 2008. [Google Scholar]
- Fomin, V.M.; Tretyakov, P.K.; Taran, J.P. Flow control using various plasma and aerodynamic approaches (short review). Aerosp. Sci. Technol. 2004, 8, 411–421. [Google Scholar] [CrossRef]
- Alrashidi, A.M.; Adam, N.M.; Hairuddin, A.A.; Abdullah, L.C. A review on plasma combustion of fuel in internal combustion engines. Int. J. Energy Res. 2018, 42, 1813–1833. [Google Scholar] [CrossRef]
- Starikovskaia, S.M. Plasma-assisted ignition and combustion: Nanosecond discharges and development of kinetic mechanisms. J. Phys. D Appl. Phys. 2014, 47, 353001. [Google Scholar] [CrossRef]
- Brande, W.T. The bakerian lecture: On some new electro-chemical phenomena. Philos. Trans. R. Soc. Lond. 1814, 104, 51–61. [Google Scholar]
- Barbosa, S.; Pilla, G.; Lacoste, D.; Scouflaire, P.; Ducruix, S.; Laux, C.; Veynante, D. Inflrence of a repetitively pulse plasma on the flame stability domain of a lab-scale gas turbine combustor. In Proceedings of the Fourth European Combustion Meeting, Vienna, Austria, 14–17 April 2009; pp. 1–6. [Google Scholar]
- Taghvaei, H.; Jahanmiri, A.; Rahimpour, M.R.; Shirazi, M.M.; Hooshmand, N. Hydrogen production through plasma cracking of hydrocarbons: Effect of carrier gas and hydrocarbon type. Chem. Eng. J. 2013, 226, 384–392. [Google Scholar] [CrossRef]
- Jahanmiri, A.; Rahimpour, M.R.; Shirazi, M.M.; Hooshmand, N.; Taghvaei, H. Naphtha cracking through a pulsed DBD plasma reactor: Effect of applied voltage, pulse repetition frequency and electrode material. Chem. Eng. J. 2012, 191, 416–425. [Google Scholar] [CrossRef]
- Esakov, I.; Grachev, L.; Khodataev, K.; Vinogradov, V.; Van Wie, D. Efficiency of propane-air mixture combustion assisted by deeply undercritical MW discharge in cold high-speed airflow. In Proceedings of the 44th AIAA Aerospace Sciences Meeting and Exhibit, Reno, NV, USA, 9–12 January 2006. [Google Scholar]
- Chintala, N.; Bao, A.; Lou, G.; Adamovich, I.V. Measurements of combustion efficiency in nonequilibrium RF plasma-ignited flows. Combust. Flame 2006, 144, 744–756. [Google Scholar] [CrossRef]
- Moeck, J.P.; Lacoste, D.A.; Durox, D.; Guiberti, T.F.; Schuller, T.; Laux, C.O. Stabilization of a Methane-Air Swirl Flame by Rotating Nanosecond Spark Discharges. IEEE Trans. Plasma Sci. 2014, 42, 2012–2013. [Google Scholar] [CrossRef]
- Zhou, S.; Nie, W.; Tian, Y. High frequency combustion instability control by discharge plasma in a model rocket engine combustor. Acta Astronaut. 2021, 179, 391–406. [Google Scholar] [CrossRef]
- Leonov, S.B.; Yarantsev, D.A. Plasma-induced ignition and plasma-assisted combustion in high-speed flow. Plasma Sources Sci. Technol. 2006, 16, 132. [Google Scholar] [CrossRef]
- Vincent-Randonnier, A.; Larigaldie, S.; Magre, P.; Sabel’nikov, V. Plasma assisted combustion: Effect of a coaxial DBD on a methane diffusion flame. Plasma Sources Sci. Technol. 2006, 16, 149. [Google Scholar] [CrossRef]
- Firsov, A.; Savelkin, K.V.; Yarantsev, D.A.; Leonov, S.B. Plasma-enhanced mixing and flameholding in supersonic flow. Philosophical Transactions of the Royal Society A: Mathematical. Phys. Eng. Sci. 2015, 373, 20140337. [Google Scholar]
- Czernichowski, A. Gliding arc: Applications to engineering and environment control. Pure Appl. Chem. 1994, 66, 1301–1310. [Google Scholar] [CrossRef]
- Liming, H.; Yi, C.; Jun, D.; Jianping, L.; Li, F.; Pengfei, L. Experimental study of rotating gliding arc discharge plasma-assisted combustion in an aero-engine combustion chamber. Chin. J. Aeronaut. 2019, 32, 337–346. [Google Scholar]
- Fridman, A.; Gutsol, A.; Gangoli, S.; Ju, Y.; Ombrello, T. Characteristics of gliding arc and its application in combustion enhancement. J. Propuls. Power 2008, 24, 1216–1228. [Google Scholar] [CrossRef]
- Kai, Z.; Feilong, S.; Di, J.; Shida, X.; Jiulun, S.; Shengfang, H. Experimental investigation on the cracking of pre-combustion cracking gas with gliding arc discharge plasma. Int. J. Hydrog. Energy 2021, 46, 9019–9029. [Google Scholar] [CrossRef]
- Li, L.; Zhang, H.; Li, X.; Kong, X.; Xu, R.; Tay, K.; Tu, X. Plasma-assisted CO2 conversion in a gliding arc discharge: Improving performance by optimizing the reactor design. J. CO2 Util. 2019, 29, 296–303. [Google Scholar] [CrossRef]
- Lie, L.; Bin, W.; Chi, Y.; Chengkang, W.U. Characteristics of gliding arc discharge plasma. Plasma Sci. Technol. 2006, 8, 653. [Google Scholar] [CrossRef] [Green Version]
- Richard, F.; Cormier, J.M.; Pellerin, S.; Chapelle, J. Physical study of a gliding arc discharge. J. Appl. Phys. 1996, 79, 2245–2250. [Google Scholar] [CrossRef]
- Paulmier, T.; Fulcheri, L. Use of non-thermal plasma for hydrocarbon reforming. Chem. Eng. J. 2005, 106, 59–71. [Google Scholar] [CrossRef]
- Zhu, F.; Li, X.; Zhang, H.; Wu, A.; Yan, J.; Ni, M.; Buekens, A. Destruction of toluene by rotating gliding arc discharge. Fuel 2016, 176, 78–85. [Google Scholar] [CrossRef]
- Song, F.; Wu, Y.; Xu, S.; Yang, X.; Xuan, Y. N-Decane Reforming by Gliding Arc Plasma in Air and Nitrogen. Plasma Chem. Plasma Process. 2020, 40, 1429–1443. [Google Scholar] [CrossRef]
- Song, F.; Wu, Y.; Xu, S.; Jin, D.; Jia, M. N-decane decomposition by microsecond pulsed DBD plasma in a flow reactor. Int. J. Hydrog. Energy 2019, 44, 3569–3579. [Google Scholar] [CrossRef]
- Fan, X.; Yu, G. Analysis of thermophysical properties of Daqing RP-3 aviation kerosene. J. Propuls. Technol. Beijing 2006, 27, 187. [Google Scholar]
- Zhang, Z.; Wu, Y.; Jia, M.; Song, H.; Sun, Z.; Li, Y. Modeling and optimization of themultichannel spark discharge. Chin. Phys. B 2017, 26, 65–204. [Google Scholar]
- Zhang, Z.; Wu, Y.; Jia, M.; Song, H.; Sun, Z.; Zong, H.; Li, Y. The multichannel discharge plasma synthetic jet actuator. Sens. Actuators A Phys. 2017, 253, 112–117. [Google Scholar] [CrossRef]
- Zhukov, M.F. Arc Plasma Torch; Zasypkin Cambridge International Science Publishing Ltd.: Cambridge, UK, 2007. [Google Scholar]
Publisher’s Note: MDPI stays neutral with regard to jurisdictional claims in published maps and institutional affiliations. |
© 2022 by the authors. Licensee MDPI, Basel, Switzerland. This article is an open access article distributed under the terms and conditions of the Creative Commons Attribution (CC BY) license (https://creativecommons.org/licenses/by/4.0/).