Article

Effectiveness and Feasibility of Market Makers for P2P Electricity Trading

1
Commodity Business Department, Sumitomo Corporation, Tokyo 100-8601, Japan
2
Department of Technology Management for Innovation, The University of Tokyo, Tokyo 113-8656, Japan
3
Faculty of Business Sciences, University of Tsukuba, Tokyo 112-0012, Japan
*
Author to whom correspondence should be addressed.
Energies 2022, 15(12), 4218; https://doi.org/10.3390/en15124218
Submission received: 20 April 2022 / Revised: 1 June 2022 / Accepted: 4 June 2022 / Published: 8 June 2022
(This article belongs to the Special Issue Forecasting and Risk Management Techniques for Electricity Markets)

Abstract

:
Motivated by the growing demand for distributed energy resources (DERs), peer-to-peer (P2P) electricity markets have been explored worldwide. However, such P2P markets must be balanced in much smaller regions with a lot fewer participants than centralized wholesale electricity markets; hence, the market has inherent problems of low liquidity and price instability. In this study, we propose applying a market maker system to the P2P electricity market and developing an efficient market strategy to increase liquidity and mitigate extreme price fluctuations. To this end, we construct an artificial market simulator for P2P electricity trading and design a market agent and general agents (photovoltaic (PV) generators, consumers, and prosumers) to perform power bidding and contract processing. Moreover, we introduce market-maker agents in this study who follow the regulations set by a market administrator and simultaneously place both sell and buy orders in the same market. We implement two types of bidding strategies for market makers and examine their effects on liquidity improvement and price stabilization as well as profitability, using solar PV generation and consumption data observed in a past demonstration project. It is confirmed that liquidity and price stability may be improved by introducing a market maker although there is a trade-off relationship between these effects and the market maker’s profitability.

1. Introduction

Since environmental issues have been attracting worldwide attention, the Japanese government declared that it would achieve a decarbonized society by 2050. However, feed-in tariffs, which have been functioning as incentives for the introduction of renewable energy, are now being scaled down or abolished. Therefore, as a new incentive system, decentralized peer-to-peer (P2P) power trading based on microgrids is being actively explored in many countries. Various studies on P2P trading have already been conducted in the form of proof-of-concept experiments and numerical simulations [1,2,3,4,5,6,7,8,9] as well as investigating market mechanisms [10,11,12,13,14] and social implementations [15,16,17]. These studies have verified the effectiveness of P2P electricity trading from technical, environmental, and profitability perspectives; however, at the same time, they revealed some potential problems inherent in this market. One is extreme price fluctuation (or price volatility) caused by low market liquidity, where liquidity refers to the bidding amount in an order book. If liquidity is sufficiently high, the market price is robust to a large market order, which could significantly influence market situations because the accumulated bidding amount buffers the impact of market orders. However, liquidity tends to decrease in the P2P market because of the market’s specific characteristics. First, the entire market comprises consecutive 30-min markets divided by region and time slots. Furthermore, the trading volume per participant is much smaller than that in the wholesale market because the P2P market participants are normal households or non-electric companies. For these reasons, large price fluctuations, attributed to low liquidity, can easily arise. During a proof-of-concept demonstration of P2P power trading conducted in the Urawa-Misono District, Japan (see [18] for a summary of the project and its results), excessive price fluctuations in a short time period were often detected (see Section 2). Price volatility problems are becoming a prime concern across the entire electric power industry owing to various factors, such as system shifts, abnormal climates, and soaring resource prices. Moreover, in infrastructural industries, a stable supply is of utmost importance; therefore, this volatility problem should be handled on a highest-priority basis. In this study, we introduce market makers into the P2P electricity market. Market makers are market participants who contribute to liquidity improvement and price stabilization in an exchange market (see, e.g., [19] for a market maker program introduced in the Japan Exchange Group, Inc. (Tokyo, Japan)) while securing their own profit. The objective of this study is to design bidding strategies for market makers and test them through several simulations.
Here, we introduce related studies on the application of financial functions to electricity markets. Electricity markets have stricter restrictions than other assets; for instance, electricity cannot be stored and must be generated at the time of demand. Hence, electricity market-specific solutions can be invented as follows. First, optimal bidding strategies for electricity markets have been developed in several studies [20,21,22,23,24,25,26,27,28,29]. In these references, Baltaoglu et al. [29], for example, proposed a type of arbitrage called “virtual bidding”. In existing wholesale electricity markets, participants have two different markets for one specific product or a 30-min electricity delivery period: a day-ahead market and an hour-ahead market. Virtual bidding aims to make profits through buying in a day-ahead market and selling in an hour-ahead market or selling in a day-ahead market and buying back in an hour-ahead market. If the same amounts are executed for selling and buying, that is, a position is established between the two markets, then the price difference would be the profit for this strategy. Next, electricity and weather derivatives (including forwards/futures) may be considered practical applications of derivatives theory for real businesses in electricity markets [30,31,32,33,34,35,36,37,38,39,40,41,42,43]. Among them, Yamada and Matsumoto (2021) [41] and Matsumoto and Yamada (2021) [42,43] advocated weather derivatives, the payments of which depend on weather data at a predetermined place and time. Electricity utilities are constantly exposed to fluctuation risks in solar power generation and electricity demand, which are associated with solar radiation, temperature, etc. These factors greatly influence electricity prices and, in turn, their profits; therefore, implementing measures against weather forecast uncertainty is a major focus for the power industry. With a system that allows these businesses to receive insurance coverage for losses incurred by the deviation of a weather index from a predetermined range, they can hedge profit risks and stabilize their management. This type of electricity insurance has already been developed and commercialized. Finally, there are several studies on market makers in the context of enhancing liquidity and price stability for electricity markets [44,45,46,47,48], which are the focus of this study. For example, Bose et al. (2014) [47] explore market makers’ impacts on social welfare, residual social welfare, and consumer surplus at the general Nash equilibrium in a Cournot competition model. In addition, Worthmann et al. [48] examine market makers’ effect to mitigate the negative influences that come with the development of distributed electricity generation using real data from Australia.
In this study, we propose introducing market makers to solve the price volatility problem inherent in P2P markets by improving liquidity. Market makers always quote both selling and buying prices and are willing to trade at those prices at any time. Their main purpose is to make a profit; however, by repeatedly trading in large volumes, they provide liquidity to the market. This system has already been introduced in conventional markets such as stocks and commodities, e.g., [19], and its role is undertaken primarily by securities companies. To evaluate the market maker system’s effectiveness against the price volatility problem, we develop an artificial P2P electricity market simulator in Python, emulating the market and participant specifications employed in the Urawa-Misono proof-of-concept project [11]. We compare and evaluate the results of three simulation case studies with and without a market maker, in which two types of market maker agents are adopted based on the market maker rules developed in [49,50] for stock trading.
This paper is organized as follows: In Section 2, we provide a detailed explanation of the motivational Urawa-Misono demonstration project and the market rules adopted in this study; in Section 3, we explain the basic configuration, information flowchart, and role of each agent in the artificial market simulation conducted in this study; in Section 4, we perform artificial market simulations based on the actual generation and demand data and compare the cases with and without market makers; Section 5 provides a comprehensive discussion based on the results of our analysis; and Section 6 provides concluding remarks and describes future research directions.

2. Motivative Experiment and Market Rules

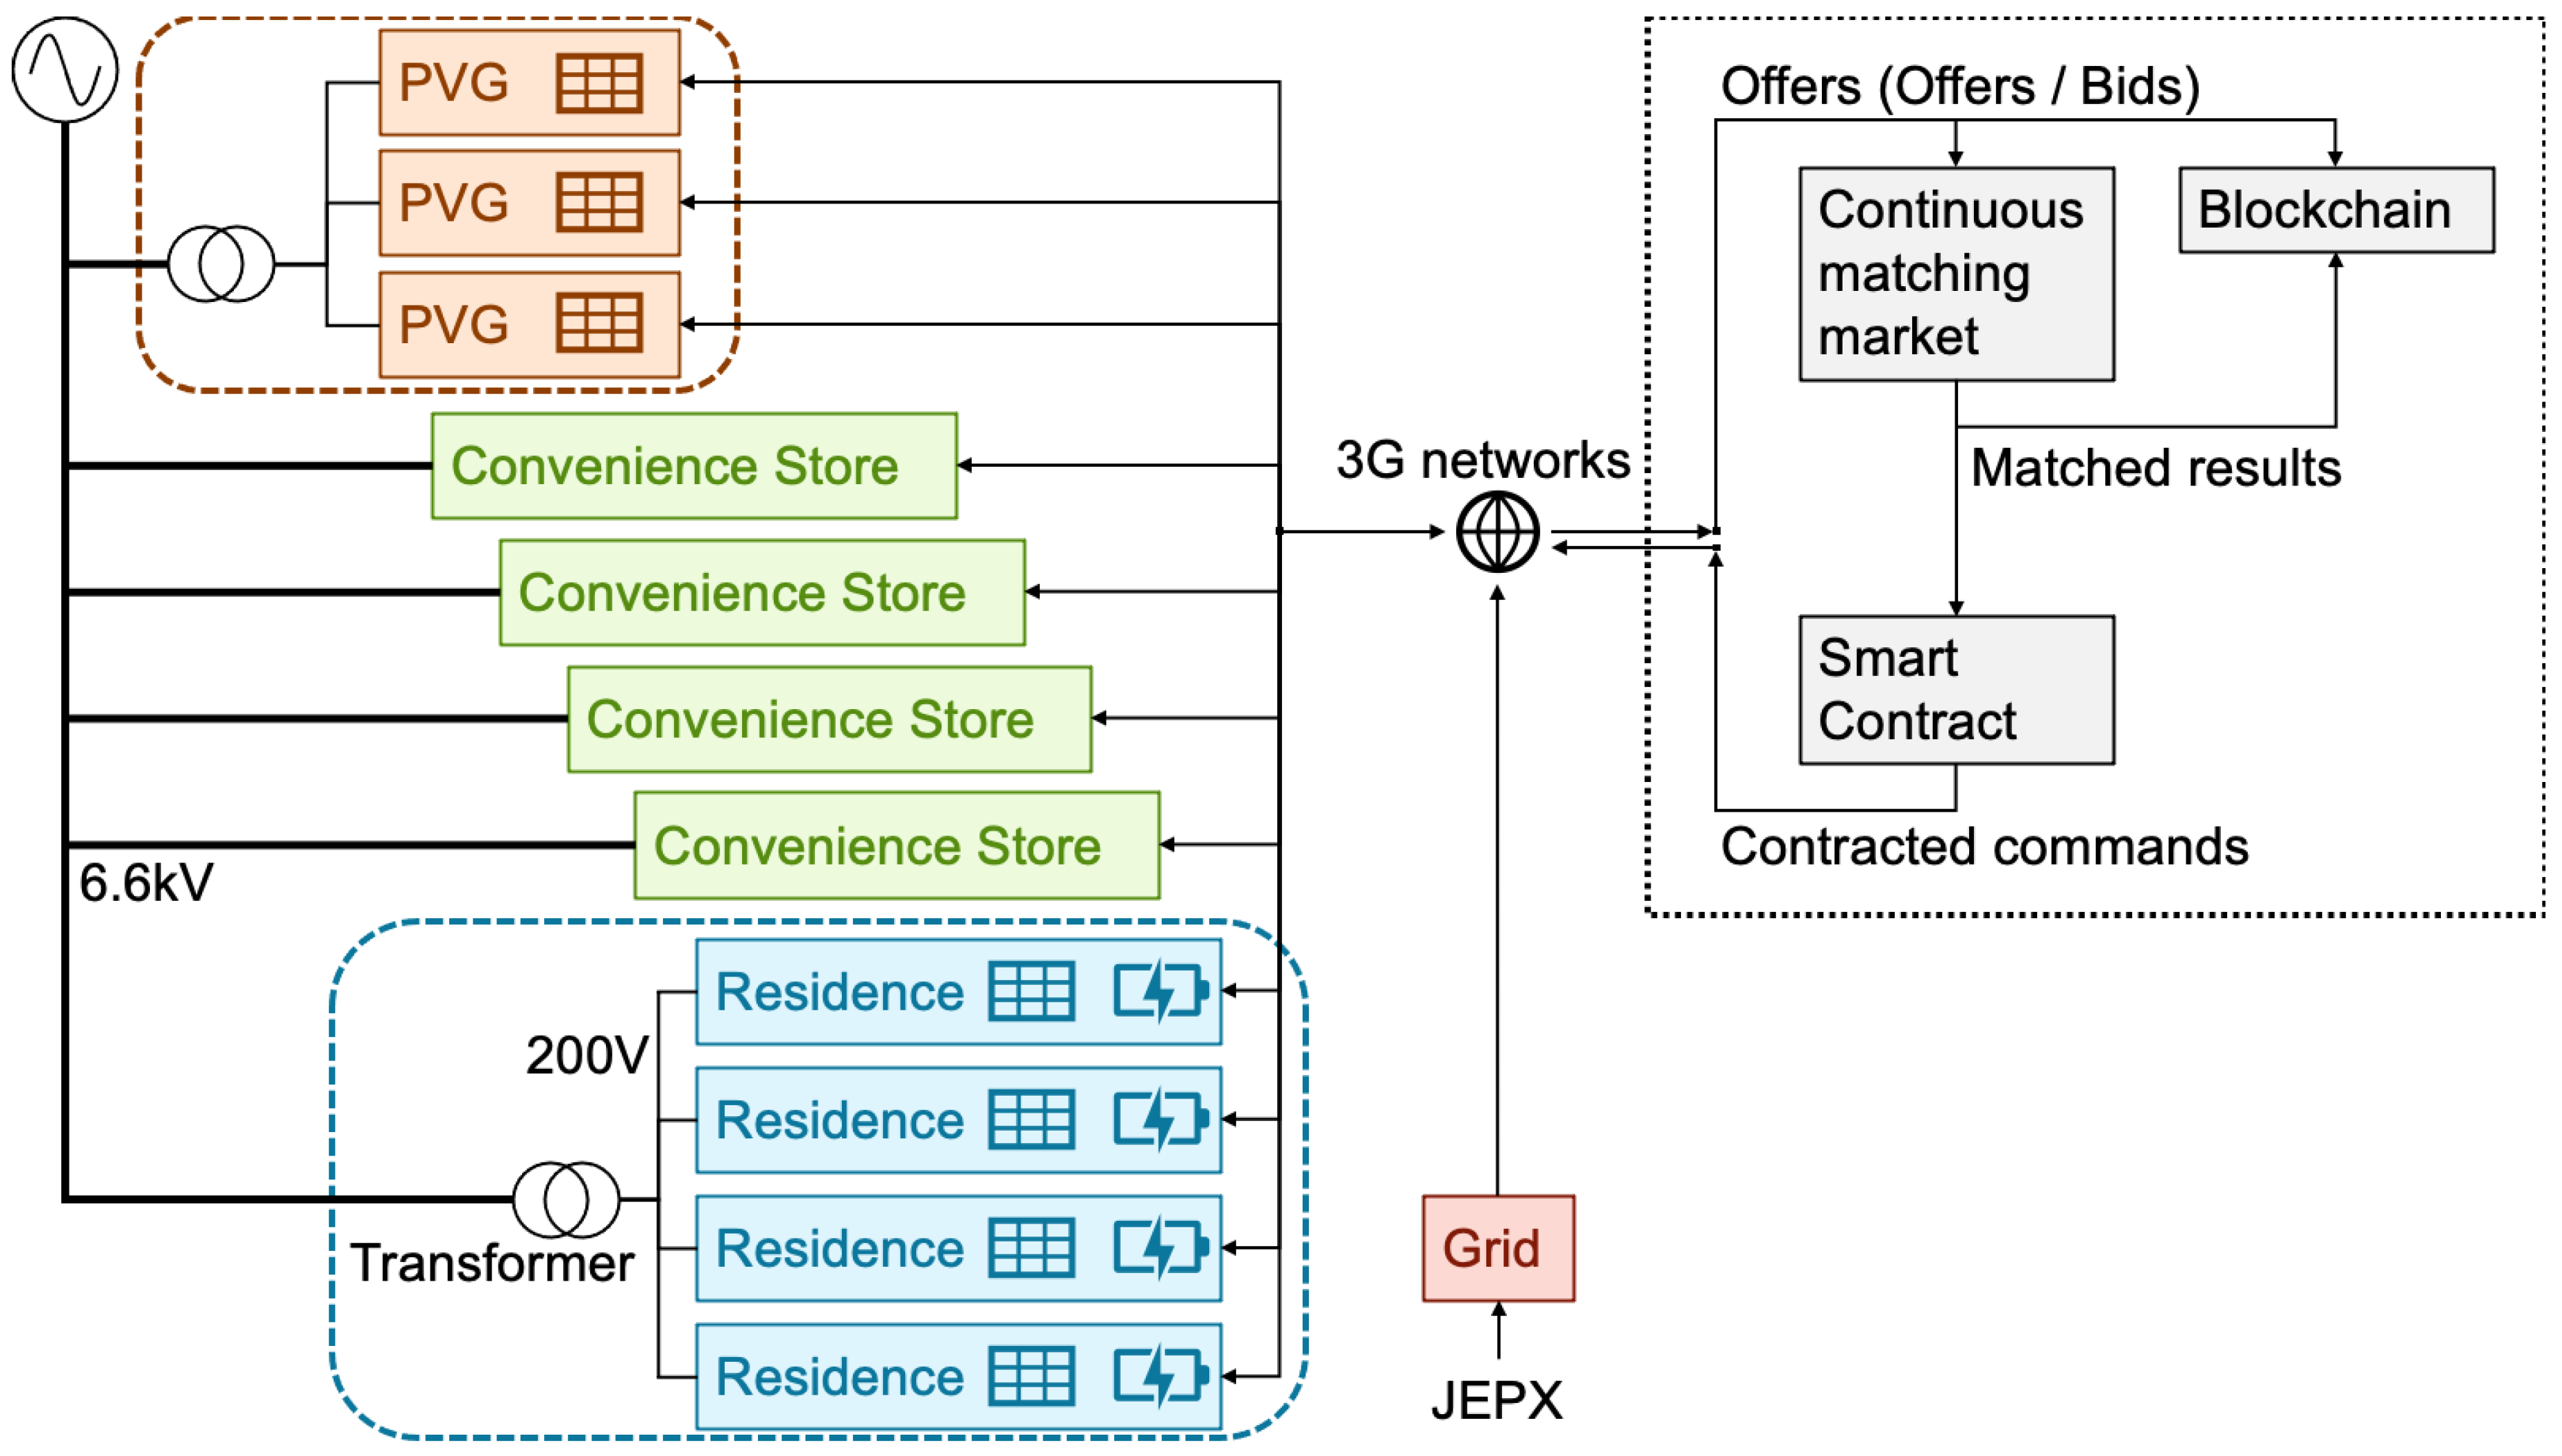
2.1. Motivative Demonstration Project and Potential Problem
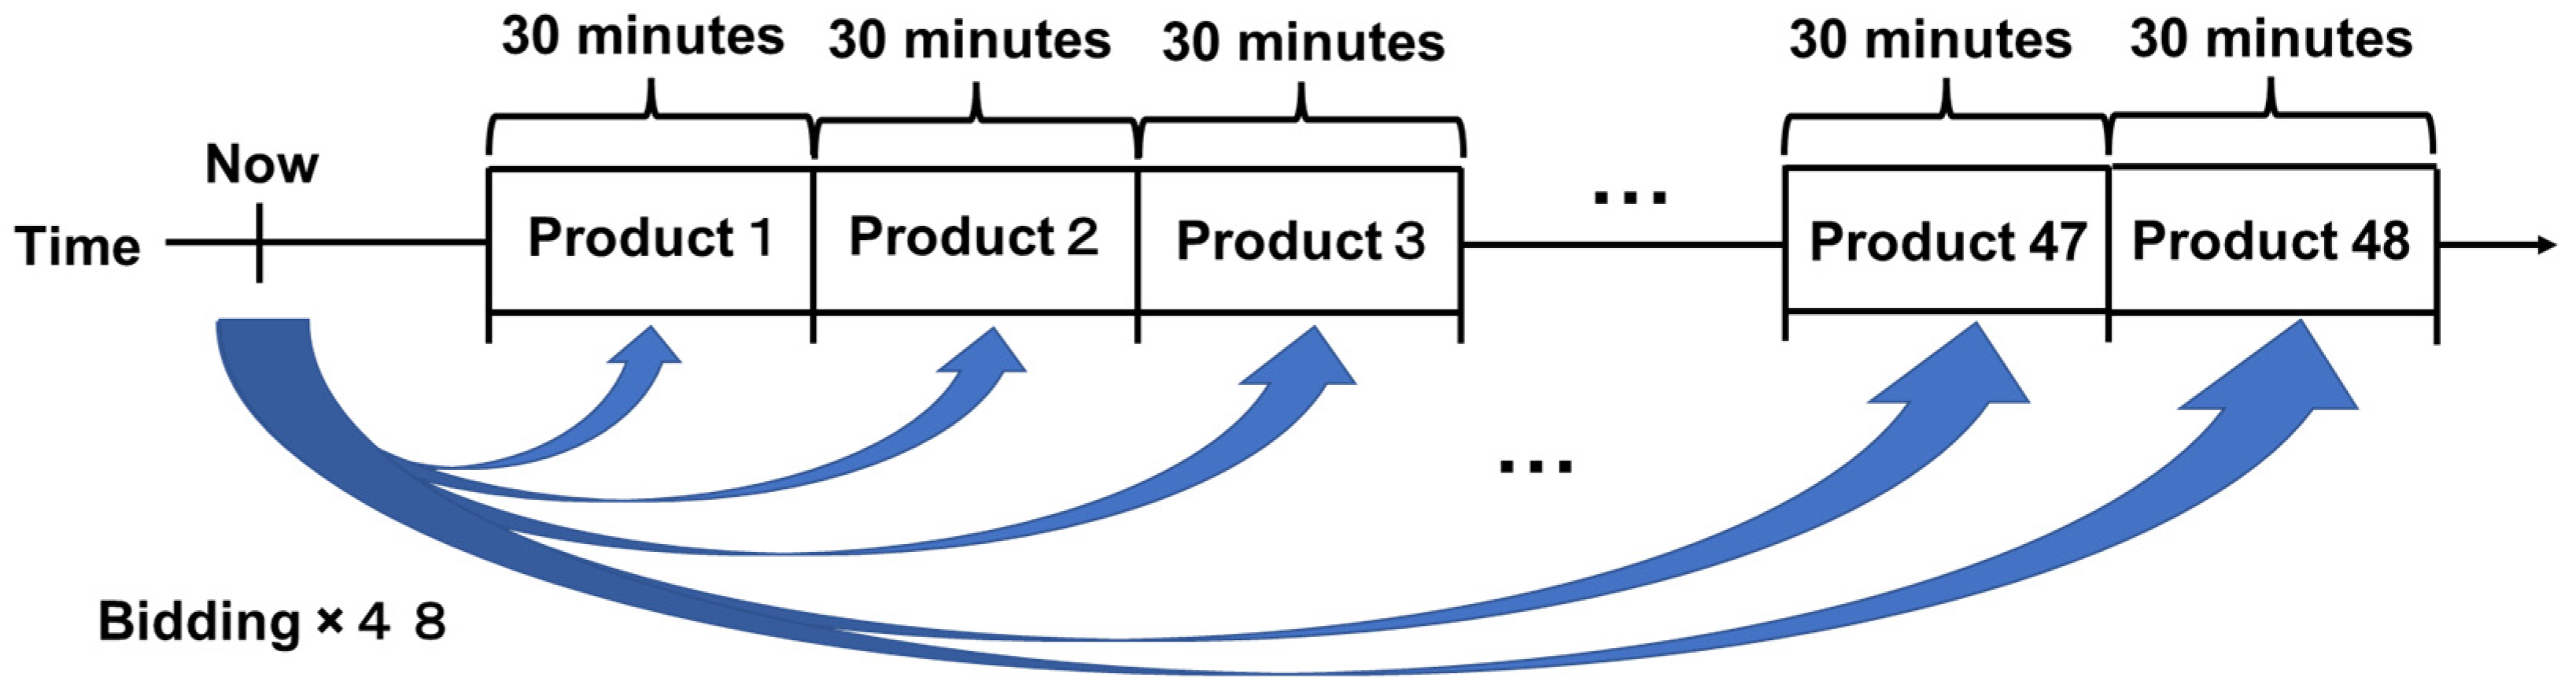
This study is motivated by the results of a P2P electricity trading demonstration project conducted in the Urawa-Misono District, Japan, from August 2019 to March 2020, which was summarized in [18]. Figure 1 shows the system used in the demonstration experiment. The market participants are photovoltaic generators (PVGs), convenience stores (consumers), residences (prosumers), and the power grid agent, which offers electricity at a price of 30 JPY/kWh or higher than that of the wholesale electricity market (JEPX). In the project, each facility with a digital grid controller (DGC) is supposed to submit orders to the market via 3G networks, where DGCs are programmable devices for reading smart meters and scheduling orders. The order schedules for the PVGs and convenience stores are determined based on the forecasted generation and demand, whereas those for the residences are decided by referring to the state-of-charge (SoC) of their battery storage. The selling and buying of orders are executed in the market according to the principle of time and price priority, and all of these activities are automatically processed and registered by the Ethereum-based blockchain ledger using smart contract programs [51,52].
This project was successful in the sense that it proved by quantitatively analyzing transaction data that both the selling and buying sides can benefit from trading in the P2P market. The project also showed that holding storage batteries enables owners to make advantageous contracts. However, some challenges that need to be addressed to implement the P2P electricity market in real society have also been identified. One of these potential problems is low market liquidity and the subsequent high price volatility. The proof-of-concept demonstration project in Urawa-Misono often denotes this tendency in the automatically collected data. Figure 2 shows the execution price trend for a 30-min electricity delivery period and illustrates that the electricity price sharply increases and decreases in the last two hours of the bidding period.
To observe that low liquidity can result in substantial price volatility, we consider an illustrative example of order books for electricity trading shown in Figure 3, in which the left order book has low liquidity, which means that there are few limit orders, and the right order book has high liquidity, with many orders around the current market price of 25 JPY/kWh. If someone attempts to purchase 50 kWh at once as a market order, the market electricity price soars up to 30 JPY/kWh in the low liquidity case; on the other hand, in the right high-liquidity case, all of the 50 kWh power can be procured at the same price of 25 JPY/kWh. Therefore, the difference in liquidity cost, or the cost caused by low liquidity, is 183 JPY. If liquidity costs remain high, as in the left-side case, this would be an obstacle for households and companies to enter the P2P electricity market, which, in turn, would prevent the growth of the renewable energy industry.
To solve this liquidity problem, some stock or commodity exchanges introduce liquidity-supplying market players called “market makers” by specifying market maker programs (see, e.g., [19] for the market maker program introduced by the Japan Exchange Group, Inc.). The market maker role is typically undertaken by financial institutions, and they are supposed to quote both selling and buying orders and accept deals with any other market participants while following predetermined rules, such as volumes and prices. If market makers are introduced into the left-side market in Figure 3, the market environment will become closer to the right side. In this study, we propose bringing this market maker system into the P2P electricity market to enhance liquidity and mitigate extreme price fluctuations.

2.2. Market Rules

In general, the most important rule that must be fulfilled in electricity markets is “balancing”. Balancing means that supply must always be matched with demand at any time interval. In this study, we assume that supply (i.e., power generation) and demand (i.e., electricity consumption) are balanced in every 30-min window. To implement this principle, a day is divided into 48 time slots (see Figure 4), and power sales contracts are traded between a seller and buyer for each 30-min time span. Thus, 48 products can be defined per day, and the market for each product opens 24 h before the start of the 30-min period and closes 10 min before the end of the window; that is, all participants can bid for 24 h and 20 min for each time frame.
Next, we introduce the market rules adopted in our P2P market simulation, which is inspired by the demonstration project stated in the previous subsection and emulates actual electricity markets, such as the Japan Electric Power Exchange:
  • The market for each product is assumed to open 24 h before the start of the 30-min electricity delivery period and close 10 min before the end of the time interval. In other words, the market accepts orders from participants for 24 h and 20 min.
  • Orders in the book are executed in continuous sessions or according to the principle of price and time priority. Specifically, offers with prices lower than those of bids and bids with prices higher than those of offers are executed immediately, whereas other orders remain on the board.
  • If the matched offer and bid volumes are different, the executed amount is adjusted to a smaller value.
  • If multiple orders at the same price exist on the board, the earliest order is prioritized.
In P2P electricity trading markets, there exist several types of market participants: “generators,” who simply sell electricity and do not consume it, “consumers,” who only buy electricity and do no generate it, and “prosumers,” who both generate and consume electricity themselves and offset the surplus or shortage by trading as sellers and buyers. These roles are primarily played by ordinary households and corporations. As they are not professional traders, the quantity and price of their orders cannot be determined manually. Instead, these numbers are automatically calculated based on power generation, demand data, contract history, and so on. Once bidding information is set, it is submitted to the market.
In addition, we introduce “market makers” as additional liquidity-supplying players. They themselves do not generate or consume electricity, but they continue quoting both sell and buy order prices with a specified spread while following regulations set by the market administrator (or a managing organization of an exchange). Market makers are usually introduced into a market in which investors do not need to hold real assets, such as stock markets, because they ultimately close their positions and make profits through the price spread mentioned above. However, in the P2P electricity market, participants must deliver and receive actual electricity every 30 min. Therefore, to apply this system to the P2P market, we assume that market makers own storage batteries to carry surplus electricity to the later product periods on the same or the next day.
In addition, agents can bid on up to 48 products at every bidding turn, as shown in Figure 5. Moreover, in this simulation, all orders are formally sent to the market as a limit order, but when the order matches another at the same time as bidding, it is virtually regarded as a market order.

3. Development of Artificial Market Simulation System

In this section, we explain the basic configuration, information flowchart, and role of each agent in our artificial market simulation.

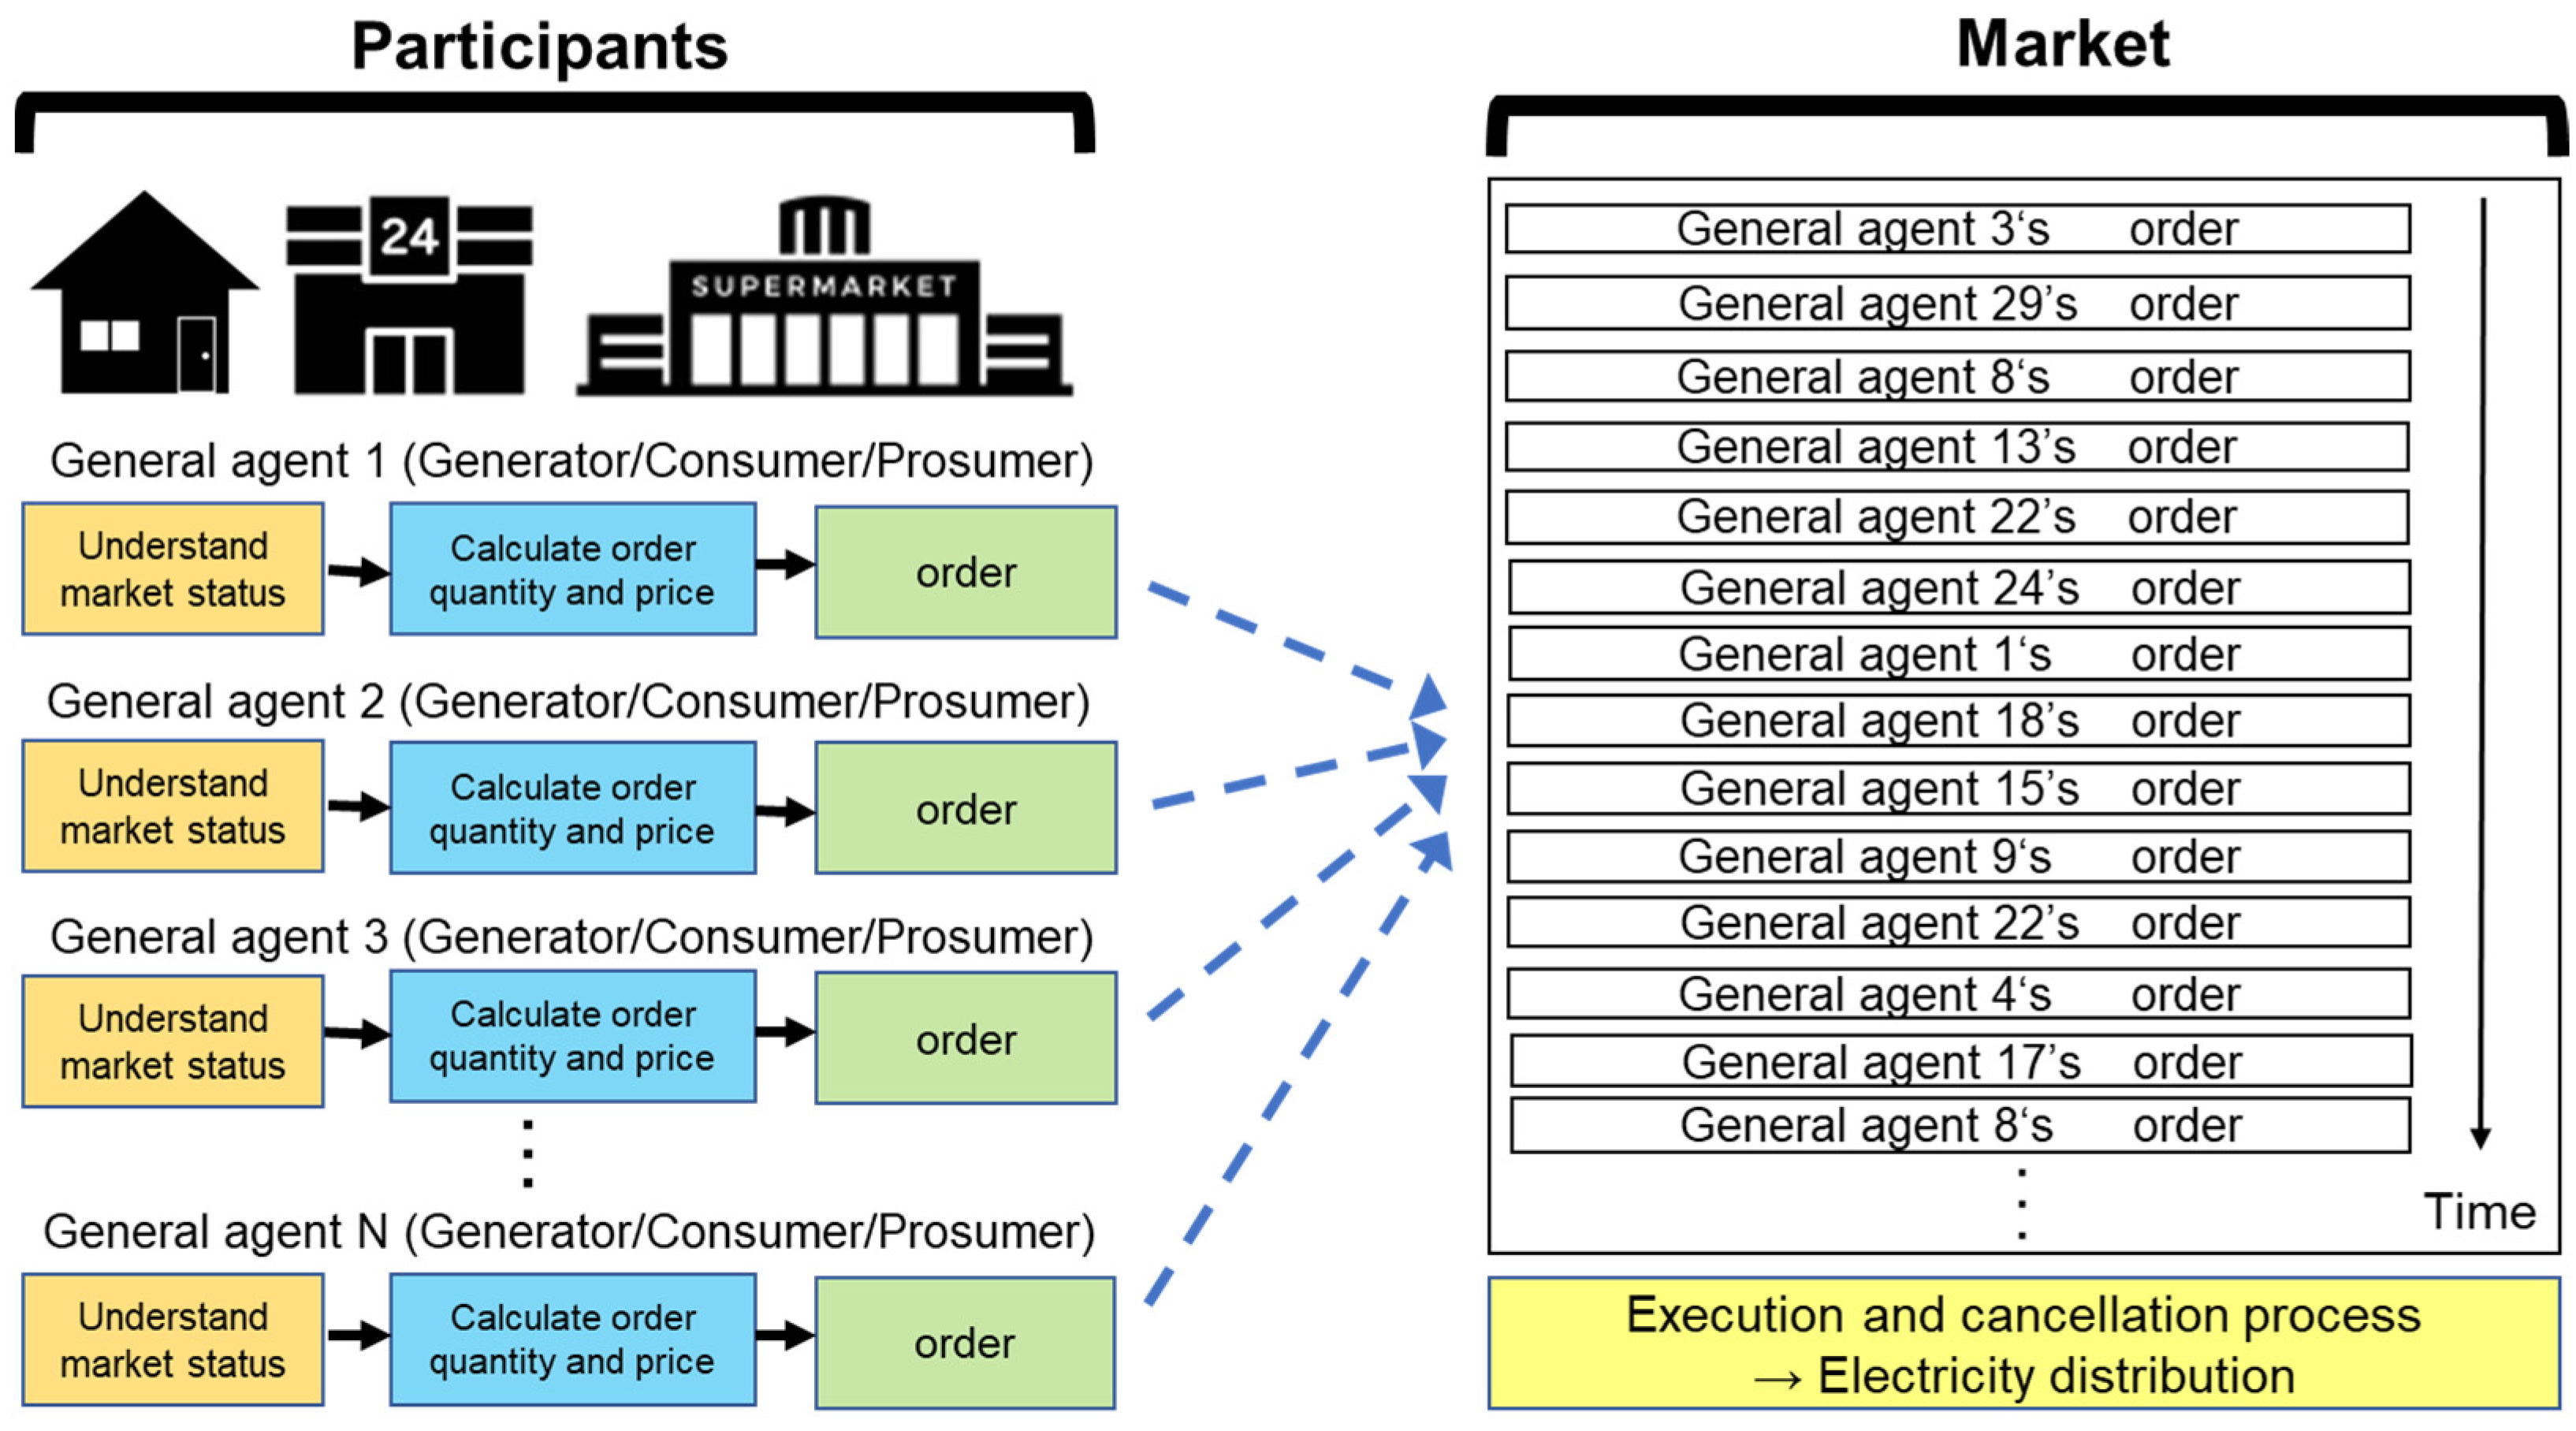
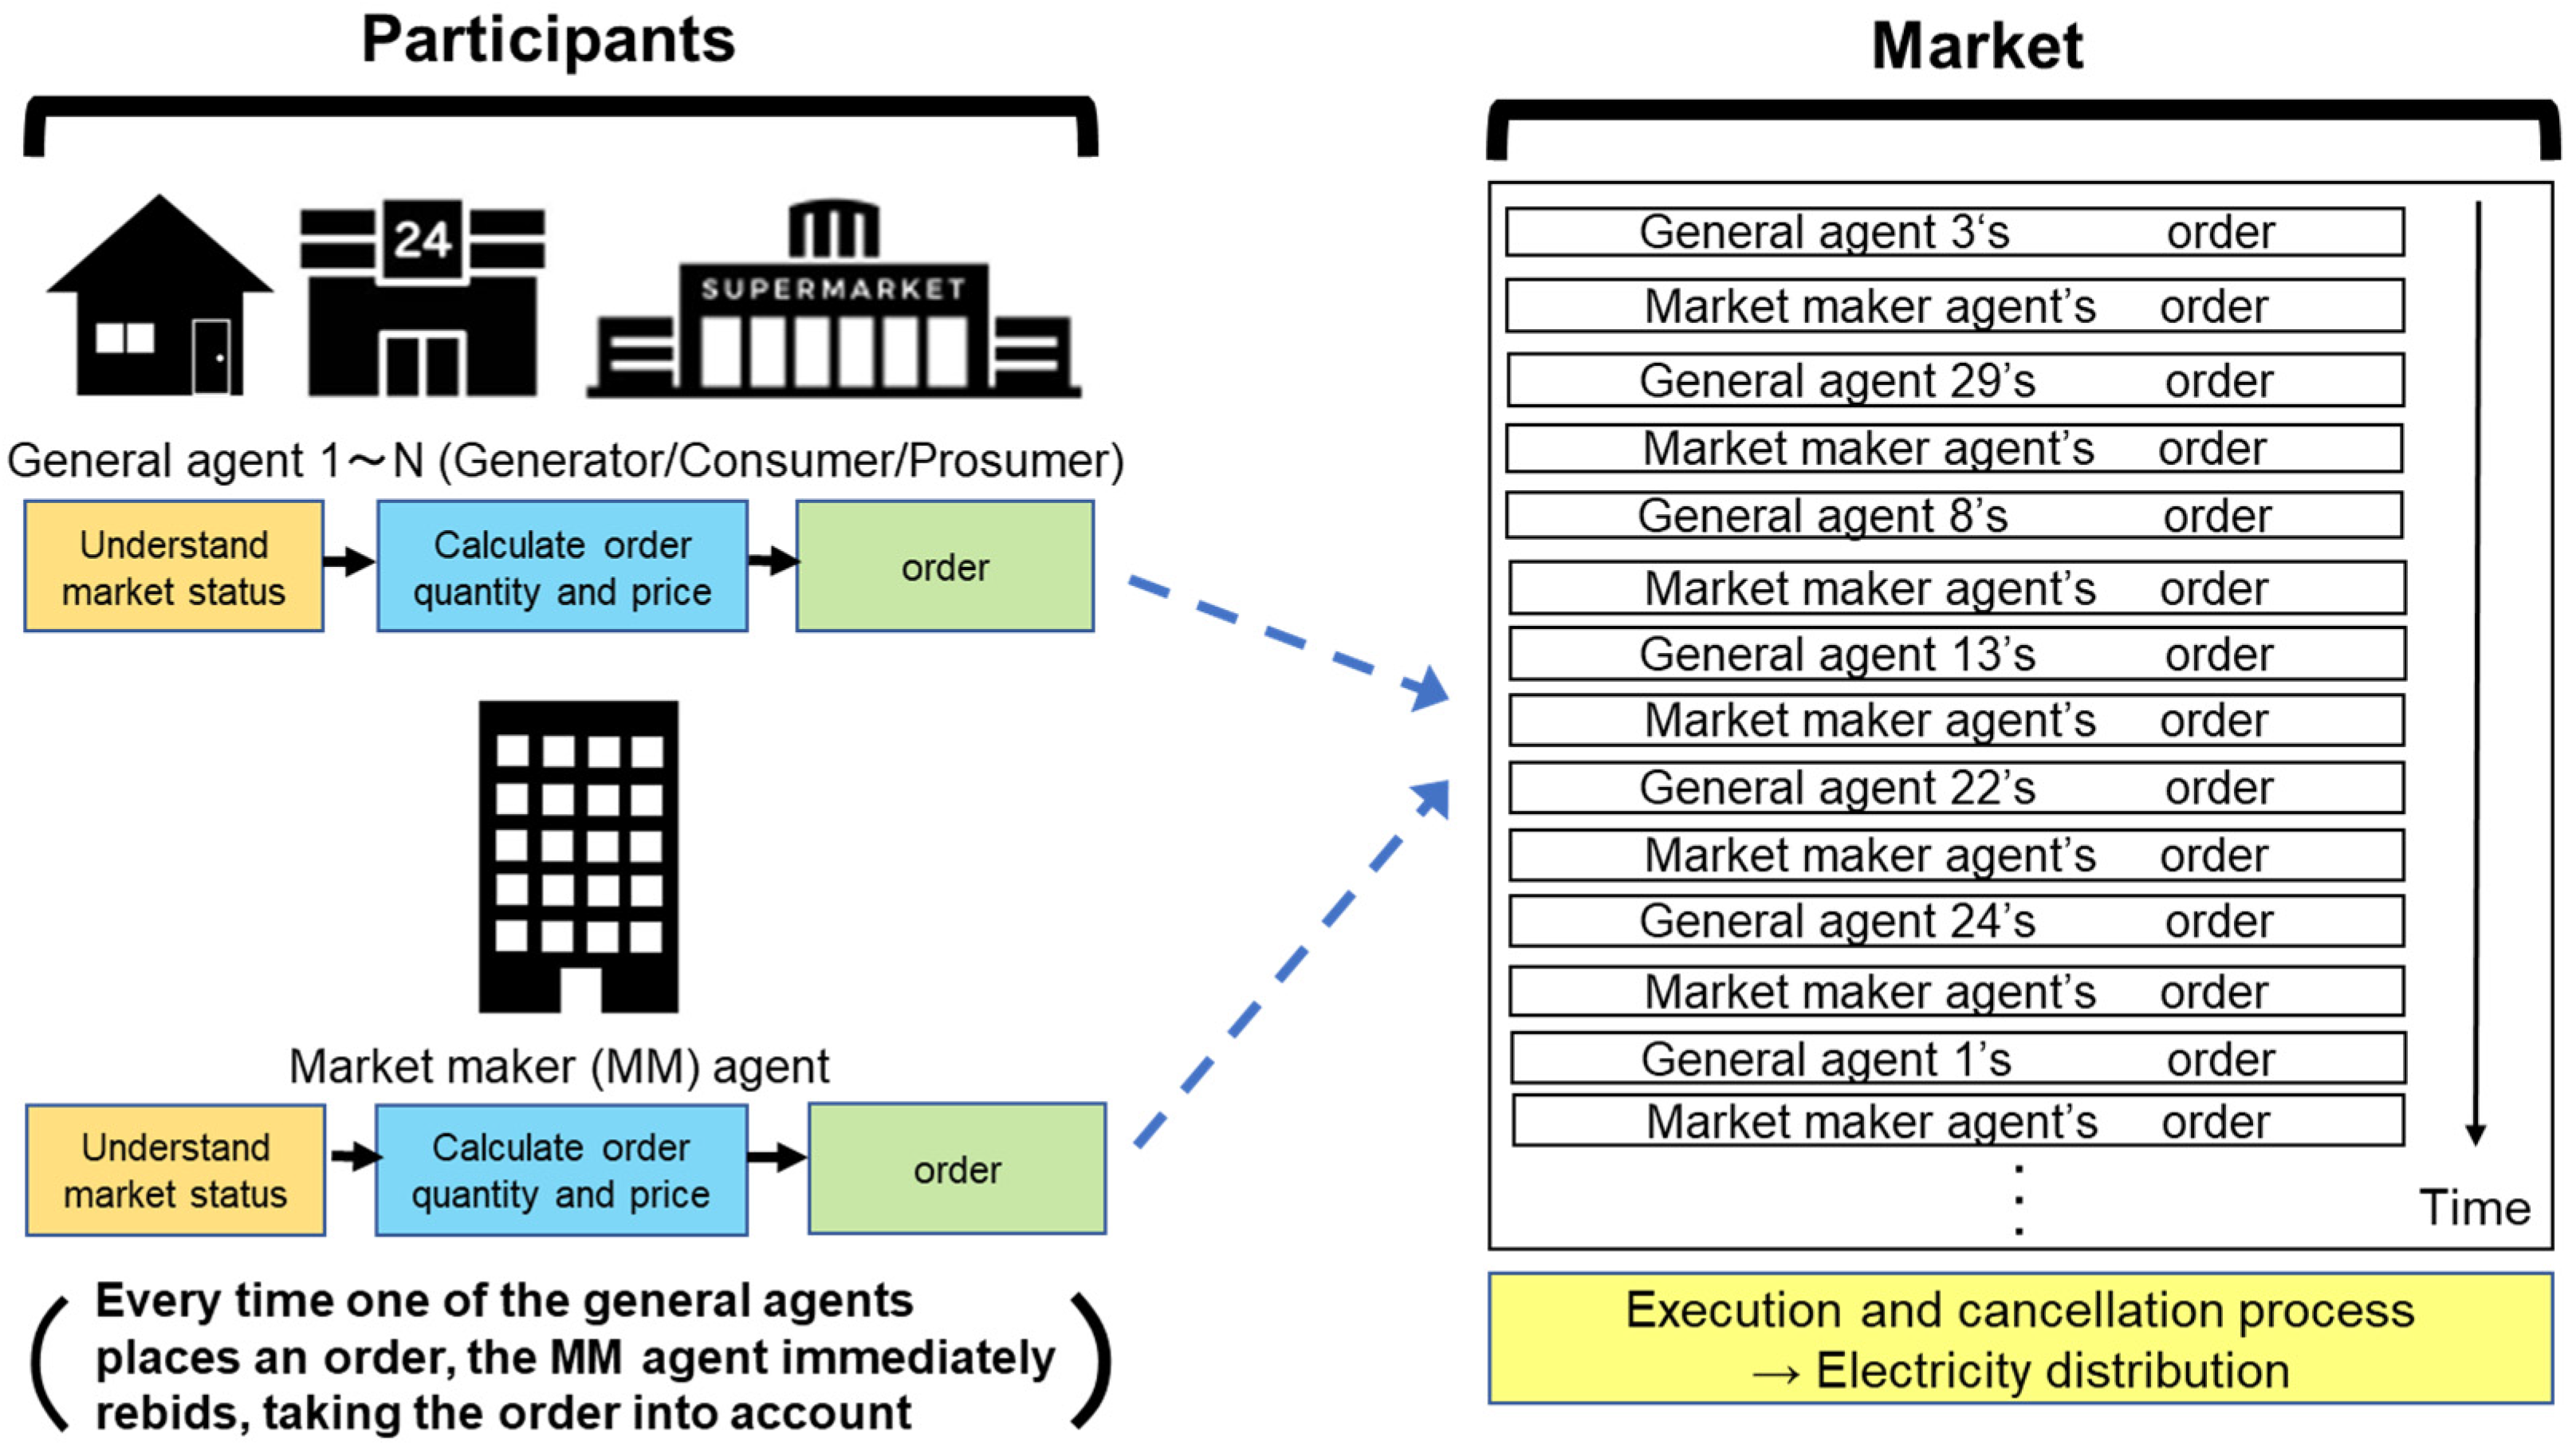
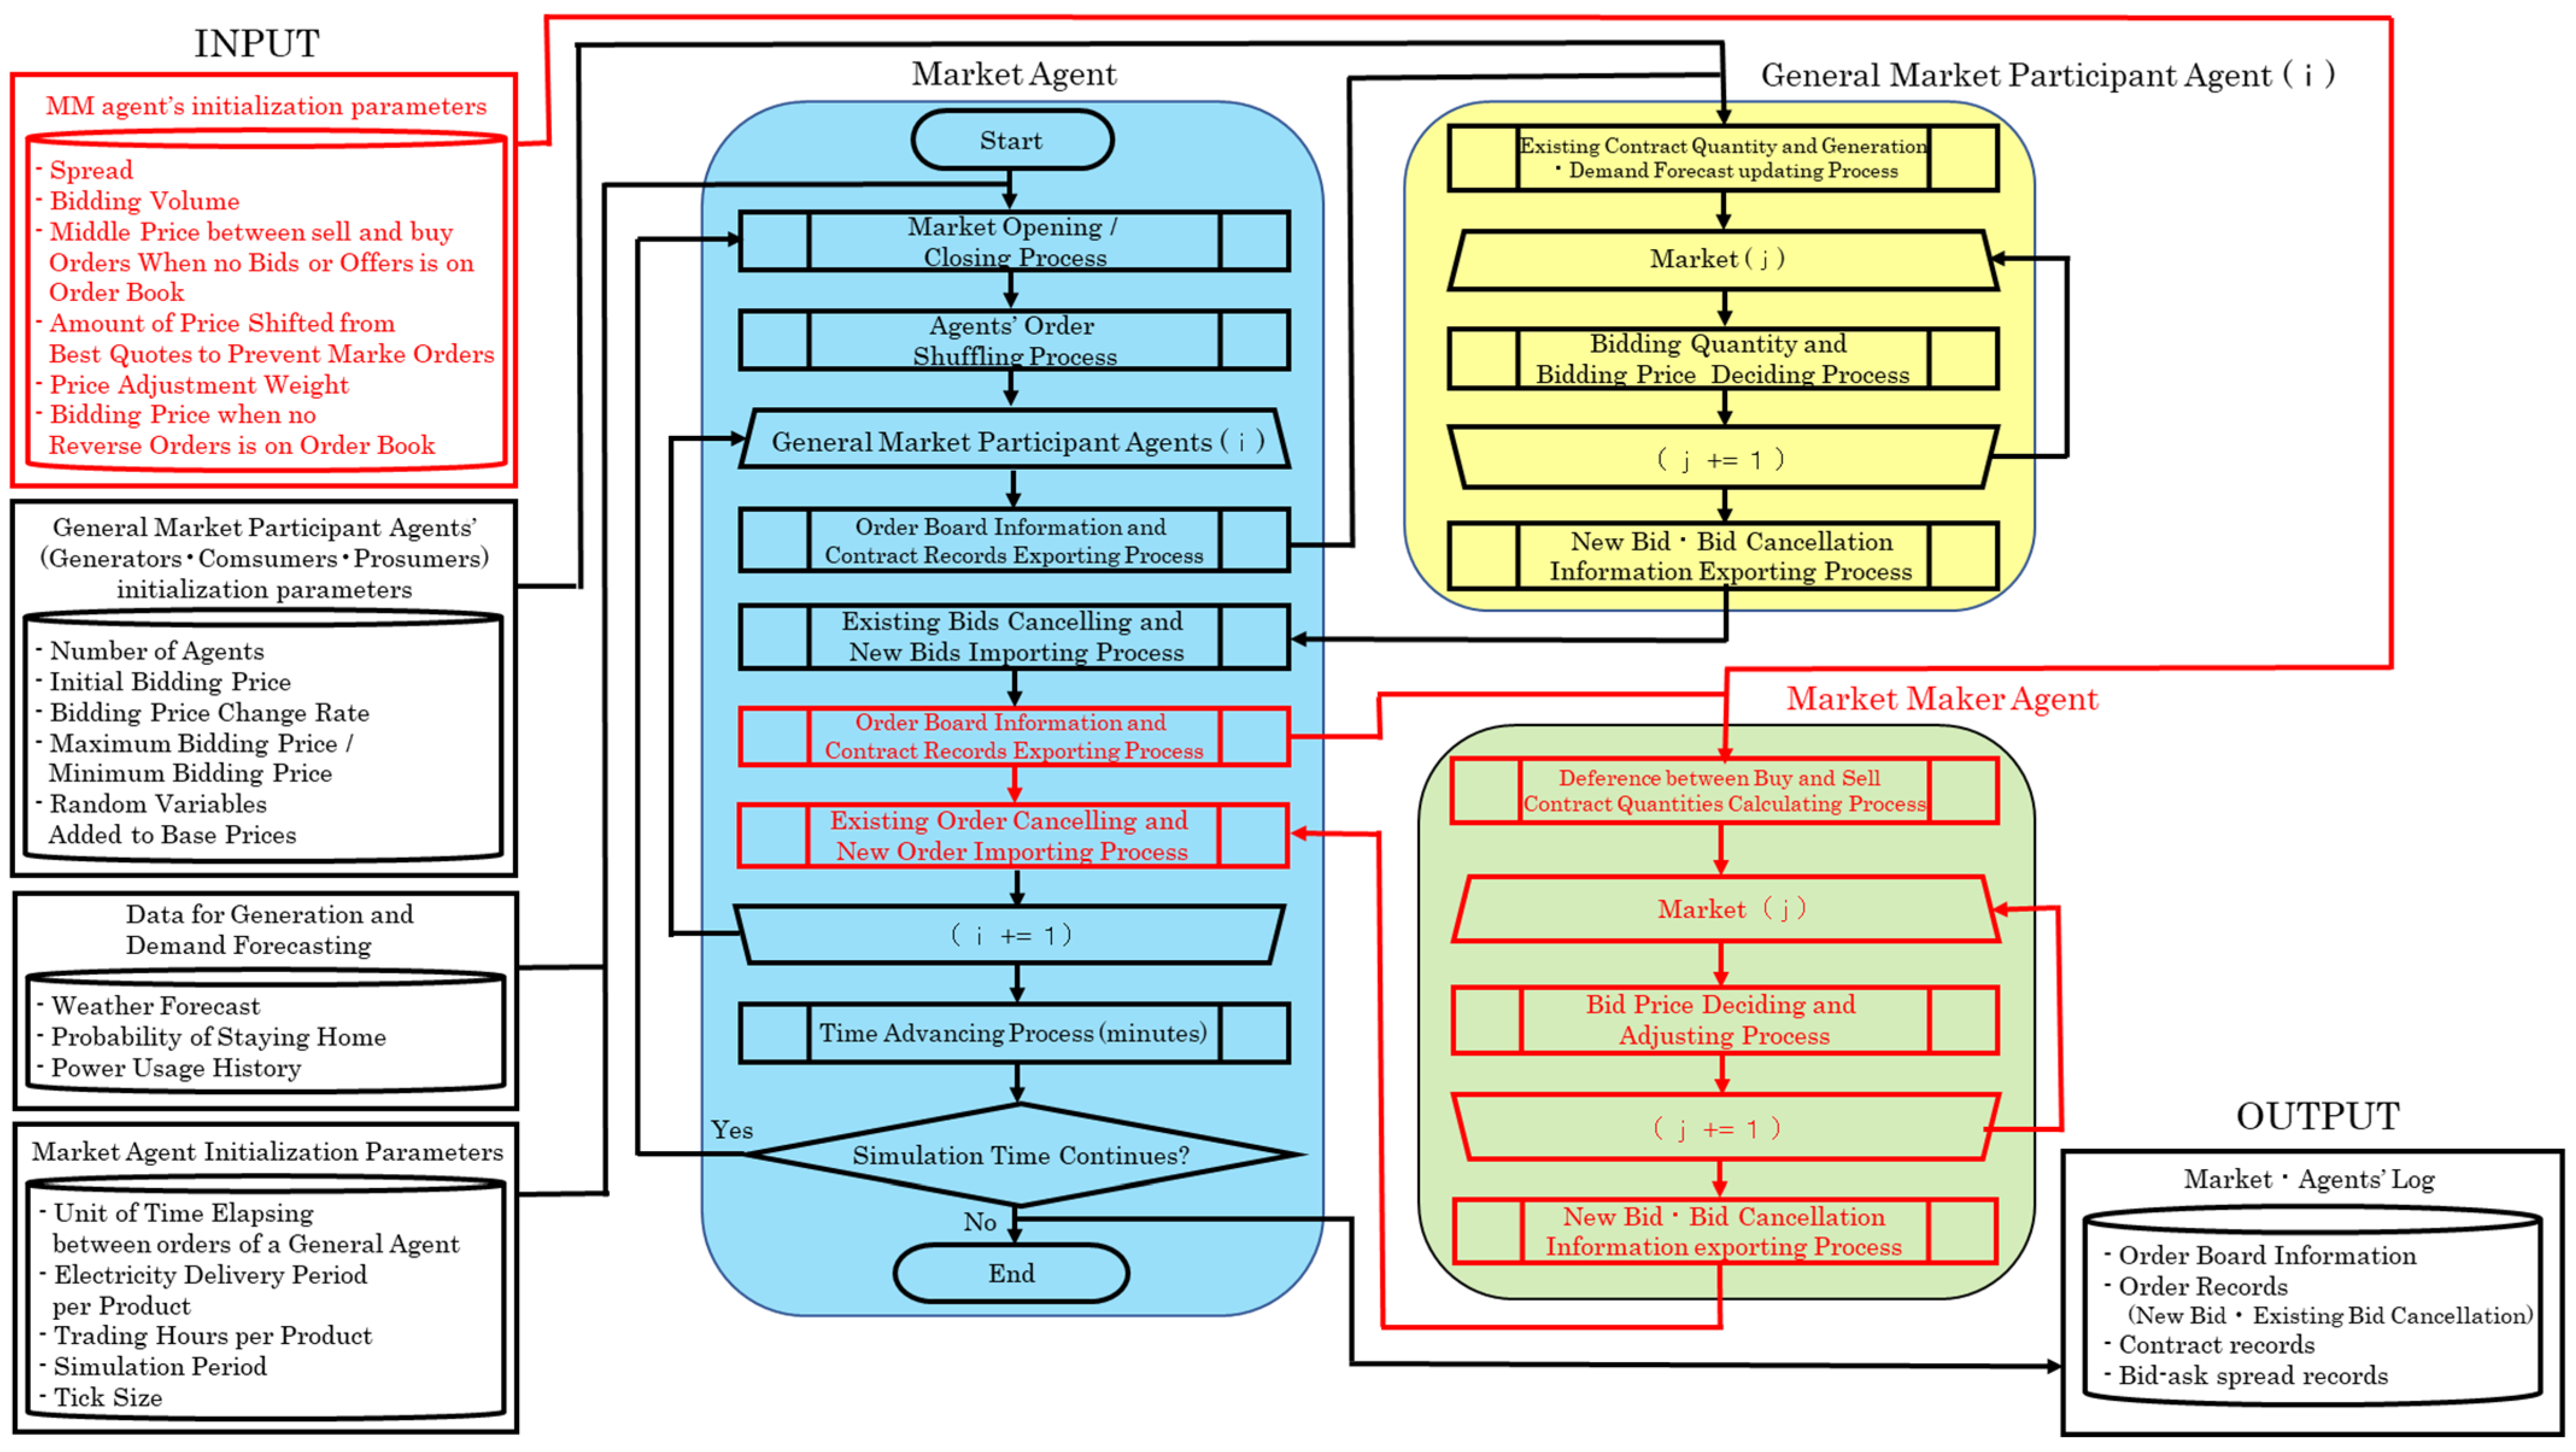
3.1. Basic Configuration and Information Flow

Figure 6 and Figure 7 illustrate the basic configurations and the bidding procedures with and without market makers, including the order of agents’ bids in the simulators. In the case without market makers shown in Figure 6, its components can be divided into two categories. The first is the “market agent”, in which orders are collected and executed. The second are the “participant agents”, which automatically determine order quantities and prices and send orders to the market agent. We design both the market agent and the participant agents and construct P2P power market simulators that perform power bidding and contract processing. In the simulation, time proceeds by 10 min, and each general agent (or supply and demand agent) updates its order once every 10 min (per product) in random order, one after another.
In addition, the configuration of the simulators after the introduction of market maker agents is shown in Figure 7. In this case, general agents place their orders once every 10 min (per a product) just as the case described above, and every time one of the general agents bids, the market maker agent immediately cancels their unfilled previous orders and rebids limit orders with reference to the latest board status. This is because actual market makers update their order prices at high speed while continuously referring to limit orders in the market and conducting high-frequency trading.
In this paper, we introduce two types of market maker agents, namely the simple market maker and the flexible market maker, focusing on profitability improvement. Then we compare several simulation results with and without the market maker agents and examine their impact on the market as well as their profitability. The market maker agents are explained in detail in later subsections.
Figure 8 shows the information flowchart of this simulation. This design concept is based on the artificial market simulator constructed by Waseda and Tanaka [53], in which all agents repeat the process of determining and placing orders for all products available at each point in time. The final output of the simulation includes the final order board status, the order record, the execution record, and the bid/ask spread record during the entire simulation period.
The blue portion, called the “market agent” in the simulation diagram below, plays a role in market management. It opens and closes markets for all products and accepts and processes orders following the market rules described in Section 2. The main functions of the market agent are as follows:
Function (1): Update the time in the simulation and open/close markets.
Function (2): Shuffle the bidding order of general agents as time proceeds to ensure fairness among them.
Function (3): Send market information, such as order data and contract records to each general agent.
Function (4): Receive orders from general agents, perform contract processing sequentially, and write the results on the order board, order record, contract record, etc.
Next, we describe the general (market participant) agents shown in yellow in Figure 8 which reflect the actual demand and supply data. These agents may be referred to as “generators”, “consumers”, or “prosumers. Their main functions are as follows:
Function (1): Each agent must estimate its photovoltaic (PV) power generation or electricity consumption from the weather forecast data and/or past power consumption history.
Function (2): Determine the order quantity and price for each product by considering the contract record and the elapsed time from the market opening received from the market agent.
Function (3): Update order information and send it to the market agent.
Note that information types and values used as initial parameters may be different according to agent types (i.e., generator, consumer, or prosumer) and preferences (i.e., price-oriented type, moderate type, or certainty-oriented type). This reflects the diverse needs of general market participants. In addition, regarding Function (3), each agent is programmed to cancel the unfilled previous bids and renew their orders at every turn. Appendix A provides a detailed explanation of the bidding strategies of general agents.
Finally, we explain the market maker agent shown in the green portion in Figure 8. Generally, market makers provide liquidity to markets by continuously placing both sell and buy orders while complying with various rules set by market administrators. As a result, liquidity costs are kept lower even when a large order is placed at once. Due to reduced risk, investors would be able to enter the P2P market more easily, resulting in increased trading volume and further market development. As this research focuses on how liquidity and price stability improve when market makers are introduced, we have to compare them before and after the introduction of market makers. For this reason, the strategies of general agents are kept unchanged in all cases. However, in reality, it is quite possible that the existence of market makers influences the bidding strategies of general agents. Therefore, the development of reactive bidding strategies of general agents towards the introduction of market makers could be research topics in future studies. In this paper, we first introduce the bidding strategy of the simple market maker and then describe that of the flexible market maker.

3.2. Market Maker’s Bidding Strategies

3.2.1. Bidding Strategy of the Simple Market Maker

Recall that the original objective of introducing a market maker is to enhance liquidity and stabilize electricity prices. This may be achieved by adopting the simple market maker outlined below (see [49,50] for the introduction of a simple market maker into stock markets). The bidding price determination method, including its assumptions of this market maker, is illustrated in Figure 9 and is described as follows:
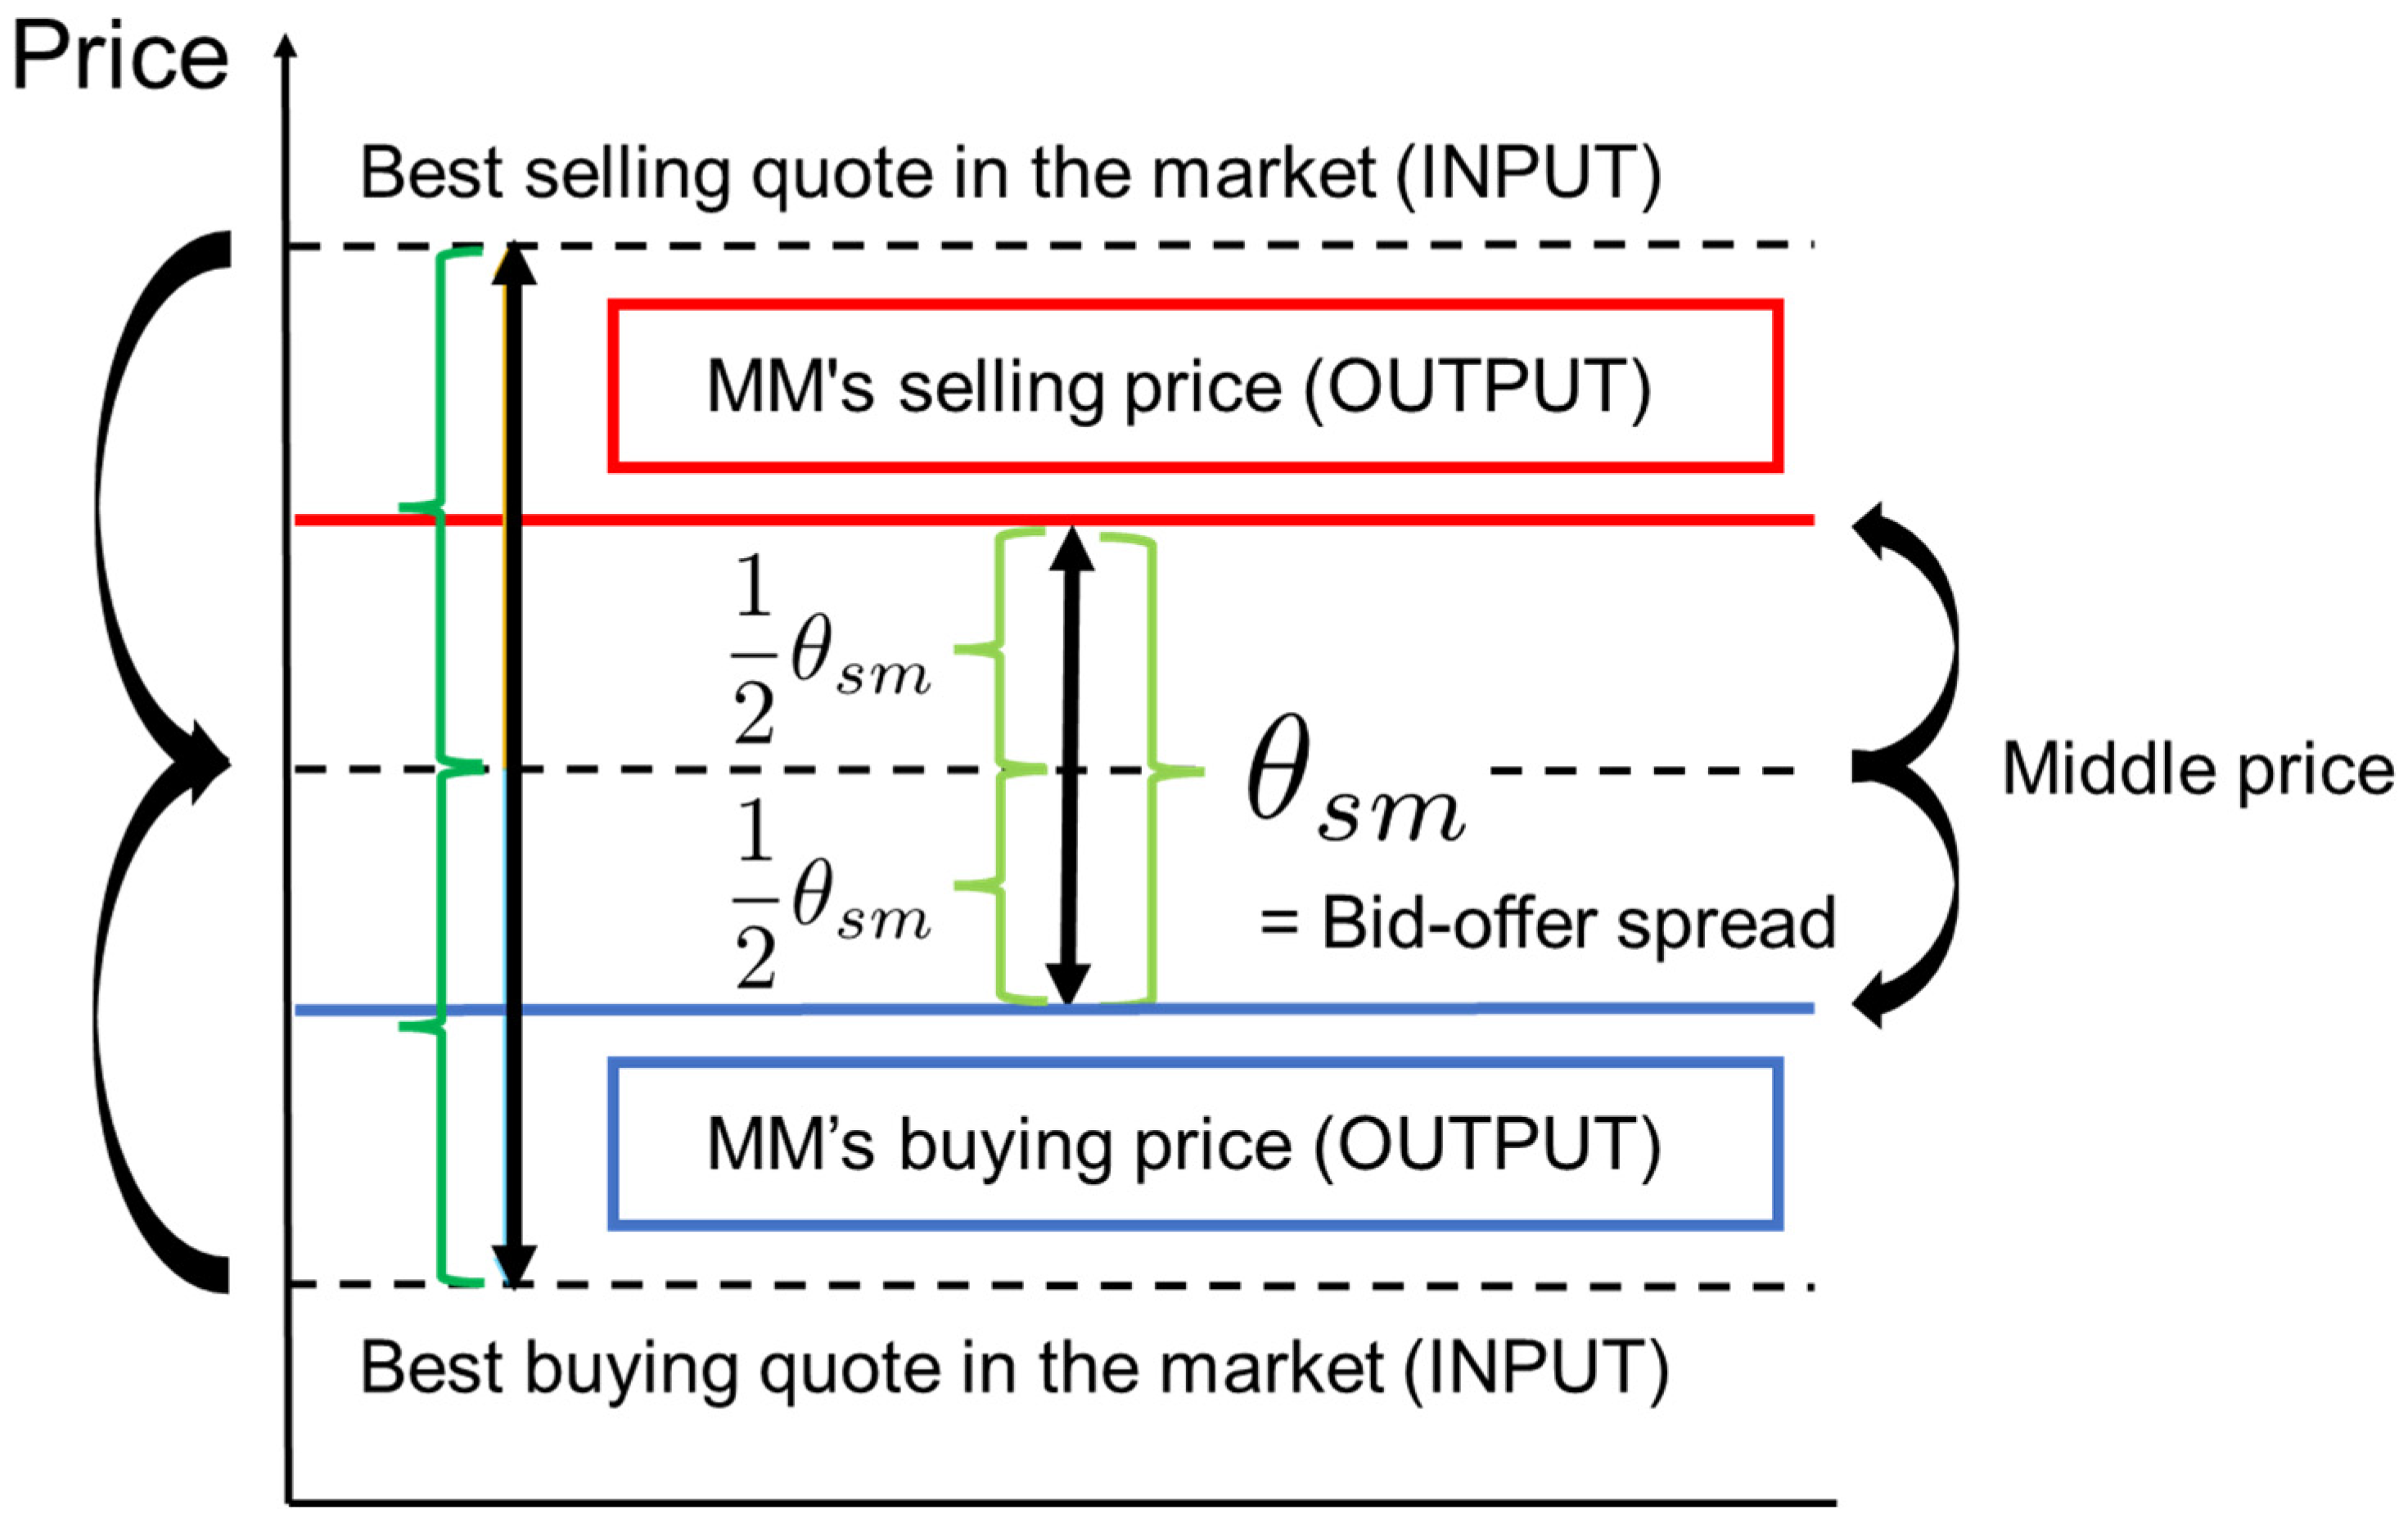
  • The market maker derives the best quotes on the order board in each bidding turn, that is, the lowest selling quote and the highest buying quote. The selling and buying prices are then calculated using the middle price between the two best quotes. More exactly, the selling (buying) price is shifted up (down) by half of the specified spread value, θ s m , from the middle price.
  • If either or both sell/buy orders do not exist on the board of the market, the middle price cannot be determined. Therefore, in this case, we assume that the middle price is given a priori as an initial parameter. Specifically, we set the initial setting parameter at 25 JPY/kWh in our simulation, which is the mean value of the upper limit price of 50 JPY/kWh and the lower limit price of 0 JPY/kWh.
  • In addition, since market makers are supposed to keep quoting both sell and buy prices, they are programmed to always place a limit order, not a market order, in this simulation. Therefore, in case the bidding price of our strategies may result in a market order, it is shifted up or down such that it becomes a limit order.
  • That is, sell and buy prices are adjusted in the same direction by the same amount so that the spread is kept constant at the value of an initial parameter in this case as well.
Note that the simple market maker determines buying and selling order prices based on the middle price and a specified spread size θ s m as “middle price ±   θ s m / 2 ”. If a bid (buy order) and an offer (sell order) are executed in equal quantity, the margin between the two prices, given by θ s m , becomes a source of profits for the simple market maker.

3.2.2. Bidding Strategy of the Flexible Market Maker

As mentioned at the end of the previous subsection, a market maker can profit from the difference between selling and buying prices, whereas there is a risk of loss if the selling and buying executed amounts are unbalanced. For example, if a market maker has a larger sales position than their purchase position, they may need to buy additional electricity at a relatively high price and compensate for the shortage during the delivery period, which is called “imbalance charges” in the system. On the other hand, a larger buying position may also lead to an opportunity loss for the market maker. Hence, market makers always need to maintain their net positions close to zero and try to avoid the position imbalance. This is the reason why we introduce a new bidding price determination algorithm into the flexible market maker, based on price adjustment according to its net position of the moment.
Figure 10 illustrates the bidding algorithm when both buy and sell orders are quoted on the order board. The horizontal axis denotes the net position possessed by the flexible market maker, that is, the total of buying contracts minus that of selling contracts when bidding, and the vertical axis denotes the bidding price of the flexible market maker. The bidding price determination method, including its assumptions, is described as follows:
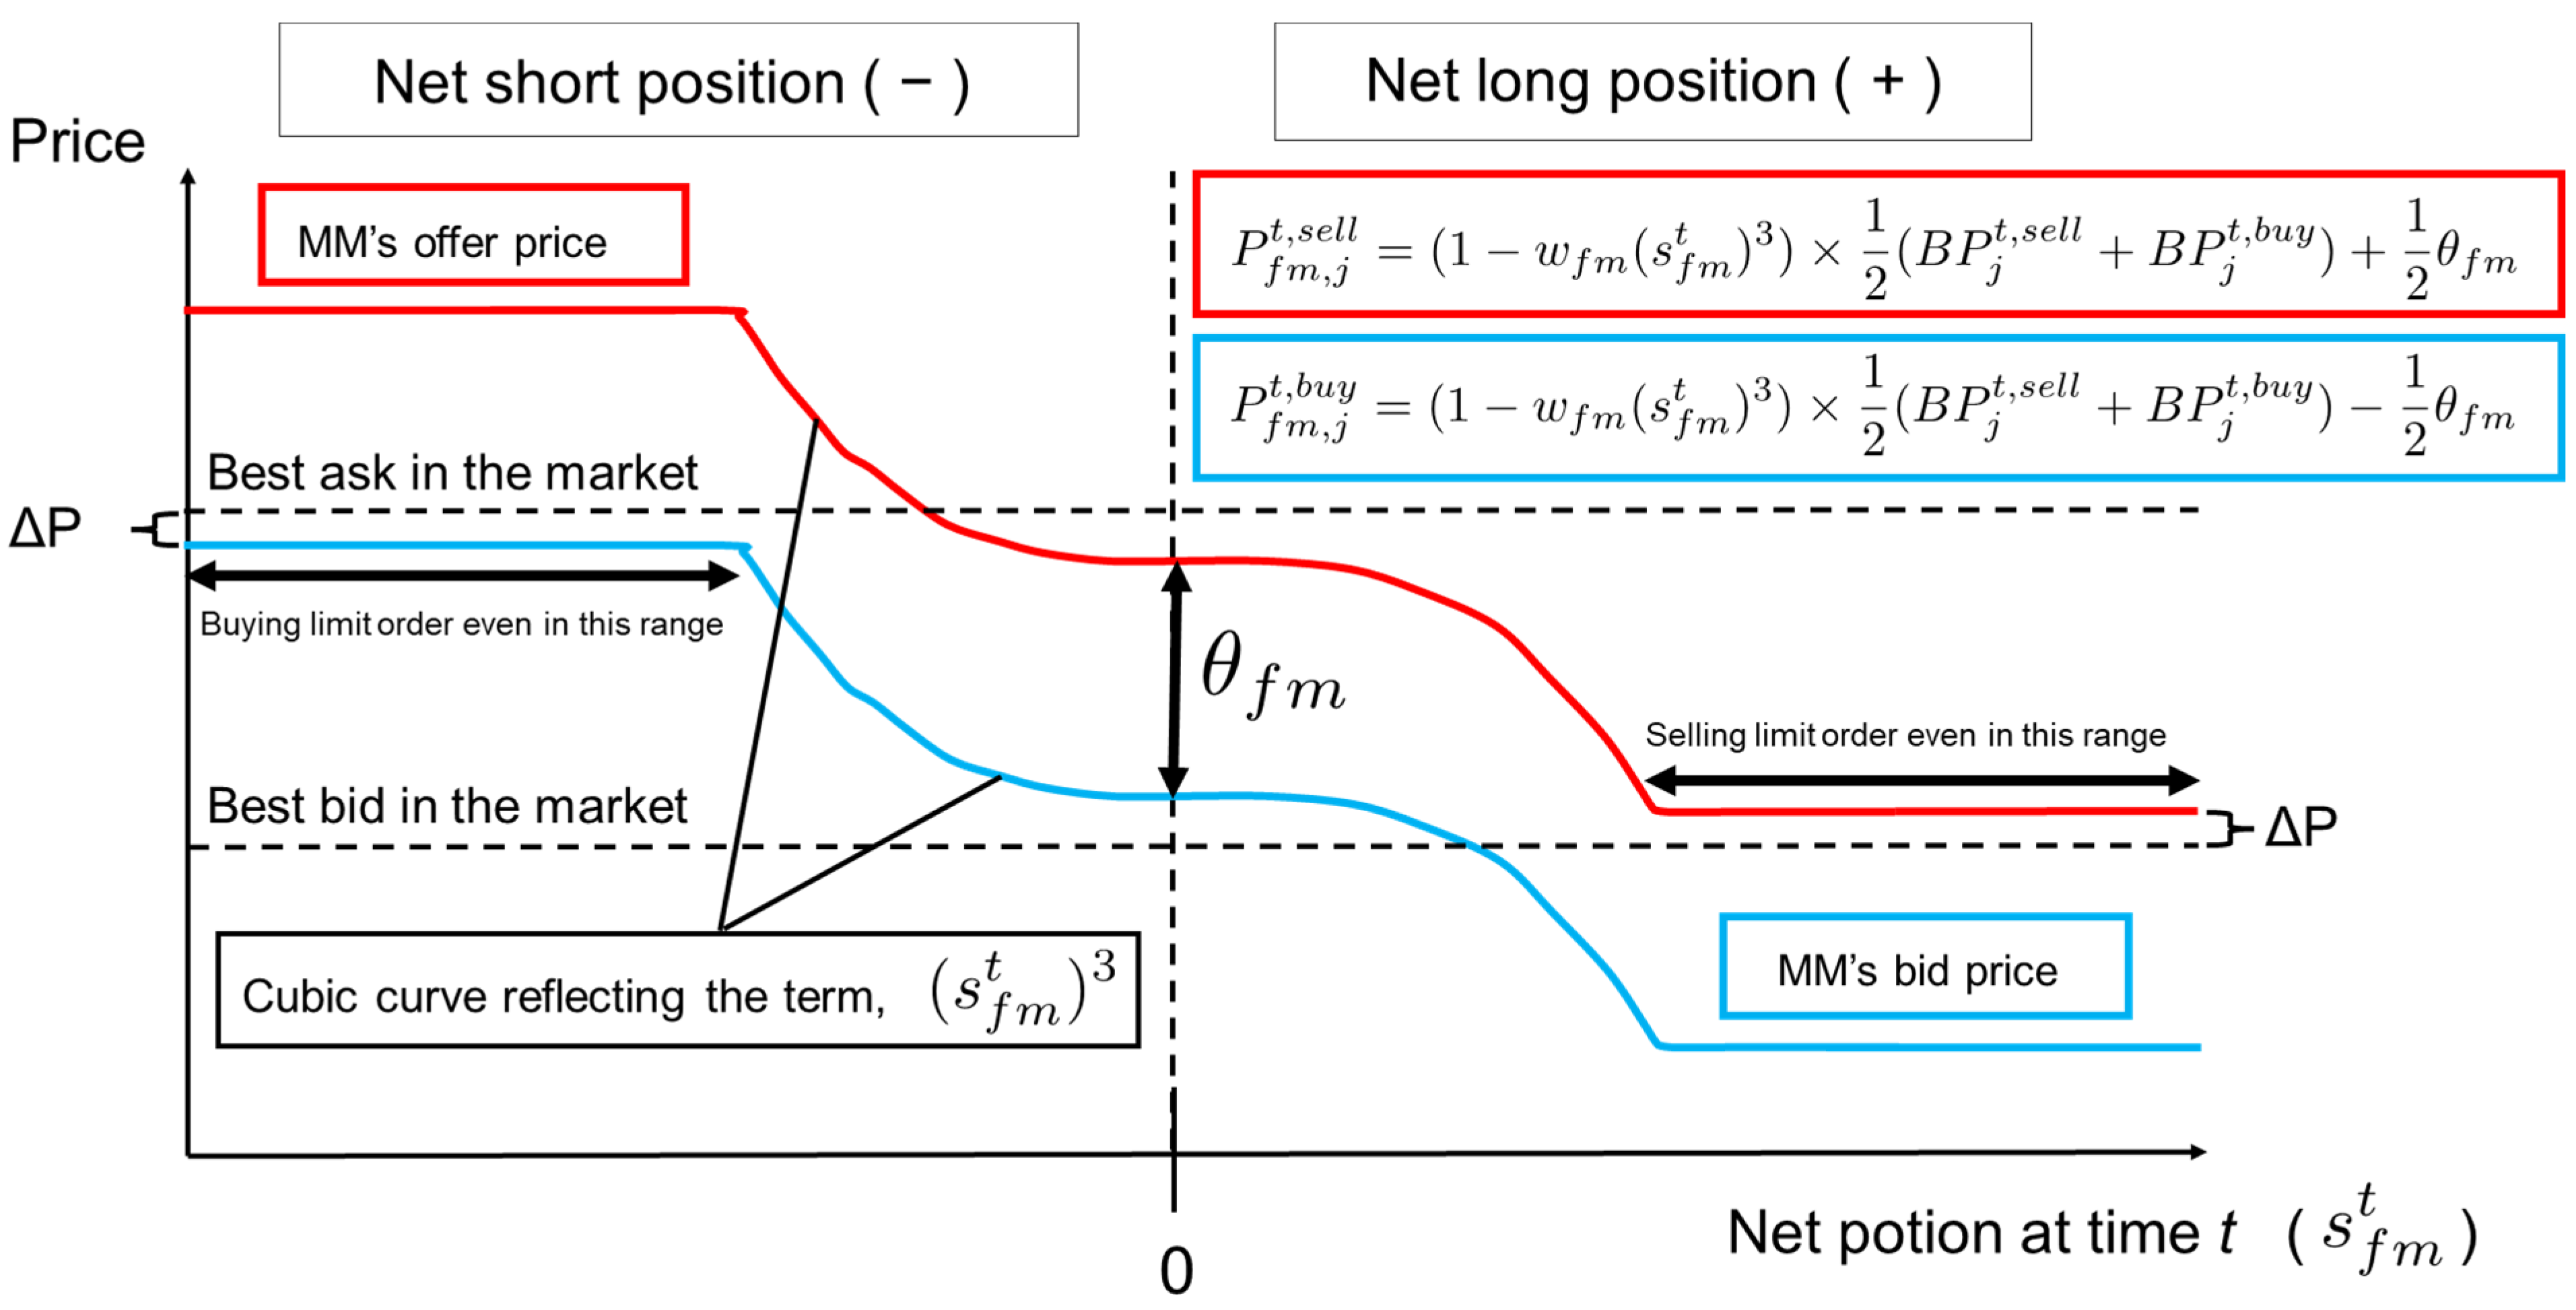
  • The price adjustment is conducted according to the term ( 1 w f m ( s f m t ) 3 ) , where s f m t is the market maker’s net position at time t (i.e., total executed buying volume minus total executed selling volume for all products up to time t ) and w f m is a weighting term. The effect based on the net position is reflected when w f m 0 . For instance, if the selling contract amount is greater than the buying amount, both selling and buying prices are shifted up. When the market maker’s position is net long, both selling and buying prices are shifted down according to the term ( 1 w f m ( s f m t ) 3 ) .
  • If the market maker’s bid price (buying order price), given by the blue line in Figure 10, were shifted beyond the best selling quote on the board, shown by the horizontal dotted line on the upper side, the order would be executed as a market order. To avoid this and make the bidding a limit order, the buying order price will be fixed just below the best selling quote by Δ P . Similarly, the selling order price will be fixed just above the best buying quote to avoid the selling order becoming a market order.
As a result of introducing the price determination strategy in Figure 10, sell orders are less likely and buy orders more likely to be executed, and the market maker’s position may revert to net zero. Note that this strategy is based on the position market-maker strategy described in [49,50]. However, in this paper, we propose a P2P-electricity-market-specialized market maker’s strategy using storage batteries. The P2P electricity market, whose power source is largely PV (photovoltaic) generation in Japan, usually has a supply and demand imbalance both in the daytime (when PV generation is larger than demand) and nighttime (when no PV generation occurs). Therefore, market makers have to bear a high risk of not being able to sell and buy in equal amounts. One of the solutions to this problem is installing storage batteries. They could function as a buffer and transfer electricity generated during daytime hours to nighttime periods. At the same time, market makers could avoid imbalance charges by evening up sales and purchase amounts across electricity delivery time intervals. However, storage batteries are still expensive, and the costs could be a heavy burden on market makers.
Considering the above discussions, this study adds the following assumptions for market makers to introduce storage batteries:
  • To incentivize market makers, we assume that market makers may place an order at a favorable price when there is no other selling or buying order on the board. For example, when no other selling orders exist, which often happens at night or in the early morning with no solar power generation, the market maker can make a sell order at a relatively high price (e.g., 33 JPY/kWh in our simulation) because the market maker is the sole seller in the entire market.
  • For the opposite-side order, a buy order in this case, the market maker is assumed to use the same price as the previous bidding, P f m , j t 1 , b u y . On the other hand, with no other buying orders, the market maker places a buy order at a relatively low price (e.g., 17 JPY/kWh in our simulation) while using the same selling price as the previous bidding, P f m , j t 1 , s e l l . In either case, the spread between the selling and buying prices may become wider than θ f m .
  • When calculating s f m t in Figure 10, the executed volume at the above two particular prices, i.e., the selling amount at the price of 33 JPY/kWh and the buying amount at 17 JPY/kWh, is excluded to avoid the effects of the extreme imbalances during these periods.

4. Artificial Market Simulation Using Supply and Demand Data

In this section, we demonstrate the artificial market simulation using actual solar PV generation and consumption data. The entire simulation was performed in a Python environment.

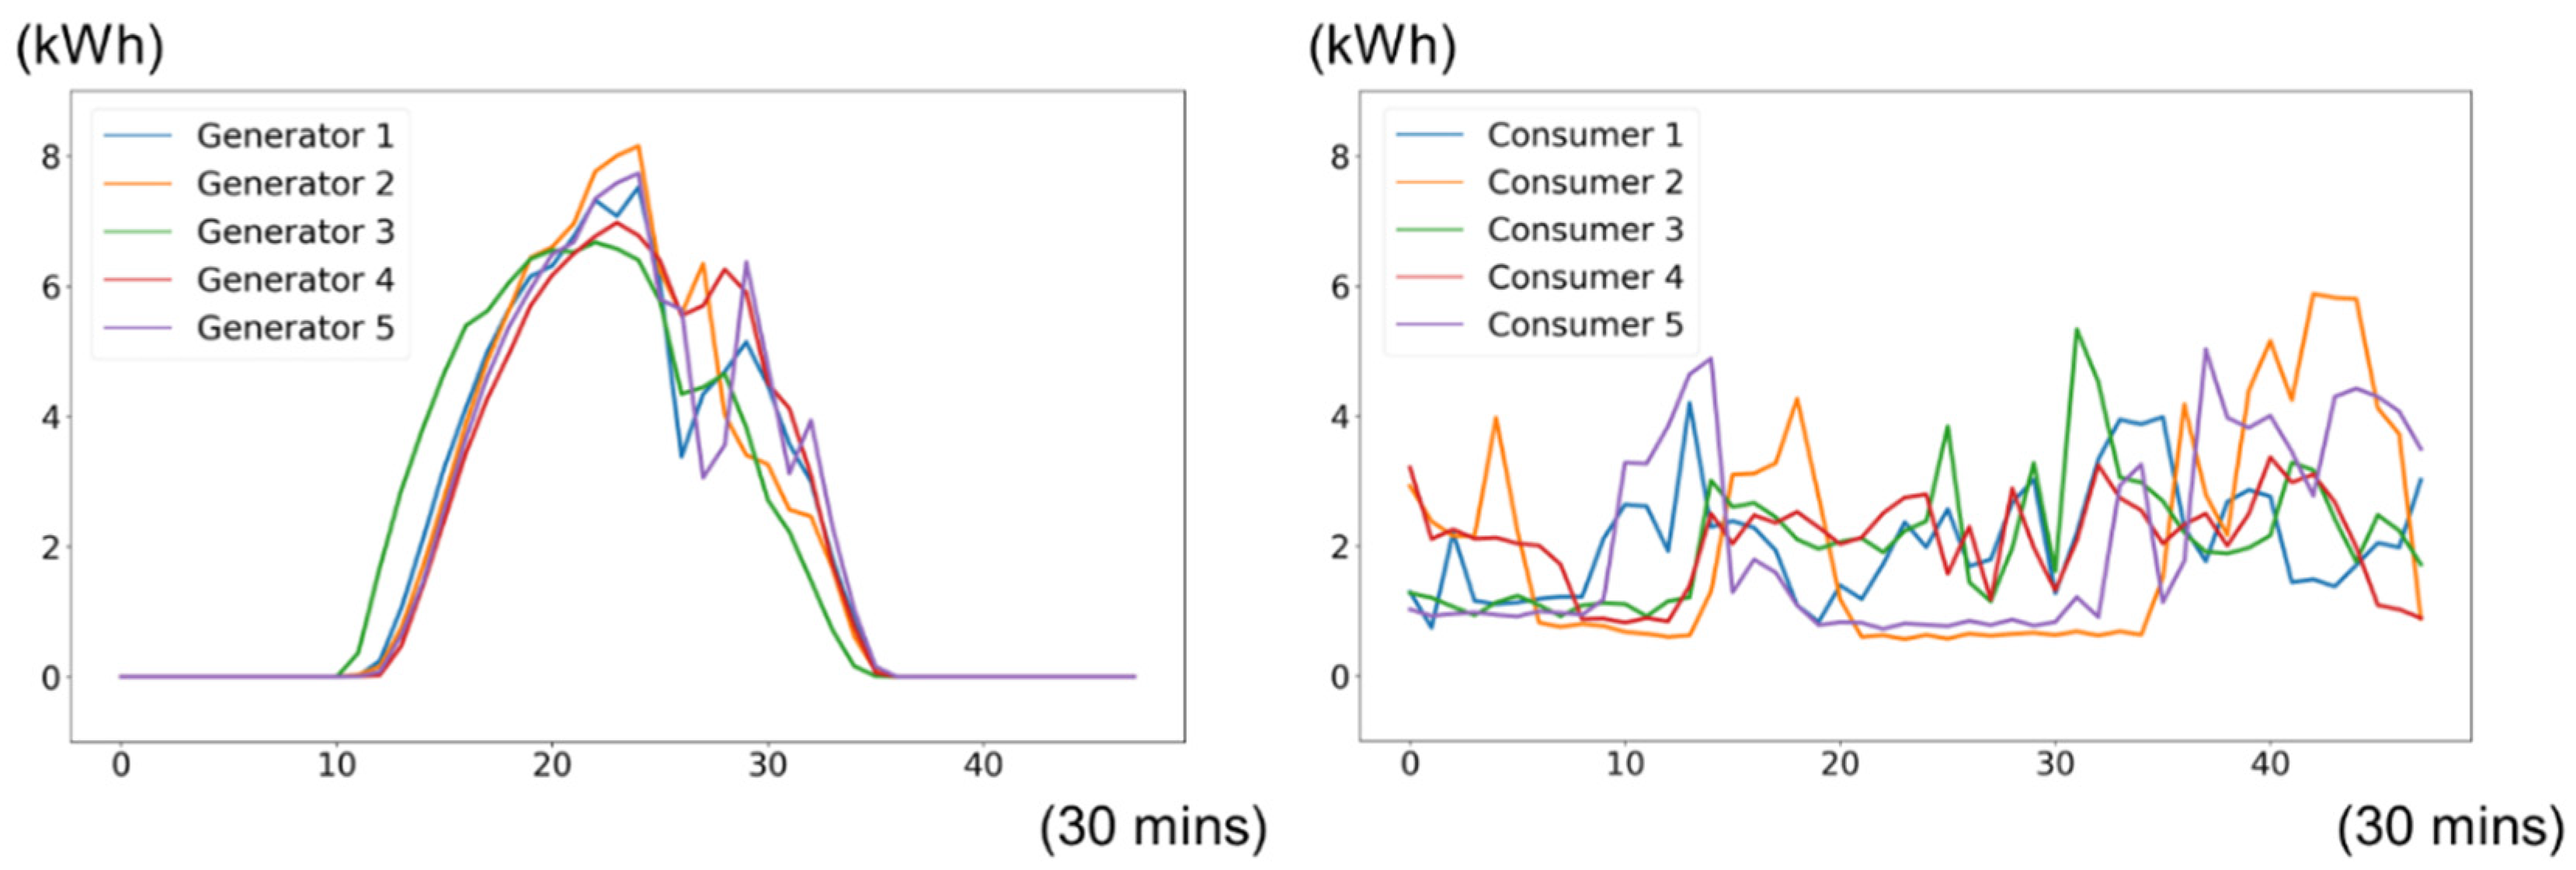
4.1. Supply and Demand Data

The supply and demand data used in this study are the solar PV generation log and the power consumption log of five residential households for one day (24 h), related to the demonstration project explained in Section 2 (see Table 1 below for the description of the data). From this dataset, both or either of the two types of logs is randomly assigned to each agent (a generator, consumer, or prosumer agent). Note that these agents are originally supposed to keep predicting their generation or consumption amount (or both of them) while the market is open. However, the main focus of this study is to confirm the effectiveness of the market-maker system, and thus, we assumed that the agents’ predictions are given by the same values as the actual observations, for simplicity.
Here, there are two important points to note. First, we normalized the total daily power generation and consumption per household to 100 kWh. In addition, because the power supply-demand ratio greatly affects the profitability of the market maker, we prepared four patterns of the ratio to test this effect (see Section 5).
The second point concerns pre-processing of the data. In the simulation, the 30-min value, which is the time interval of electricity delivery for a product, is required, although the original data consisted of 5-min values of power generation and demand. Therefore, the original data were appropriately adjusted to meet the specifications. Figure 11 shows the PV generation and consumption of five households which are converted to 30-min values and adjusted to a total of 100 kWh.
In this study, P2P electricity market simulations are conducted for the following three scenarios:
Case 1.
P2P market simulation without market makers.
Case 2.
P2P market simulation with the simple market maker that focuses only on market liquidity and electricity price stability.
Case 3.
P2P market simulation with the flexible market maker that considers its profitability, not only market liquidity and electricity price stability.

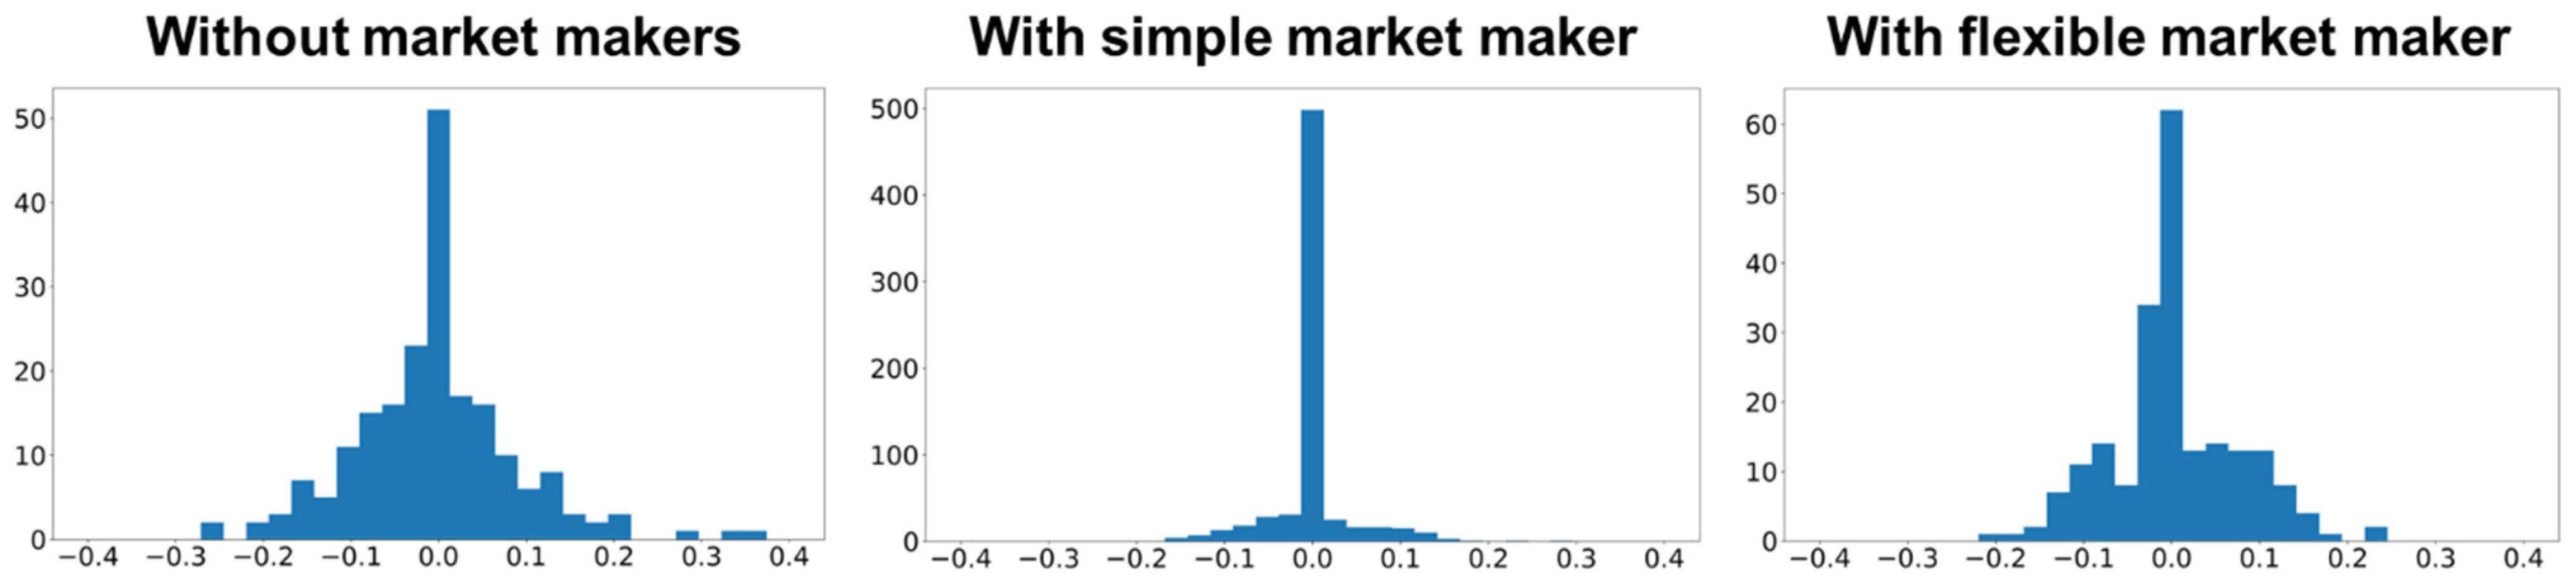
4.2. Case 1: Without Market Makers

First, we describe the initial parameters of the P2P electricity market simulation before introducing market makers. The initial parameters of the general agents (generators, consumers, and prosumers) and the market agent shown in the INPUT section of Figure 8 are summarized in Table 2 below. In addition, because this study focuses on the comparison between cases with and without market makers, these preconditions will be inherited in the simulations of Cases 2 and 3.
We first performed the artificial market simulation for Case 1, in which we demonstrate the results of trading volume and the mean, maximum, and minimum values of bid-ask spreads. A comprehensive and comparative discussion of all cases is provided in the next section.
Table 3 lists the total volume information provided in the simulation. There, the total tradable volume is 950.3 kWh, which means that if all the orders from the supply and demand agents had been executed, the total executed volume would also have been 950.3 kWh. However, only 268.7 kWh were executed in the simulation without introducing market makers; thus, the execution rate is 28.3%. This is because there are no sell orders at night (from the evening to the early morning) due to a lack of solar power generation, and on the other hand, in the daytime, solar power generation could greatly exceed demand. In other words, PV generation is limited to only daytime, and its generation in the daytime largely depends on weather and climate conditions. This can also be thought of as the reason for low market liquidity in the P2P electricity market.
The mean, maximum, and minimum values of the bid/ask spread (which is the difference between the best sell and buy prices on the order board) are shown in Table 4. It should be noted that there are time periods with no bid/ask spreads on the order board from the evening to the early morning when PV generation does not occur (e.g., 00: 00–00: 30). In addition, when PV generation greatly exceeds the demand of consumers during the daytime, buy orders may disappear shortly, and the bid/ask spreads cannot be observed afterward.

4.3. Case 2: Introduction of the Simple Market Maker

We then describe the initial parameters set in the simulation with the simple market maker (see Table 5). Only the additional parameters with respect to the simple market maker are shown because the items used in Case 1 remain unchanged.
As shown in Table 6, the total executed volume is 950.3 kWh, which is 3.54 times higher than 268.7 kWh in Case 1 and indicates that all bids by general agents have been executed; market liquidity has greatly improved from the perspective of the trading volume. This is because the market maker is assumed to own storage batteries and plays the role of balancing electricity between different points in time. In other words, the market maker becomes a seller for the time periods during which there are no other sell orders and becomes a buyer when the amount of power generation greatly exceeds the demand.
The bid/ask spread is shown in Table 7. We first note that the maximum value, 3.01 JPY/kWh, has become much smaller than that in Case 1, 16.00 JPY/kWh. In addition, the average value, 2.90 JPY/kWh, is also smaller than that in Case 1, 3.96 JPY/kWh, by 1.06 JPY/kWh. This shows that, because the simple market maker always holds limit orders with a spread size of 3.00 JPY/kWh, the bid/ask spread does not widen further. We see that market liquidity has improved from the perspective of bid/ask spreads, and the market environment has become more preferable for participants to trade in.

4.4. Case 3: Introduction of the Flexible Market Maker

Finally, we describe the initial parameters for the simulation using the flexible market maker. Because the items in Cases 1 and 2 remain unchanged (except “Reference middle price between sell and buy orders when neither bid nor offer is on the order book” in Case 2), only the additional parameters are listed in Table 8.
As shown in Table 9, the total executed volume is 470.4 kWh when the flexible market maker is introduced. This is 1.75 times higher than the value in Case 1, 268.7 kWh, but is about half of the value in Case 2, 950.3 kWh (in which all orders are executed). This is because the flexible market maker adjusts their bidding behavior to avoid execution under unfavorable conditions to improve their profit, although market makers need to keep limit orders on the board. Nevertheless, market liquidity can be said to have improved to a certain extent in terms of trading volume compared to the case without market makers.
The mean, maximum, and minimum values of the bid/ask spreads are listed in Table 10. Although the maximum and minimum values remain unchanged from those before the introduction of market makers, the average value has become larger than that in Case 1. This can be explained as follows. In Case 1, bid-ask spreads are observed only for limited periods and are not calculated in the nighttime, when solar power generation does not occur, or during the daytime, when the amount of PV power generation far exceeds the demand. On the other hand, the flexible market maker continues to place limit orders based on their bidding rules even in the time periods when no other buying or selling orders exist on the order book (selling price: 33.00 JPY/kWh when there are no other sell orders; buying price: 17.00 JPY/kWh when there are no other buy orders). As a result, the mean value of the bid/ask spreads tends to be larger in Case 3, although that in Case 2 with the simple market maker is tighter than that in Case 1 without market makers.
It should be mentioned that our results above may be influenced by initial parameters. However, we set them by referring to the Japanese electricity market and the past demonstration project described in Section 2 and verified the effectiveness of the proposed methodology. It would be interesting to investigate the robustness of the results by changing some parameters with others fixed as a future study.

5. Comparative Discussions

In this section, we present comparative discussions based on the artificial market simulation results for the three case studies in Section 4 and summarize the contributions of this study.
First, we summarize the executed volumes and execution rates for the three cases, as shown in Table 11. Recall that the introduction of the flexible market maker did not tighten the bid-ask spread on average as the spread observation period was quite limited in Case 1 without market makers, as mentioned at the end of the previous section. However, we observe that the execution rate was improved by introducing market makers. In particular, the introduction of the simple market maker significantly improved the execution rate.
A similar tendency was observed by computing and comparing the execution price change rates for the three cases, where the execution price change rates are given by the rate of change between the current and previous execution prices for the same product (i.e., electricity for the same delivery period). Figure 12 compares three histograms of the execution price change rates, where the vertical axis represents frequencies. The left-most figure indicates the results of the case without market makers, the middle with the simple market maker, and the right with the flexible market maker. Because higher change rates mean larger price fluctuations, their variance (or standard deviation) provides execution price volatility. We emphasize that high volatility in the P2P electricity market is the original motivation for introducing market makers, who are expected to mitigate price fluctuations.
To verify that the introduction of market makers actually achieves lower volatility, we computed the mean, variance (standard deviation), maximum, and minimum values for each case, as shown in Table 12. First, we see that the price volatility given by the variance (standard deviation) is reduced in cases with market makers. Second, the improvement effect is larger in the case with the simple market maker than in that with the flexible market maker. Note that similar observation results were obtained from other statistics, such as mean, maximum, and minimum values.
Considering the comparisons above, we can conclude that introducing a simple market maker is the best among these three cases. This may be true if the profitability or risk of loss for a market maker is not examined; however, when these points are also considered, the flexible market maker is a better option. To clarify the relationship between the two types of market makers and compare their profitability, we computed the total income or loss for the simple/flexible market maker, as shown in Table 13, in which imbalance charges of 50 JPY per 1 kWh shortage are deducted. Moreover, when the market maker has a surplus position, an opportunity loss occurs due to the additional procurement cost. With regard to the simulation results, when the daily generation and demand were even (i.e., Generation / Demand   = 100 / 100 = 1 ), the simple market maker’s profit was positive. However, when the generation–demand ratio increased or decreased by 30%, the simple market maker’s profit became negative, indicating that the simple market maker lost money through transactions. On the other hand, the flexible market maker was profitable even when generation and demand were unbalanced. Note that the market makers’ profitability worsened when the generation–demand ratio was further decreased, but the loss of the flexible market maker was not as large as that of the simple market maker.
In addition, we computed the weighted average of sales/purchase prices for generators, consumers, and prosumers in all three cases and compared the results with one another, although the details are omitted here for brevity. The introduction of market maker agents affected sales/purchase prices of these general agents, but the difference between with and without market maker cases was not large on average. On the other hand, market makers provided new trading opportunities even when no PV generation was performed at night, and as a result, the executed volumes of general agents largely increased. In this sense, the market maker system could be embraced without resistance by other market participants. Therefore, we can conclude that the proposed market maker system would contribute to the development of the P2P electricity market, which could serve as a new incentive for the further spread and establishment of renewable energy power generation businesses.

6. Conclusions

In this study, we proposed the application of a market maker system to the P2P electricity market and developed an efficient market maker strategy to increase liquidity and mitigate extreme price fluctuations. To this end, we constructed an artificial market simulator for P2P electricity trading. We also designed and implemented both market and participant agents that enabled us to virtually perform power bidding and contract processes. The participant agent algorithms were built for PV generators, consumers, prosumers, and market maker agents. We prepared two bidding strategies for market makers and compared them before and after their introduction using actual solar PV generation and consumption data observed in a previous demonstration project. We confirmed that the effect of liquidity enhancement and price stability has a trade-off relationship with market makers’ profitability, but all factors can be improved simultaneously without causing significant losses to other market participants. Therefore, we can conclude that the market maker system could lower the barriers to entry into the P2P electricity market and efficiently contribute to the growth of the renewable energy industry.
Finally, we describe the possible future directions of this research theme from the viewpoint of “improvement of bidding strategies for market maker agents”, “improvement of bidding strategies for supply and demand agents”, and “feasibility issues when introducing market makers”.
First, regarding the “improvement of bidding strategies for market maker agents”, we must incorporate additional factors into the current price determination algorithms. In this study, even the most sophisticated pricing method, the flexible market maker, was simply shifting half the bid offer spread up and down from the midpoint between the best quotes on the order board and adjusting them according to the net position of the moment. However, market makers also consider technical factors, such as market trends. Therefore, upgrading market-maker agents could be a topic for future research.
Second, with regard to the “improvement of bidding strategies for supply and demand agents”, they should be made more flexible because, in this study, they were assumed to be fixed regardless of changes in the external environment. However, in the real world, if market makers are introduced into the P2P electricity market, supply and demand agents will react by flexibly adjusting their bidding strategies. Furthermore, installing storage batteries (such as solar storage batteries for households and/or electric vehicles) into supply and demand agents could also change their strategies and may influence the market maker’s as well. These points should be considered in future studies.
Third, we would like to point out “feasibility issues when introducing market makers”. In this research, we do not consider many important elements that affect the feasibility of this system, such as power loss caused by transmission, charge and discharge processes, the ideal capacity of storage batteries for market makers, and cost-effectiveness considering battery life. In our simulations, we assumed that the market maker agent was homogeneous regardless of their types and that their bidding strategy was fixed; however, it is more reasonable to expect that multiple market makers with different strategies exist in a single market.
Finally, there exist several issues related to the extension of the dataset. In this study, we have assumed that the number of agents is 18 in total and assigned both or either of the two types of logs (generation/consumption) randomly to each agent (a generator, consumer, or prosumer agent) from the original dataset. Moreover, the total daily PV generation and consumption per household were adjusted to reflect other conditions (such as weather and/or yearly trends), and we performed various simulations based on these adjusted data. A further investigation based on an enhanced dataset for a longer period and with a wider variety of participants may be interesting. Consequently, when introducing this market maker system into real-life P2P markets, discussing these issues is inevitable; thus, they could be considered potential topics for further studies.
The work in this study was primarily conducted when the first author was a graduate student in the School of Engineering at the University of Tokyo, Japan.

Author Contributions

Conceptualization, S.K., K.T. and Y.Y.; methodology, S.K.; software, S.K.; validation, S.K.; formal analysis, S.K.; investigation, S.K., K.T. and Y.Y.; resources, K.T.; data curation, K.T.; writing—original draft preparation, S.K. and Y.Y.; writing—review and editing, S.K. and Y.Y.; visualization, S.K.; supervision, K.T. and Y.Y.; project administration, K.T. and Y.Y.; funding acquisition, Y.Y. All authors have read and agreed to the published version of the manuscript.

Funding

Grant-in-Aid for Scientific Research (A) 20H00285 and Grant-in-Aid for Challenging Research (Exploratory) 19K22024 from the Japan Society for the Promotion of Science (JSPS).

Data Availability Statement

The data presented in this study are available from the corresponding author upon reasonable request. The data are not publicly available due to privacy.

Acknowledgments

We express our sincere gratitude to TATEYAMA KAGAKU CO., LTD. (Toyama, Japan), for providing the supply and demand data in Section 4. This work was supported by Grant-in-Aid for Scientific Research (A) 20H00285 and Grant-in-Aid for Challenging Research (Exploratory) 19K22024 from the Japan Society for the Promotion of Science (JSPS).

Conflicts of Interest

The authors declare no conflict of interest.

Appendix A. Bidding Strategies of General Agents

In this appendix, we explain the bidding strategies of general agents, that is, the generators, consumers, and prosumers, used in our simulation.

Appendix A.1. Generators and Consumers

Generators are supposed to sell all the electricity they generate in the market without consuming any. The bidding price determination strategy is as follows. Immediately after the market opens, they place an order at a relatively high price and then gradually lower the price as time passes toward the end of the bidding period. This represents the behavioral principle that generators want to sell surplus power at the highest possible prices but do not want to waste any electricity. At the same time, the minimum sale price is predetermined, and generators will not sell below the price. This indicates that it is financially more advantageous to sell to a grid than to sell at an excessively low price in the P2P market.
Similarly, consumers do not generate or procure all the necessary amounts of electricity from the P2P market. Their bidding price determination strategy is to place an order at a relatively low price initially and then gradually increase the price over time. Consumers want to purchase the required electricity at the lowest possible price but do not want to experience a power shortage. In addition, the maximum purchase price is set, and no purchase order is placed higher than the price. This implies that consumers find it more profitable to purchase electricity from the grid than to buy it at an excessively high price in the P2P market.
In addition, a random number term is added to the prices explained above because the generation and demand conditions of each entity are not constant but, rather, are constantly subject to many uncertain factors in the real world. Thus, bidding prices should be adjusted flexibly. In the remainder of this paper, we refer to a bidding price without a random number added as a “base price”.
Graphical representations of base prices for generators and consumers are shown in Figure A1. In the actual market, there are various user preferences, such as the need to sell at the highest possible prices (buy at the lowest possible prices) or the need to secure necessary electricity amounts safely. To express these differences in preference, market participants are divided into three segments: the “price-oriented type”, which puts more emphasis on economic efficiency; the “certainty-oriented type”, which places more importance on how fast they can ensure needed power; and the “moderate type”, which falls somewhere in between these two. To differentiate all these segments, different values are used for initial bidding prices, price change rates, and limits of bidding prices.
Figure A2 shows the actual bidding price transition after random numbers are added. This allows orders to be executed even in the first 400 min when no single contract is seen in the case of bidding at base prices.
There is one more rule regarding bidding price: If the previous order was already contracted at the next bidding timing, the base price (the price without a random number added) remains the same even if some time has elapsed since the last bidding and only the random number changes. The aim is to prevent sales prices from being excessively lowered or purchase prices from excessively increasing over time, even though the market environment is such that electricity can be sold at higher prices or bought at lower prices.
Figure A1. The base bidding price (price without a random term).
Energies 15 04218 g0a1
Figure A2. Actual bidding price (price with a random term).
Energies 15 04218 g0a2

Appendix A.2. Prosumers

Prosumers both generate and consume electricity, and they attempt to satisfy their demand with their own generation as much as possible. They sell or buy electricity in the P2P market only when there is a surplus or shortage. In other words, if the total procurement, which is the sum of predicted generation and existing buy contracts, exceeds the necessary quantity, which is the sum of the forecasted demand and existing sell contracts, the excess amount is bid as sell orders; conversely, if the procurement volume is not sufficient to fulfill the demand, a buy order is sent to the market. The bidding price determination strategy of prosumers is a combination of generators‘ and consumers’ algorithms. Because prosumers can be both sellers and buyers, the initial prices, price change rates, and limits of bidding prices are set separately for the two sides. Furthermore, as in the case of generators and consumers, if the previous order on the same bidding side (selling or buying) has been executed by the next bidding turn, the base price remains unchanged, and only a new random number is added to it.

References

  1. Mengelkamp, E.; Gärttner, J.; Rock, K.; Kessler, S.; Orsini, L.; Weinhardt, C. Designing microgrid energy markets: A case study: The Brooklyn Microgrid. Appl. Energy 2018, 210, 870–880. [Google Scholar] [CrossRef]
  2. Werth, A.; Kitamura, N.; Tanaka, K. Conceptual study for open energy systems: Distributed energy network using interconnected DC nanogrids. IEEE Trans. Smart Grid 2015, 6, 1621–1630. [Google Scholar] [CrossRef]
  3. Lezama, F.; Soares, J.; Hernandez-Leal, P.; Kaisers, M.; Pinto, T.; Vale, Z. Local energy markets: Paving the path toward fully transactive energy systems. IEEE Trans. Power Syst. 2018, 34, 4081–4088. [Google Scholar] [CrossRef] [Green Version]
  4. Matsuda, Y.; Tanaka, K. EV mobility charging service based on blockchain. In Proceedings of the 2020 IEEE International Conference on Environment and Electrical Engineering and 2020 IEEE Industrial and Commercial Power Systems Europe (EEEIC/I&CPS Europe), Madrid, Spain, 9–12 June 2020. [Google Scholar]
  5. Goranović, A.; Meisel, M.; Fotiadis, L.; Wilker, S.; Treytl, A.; Sauter, T. Blockchain applications in microgrids an overview of current projects and concepts. In Proceedings of the IECON 2017—43rd Annual Conference of the IEEE Industrial Electronics Society, Beijing, China, 29 October–1 November 2017; pp. 6153–6158. [Google Scholar]
  6. Parka, C.; Yong, T. Comparative review and discussion on P2P electricity trading. Energy Procedia 2017, 128, 3–9. [Google Scholar] [CrossRef]
  7. Sagawa, D.; Tanaka, K.; Ishida, F.; Saito, H.; Takenaga, N.; Nakamura, S.; Aoki, N.; Nameki, M.; Saegusa, K. Bidding agents for PV and electric vehicle-owning users in the electricity P2P trading market. Energies 2021, 14, 8309. [Google Scholar] [CrossRef]
  8. Matsuda, Y.; Yamazaki, Y.; Oki, H.; Takeda, Y.; Sagawa, D. Tanaka, K. Demonstration of blockchain based peer to peer energy trading system with real-life used PHEV and HEMS charge control. Energies 2021, 14, 7484. [Google Scholar] [CrossRef]
  9. Takeda, Y.; Nakai, Y.; Senoo, T.; Tanaka, K. Designing a user-centric P2P energy trading platform: A case study—Higashi-Fuji Demonstration. Energies 2021, 14, 7289. [Google Scholar] [CrossRef]
  10. Zhang, W.; Wang, X.; Huang, Y.; Qi, S.; Zhao, Z.; Lin, F. A Peer-To-Peer Market Mechanism for Distributed Energy Resourses. In Proceedings of the 2019 IEEE Innovative Smart Grid Technologies—Asia (ISGT Asia), Chengdu, China, 21–24 May 2019; pp. 1375–1380. [Google Scholar]
  11. Leong, C.H.; Gu, C.; Li, F. Auction Mechanism for P2P Local Energy Trading considering Physical Constraints. Energy Procedia 2019, 158, 6613–6618. [Google Scholar] [CrossRef]
  12. Lin, J.; Pipattanasomporn, M.; Rahman, S. Comparative analysis of auction mechanisms and bidding strategies for P2P solar transactive energy markets. Appl. Energy 2019, 255, 113687. [Google Scholar] [CrossRef]
  13. Azim, M.I.; Tushar, W.; Saha, T.K. Cooperative negawatt P2P energy trading for low-voltage distribution networks. Appl. Energy 2021, 299, 117300. [Google Scholar] [CrossRef]
  14. Azizi, A.; Aminifar, F.; Moeini-Aghtaie, M.; Alizadeh, A. Transactive Energy Market Mechanism With Loss Implication. IEEE Trans. Smart Grid 2021, 12, 1215–1223. [Google Scholar] [CrossRef]
  15. Andoni, M.; Robu, V.; Flynn, D.; Abram, S.; Geach, D.; Jenkins, D.; McCallum, P.; Peacock, A. Blockchain technology in the energy sector: A systematic review of challenges and opportunities. Renew Sustain. Energy Rev. 2019, 100, 143–174. [Google Scholar] [CrossRef]
  16. Ahl, A.; Yarime, M.; Tanaka, K.; Sagawa, D. Review of blockchain-based distributed energy: Implications for institutional development. Renew. Sustain. Energy Rev. 2019, 107, 200–211. [Google Scholar] [CrossRef]
  17. Nemoto, J.; Goto, M. Measurement of Dynamic Efficiency in Production: An Application of Data Envelopment Analysis to Japanese Electric Utilities. J. Product. Anal. 2003, 19, 191–210. [Google Scholar] [CrossRef]
  18. Kontani, R.; Tanaka, K.; Yamada, Y. Feasibility conditions for demonstrative peer-to-peer energy market. Energies 2021, 14, 7418. [Google Scholar] [CrossRef]
  19. Japan Exchange Group, Incorporated. Market Maker Program. Available online: https://www.jpx.co.jp/english/derivatives/rules/market-maker/index.html (accessed on 14 April 2022).
  20. Kardakos, E.G.; Simoglou, C.K.; Bakirtzis, A.G. Optimal bidding strategy in transmission-constrained electricity markets. Electr. Power Syst. Res. 2014, 109, 141–149. [Google Scholar] [CrossRef]
  21. Maceas Henao, M.; Espinosa Oviedo, J.J. Bidding Strategy for VPP and Economic Feasibility Study of the Optimal Sizing of Storage Systems to Face the Uncertainty of Solar Generation Modelled with IGDT. Energies 2022, 15, 953. [Google Scholar] [CrossRef]
  22. Singh, S.; Fozdar, M.; Malik, H.; Khan, I.A.; Al Otaibi, S.; Albogamy, F.R. Impacts of Renewable Sources of Energy on Bid Modeling Strategy in an Emerging Electricity Market Using Oppositional Gravitational Search Algorithm. Energies 2021, 14, 5726. [Google Scholar] [CrossRef]
  23. Qussous, R.; Harder, N.; Weidlich, A. Understanding Power Market Dynamics by Reflecting Market Interrelations and Flexibility-Oriented Bidding Strategies. Energies 2022, 15, 494. [Google Scholar] [CrossRef]
  24. Khaloie, H.; Abdollahi, A.; Shafie-Khah, M.; Siano, P.; Nojavan, S.; Anvari-Moghaddam, A.; Catalao, J.P.S. Co-optimized bidding strategy of an integrated wind-thermal-photovoltaic system in deregulated electricity market under uncertainties. J. Clean. Prod. 2020, 242, 118434. [Google Scholar] [CrossRef]
  25. Zheng, Y.; Yu, H.; Shao, Z.; Jian, L. Day-ahead bidding strategy for electric vehicle aggregator enabling multiple agent modes in uncertain electricity markets. Appl. Energy 2020, 280, 115977. [Google Scholar] [CrossRef]
  26. Sadeghi, S.; Jahangir, H.; Vatandoust, B.; Golkar, M.A.; Ahmadian, A.; Elkamel, A. Optimal bidding strategy of a virtual power plant in day-ahead energy and frequency regulation markets: A deep learning-based approach. Int. J. Electr. Power Energy Syst. 2021, 127, 106646. [Google Scholar] [CrossRef]
  27. Li, S.; Park, C.S. Wind power bidding strategy in the short-term electricity market. Energy Econ. 2018, 75, 336–344. [Google Scholar] [CrossRef]
  28. Mahvi, M.; Ardehali, M.M. Optimal bidding strategy in a competitive electricity market based on agent-based approach and numerical sensitivity analysis. Energy 2011, 36, 6367–6374. [Google Scholar] [CrossRef]
  29. Baltaoglu, S.; Tong, L.; Zhao, Q. Algorithmic bidding for virtual trading in electricity markets. IEEE Trans. Power Syst. 2019, 34, 535–543. [Google Scholar] [CrossRef] [Green Version]
  30. Deng, S.J.; Oren, S.S. Electricity derivatives and risk management. Energy 2006, 31, 940–953. [Google Scholar] [CrossRef]
  31. Algieri, B.; Leccadito, A.; Tunaru, D. Risk premia in electricity derivatives markets. Energy Econ. 2021, 100, 105300. [Google Scholar] [CrossRef]
  32. Bevin-McCrimmon, F.; Diaz-Rainey, I.; McCarten, M.; Sise, G. Liquidity and risk premia in electricity futures. Energy Econ. 2018, 75, 503–517. [Google Scholar] [CrossRef]
  33. Matsumoto, T.; Bunn, D.W.; Yamada, Y. Pricing electricity day-ahead cap futures with multifactor skew-t densities. Quant. Financ. 2021, 22, 835–860. [Google Scholar] [CrossRef]
  34. Groll, A.; Cabrera, B.L.; Meyer-Brandis, T. A consistent two-factor model for pricing temperature derivatives. Energy Econ. 2016, 55, 112–126. [Google Scholar] [CrossRef] [Green Version]
  35. Lee, Y.; Oren, S.S. An equilibrium pricing model for weather derivatives in a multi-commodity setting. Energy Econ. 2009, 31, 702–713. [Google Scholar] [CrossRef] [Green Version]
  36. Kanamura, T.; Ohashi, K. Pricing summer day options by good-deal bounds. Energy Econ. 2009, 31, 289–297. [Google Scholar] [CrossRef]
  37. Benth, F.E.; Di Persio, L.; Lavagnini, S. Stochastic Modeling of Wind Derivatives in Energy Markets. Risks 2018, 6, 56. [Google Scholar] [CrossRef] [Green Version]
  38. Rodríguez, Y.E.; Pérez-Uribe, M.A.; Contreras, J. Wind Put Barrier Options Pricing Based on the Nordix Index. Energies 2021, 14, 1177. [Google Scholar] [CrossRef]
  39. Boyle, C.F.; Haas, J.; Kern, J.D. Development of an irradiance-based weather derivative to hedge cloud risk for solar energy systems. Renew. Energy 2020, 164, 1230–1243. [Google Scholar] [CrossRef]
  40. Bhattacharya, S.; Gupta, A.; Kar, K.; Owusu, A. Risk management of renewable power producers from co-dependencies in cashflows. Eur. J. Oper. Res. 2020, 283, 1081–1093. [Google Scholar] [CrossRef]
  41. Yamada, Y.; Matsumoto, T. Going for derivatives or forwards? Minimizing cashflow fluctuations of electricity transactions on power markets. Energies 2021, 14, 7311. [Google Scholar] [CrossRef]
  42. Matsumoto, T.; Yamada, Y. Simultaneous hedging strategy for price and volume risks in electricity businesses using energy and weather derivatives. Energy Econ. 2021, 95, 105101. [Google Scholar] [CrossRef]
  43. Matsumoto, T.; Yamada, Y. Customized yet standardized temperature derivatives: A non-parametric approach with suitable basis selection for ensuring robustness. Energies 2021, 14, 3351. [Google Scholar] [CrossRef]
  44. Worthmann, K.; Kellett, C.M.; Braun, P.; Grune, L.; Weller, S.R. Distributed and Decentralized Control of Residential Energy Systems Incorporating Battery Storage. IEEE Trans. Smart Grid 2015, 6, 1914–1923. [Google Scholar] [CrossRef] [Green Version]
  45. Nguyen, V.H.; Tran, Q.T.; Besanger, Y.; Labonne, A. Complementary business models for distribution system operator in a peer-to-peer electricity market. In Proceedings of the 2021 IEEE International Conference on Environment and Electrical Engineering and 2021 IEEE Industrial and Commercial Power Systems Europe, Bari, Italy, 8–11 June 2021; pp. 1–6. [Google Scholar]
  46. Huang, Q.; Xu, Y.; Courcoubetis, C. Strategic Storage Operation in Wholesale Electricity Markets: A Game Theoretic Analysis. In Proceedings of the 2019 IEEE 58th Conference on Decision and Control (CDC), Nice, France, 11–13 December 2019; pp. 2201–2207. [Google Scholar]
  47. Bose, S.; Cai, D.W.H.; Low, S.; Wierman, A. The role of a market maker in networked Cournot competition. In Proceedings of the 53rd IEEE Conference on Decision and Control, Los Angeles, CA, USA, 15–17 December 2014; pp. 4479–4484. [Google Scholar]
  48. Worthmann, K.; Kellett, C.M.; Grüne, L.; Weller, S.R. Distributed control of residential energy systems using a market maker. IFAC Proc. Vol. 2014, 47, 11641–11646. [Google Scholar] [CrossRef] [Green Version]
  49. Kusada, Y.; Mizuta, T.; Hayakawa, S.; Izumi, K. Impact of Position-Based Market Makers to Shares of Markets’ Volumes—An Artificial Market Approach. Trans. Jpn. Soc. Artif. Intell. 2015, 30, 675–682. (In Japanese) [Google Scholar] [CrossRef] [Green Version]
  50. Mizuta, T.; Izumi, K. Investigation of Frequent Batch Auctions Using Agent Based Model; JPX Working Paper, 17; Japan Exchange Group, Inc.: Tokyo, Japan, 2016; Available online: https://www.jpx.co.jp/english/corporate/research-study/working-paper/b5b4pj000000i468-att/E_JPX_working_paper_Vol17.pdf (accessed on 13 April 2022).
  51. Abe, R.; Tanaka, K.; Triet, N.V. Energy Internet: An open energy platform to transform legacy power systems into open innovation and global economic. In The Energy Internet: An Open Energy Platform to Transform Legacy Power Systems into Open Innovation and Global Economic Engines; Su, W., Huang, A., Eds.; Woodhead Publishing: Cambridge, UK, 2018; pp. 241–264. [Google Scholar]
  52. Tanaka, K.; Abe, R.; Nguyen-Van, T.; Yamazaki, Y.; Kamitamari, T.; Sako, K.; Koide, T. A Proposal on an Electricity Trading Platform Using Blockchain, Volume 7: Transdisciplinary Engineering Methods for Social Innovation of Industry 4.0; IOS Press: Amsterdam, The Netherlands, 2018; pp. 976–983. [Google Scholar]
  53. Waseda, F.; Tanaka, K. Bidding agent for electric vehicles in peer-to-peer electricity trading market considering uncertainty. In Proceedings of the 2020 IEEE International Conference on Environment and Electrical Engineering and 2020 IEEE Industrial and Commercial Power Systems Europe (EEEIC/I&CPS Europe), Madrid, Spain, 9–12 June 2020. [Google Scholar]
Figure 1. System for the Urawa-Misono demonstration project (reproduced with permission from Kontani et al. [18], under CC-BY license from MDPI (Basel, Switzerland), 2021).
Energies 15 04218 g001
Figure 2. Example of large price fluctuations in the P2P electricity trading demonstration conducted in Japan. The horizontal axis denotes the time to the end of the trading period.
Energies 15 04218 g002
Figure 3. An illustrative example of order books for electricity trading. The left order book has low liquidity, which means that there are few limit orders, and the right order book has high liquidity, with many orders around the current market price of 25 JPY/kWh. If someone attempts to purchase 50 kWh at once as a market order, the market electricity price soars up to 30 JPY/kWh in the low liquidity case; on the other hand, in the right high-liquidity case, all of the 50 kWh power can be procured at the same price of 25 JPY/kWh.
Energies 15 04218 g003
Figure 4. A total of 48 products of 30-min periods in electricity markets.
Energies 15 04218 g004
Figure 5. Simultaneous bidding on multiple markets.
Energies 15 04218 g005
Figure 6. P2P electricity market before the introduction of market makers.
Energies 15 04218 g006
Figure 7. P2P electricity market after the introduction of market makers.
Energies 15 04218 g007
Figure 8. Information flow in the simulation system.
Energies 15 04218 g008
Figure 9. Price determination strategy of the simple market maker when sell and buy orders are both quoted on the order board.
Energies 15 04218 g009
Figure 10. Price determination strategy with respect to the net position at time t , denoted by s f m t , of the flexible market maker when both sell and buy orders are quoted on the order board.
Energies 15 04218 g010
Figure 11. PV generations (left) and power consumptions (right) of five households were converted to 30-min values and adjusted to a total of 100 kWh.
Energies 15 04218 g011
Figure 12. Histograms of execution price change rates for the three cases (horizontal axis: execution price change rate; vertical axis: frequency).
Energies 15 04218 g012
Table 1. Data used in the artificial market simulation.
ItemsContent
Data categoryGeneration and demand (kWh)
Category of participantResidencial household
Number of householdsFive
WeatherSunny
PeriodOne day (24 h; 0:00–24:00)
Measurement interval5 min
Amount of data 1440 for generation and 1440 for demand
Table 2. Initial parameters in P2P electricity market simulation (see Appendix A for the definitions of the three types of general agents: price-oriented type, moderate type, and certainty-oriented type, and random variables added to base prices).
ItemsValues
General agentsNumber of agents18 agents in total
= 6 generators + 6 consumers + 6 prosumers
(6 agents for each = 2 price-oriented-type agents +
2 moderate-type agents + 2 certainty-oriented-type agents)
Total generation per day
and
Total demand per day
(Generator)
Generation: 100 kWh/day
Demand: 0 kWh/day
(Consumer)
Generation: 0 kWh/day
Demand: 100 kWh/day
(Prosumer)
Generation: 100 kWh/day
Demand: 100 kWh/day
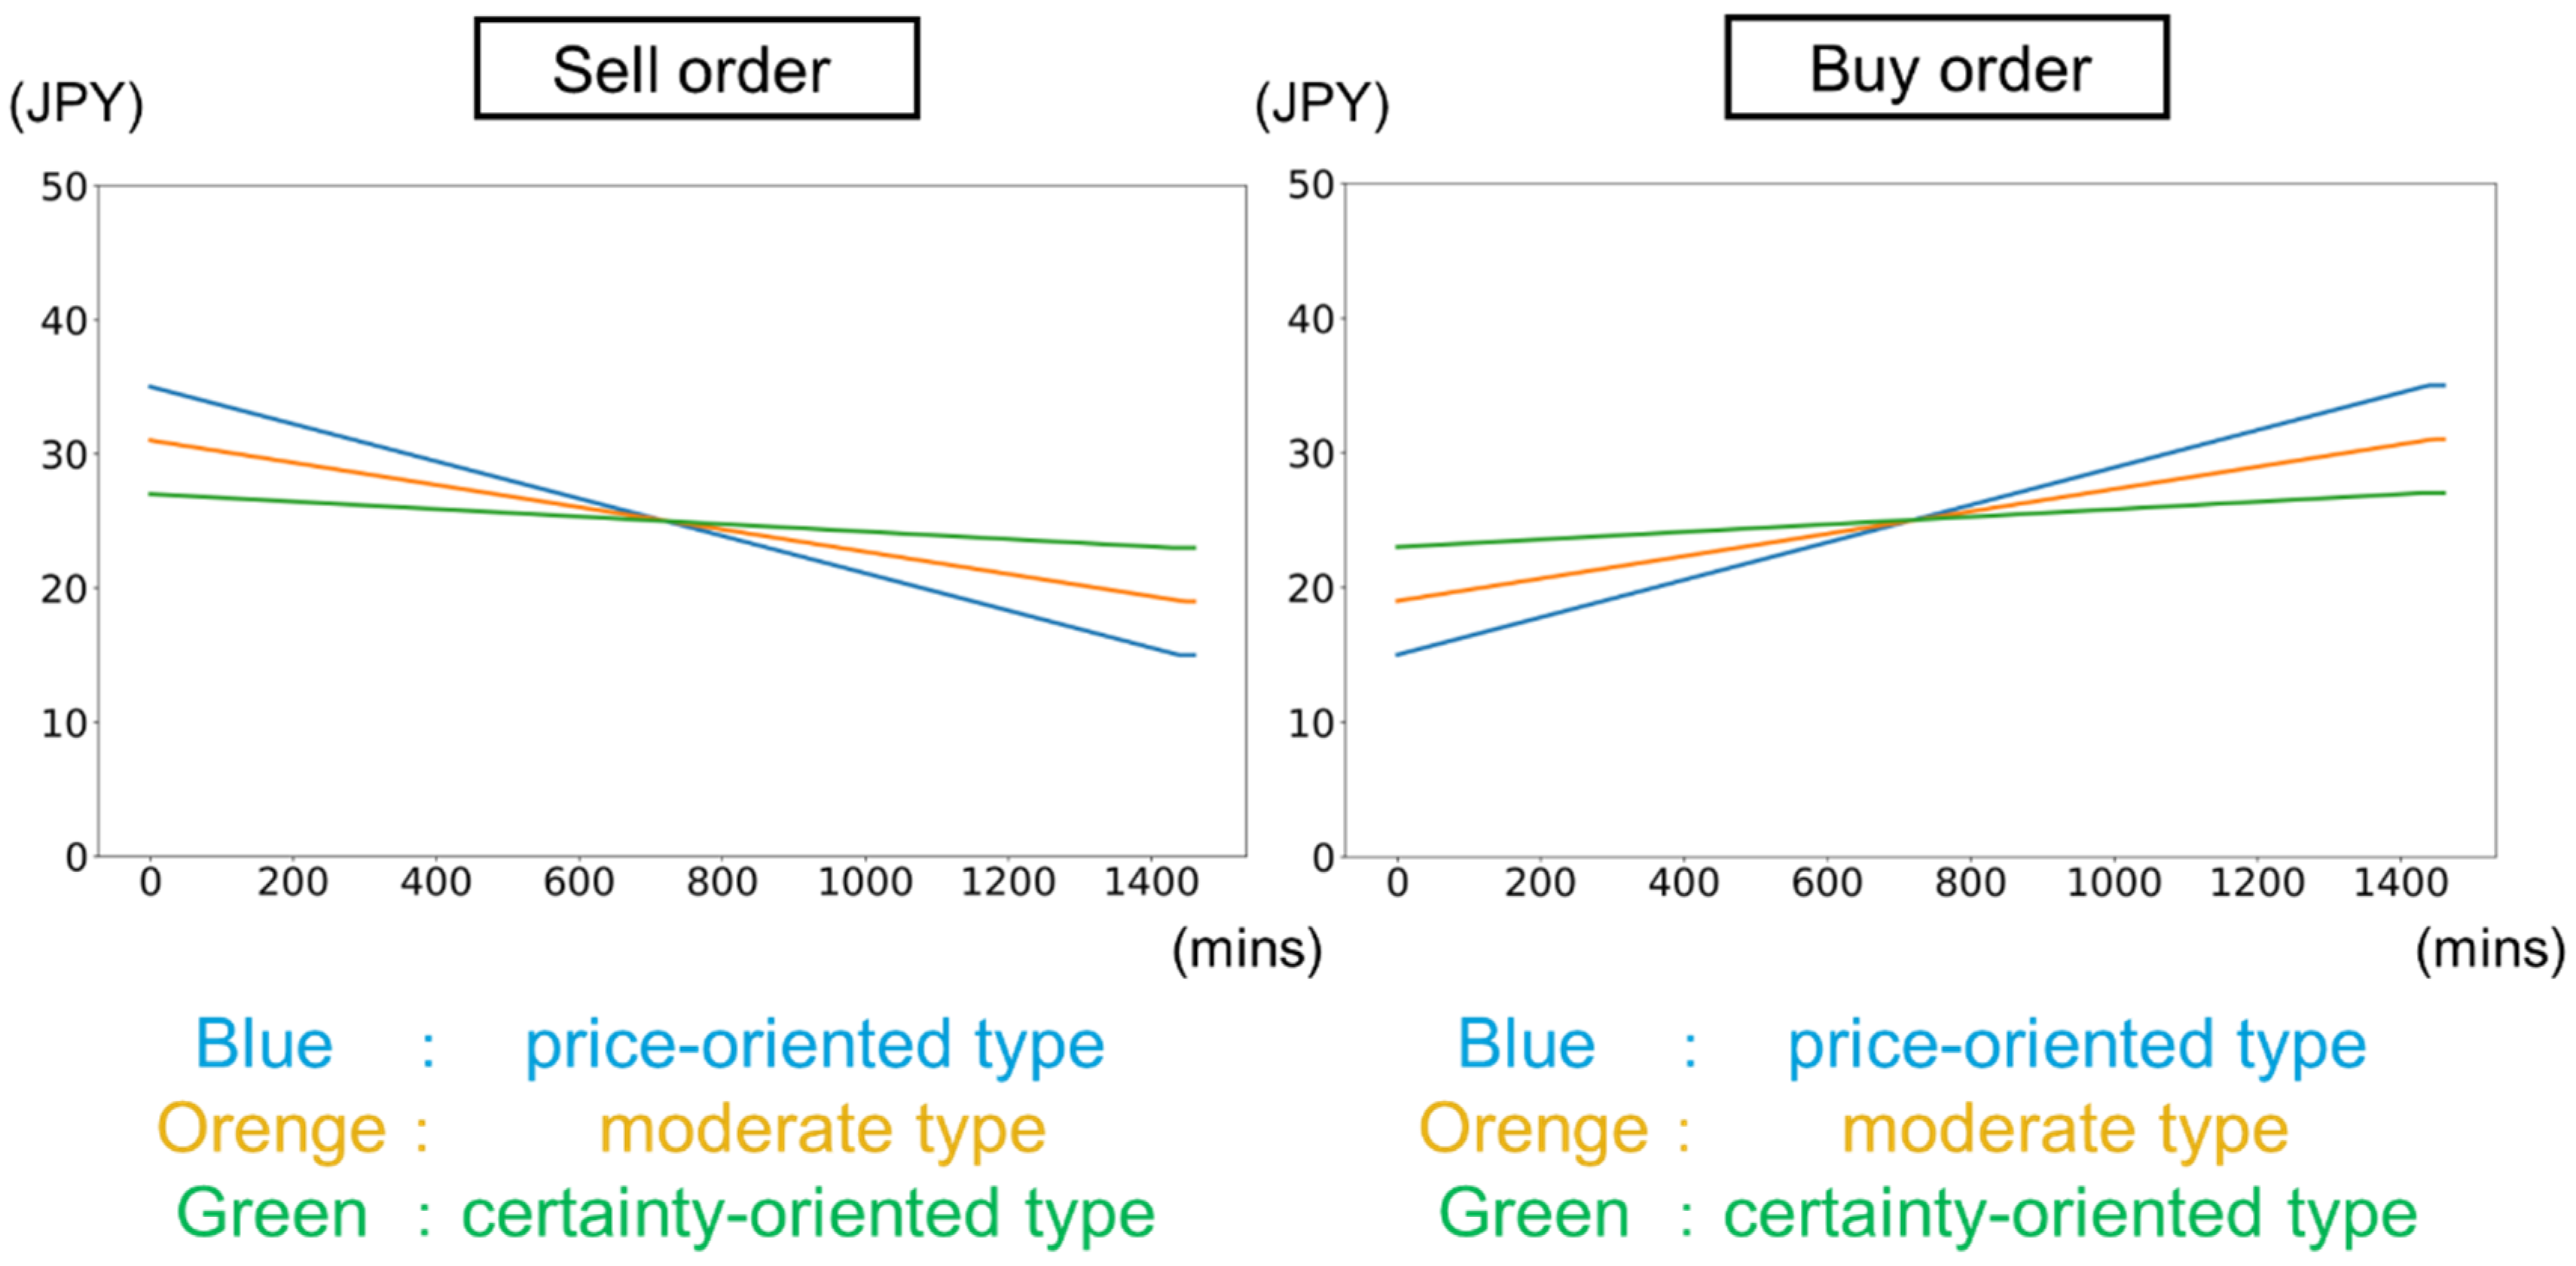
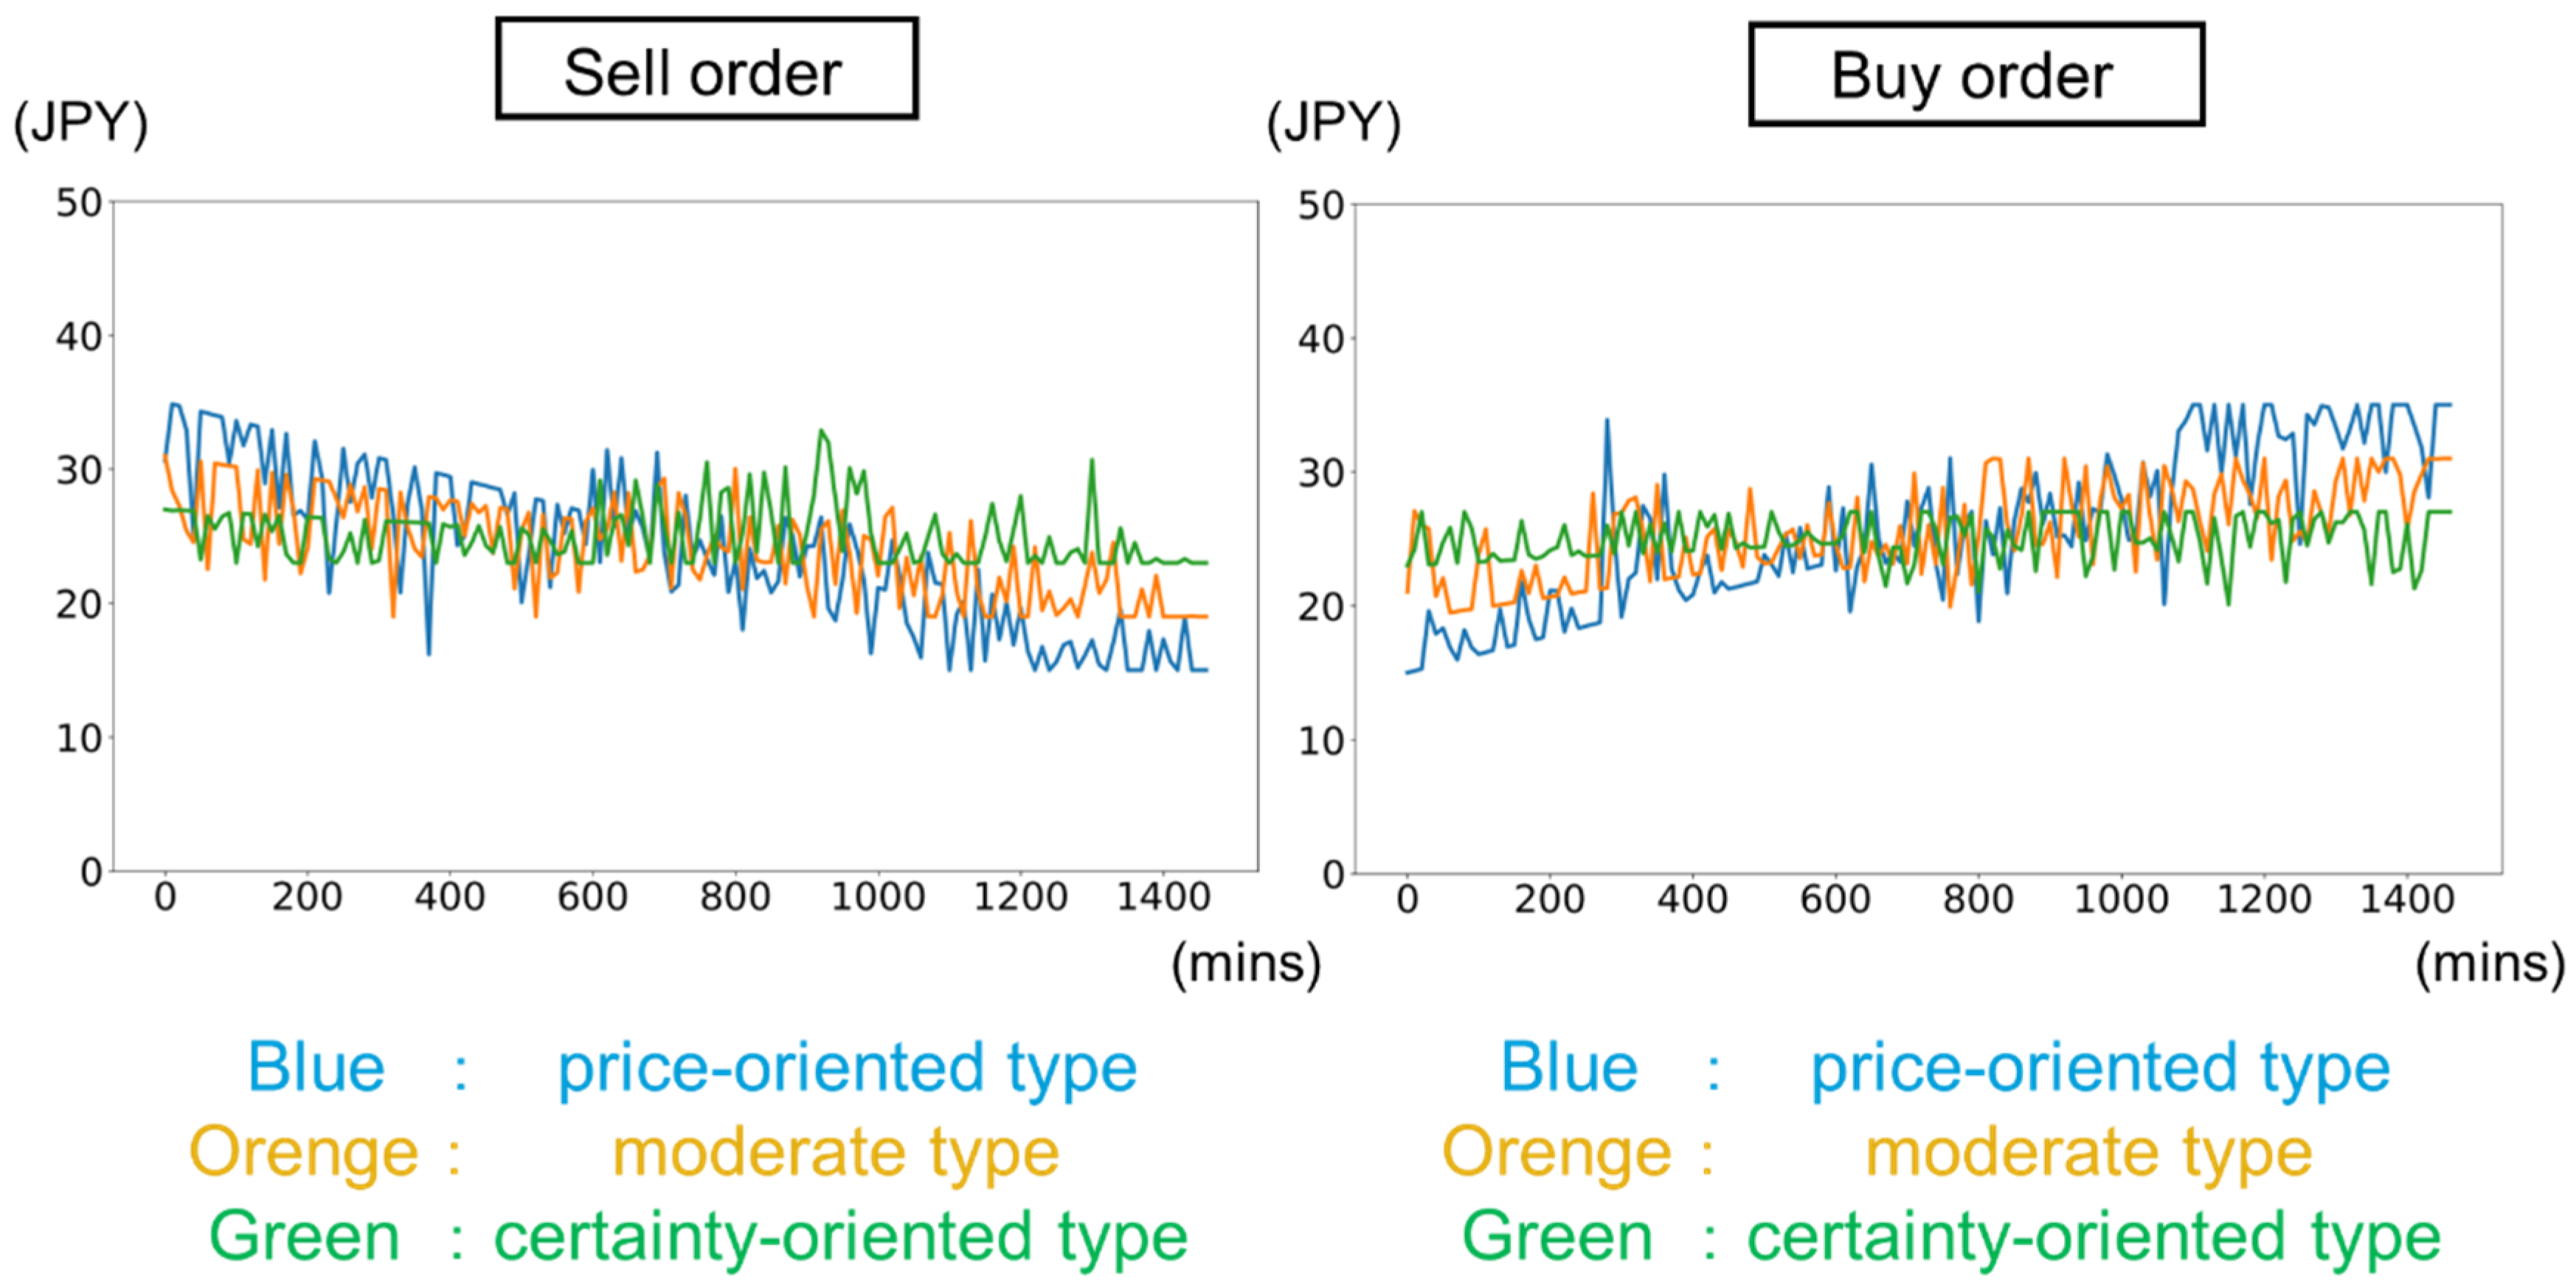
Initial bidding priceFor generators and prosumers’ sell orders
Price-oriented type: 35 JPY/kWh
Moderate type: 31 JPY/kWh
Certainty-oriented type: 27 JPY/kWh
For consumers and prosumers’ buy orders
Price-oriented type: 15 JPY/kWh
Moderate type: 19 JPY/kWh
Certainty-oriented type: 23 JPY/kWh
Bidding price
change rate
For generators and prosumers’ sell orders
Price-oriented type: −0.0139 JPY/kWh/min
Moderate type: 0.0083 JPY/kWh/min
Certainty-oriented type: −0.0028 JPY/kWh/min
For consumers and prosumers’ buy orders
Price-oriented type: 0.0139 JPY/kWh/min
Moderate type: 0.0083 JPY/kWh/min
Certainty-oriented type: 0.0028 JPY/kWh/min
Maximum bidding price/
Minimum bidding price
For generators and prosumers’ sell orders
Price-oriented type: 15 JPY/kWh
Moderate type: 19 JPY/kWh
Certainty-oriented type: 23 JPY/kWh
For consumers and prosumers’ buy orders
Price-oriented type: 35 JPY/kWh
Moderate type: 31 JPY/kWh
Certainty-oriented type: 27 JPY/kWh
Random variables
added to base prices
Mean: 0.0
Standard deviation: Normal distribution subject to
the conditions below
(In the case of “price-oriented-type agent” and
“within 10 h after the 30-min delivery period starts”)
6.0
(In the case of “moderate-type agent” and
“within 10 h after the 30-min delivery period starts”)
4.5
(Others)
3.0
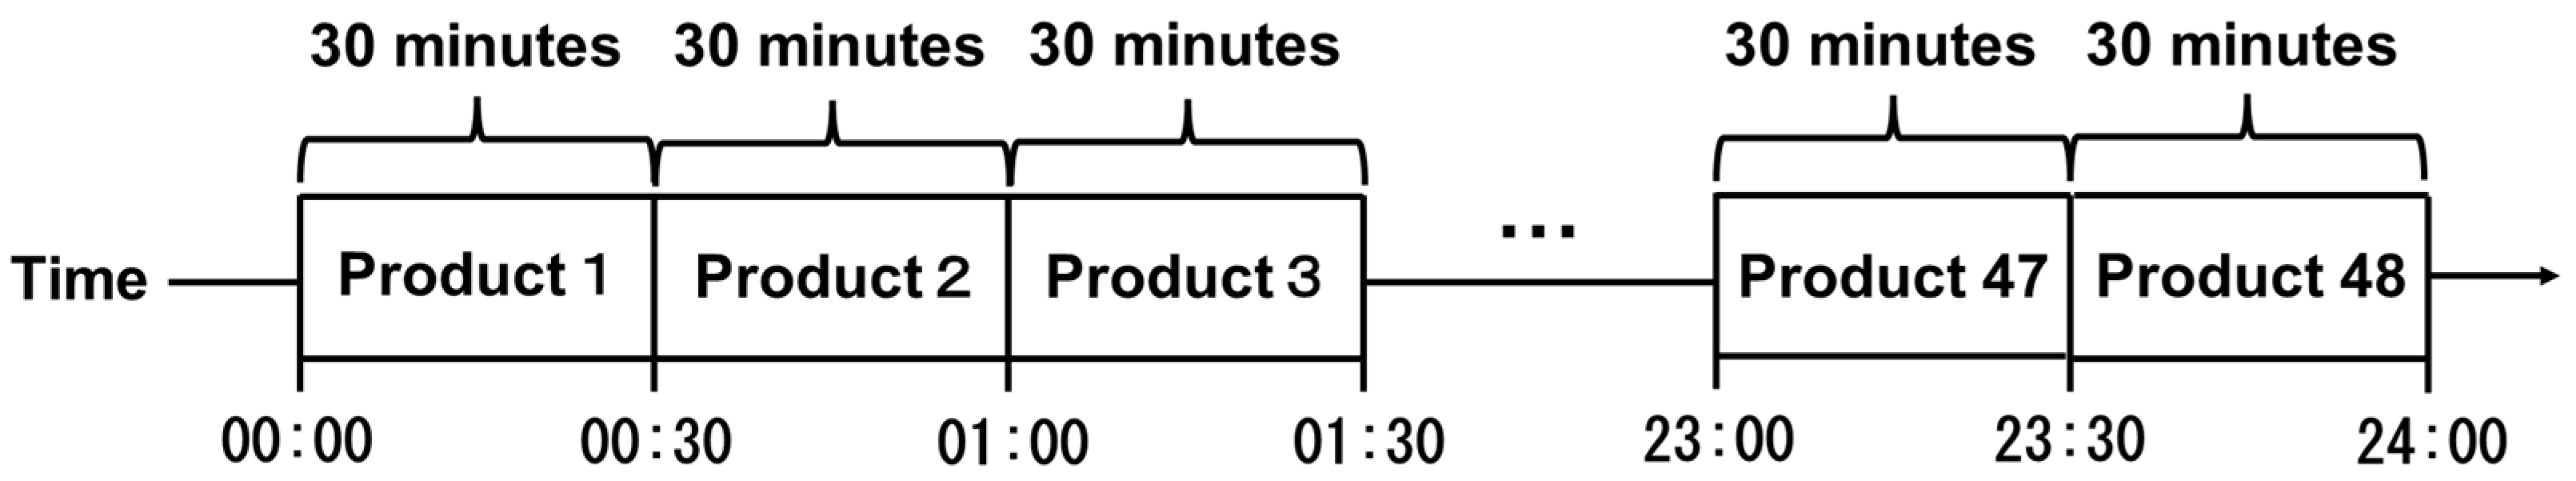
Market agentUnit of time elapsing
between orders of
a general agent
10 min
Electricity delivery period per product30 min
Trading hours
per product
(Starting time)
24 h before the 30-min delivery period starts
(Ending time)
10 min before the 30-min delivery period ends
Simulation period2 days (1 day for bidding and 1 day for delivering)
Tick size0.01 JPY/kWh
Table 3. Total volumes in the simulation without market makers.
Total Tradable VolumeTotal Executed VolumeExecution Rate
950.3kWh268.7 kWh28.3%
Table 4. Mean, maximum, and minimum values of bid-ask spreads (without market makers).
MeanMaxMin
3.96 JPY/kWh16.00 JPY/kWh0.01 JPY/kWh
Table 5. Initial parameters in P2P electricity market simulation with the simple market maker.
ItemsValues
Simple market maker agentSpread3.00 JPY/kWh
Bidding volume(Sell volume)
10.0Wh
(Buy volume)
10.0 kWh
Reference middle price between sell and buy orders
when neither bid nor offer is on the order book
25.00 JPY/kWh
The amount of price shift from the best quotes
to prevent market orders
0.01 JPY/kWh
Table 6. Total volumes in the simulation with the simple market maker.
Total
Tradable Volume
Total Executed VolumeExecution
Rate
950.3 kWh134.0 kWh + 1632.6 kWh/2 = 950.3 kWh
(Trading volume not involving
the simple market maker)
134.0 kWh
(Trading volume involving
the simple market maker as a seller or buyer)
1632.6 kWh
100.0%
Table 7. Mean, maximum, and minimum values of bid-ask spreads (with the simple market maker).
MeanMaxMin
2.90 JPY/kWh3.01 JPY/kWh0.01 JPY/kWh
Table 8. Initial parameters in P2P electricity market simulation with the flexible market maker.
ItemsValues
Flexible market maker agentPrice adjustment weight0.00005
Bidding price when no reverse order
is on the order book
(Sell order price)
33.00 JPY/kWh
(Buy order price)
17.00 JPY/kWh
Table 9. Total volumes in the simulation with the flexible market maker.
Total Tradable VolumeTotal Executed VolumeExecution Rate
950.3 kWh104.2 kWh + 732.5 kWh/2 = 470.4 kWh
(Trading volume not involving
the flexible market maker)
104.2 kWh
(Trading volume involving
the flexible market maker
as a seller or buyer)
732.5 kWh
49.5%
Table 10. Mean, maximum, and minimum values of bid-ask spreads (with the flexible market maker).
MeanMaxMin
8.03 JPY/kWh16.00 JPY/kWh0.01 JPY/kWh
Table 11. Comparison of executed volumes for the three cases.
Tradable Volume if
All Orders Are Executed
Case 1:
without
Market Makers
Case 2:
with Simple
Market Maker
Case 3:
with Flexible
Market Maker
950.3 kWh268.7 kWh
(28.3%)
950.3 kWh
(100.0%)
470.4 kWh
(49.5%)
Table 12. Comparison of change rates of executed prices for the three cases.
MeanVariance
(Standard Deviation)
MaximumMinimum
Case 1: Without
Market Makers
−0.00430.0085
(0.0922)
0.354
(35.4% up)
−0.267
(26.7% down)
Case 2: With Simple
Market Maker
0.00010.0018
(0.0429)
0.295
(29.5% up)
−0.164
(16.4% down)
Case 3: With Flexible
Market Maker
0.00270.0053
(0.0729)
0.231
(23.1% up)
−0.196
(19.6% down)
Table 13. Profit/loss of market makers with respect to different supply–demand ratios.
Generation/Demand
= 100/100 = 1
Generation/Demand
= 130/100 = 1.3
Generation/Demand
= 70/100 = 0.7
Generation/Demand
= 40/100 = 0.4
Simple
Market Maker
2029.80 JPY−6281.62 JPY−7406.00 JPY−16773.05 JPY
Flexible
Market Maker
2900.04 JPY520.54 JPY453.72 JPY−3367.36 JPY
Publisher’s Note: MDPI stays neutral with regard to jurisdictional claims in published maps and institutional affiliations.

