Article

Effects of Pore Structure and Pore Size of Expanded Graphite on the Properties of Paraffin Wax/Expanded Graphite Composite Phase Change Materials

1
Department of Energy Materials & Chemical Engineering, Hefei University, Hefei 230601, China
2
School of Materials Science and Engineering, Shanghai University, Shanghai 200444, China
3
School of Environment and Chemical Engineering, Anhui Vocational and Technical College, Hefei 230011, China
*
Authors to whom correspondence should be addressed.
Energies 2022, 15(12), 4201; https://doi.org/10.3390/en15124201
Submission received: 4 May 2022 / Revised: 30 May 2022 / Accepted: 2 June 2022 / Published: 7 June 2022

Abstract

:
In order to study the effects of the pore structure and pore size of porous carrier material on the phase transformation behavior of composite phase change materials (CPCMs), the pore structure and pore sizes of three different sizes of expanded graphites (EGs) (50, 80, 100 mesh) were studied using N2 adsorption-desorption isotherms and scanning electron microscopy. Then, the thermal characterization of CPCMs prepared with paraffin wax and EGs were tested using differential scanning calorimetry and a thermal conductivity tester. The results showed that EG-50 had a more web-like pore structure, and thus, higher adsorption capacity for paraffin wax. The addition of EG could reduce the supercooling degree of CPCMs and improve the thermal conductivity of CPCMs. CPCM with EG-50 had better performance due to its large specific surface area and low interfacial resistance. Compared with paraffin wax, the phase transition temperature (ΔT) of CPCMs increased slightly and the latent heat of CPCMS decreased to varying degrees. As the pore size of EG decreased, its constraint on PCM increased, but ΔT of CPCMs decreased, which was due to the combination of phase transformation behavior of different components in paraffin wax, which violates the conventional change law. It could be seen that the phase change behavior of CPCMs was related not only to the pore size of EG but also to the composition of PCM.

1. Introduction

Phase change materials (PCMs) are materials that use the latent heat of phase change to store and release heat energy. According to the states of materials before and after phase change, PCMs are divided into solid–liquid, liquid–gas, solid–gas, and solid–solid PCMs. Among them, solid–liquid PCMs are the most widely used, but since the liquid phase will be produced in the process, PCMs must be encapsulated. The appearance of shaped PCMs can prevent the possible liquid leakage of PCMs in the process of solid–liquid phase change. The simplest way to prepare shaped PCMs is to combine the PCM with a porous carrier material, and the molten phase change material is spontaneously pulled into the porous material via capillary force and surface tension [1,2,3,4,5,6,7].
EG is one of the most promising carbon-based porous materials. It can keep the liquid PCM in the porous structure via capillary force and surface tension so as to avoid the decrease in heat storage capacity caused by the PCM leakage. Moreover, the thermal conductivity of EG is much higher than that of pure PCMs, so adding EG to PCMs can improve the thermal conductivity of PCMs. In addition, porous support materials in pure PCMs can form complex contact surfaces and angles to promote nucleation and reduce undercooling [8,9,10,11,12,13,14,15,16].
Xu et al. [17] Prepared a D-Mannitol/EG CPCM for solar thermal energy storage or waste heat recovery at 180~240 °C. D-Mannitol was evenly dispersed in micropores. The phase transition temperature of the CPCM was close to that of D-Mannitol, and its latent heat was equal to the calculated value based on the mass fraction of D-Mannitol in the composite. Singh et al. [18] prepared solid neopentyl glycol/EG CPCM and studied its properties. The results showed that the latent heat of phase change of CPCM was reduced, and the thermal conductivity was increased by 10 times, compared with solid neopentyl glycol. Yang et al. [19] prepared polyethylene glycol (PEG)/EG composites by vacuum impregnation. The experimental results showed that expanded graphite was a mesoporous material with a developed porous structure and amazing adsorption capacity. The phase transition temperature and the latent heat of the CPCMs were in the range of 18.89~25.93 °C and 97.56~98.59 J/g, respectively, which had good thermal stability. Hao Zhou et al. [20] prepared xylitol/EG CPCMs with contents of 5, 8, 10, 12 and 15%, respectively, by the “impregnation compression” two-step method. The results showed that xylitol could be well impregnated into the micropores of EG and had good chemical compatibility. The experimental results showed that the latent heat of 10 wt% EG is 209.73 J/g and 192.18 J/g, respectively, during the charging and discharging process. The thermal conductivity of 10 wt% EG is 3.91 W/(m·K), 9.29 times as xylitol. Xie et al. [21] developed a novel kind of composite PCM using modified expanded graphite to adsorb K2 HPO4·3H2O–NaH2PO4·2H2O–Na2SO3·5H2O–H2O eutectic salt by the impregnation method. The results showed that within 120 min, the adsorption capacity of MEG for eutectic salt is 75.33% higher than that of unmodified expanded graphite (EG). The composite PCM has a phase change temperature of −5.30 °C, a large latent heat of 161.8 J/g, and a low supercooling degree of 1.83 °C. The thermal conductivity of the composite PCM is 13.3 times as large as that of the eutectic salt. Kenisarin et al. [22] studied the effect of EG on the thermal conductivity of paraffin/EG composites. The results showed that the thermal conductivity of paraffin/EG composites increased with the increase in the mass fraction of EG. When the mass fraction of EG was 6%, the thermal conductivity increased from 0.258 W/m °C for pure paraffin to 0.977 W/m °C for the PCM with A-type EG and to 1.263 W/m °C for the composition with B-type EG. Wang et al. [23] prepared five paraffin/EG composites with 2 wt%, 5 wt%, 10 wt%, 15 wt% and 20 wt% of EG. The effects of thermal cycles (up to 100 thermal cycles) on the thermophysical properties of the composites, such as phase transition temperature, latent heat, chemical compatibility, thermal stability and thermal conductivity, were studied. The results showed that after 100 thermal cycles, the phase transition temperature and latent heat decreased slightly, by 1% and 3%, respectively. Long-term thermal cycling also had a more negative effect on the increase in higher thermal conductivity.
To sum up, the current research mainly focuses on the preparation and properties of the CPCMs of EG and organic PCMs (or inorganic PCMs). The Clapeyron equation points out that the phase transition process of matter will be affected by the temperature and pressure of the environment. Therefore, the phase change behavior of PCMs in porous media is bound to be constrained and regulated by the restrictive pore space in porous media, which is different from that in the free state [24]. That is, the pore structure of EG will affect the properties of the CPCMs, especially when several PCMs are mixed together to obtain different phase change temperatures. So, how does the pore structure of EG adjust the phase change behavior of the CPCMs? There is little research on this aspect [25,26].
Based on the above research, three kinds of EGs with different particle sizes (50, 80, 100 mesh) were prepared by the high-temperature expansion method, and CPCMs with stable shapes were prepared from EG and paraffin wax. The effects of pore structure and size on the thermal properties and thermal stability of composites were studied by the Brunauer–Emmett–Teller (BET), scanning electron microscopy (SEM), X-ray diffraction analysis (XRD), differential scanning calorimetry (DSC), and thermal conductivity meter (DRE-2C).

2. Materials and Methods

2.1. Materials

Paraffin wax was purchased from Shanghai Yi Yang Instrument Co., Ltd. (Shanghai, China) with a melting point of 48~50 °C and a swelling rate of 0.13 mL/g, as the PCM for this study. Expandable graphite of different sizes (50, 80, 100 mesh), denoted as EG-50, EG-80 and EG-100, were supplied by Qingdao Teng Sheng Da Tan Su Ji Xie Co., Ltd. (Qingdao, China). The carbon content is 99%, the expandable ratio of EG-50 and EG-80 was 200~300 mL/g, and the expandable ratio of EG-100 was 100~200 mL/g. All the chemicals were used as received without further purification.

2.2. Preparation of EG

Expandable graphite (See Figure 1a) was dried at 70 °C for 24 h to obtain dry expandable graphite. A quartz beaker was heated in a high-temperature furnace at 900 °C for 5 min, then, the dry expandable graphite was immediately put into the quartz beaker, the furnace door was closed and expanded for 30 s to obtain EG (See Figure 1b). The expansion ratio of EG was measured as follows: 0.10 g EG in a 50 mL quartz beaker was heated at 900 °C for 30 s, and then the volume of the obtained EG was precisely read (the average value of the scale corresponding to the highest point and lowest point). The procedure was repeated five times for each sample and the standard deviation was less than 6%. The obtained mean volume value divided by 0.10 g resulted in the expansion ratio of EG as mL/g [27]. The expansion ratios of EG-50, EG-80 and EG-100 were 283 mL/g, 271 mL/g and 142 mL/g, respectively.

2.3. Preparation of Paraffin/EG CPCMs

A series of paraffin/EG CPCMs were prepared by a simple impregnation method. First, paraffin wax (1.3 g, 1.4 g, 1.5 g, and 1.6 g) was melted in a constant temperature drying oven at 70 °C for 2 h. This solution was added to 0.1 g of EG-50 for mixing and stirring. Then, the mixture was placed in a constant temperature drying oven at 70 °C for 8 h. At one-hour intervals, these samples were stirred manually for about two minutes to obtain the fully absorbed shape-stabilized CPCMs. Next, the mixture was removed and cooled naturally at room temperature to obtain paraffin/EG CPCMs (See Figure 1c). Finally, the paraffin/EG CPCMs were placed on filter paper and into a constant temperature drying oven at 70 °C for leak-proof experiments to obtain the maximum adsorption capacity of paraffin wax using EG-50. Considering the relationship between the adsorption capacity of paraffin wax and the expansion ratio, the amount of paraffin wax was adjusted to (1.2 g, 1.3 g, 1.4 g and 1.5 g) for EG-80 and (1.0 g, 1.1 g, 1.2 g, 1.3 g, and 1.4 g) for EG-100.

2.4. Characterization of CPCMs

The physical adsorption method is generally used to determine the specific surface area and pore structure of porous materials. In this study, N2 adsorption-desorption isotherms were determined at 77 K using the Automatic Specific Surface and Porosity (TriStar3020, Mack Instruments, Inc., Atanta, GA, USA). The BETand Barrett–Joyner–Halenda (BJH) methods were used to calculate the specific surface area and pore size distribution of the samples, respectively.
X-ray diffraction analysis can qualitatively analyze the crystal structure of substances. In this study, the crystalline properties and chemical compatibility of EG-50, EG-80, EG-100 and paraffin/EG CPCMs were determined using X-ray diffraction (smartlab SE, RIGAKU, Tokyo, Japan), mainly to analyze whether paraffin phase change materials and EG were just simple physical adsorption and whether a chemical reaction occurs to generate new substances after compounding, so as to determine its stability and chemical compatibility.
Scanning electron microscope (SEM) is commonly used to understand micro-morphological analysis. In this study, the surface morphology of the EG and paraffin/EG CPCMs were observed using the SEM (S4800, Hitachi, Tokyo, Japan). The observations were performed at different magnifications with different acceleration voltages.
DSC is used to determine the thermal properties of materials. In this study, the thermal properties of paraffin/EG were determined using DSC (DSC200F3, NETZSCH, Selb, Germany) in the temperature range from 0 to 90 °C at a heating/cooling rate of 10 °C/min under nitrogen.
The thermal conductivities of the paraffin/EG CPCMs were measured with a Hot Disk probe and thermal conductivity tester (DRE-2C, Xiangtan Instrument Co., Ltd., Xiangtan, China). Before testing, the samples were pressed into a cylindrical shape with a diameter of 50 mm and a height of 15 mm by a tablet press. The tests were run three times, and the average value was taken to ensure that the measured results of thermal conductivity were accurate and repeatable.

3. Results

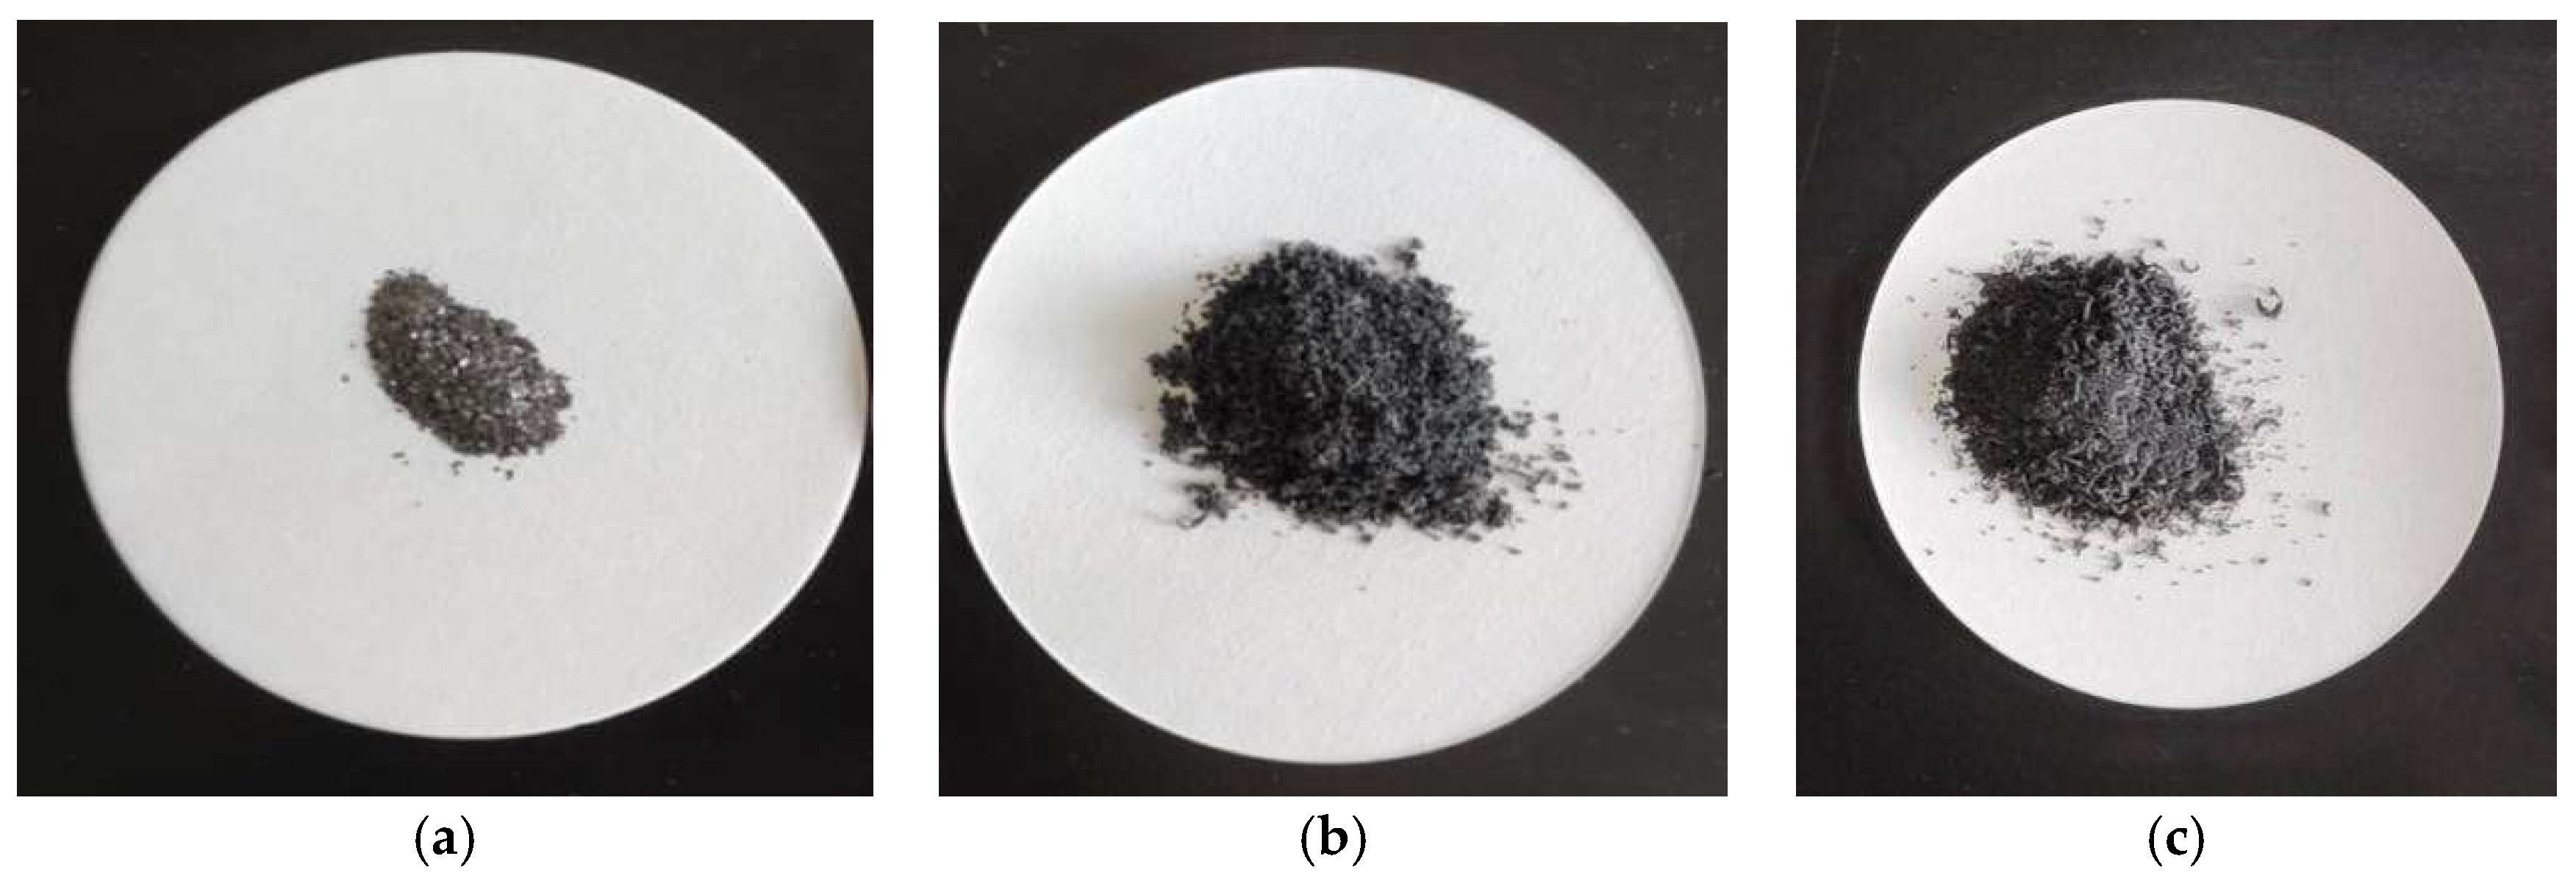
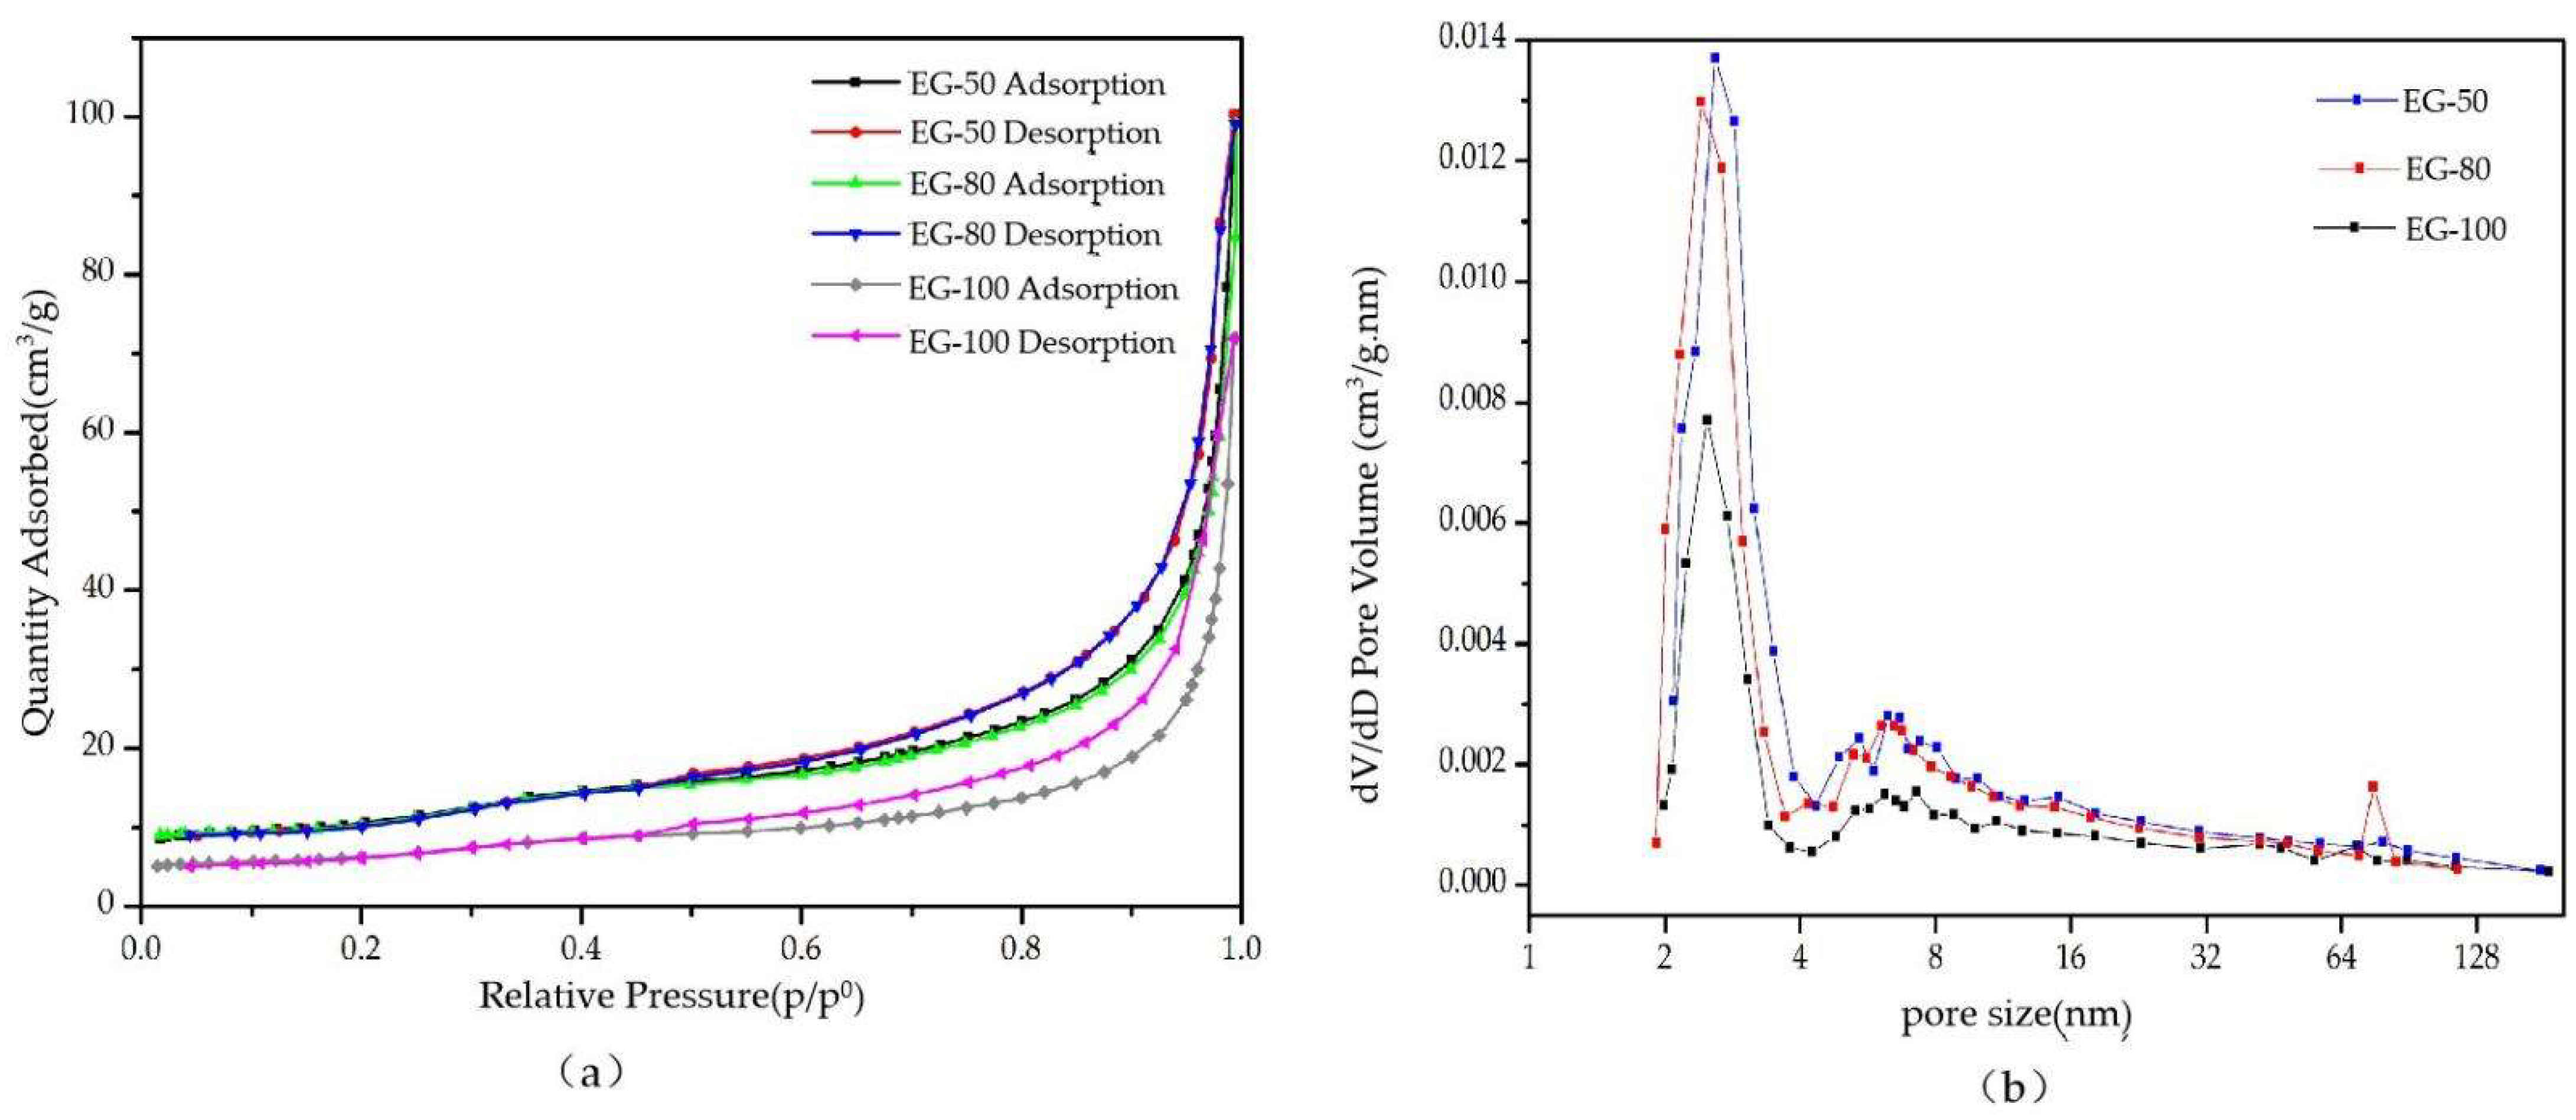
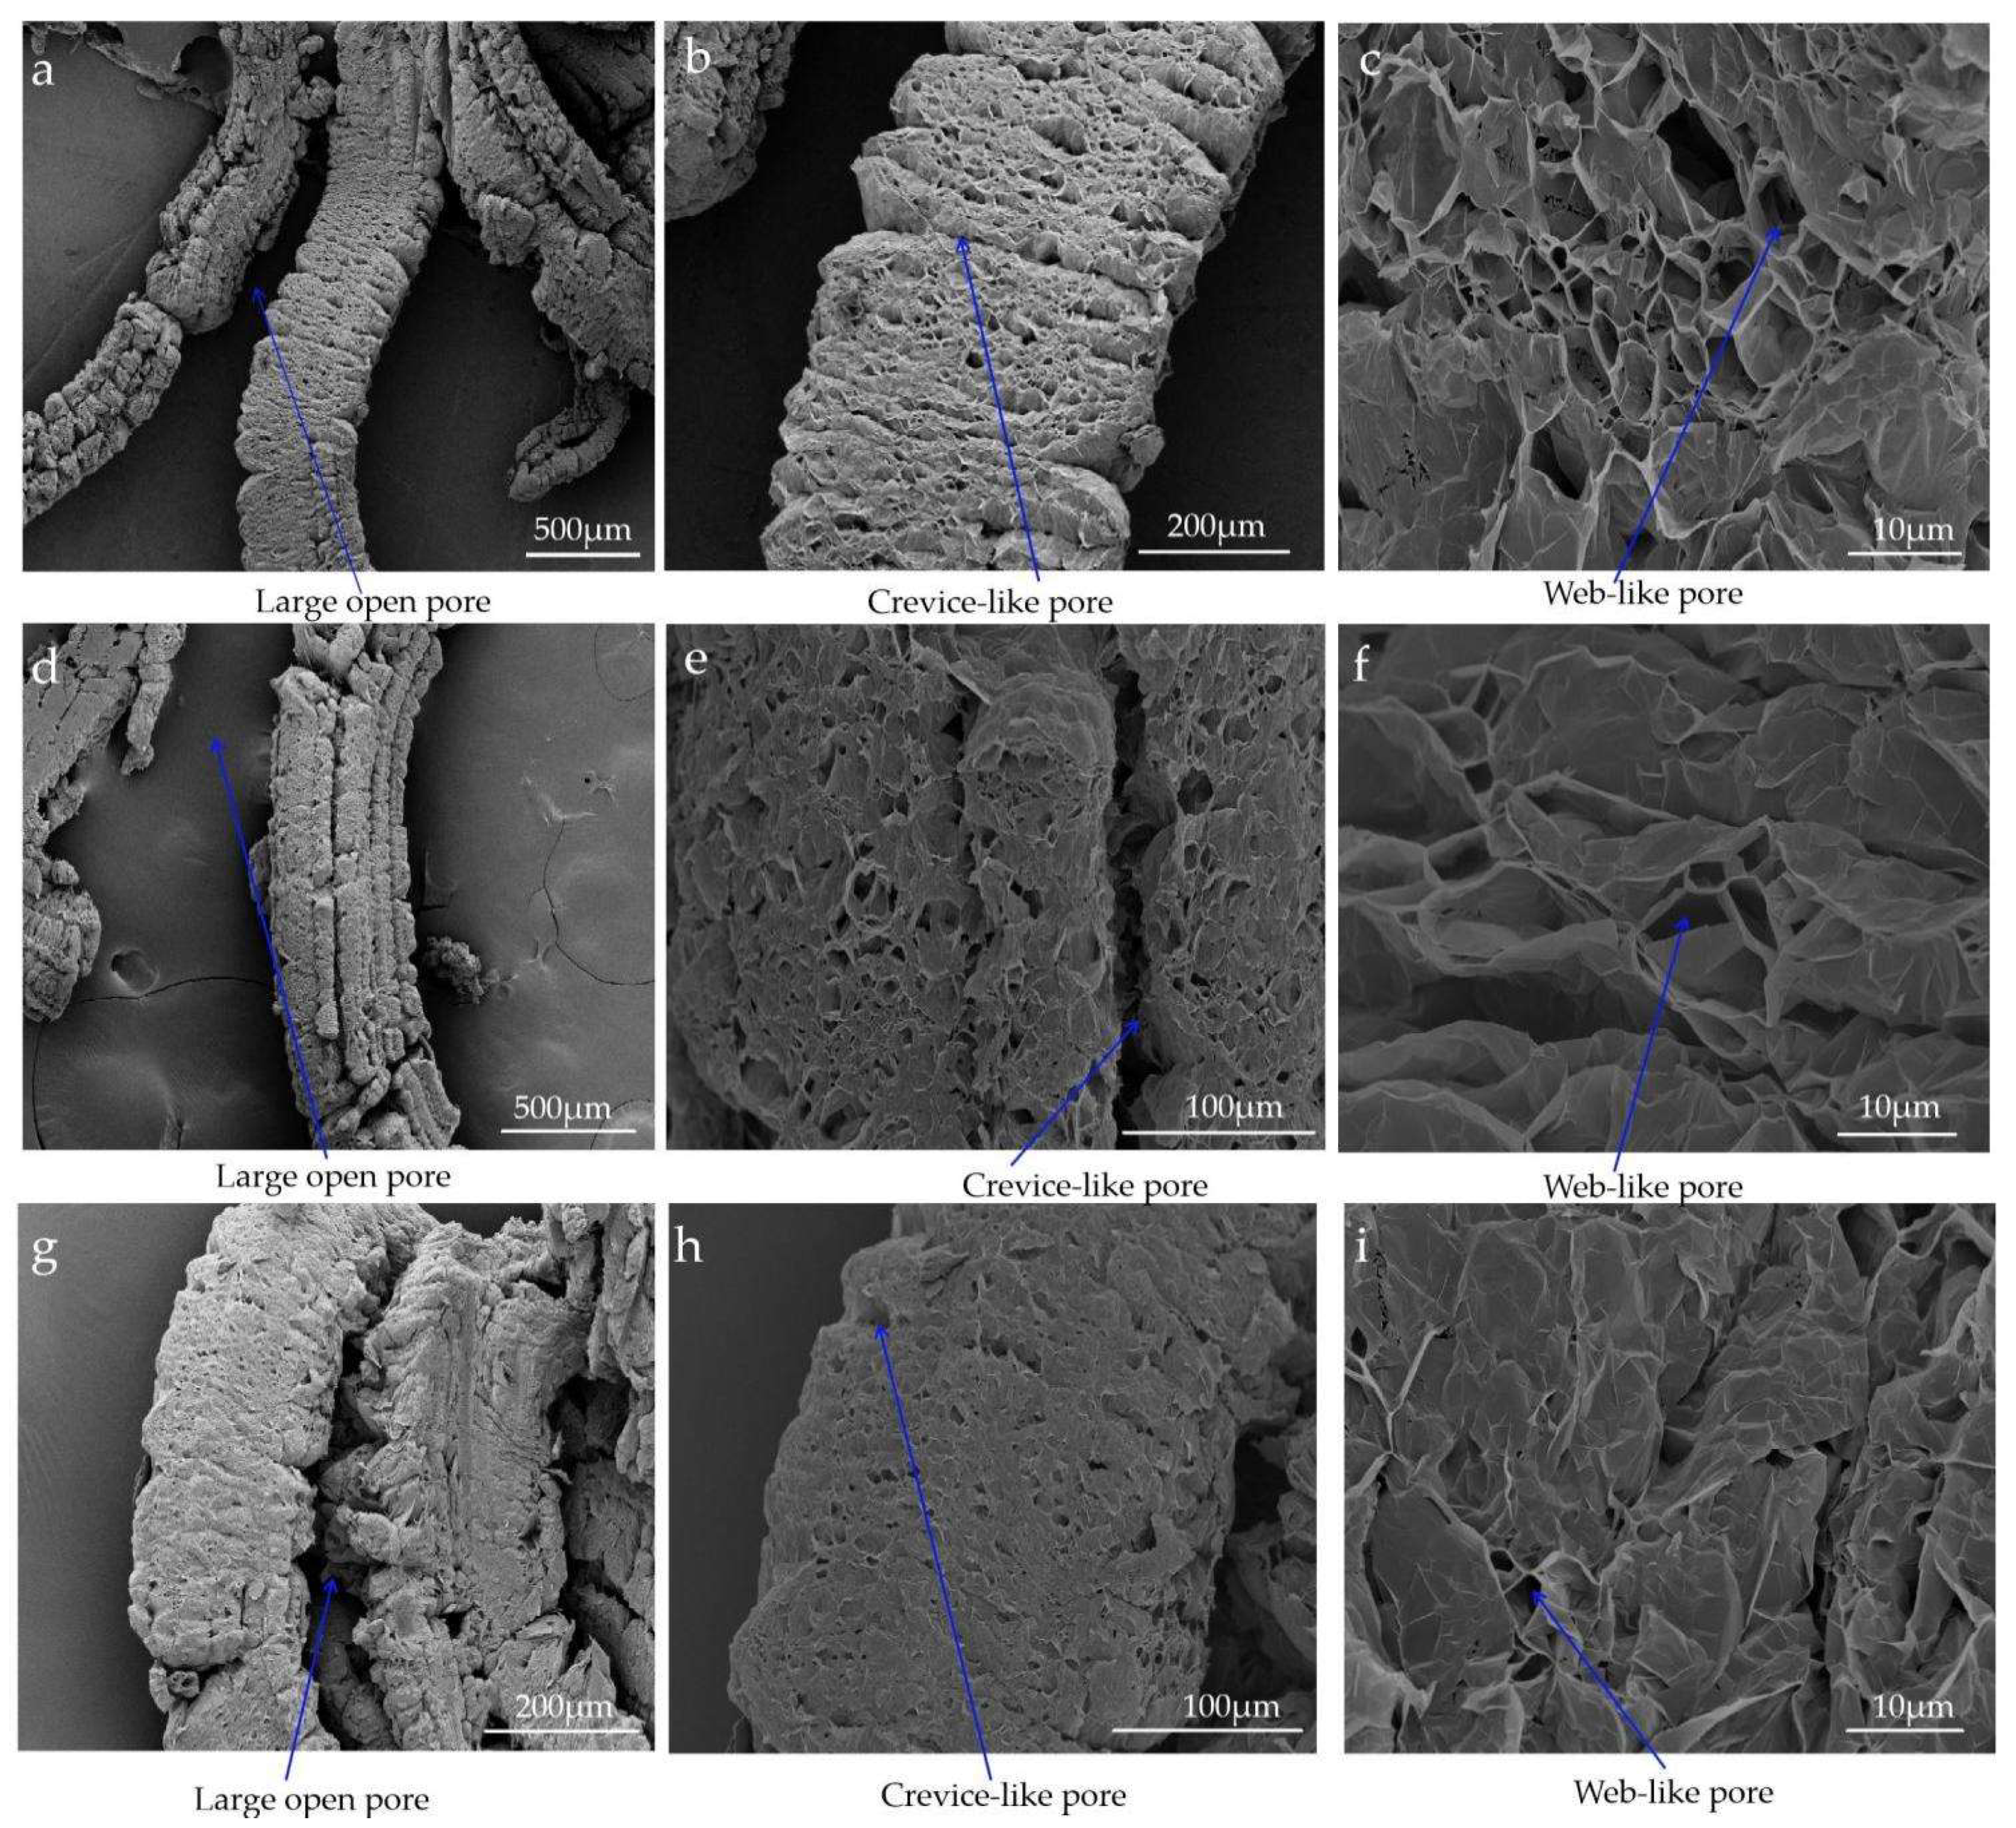
3.1. Pore Structure Analysis

For a certain adsorbate, the adsorption capacity is directly proportional to the pore volume, and the pore size is also an important factor affecting the adsorption performance of EG. Therefore, the pore structures of EG-50, EG-80 and EG-100 were studied by N2 adsorption and desorption at 77 K Figure 2a. It could be seen that the N2 adsorption isotherms of EG-50, EG-80 and EG-100 slowly increased at initial relative pressures (p/p0). At this time, N2 molecules were adsorbed on the inner surface of the mesopores from the single layer to the multilayer. When p/p0 = 0.5~0.9, the adsorption capacity increases rapidly. It can be seen that the mesopore distribution range was wide. When p/p0 was greater than 0.9, the adsorption capacity sharply increased, indicating the existence of macropores greater than 50 nm. There were H3 type hysteresis loops on them, which was related to capillary condensation in mesopores, indicating that EG-50, EG-80 and EG-100 contain mesoporous structures, which was proven by their pore size distributions in Figure 2b. It could be seen from Figure 2b that the pore size distribution of EG with three particle sizes was mainly in the range of 2~4 nm and 4~8 nm, which belonged to mesoporous, there were some macropores with a particle size above 50 nm, and EG-50 had the largest number of mesopores. The corresponding pore structure parameters are summarized in Table 1. The BET specific surfaces (SBET) of EG-50, EG-80 and EG-100 were 36 m2/g, 35 m2/g and 21 m2/g, respectively, with corresponding pore volumes (Vp) of 0.1551 cm3/g, 0.1531 cm3/g and 0.1112 cm3/g, respectively. These results indicated that the SBET and Vp of EG increase with the increase in particle size and expansion ratio of EG. Eg-50 had the smallest pore diameter because of a large specific surface. It is generally believed that the large surface area and pore volume of EG is beneficial to absorbing PCM by the actions of capillary forces and surface tension, leading to higher adsorptive capacities of EG-50 for PCM.

3.2. Leak Test Analysis

The composite process of paraffin wax and EG is mainly adsorption and pore filling, in which pore filling accounts for the main part. When the solid–liquid phase transition occurs in paraffin wax, the volume of paraffin wax increases significantly. Due to the small van der Waals force, it may lead to paraffin wax leakage. Moreover, the paraffin wax adsorbed in the pores may also leak by overcoming the capillary force. Therefore, in order to maintain a good setting effect, the adsorption capacity of expanded graphite to paraffin must have an optimal value.
The prepared composites, paraffin/EG-50, paraffin/EG-80 and paraffin/EG-100, were placed on filter paper and into an oven at 70 °C for 2 h to ensure that the solid-liquid phase transition occurred. Then, observations were performed to determine whether there was paraffin wax leakage on the filter paper. The experimental results are shown in Figure 3. Clearly, it could be seen that the upper limits in EG-50, EG-80 and EG-100 were 1.4 g, 1.3 g and 1.1 g, respectively. It could be seen that the adsorption capacity of EG was positively correlated with expansion ratio, specific surface area, and pore volume. Consistent with the above analysis results, EG-50 had the largest adsorption capacity for paraffin wax because it had a larger specific surface area and pore volume than EG-80 and EG-100. According to the above analysis results, 0.1 g EG-50, EG-80 and EG-100 were adsorbed with 1.4 g, 1.3 g and 1.1 g paraffin wax to prepare paraffin/EG-50, paraffin/EG-80 and paraffin/EG-100 CPCMs, respectively, for morphological analysis.

3.3. XRD Patterns Analysis

The properties of EG and paraffin wax determine the comprehensive properties of the composites, and whether there is a chemical reaction in the composite also affects the properties of the materials. For the chemical compatibility of the composites, XRD was used for characterization. Through the comparative analysis of the spectral peaks, the composition of the materials in the composite phase change materials was judged, and whether there was a chemical reaction to produce new substances was analyzed. The XRD patterns of EGs, paraffin wax and paraffin/EG CPCMs are shown in Figure 4. As shown in the curve of paraffin/EG-50, paraffin/EG-80 and paraffin/EG-100, the XRD patterns include three peaks, which are just the combination of the characteristic peaks from paraffin and EG. No new diffraction peak was found in the XRD pattern of the three paraffin/EG CPCMs. However, because the EG-50, EG-80 and EG-100 were filled with paraffin, the diffraction peak intensity of EG-50, EG-80 and EG-100 decreased obviously, and the less EG in the paraffin/EG CPCMs, the more the peak strength decreased. XRD analysis shows that there was only physical interaction caused by capillary force and surface tension between paraffin and EG, but no chemical interaction.

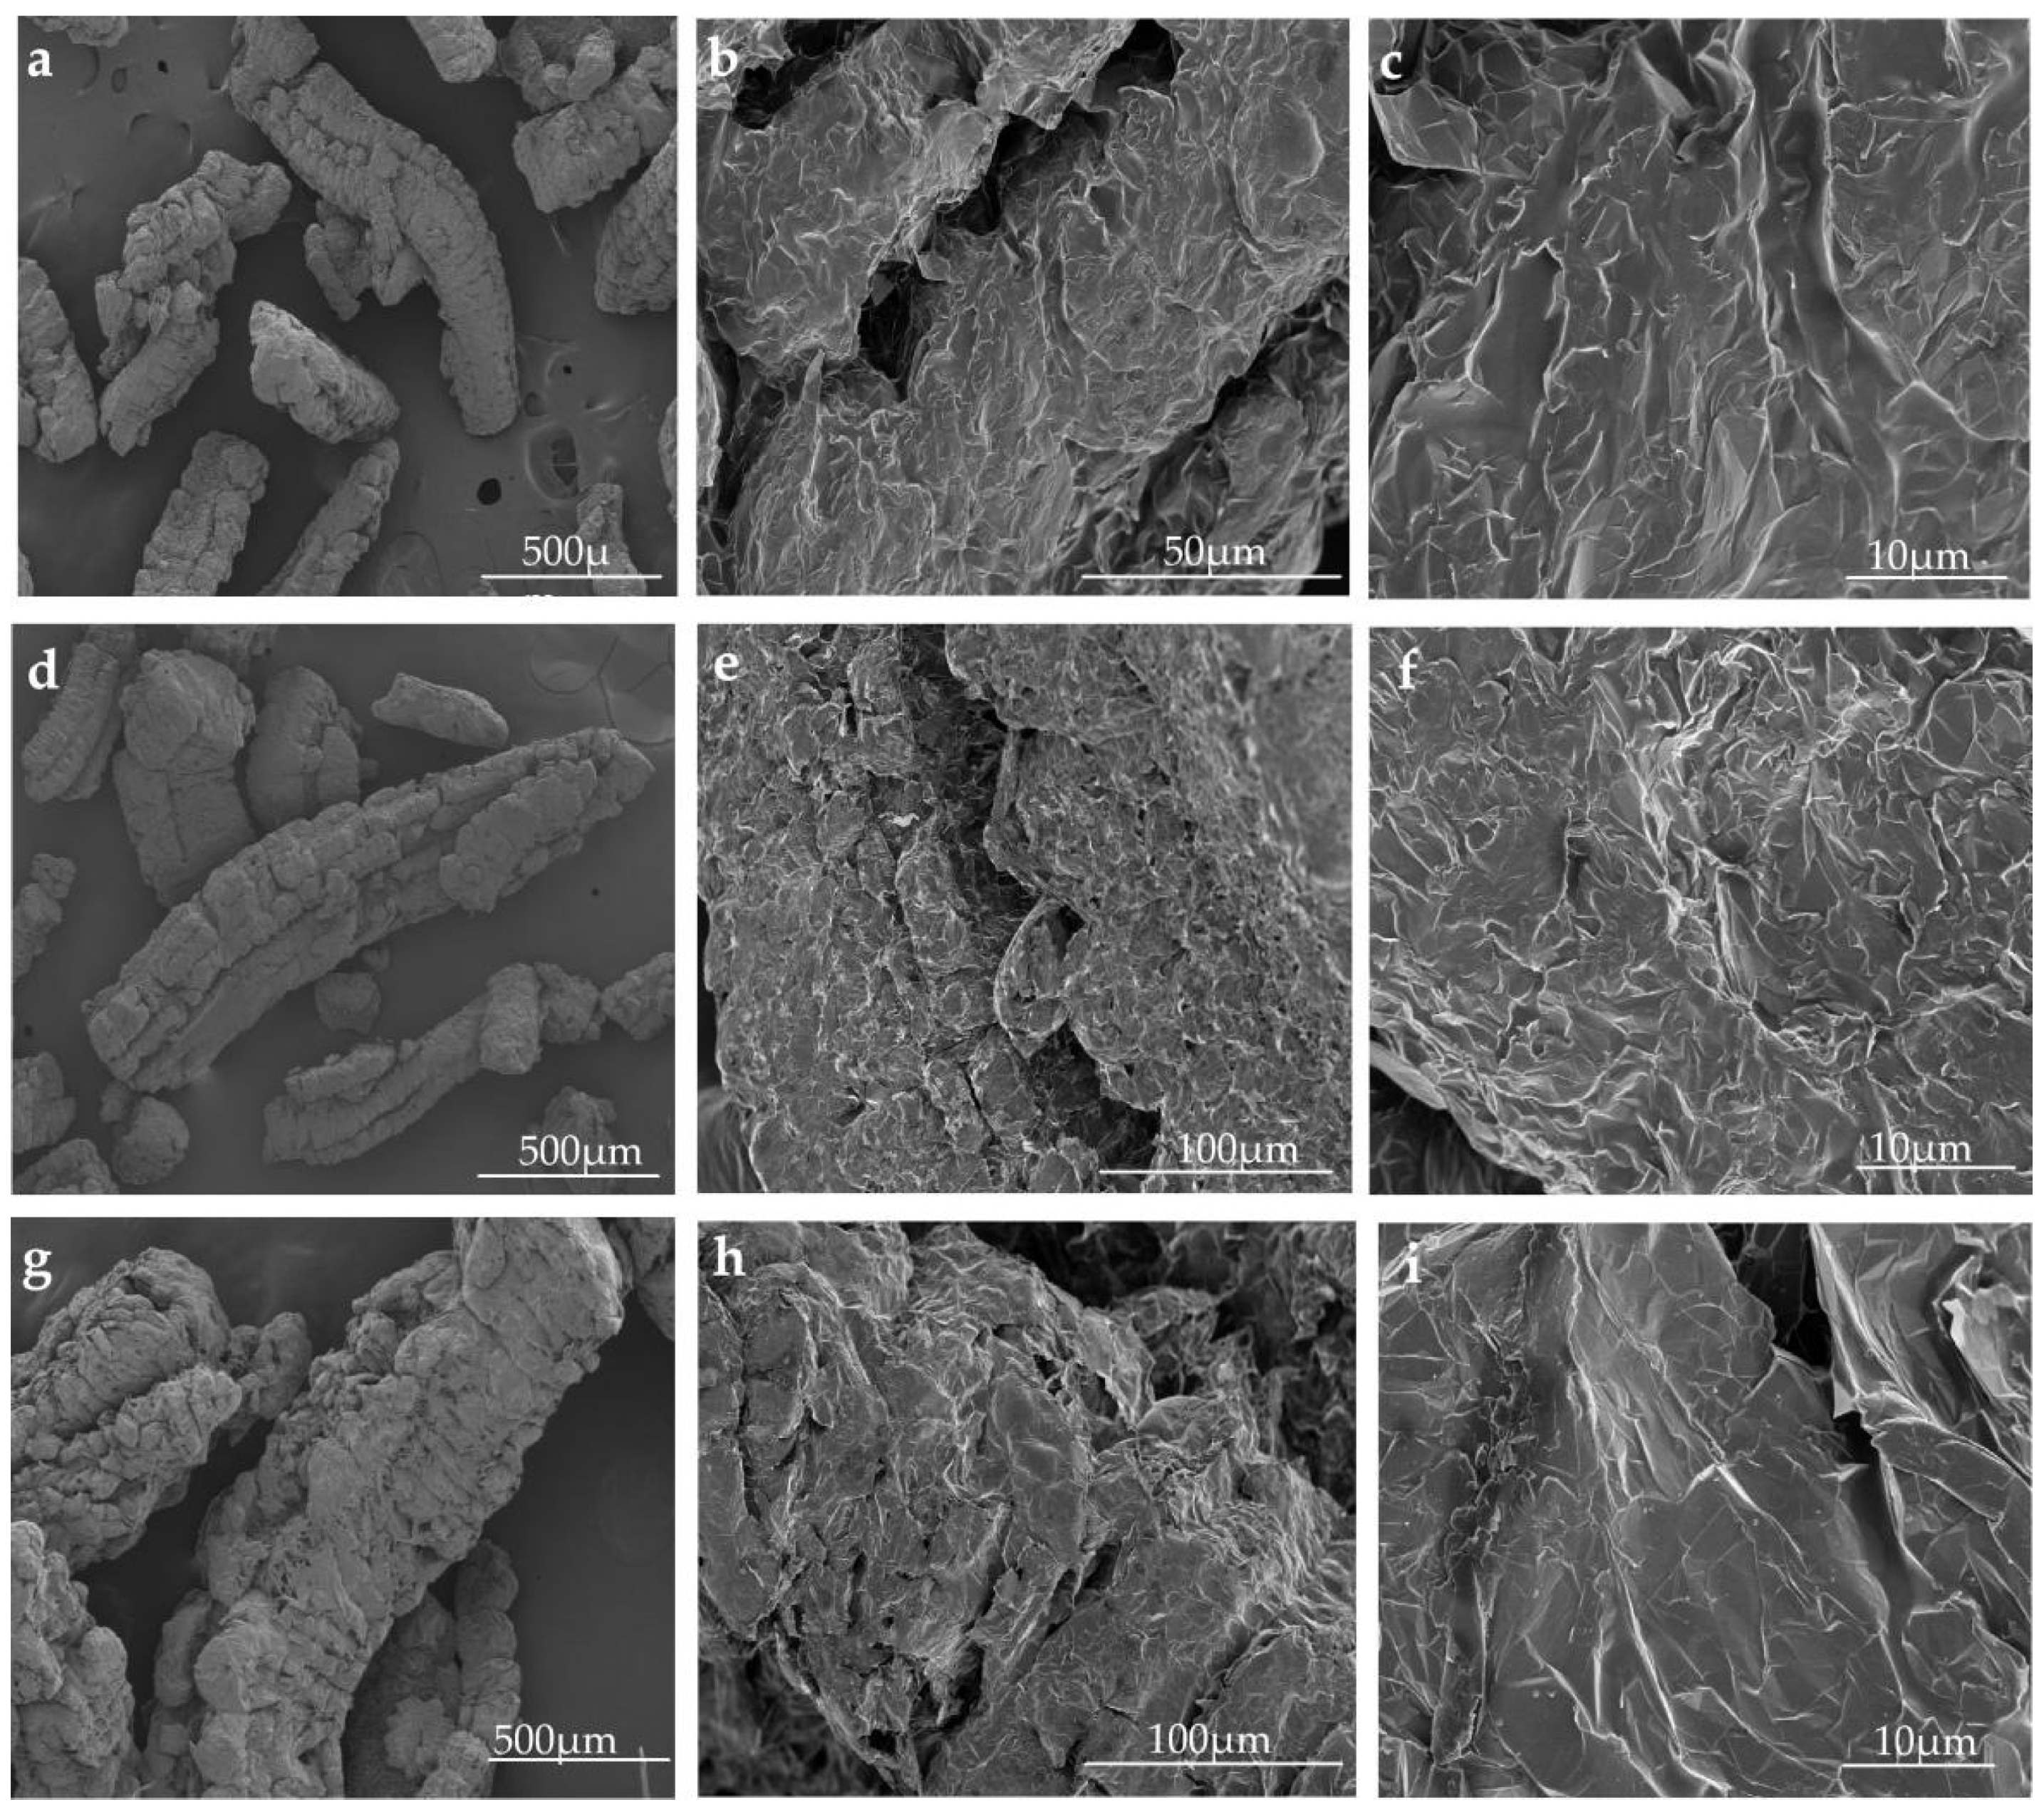
3.4. Morphological Analysis

SEM is mainly used to analyze the microstructure of samples. By observing the microstructure of EG and the adsorption of EG for paraffin wax at different magnification, the composite degree of EG and paraffin wax with different particle sizes is deeply studied from the perspective of microstructure. SEM images displaying the morphologies of EG-50, EG-80 and EG-100 are shown in Figure 5. As could be seen from the figure, EG-50, EG-80 and EG-100 all displayed a worm-like structure with a large number of folds on the surface, which greatly increased the specific surface area of the EG. After graphite expansion, three pore structures were formed, namely, the large open pore of the graphite worm, the crevice-like pore of the graphite worm, and the web-like pore structure of the graphite worm. The former existed between graphite worms, and the latter two types existed inside graphite worms. The crevice-like pore of graphite worms referred to the crack-like pores on the surface of EG worms, which were formed by the expansion of large lamellae of expandable graphite. These cracks were long and continuous. The web-like pore structure of the EG worms referred to the open, semi-open and closed network structure units connected with each other in EG. From Figure 5c,f,i, with decreasing particle size, the web-like pore structure of EG gradually decreased. SEM images displaying the morphologies of paraffin/EG-50, paraffin/EG-80 and paraffin/EG-100 are shown in Figure 6. As observed in Figure 6a,d,g paraffin/EG CPCMs also displayed a typical worm-like structure. As observed in Figure 6b,c,e,f,h,i Paraffin wax was adsorbed in the web-like pore structure of EG, and the other two-pore structures could not fully adsorb paraffin wax. This is because, in the preparation process of composites, paraffin wax is mainly driven into the pores of EG through a capillary effect. According to the capillary effect formula:
h = 2 γ cos θ ρ g r
where h is capillary force, γ is the surface tension, θ is the contact angle, ρ is the density of paraffin wax, g is the acceleration of gravity, and r is the radius of the thin tube.
When the physical parameters of EG and paraffin wax remain unchanged, the capillary adsorption capacity is only related to the thin tube radius r, that is, it depends on the pore diameter of EG. The smaller the pore diameter of EG, the more conducive to the capillary effect and improve the filling efficiency of paraffin wax in EG. Paraffin wax is not easy to leak during phase transformation. So, the adsorption capacity of Eg-50 was superior to EG-80 and EG-100 because of its small average pore diameter, which was consistent with the leakage experimental results. The different grades of pore played different roles in the adsorption of EG. The large open pore and the crevice-like pore provided a path for adsorbate molecules to enter the adsorbent. The web-like pore constituted a unique storage space. The combined action of three pore structures is the main reason for the super large adsorption performance of EG.

3.5. Thermal Characterization Analysis

In order to study the effect of particle size on the phase change behavior of the paraffin/EG CPCMs, the same amount of paraffin wax (1.1 g) was added to three kinds of EG with different particle sizes (50, 80, 100). The prepared CPCMs were named paraffin/EG-50 (1.1), paraffin/EG-80 (1.1) and paraffin/EG-100 (1.1), respectively. The DSC curves of paraffin wax and paraffin/EG CPCMs are shown in Figure 7. Since the paraffin wax used in this study was a mixture of hydrocarbons with different carbon contents, it could be observed that there were two obvious peaks on the DSC curve of paraffin wax, where the former undergoes a solid–solid phase transition near 34 °C and the latter showed a solid–liquid phase transition near 50 °C. The curve shape of CPCMs was similar to that of paraffin wax, and all curves contained two phase transition peaks. Through comparison, it was found that the peak area of the endothermic peak of solid–liquid phase transition was significantly larger than that of solid–solid phase transition, which indicated that paraffin wax mainly depends on solid–liquid phase transition for energy storage and release. Therefore, the effect of EG on solid–liquid phase transition behavior was mainly studied.
The thermal properties are listed in Table 2. By comparing Tm−2 and Ts−2, it could be seen that the supercooling degree of CPCMs was significantly lower than that of paraffin wax. This was due to the fact that a large number of heterogeneous nucleation centers were provided on the surface after the addition of EG, which promoted the nucleation and crystallization of paraffin wax. It was reported that the carbon matrix with a high specific surface is beneficial to inhibiting the supercooling degree of the PCM, which could form more contact surfaces and angles to promote nucleation and reduce supercooling degree [28]. According to the pore structure analysis above, with the increase in particle size, the specific surface area decreased. Therefore, EG-50 was more effective in reducing the supercooling degree of CPCMs.
The phase change temperature (ΔT) of PCMs is one of the important factors that determine the performance of materials. It was observed that the Tm−2 values of CPCMs were slightly higher than those of only paraffin wax. According to Radhakrishnan’s theory [29], after the PCM was combined with the porous medium, its ΔT was directly proportional to the interaction force between the PCM and the porous medium. Because the paraffin wax and EG were combined through physical action, the physical action between them is very small, so the melting point of the CPCM showed a downward trend. On the contrary, according to the Clapeyron equation, When the PCM melts in the pores of EG, its volume becomes larger, which was constrained by the pores of EG to produce additional stress, resulting in the increase in pressure and the corresponding increase in temperature. Due to the combined action of these two factors with completely opposite effects, the change of ΔT of CPCMs was small. Moreover, the constraints of pores with different pore diameters on the change of phase-change volume are different. With the decrease in pore diameter, its constraint on the change of phase-change volume would increase. Moreover, the constraints of pores with different pore diameters on the change of phase-change volume were different. With the decrease in pore diameter, its constraint on the change of phase-change volume would increase. EG-50 had a small pore size, but ΔT of cpcm with EG-50 increases less. The reason might be related to the composition of paraffin wax. Paraffin wax is a mixture of alkanes, including straight-chain normal alkanes, isoalkanes and cycloalkanes. The phase transition behavior of paraffin wax was the composite result of multi-component phase transition behavior. The phase transformation behavior of different components in paraffin had changed differently in porous media, which led to the phase transformation behavior formed by their recombination, which violates the conventional change law, which was possible.
As observed in Table 2, the latent heat (ΔH) of CPCMs was lower than that of the paraffin wax, which was attributed to the fact that EG does not contribute to the latent heat. Therefore, theoretically, ΔH of CPCMs should be directly proportional to the paraffin wax content, which could be calculated by the following formula:
Δ H t = ϕ Δ H p a r a f f i n
where ΔHt is the latent heat of CPCMs, φ is the percentage content of paraffin wax, and ΔHparaffin is the latent heat of phase transition of the paraffin wax.
It could be seen from Table 2 that the measured values of ΔH of composites prepared with EG-50, EG-80 and EG-100 as support materials were less than the theoretical values, and the gap with the theory was 1.02%, 1.93% and 16.70%, respectively. Due to the web-like pore structure of the graphite worm, it had a strong adsorption and fixation effect on paraffin molecules, which hindered the thermal diffusion movement of paraffin wax molecular segments and improved the reaction energy barrier in the phase change process, resulting in limited thermal movement ability of molecular segments in paraffin wax PCMs and less crystallization, whereby the measured ΔH was less than the theoretical value [24]. At the same time, EG was an interlayer compound of natural flake graphite treated with an acid oxidant. Paraffin wax was composed of hydrocarbon mixtures with different carbon contents. During the phase transition of paraffin wax, small molecular paraffin wax with less carbon content would enter the layered structure of EG and be arranged regularly, so as to improve the regularity of paraffin wax molecules and increase the crystallinity, and the ΔH would increase. The combined action of the two makes the measured value of ΔH basically consistent with the theoretical value, which was positively correlated with the content of PCM in the composite, such as CPCMs with EG-50 and EG-80. Due to the large pore diameter and small capillary force, EG-100 affects the regular arrangement of small molecular paraffin into the layered structure of expanded graphite, resulting in a large difference between the measured value and the theoretical enthalpy value.

3.6. Thermal Conductivity Analysis

The thermal conductivities of paraffin wax, paraffin/EG-50 and paraffin/EG-100 are shown in Figure 8. It could be seen from the figure that the thermal conductivities of paraffin wax, paraffin/EG-50 (1.1), paraffin/EG-80 (1.1) and paraffin/EG-100 (1.1) were 0.31, 0.81, 0.78 and 0.65 W/(m·K), respectively. Due to the addition of EG, the thermal conductivity of CPCMs was more than twice that of the paraffin wax. Meanwhile, the improvement effect of thermal conductivity induced by EG-50 surpassed that of EG-80 and EG-100, which might be due to the difference in interfacial thermal resistance. It could be seen that the thermal conductivity of composites was not only related to the addition of carbon materials but also related to their geometric differences such as size and shape. The small-size EG could form more interfaces with neighboring EG within the composites in comparison to a large-sized one when given the same content, thus leading to the increased interfacial thermal resistance resulting from enhanced phonon scattering at the interfaces of the smaller EG [30,31,32,33]. This also explained why the thermal conductivity of paraffin/EG-50 (1.1) was better than paraffin/EG-80 (1.1) and paraffin/EG-100 (1.1).

4. Conclusions

The Clapeyron equation points out that the phase change process of phase change materials will be affected by the temperature and pressure of the environment. Therefore, the phase change behavior of organic phase change materials in porous media will be constrained and regulated by the restrictive pore space in porous media, showing a phase change behavior different from that in the free state. Therefore, based on the study of the pore structure and pore size of EG with different particle sizes, the effects of pore structure and pore size on the phase transformation behavior of CPCMs were studied in this paper. The main conclusions are as follows:
  • Under the same expansion conditions, the larger the particle size of graphite, the larger the expansion ratio, the larger the specific surface area and pore volume, and the smaller the pore diameter.
  • After graphite with different particle sizes expanded, three pore structures were formed, namely, the large open pore of the graphite worm, the crevice-like pore of the graphite worm, and the web-like pore structure of the graphite worm. The pore size distribution of EG with three particle sizes was mainly in the range of 2~4 nm and 4~8 nm, which belonged to mesoporous, and there were some macropores with a particle size above 50 nm. EG-50 had a larger specific surface area, pore volume and web-like pore structure, and thus, higher adsorption capacity for paraffin wax. The different grades of pore played different roles in the adsorption of EG. Paraffin wax was only uniformly adsorbed in the web-like pore structure of EG through capillary force and surface tension, while the other two-pore structures only played the role of transporting adsorbate.
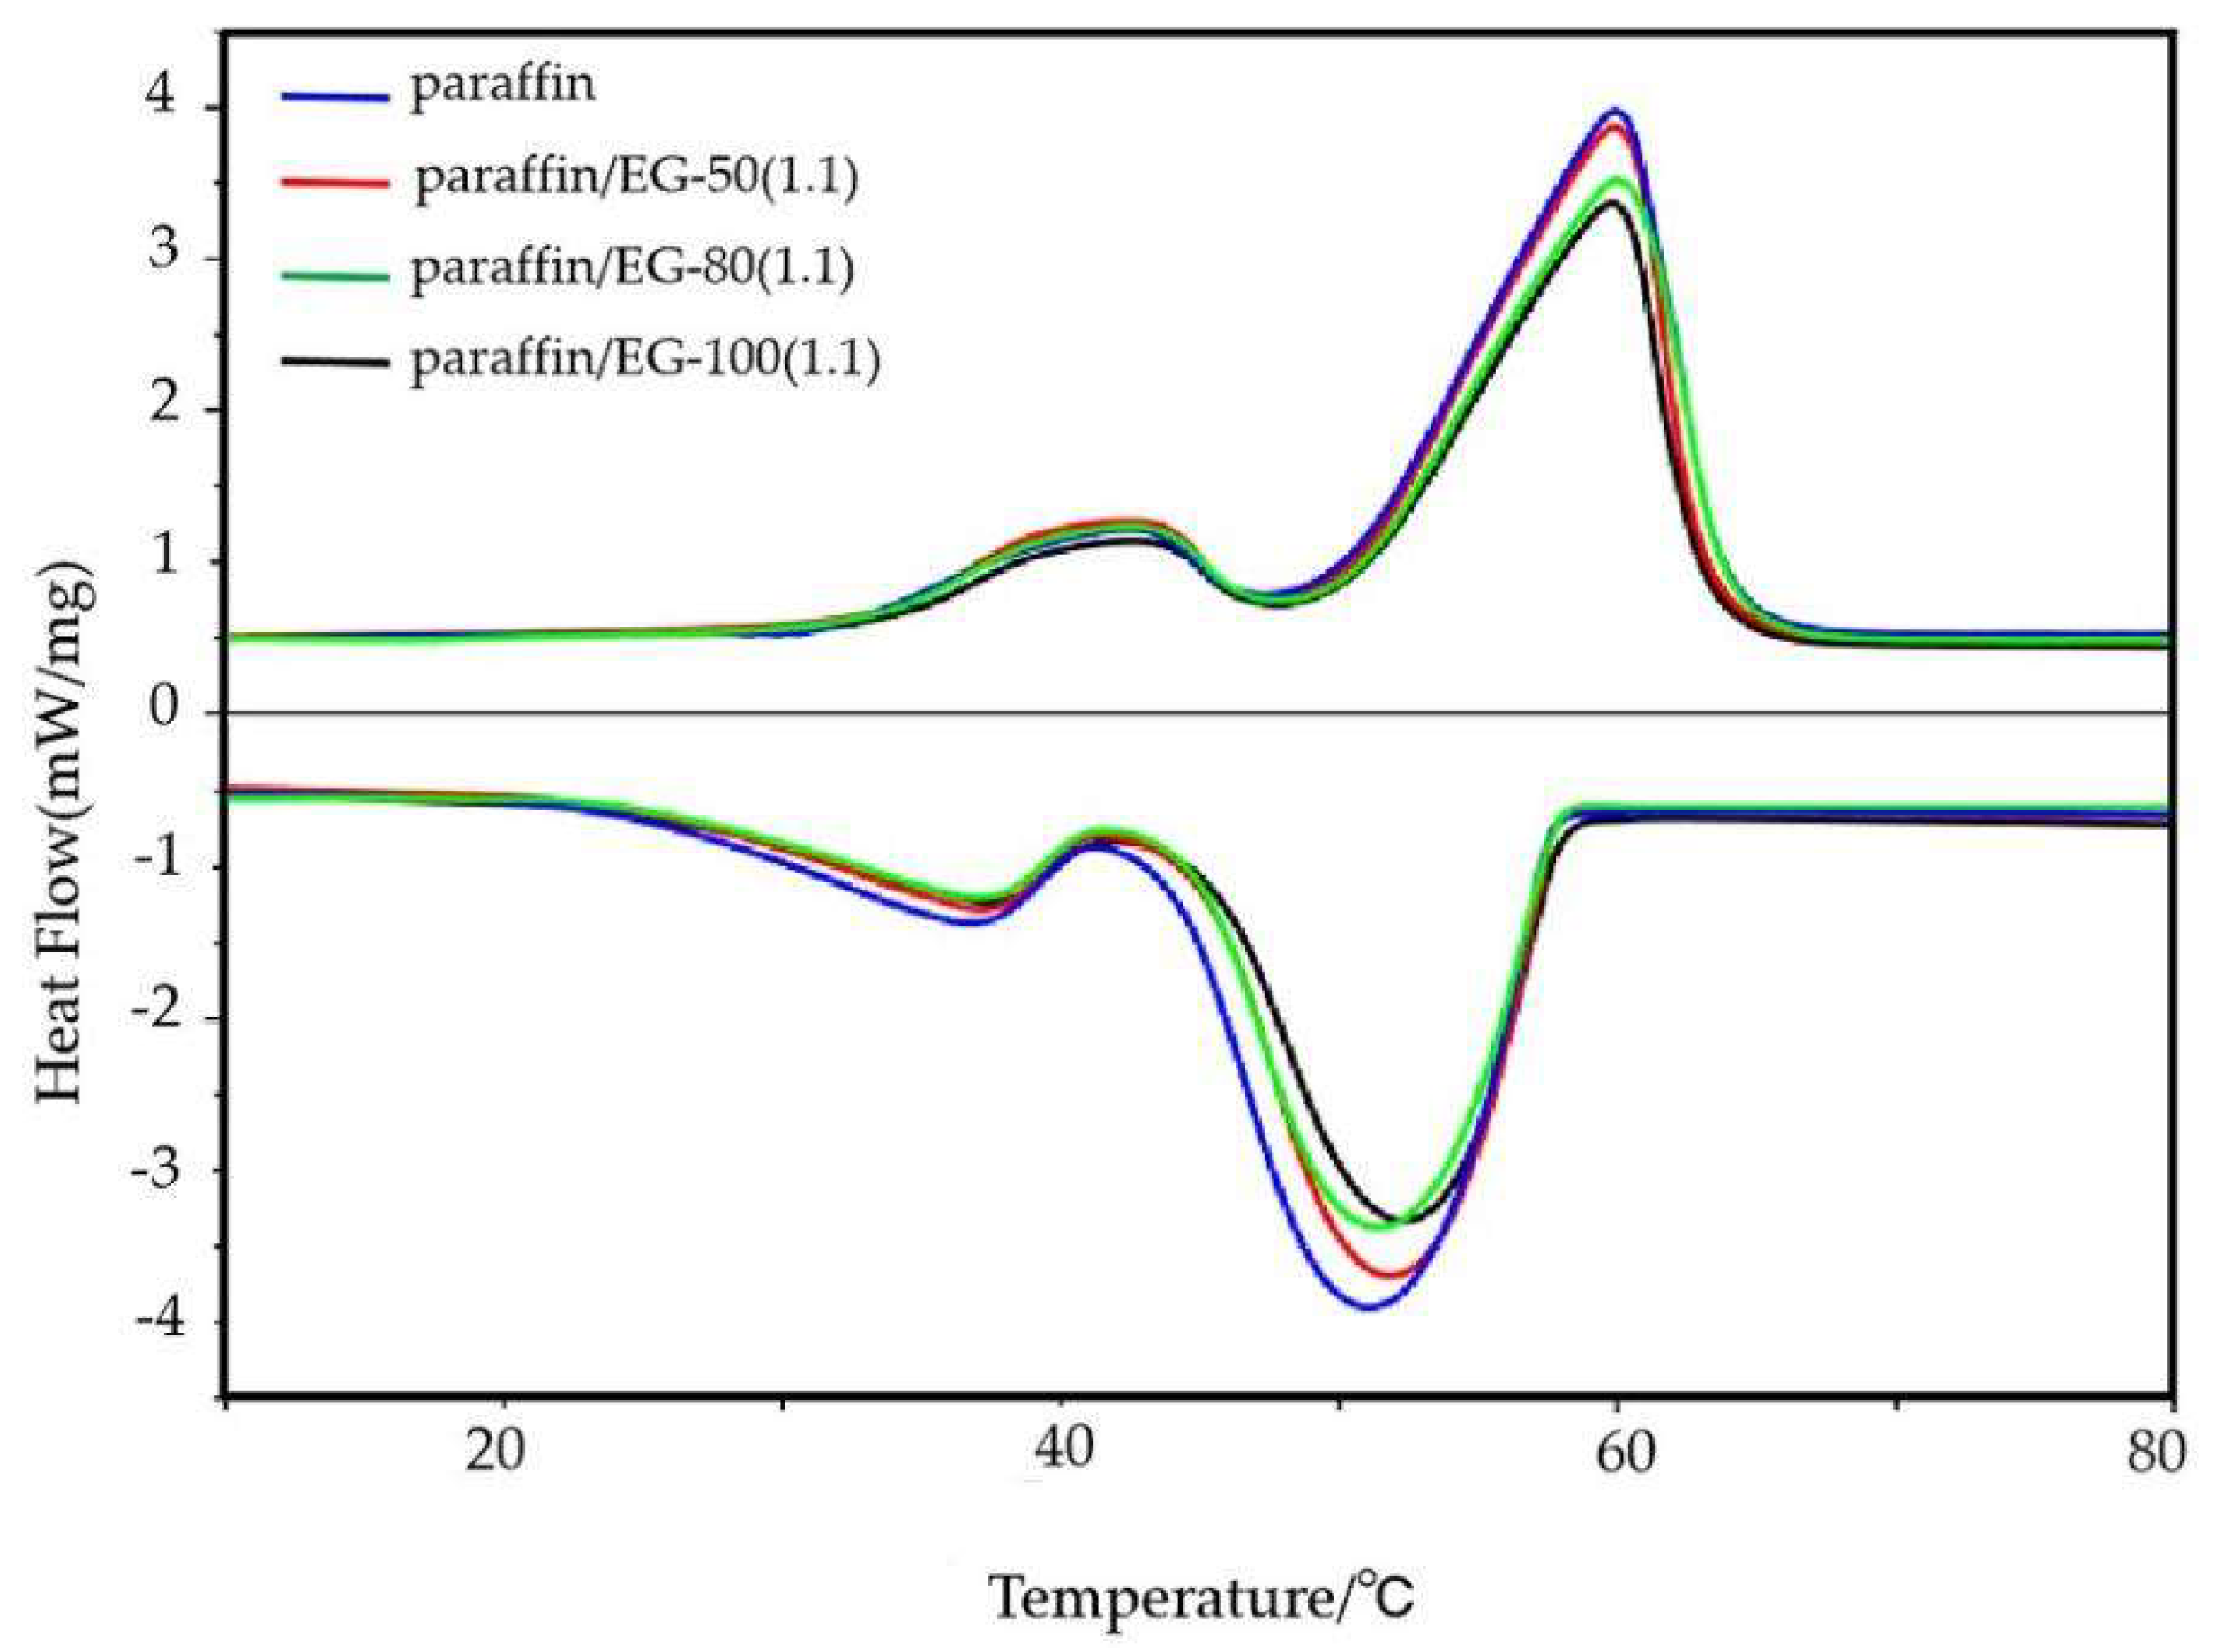
  • Compared with paraffin wax, the addition of EG could reduce the supercooling degree of CPCMs and improve the thermal conductivity of CPCMs. the supercooling degree of EG-50 was lower than that of EG-80 and EG-100 due to its larger specific surface area, which could form more contact surfaces and angles to promote nucleation and reduce supercooling degree. In addition, CPCM with EG-50 had high thermal conductivity, because EG-50 had smaller interfacial resistance.
  • Compared with paraffin wax, the ΔT of the CPCMs was slightly higher than that of paraffin wax. Because the paraffin wax and EG were combined through physical action, the physical action between them is very small, so the melting point of the CPCM showed a downward trend. On the contrary, the confinement effect of EG pores on the solid–liquid phase transition of paraffin wax made the phase transition temperature of the CPCMs increase. As a result of the comprehensive action, the phase transition temperature did not change much, and EG-50 had a small pore size, but the phase transition temperature of cpcm with EG-50 increased less, which was due to the complex composition of paraffin, which is inconsistent with the traditional change law. The change of latent heat of CPCMs was complex, which was mainly determined by the content of paraffin wax in CPCMs. At the same time, the pore diameter of EG and the complex composition of paraffin wax also play a regulatory role.
Through the above analysis, it could be seen that under the same conditions, EG-50 was more suitable as a support material for paraffin wax. This work will provide a theoretical basis for further optimizing the energy storage efficiency of EG/PCM composites and promote their practical application.

Author Contributions

Writing—original draft preparation, Determination of experimental method, L.F.; Content review, W.S.; Thesis revision W.C.; Experiment and data sorting, J.W.; All authors have read and agreed to the published version of the manuscript.

Funding

The research was supported by Talent fund project of Hefei University (16-17rc14).

Institutional Review Board Statement

Not applicable.

Informed Consent Statement

Not applicable.

Data Availability Statement

Not applicable.

Conflicts of Interest

The authors declare no conflict of interest.

References

  1. Chriaa, I.; Karkri, M.; Trigui, A.; Jedidi, I.; Abdelmouleh, M.; Boudaya, C. The performances of expanded graphite on the phase change materials composites for thermal energy storage. Polymers 2021, 212, 123128. [Google Scholar] [CrossRef]
  2. Olabi, A.G.; Wilberforce, T.; Elsaid, K.; Sayed, E.T.; Ramadan, M.; Atiqure Rahman, S.M.; Abdelkareem, M.A. Recent progress on Carbon-based nanomaterial for phase change materials: Prospects and challenges. Therm. Sci. Eng. Prog. 2021, 23, 100920. [Google Scholar] [CrossRef]
  3. Ramakrishnan, S.; Wang, X.M.; Sanjayan, J.; Petinakis, E.; Wilson, J. Development of thermal energy storage cementitious composites (TESC) containing a novel paraffin/hydrophobic expanded perlite composite phase change material. Sol. Energy. 2017, 158, 626–635. [Google Scholar] [CrossRef]
  4. Shi, J.b.; Li, M. Lightweight mortar with paraffin/expanded vermiculite-diatomite composite phase change materials: Development, characterization and year-round thermoregulation performance. Sol. Energy 2021, 220, 331–342. [Google Scholar] [CrossRef]
  5. Ran, X.F.; Wang, H.R.; Zhong, Y.J.; Zhang, F.; Lin, J.; Zou, H.; Dai, Z.M.; An, B.L. Thermal properties of eutectic salts/ceramics/expanded graphite composite phase change materials for high-temperature thermal energy storage. Sol. Energy Mater. Sol. Cells 2021, 225, 111047. [Google Scholar] [CrossRef]
  6. Ding, Z.; Yang, W.B.; He, F.F.; Jiang, Z.N.; He, R.; Fan, J.H.; Zhang, K. GO modified EPDM/paraffin shape-stabilized phase change materials with high elasticity and low leakage rate. Polymers 2020, 204, 122824. [Google Scholar] [CrossRef]
  7. Zhang, N.; Guo, H.J.; Xiong, L.; Zhang, H.R.; Chen, X.D. Preparation and characterization of paraffin/palygorskite shape-stable composite phase change materials for thermal energy storage. J. Energy Storage 2021, 34, 102189. [Google Scholar] [CrossRef]
  8. Li, X.F.; Li, H.; Kong, X.F.; Yang, H. Characterization and experimental investigation of composite phase change materials based on aluminum nitride/expanded graphite. J. Energy Storage 2021, 35, 102326. [Google Scholar] [CrossRef]
  9. Zeng, J.L.; Gan, J.; Zhu, F.R.; Yu, S.B.; Xiao, Z.L.; Yan, W.P.; Zhu, L.; Liu, Z.Q.; Sun, L.X.; Cao, Z. Tetradecanol/expanded graphite composite form-stable phase change material for thermal energy storage. Sol. Energy Mater. Sol. Cells. 2014, 127, 122–128. [Google Scholar] [CrossRef]
  10. Guo, X.; Zhang, S.D.; Cao, J.Z. An energy-efficient composite by using expanded graphite stabilized paraffin as phase change material. Compos. Part A 2018, 107, 83–93. [Google Scholar] [CrossRef]
  11. Feng, L.J.; Wei, Y.H.; Yu, L.W.; Jie, X.Z.; Zheng, S.Z.; Jun, X.X.; Li, C.S. Numerical and experimental study on the heat transfer properties of the composite paraffin/expanded graphite phase change material. Int. J. Heat Mass Transfer. 2015, 84, 237–244. [Google Scholar]
  12. Liang, Y.J.; Tao, Z.C.; Guo, Q.G.; Liu, Z.J. Sponge gourd-bioinspired phase change material with high thermal conductivity and excellent shape-stability. J. Energy Storage 2021, 39, 102634. [Google Scholar] [CrossRef]
  13. Wu, Y.P.; Wang, T. Hydrated salts/expanded graphite composite with high thermal conductivity as a shape-stabilized phase change material for thermal energy storage. Energy Convers. Manag. 2015, 101, 164–171. [Google Scholar] [CrossRef]
  14. Cai, Z.D.; Liu, J.; Zhou, Y.X.; Dai, L.L.; Wang, H.X.; Liao, C.C.; Zou, X.L.; Chen, Y.F.; Xu, Y.J. Flexible phase change materials with enhanced tensile strength, thermal conductivity and photo-thermal performance. Sol. Energy Mater. Sol. Cells 2021, 219, 110728. [Google Scholar] [CrossRef]
  15. Avia, O.L.; Lavi, A.; Alatawna, A.; Ruse, E.; Ziskind, G.; Regev, O. Graphite-based shape-stabilized composites for phase change material applications. Renew. Energy 2021, 167, 580–590. [Google Scholar]
  16. Li, C.C.; Zhang, B.; Liu, Q.X. N-eicosane/expanded graphite as composite phase change materials for electro-driven thermal energy storage. J. Energy Storage 2020, 29, 101339. [Google Scholar] [CrossRef]
  17. Xua, T.; Chen, Q.l.; Huang, G.S.; Zhang, Z.G.; Gao, X.N.; Lu, S.S. Preparation and thermal energy storage properties of D-Mannitol/expanded graphite composite phase change material. Sol. Energy Mater. Sol. Cells 2016, 155, 141–146. [Google Scholar] [CrossRef]
  18. Pratap Singh, A.; Khanna, S.; Paneliya, S. Preparation and characterization of solid-state neopentyl glycol/expanded graphitemicro composite for thermal energy storage applications. Mater. Today Proc. 2020, 11, 403. [Google Scholar] [CrossRef]
  19. Yang, Y.N.; Pang, Y.; Liu, Y.; Guo, H.W. Preparation and thermal properties of polyethylene glycol/expanded graphite as novel form-stable phase change material for indoor energy saving. Mater. Lett. 2018, 216, 220–223. [Google Scholar] [CrossRef]
  20. Zhou, H.; Lv, L.Q.; Zhang, Y.Z.; Ji, M.T.; Cen, K.F. Preparation and characterization of a shape-stable xylitol/expanded graphite composite phase change material for thermal energy storage. Sol. Energy Mater. Sol. Cells 2021, 230, 111244. [Google Scholar] [CrossRef]
  21. Xie, N.; Li, Z.P.; Gao, X.N.; Fang, Y.T.; Zhang, Z.G. Preparation and performance of modified expanded graphite/eutecticsalt composite phase change cold storage material. Int. J. Refrig. 2020, 110, 178–186. [Google Scholar] [CrossRef]
  22. Kenisarin, M.; Mahkamov, K.; Kahwash, F.; Makhkamova, I. Enhancing thermal conductivity of paraffin wax 53–57 °C using expanded graphite. Sol. Energy Mater. Sol. Cells 2019, 200, 110026. [Google Scholar] [CrossRef]
  23. Wang, Q.Q.; Zhou, D.; Chen, Y.M.; Eames, P.; Wu, Z.G. Characterization and effects of thermal cycling on the properties of paraffin/expanded graphite composites. Renew. Energy 2020, 147, 1131–1138. [Google Scholar] [CrossRef]
  24. Wu, Y.; Wang, T. The dependence of phase change enthalpy on the pore structure and interfacial groups in hydrated salts/silica composites via sol-gel. J. Colloid Interface Sci. 2015, 448, 100–105. [Google Scholar] [CrossRef]
  25. Zou, T.; Liang, X.H.; Wang, S.F.; Gao, X.N.; Zhang, Z.G.; Fang, Y.T. Effect of expanded graphite size on performances of modified CaCl6H2Ophase change material for cold energy storage. Microporous Mesoporous Mater. 2020, 305, 110403. [Google Scholar] [CrossRef]
  26. Zhao, Y.Q.; Jin, L.; Zou, B.Y.; Qiao, G.; Zhang, T.T.; Cong, L.; Jiang, F.; Li, C.A.; Huang, Y.; Ding, Y.L. Expanded graphite-Paraffin composite phase change materials: Effect of particle size on the composite structure and properties. Appl. Therm. Eng. 2020, 171, 12. [Google Scholar] [CrossRef]
  27. Hou, B.; Sun, H.J.; Peng, T.J.; Zhang, X.Y.; Ren, Y.Z. Rapid preparation of expanded graphite at low temperature. New Carbon Mater. 2020, 35, 262–268. [Google Scholar] [CrossRef]
  28. Kholmanov, I.; Kim, J.; Ou, E. Continuous carbon nanotube-ultrathin graphite hybrid foams for increased thermal conductivity and suppressed subcooling in composite phase change materials. Am. Chem. Soc. Nano. 2015, 9, 11699–11707. [Google Scholar] [CrossRef]
  29. Radhakrishnan, R.; Gubbinns, K.E. Free energy studies of freezing in slit pores: An order-parameter approach using Monte Carlo simulation. Mol. Phys. 1999, 96, 1249. [Google Scholar] [CrossRef]
  30. El Id, M.M.; Karkri, M.; Kraiem, M. Preparation and effective thermal conductivity of a Paraffin/Metal Foam composite. J. Energy Storage 2021, 33, 102077. [Google Scholar] [CrossRef]
  31. Zuo, X.C.; Zhao, X.G.; Li, J.W.; Hu, Y.Q.; Yang, H.M.; Chen, D.L. Enhanced thermal conductivity of form-stable composite phase-change materials with graphite hybridizing expanded perlite/paraffin. Solar Energy 2020, 209, 85–95. [Google Scholar] [CrossRef]
  32. Wang, X.L.; Li, B.; Qu, Z.G.; Zhang, J.F.; Jin, Z.G. Effects of graphite microstructure evolution on the anisotropic thermal conductivity of expanded graphite/paraffin phase change materials and their thermal energy storage performance. Int. J. Heat Mass Transfer. 2020, 155, 119853. [Google Scholar] [CrossRef]
  33. Xia, L.; Zhang, P.; Wang, R.Z. Preparation and thermal characterization of expanded graphite/paraffin composite phase change material. Carbon 2010, 48, 2538–2548. [Google Scholar] [CrossRef]
Figure 1. Photographs of graphite (a), EG (b) and paraffin/EG-50 (c).
Energies 15 04201 g001
Figure 2. Nitrogen absorption-desorption isotherms of EG of different sizes (50, 80, 100 mesh) (a). Pore size distributions of EG of different sizes (50, 80, 100 mesh) (b).
Energies 15 04201 g002
Figure 3. Leak test of paraffin/EG CPCMs with different EG mass fractions and different sizes: (a) 50 mesh; (b) 80 mesh; (c) 100 mesh.
Energies 15 04201 g003
Figure 4. XRD patterns of paraffin wax, EG of different sizes (50, 80, 100 mesh) and paraffin/EG CPCMs of different sizes (50, 80, 100 mesh).
Energies 15 04201 g004
Figure 5. SEM images of EG (ac): 50 mesh; (df): 80 mesh; (gi): 100 mesh.
Energies 15 04201 g005
Figure 6. SEM images of paraffin/EG CPCMs (ac): 50 mesh; (df): 80 mesh; (gi): 100 mesh.
Energies 15 04201 g006
Figure 7. DSC curves of paraffin wax, paraffin/EG-50 (1.1), paraffin/EG-80 (1.1) and paraffin/EG-100 (1.1).
Energies 15 04201 g007
Figure 8. Thermal conductivities of paraffin wax, paraffin/EG-50 (1.1), paraffin/EG-80 (1.1) and paraffin/EG-100 (1.1).
Energies 15 04201 g008
Table 1. Pore structure parameters of EG-50, EG-80 and EG-100.
SampleSBET (m2/g)Vp (cm3/g)Average Pore Diameter (nm)
EG-50360.155115.9800
EG-80350.153116.2377
EG-100210.111219.8323
Table 2. DSC data of paraffin and paraffin/EG (1.1) PCM samples.
SampleMeltSolidification
Tm1Tm2ΔHcΔHtTs1Ts2ΔHsTm2–Ts2
(°C)(°C)(J/g)(J/g)(°C)(°C)(J/g)(°C)
Paraffin/EG-50 (1.1)3450.3170.66172.4228.945.4171.115
Paraffin/EG-80 (1.1)34.250.5169.09172.4228.745170.395.3
Paraffin/EG-100 (1.1)34.350.7143.63172.4228.145.1145.45.5
paraffin33.850188.1-2844.1183.716.2
Tm−1: Solid-solid melting temperature, Tm−2: Solid-liquid melting temperature; ΔHc: Actual melting latent heat, ΔHt: Theoretical melting latent heat, Ts−1: Solid-solid solidification temperature, Ts−2: Solid-liquid solidification temperature, ΔHs: Solidification latent heat.
Publisher’s Note: MDPI stays neutral with regard to jurisdictional claims in published maps and institutional affiliations.

