Article

Space-Time Conglomerates Analysis of the Forest-Based Power Plants in Brazil (2000–2019)

by
Luiz Moreira Coelho Junior
1,* and
Edvaldo Pereira Santos Júnior
2
1
Department of Renewable Energy Engineering, Federal University of Paraíba (UFPB), João Pessoa 58051-900, PB, Brazil
2
Master, Renewable Energy Graduate Program (PPGER), Federal University of Paraíba (UFPB), João Pessoa 58051-900, PB, Brazil
*
Author to whom correspondence should be addressed.
Energies 2022, 15(11), 4113; https://doi.org/10.3390/en15114113
Submission received: 20 February 2022 / Revised: 7 April 2022 / Accepted: 20 April 2022 / Published: 3 June 2022

Abstract

:
Forest based power plants are alternatives in the diversification of domestic energy supply in Brazil, given the growing demand for electricity in recent decades. Evidences of space-time clusters contribute to the understanding of regional development associated with correlated activity. Therefore, this paper analyzed the space-time conglomerates for Brazilian forest-based power plants, from 2000 to 2019. The data used were from the Generation Information System of the National Electric Energy Agency (ANEEL)-SIGA. It detected the existence of clusters by means of scan statistics via space-time permutation, considering the high level of conglomeration. The results show the Center-South region of Brazil with the highest concentration of conglomerates, with black liquor and forest residues being the most used energy resources. The clusters with the highest installed power were in the early 2010s, with the black liquor plants. The regions with the formation of fast-growing forest plantations promoted the existence of conglomerates associated with the pulp and paper and steel industry complexes. It is concluded that there was a conglomeration of forest power plants in the central-south region of Brazil, in which they help in decision-making and guidance of public policies for forestry projects for energy.

1. Introduction

The green economy seeks to improve the well-being of humanity and social equality, mitigating environmental risks and ecological scarcity. Faced with the growing energy demand in recent decades, the use of modern biomass for energy generation has increased significantly. Biomass resources come from forests (natural and planted), agriculture, algae and animal and urban waste. Biomass has some advantages due to the replacement of reserves and the accessibility of the conversion process (combustion), which makes it an efficient alternative in the energetic transition of industrial plants that use fossil fuels. The use of biomass has low carbon emissions, considered carbon neutral, when associated with sustainable practices, in rural and urban areas, in its acquisition, transport and technology to supply heat, electricity and biofuels [1,2,3,4].
The generation and rational use of energy is one of the obstacles to ensuring, understanding and indicating sustainable solutions. Including sustainability factors are essential to meet the goals of sustainable development, through the insertion and application of cleaner energy technologies. In 2019, world electricity generation was 33,172.76 TWh (Tera Watts hour), of which 73.20% were from non-renewable resources and 26.80% from renewable energy (16.01% from hydroelectric plants, 5.28% from wind power, 2.42% from biomass and 3.09% from other forms). Bioelectricity generation was 655,309 GWh, obtained from solid biofuels (67.61%), biogas (13.54%), urban and agricultural waste (17.20%), industrial waste (5.65%) and liquid biofuels (1.64%) [5,6,7].
Brazil has a privileged position in the energy matrix when compared to other countries, due to the predominance of renewable resources that reaches 84% in the electrical matrix. In Brazil, in 2019, electricity generation was 626,329 GWh, of which 57,287 GWh (9.15%) were obtained from biomass. According to the National Electric Energy Agency-ANEEL (2020), in 2019, the installed capacity was 173.65 GW, with 14.85 GW available from biomass, distributed in agro-industrial (77.39%), forestry (21.47%), municipal waste (1.08%), animal waste (0.03%) and liquid biofuels (0.03%). The supply from forest biomass was 3.19 GW, distributed in black liquor (2.54 GW), forest residues (0.43 GW), blast furnace gas (0.13 GW), charcoal (0.05 GW) and firewood (0.04 GW) [7,8].
Energy development is associated with diversification with available and underexploited resources, but with the potential to achieve economies of scale and scope. For decision making to be more efficient and the market better planned, it is necessary that comparative advantages be transformed into competitive advantages. The use of the forest resource as an option is due to the availability and aspects of CO2 neutrality in the atmosphere, based on the circular economy. Circularity and energy self-supply strategies are based on legal need and industrial efficiency, taking into account the available renewable resources. In Brazil, forest-based power plants are associated with industrial forestry complexes such as the pulp and paper segment, sawmills, steel mills, etc. The main barrier to the expansion of forest bioelectricity is the high costs of transporting the raw material, in an area covered by forest plantations [3,9,10,11].
The Regional Economy comprehends the interrelationships between areas, within a national system of regions. Regional analysis covers spatial differentiation and interrelationships between areas, in addition to verifying the distribution of resources in space [12]. Marshall [13] admitted the so-called agglomeration economies as important in explaining industrial concentration. The agglomeration (cluster) of services or a group of related companies in the supply chain involves four aspects: firms in a similar sector; supply conditions; demand conditions and related and supporting industries (government and educational institutions). Collaboration and competition between participants in a cluster promotes an increase in industrial productivity, optimizes the direction and pace of innovation, and stimulates new ventures [14,15,16].
Cluster analysis is a statistical tool that allows grouping subjects or variables into groups with one or more common characteristics. Traditional cluster identification methods such as standardized incidence rates (SIRs) result in noisy maps where trends in space and time are difficult to distinguish [17]. Kulldorff [18] developed the scan statistic to detect clusters, making a multidimensional scan of a given activity in areas with high incidence, using the likelihood ratio and statistically verifying its significance. Conglomerates are subdivided into spatial, temporal, and spatio-temporal. The spatiotemporal cluster is a geographic area with a distinct pattern in relation to the background in space and time.
The scan statistic was initially and widely used in the health area, such as the works: Arroyo et al. [19], Lieu et al. [20], Nigatu et al. [21]. Currently, this method has been applied in other areas of knowledge, such as the forestry sector to identify the zoning of dead forests in South Carolina-USA with Randolph [22]; for zoning forest fires, Pereira et al. [17] in Portugal, Orozco et al. [23] in Switzerland and Shekede, Mupandira and Gwitira [24] for spatiotemporal assessment in Zimbabwe. In the Brazilian energy sector, Coelho Junior et al. [25] evaluated forest-based thermoelectric plants and Coelho Junior et al. [26] for black liquor thermal plants.
To understand the contemporaneity of spatial patterns of forest bioenergy, to guide decision-making and regional public policies. The objective of this work was to analyze the space-time conglomerates for Brazilian forest-based power plants, from 2000 to 2019.

2. Materials and Methods

2.1. Study Object

Information on Brazilian forest-based plants, from 2000 to 2019, is available in the Generation Information System of the National Electric Energy Agency (ANEEL)–SIGA. Forest-based power plants in Brazil (Figure 1) were classified as level 1 (forest biomass) and level 2 (firewood, charcoal, blast furnace gas, black liquor and forest residues). For each thermoelectric plant identified, the grant data (in MegaWatts–MW) was collected from ANEEL’s digital library (Sophia), observing the initial record, changes in installed power and geographic coordinates [27]. Figure 1 shows the location of South America, Brazil (by regions) and the distribution of forest-based power plants in 2019.

2.2. Scan Statistics

Scan statistics represent a set of methods to search for local excesses of events (clusters) in space and/or time. In order to identify the clusters of forest-based power plants in Brazil, a space-time analysis for high conglomeration was chosen, based on the space-time permutation model and Poisson’s generalized maximum likelihood method. The spatiotemporal scan statistic can be understood by a cylindrical window (A) with a circular geographic base, and with the height corresponding to the time. The base is defined just like that for the purely spatial scan statistic, while the height reflects the time period of potential clusters [29].
The main distinction of the space-time permutation model, related to the others, lies in the absence of population data, making it possible to identify conglomerates based on the number of cases of power granted from a forest base and the geographic coordinates of the plants. To reduce computation time, cases were aggregated on an annual scale, from 2000 to 2019 [22], and the generalized maximum likelihood model by Kulldorff et al. was used [30]. Equation (1) shows the total number of observed cases (C) for forest-based power plants.
C = z p c z p
where, Czp is the observed granted power of forest-based power plants in the geographic coordinate (z) during a time period (p). For each coordinate and period, the expected total bestowed power ( μ z p ) was calculated, according to Equation (2). The granted power ( μ A ), Equation (3), in a given cylinder A, was the sum of the other locations entered in the window.
μ z p = 1 C ( z c z p ) ( p c z p )
μ A = ( z , p ) A μ z p
It calculated the expected number considering the chance of finding a forest-based power plant in the interior of constant z for the period under analysis. For a small number of spatial and temporal cases, the Poisson distribution was used with an average of μ A [30]. Equation (4) estimated the generalized likelihood ratio (RVG) for forest-based power plants in Brazil. Regarding the circular spatial windows, this work tested the probability that the form of electricity generation was of forest base in region z. To do so, the analyses of the probability conducted was of levels 5.0%, 8.6% (participation of biomass in the Brazilian electrical matrix), 20.0%, and 30.0%. The results were spatialized and showed the number of clusters for each probability level. To evaluate the temporal effect, the most representative window of 8.6% was used and, as suggested by Kulldorff [30], the temporal window was adjusted to 50.0% of the study period.
RVG = ( C a μ A ) ( C C a C μ A ) ( C C a )
where: C = total amount of power granted by forest-based power plants, from 2000 to 2019, in Brazil; C a = is the power granted by forest-based power plants in cylinder A and μ A = total expected power granted in cylinder A. The maximized RVG was calculated (which indicates the cluster with the highest probability of being true) and they were simulated and ranked, in addition to the real data (R), a dataset (S) with 999 permutations. Monte Carlo hypothesis test was used to assess statistical significance, Equation (5), at 5.0% (p-value ≤ 0.05) [31].
p - value = 1 R ( S + 1 )
They evaluated the following characteristics of significant clusters (p-value ≤ 0.05): cluster centroid, radius [R (km)], observed value (Obs.), expected value (Exp.), time period, RVG, and p-value. Clusters with null radius (purely temporal) were considered as isolated. Initially, the purely temporal and spatiotemporal clusters for the Brazilian regions were detailed, followed by the detailing of the probability level of 8.60%. For the spatiotemporal conglomerates of the forest-based power plants, the average values of the observed power were considered (Obs.Avg.) and expected (Exp.Avg.) of forest bioelectricity, inside (Pot.Ins.) and outside (Pot.out.) of the cluster, during the time gap interval of statistical existence. To evaluate the behavior of these variables over time, this paper used the Geometric Growth Rate (RGG), Equation (6), [32].
RGG   [ % ] = [ V F V 0 Δ t 1 ] · 100
where, VF = granted or expected power (MW) of forest biomass in the final year; V0 = granted or expected power (MW) of the initial year; and ∆t = temporal variation (expressed in years).

3. Results and Discussion

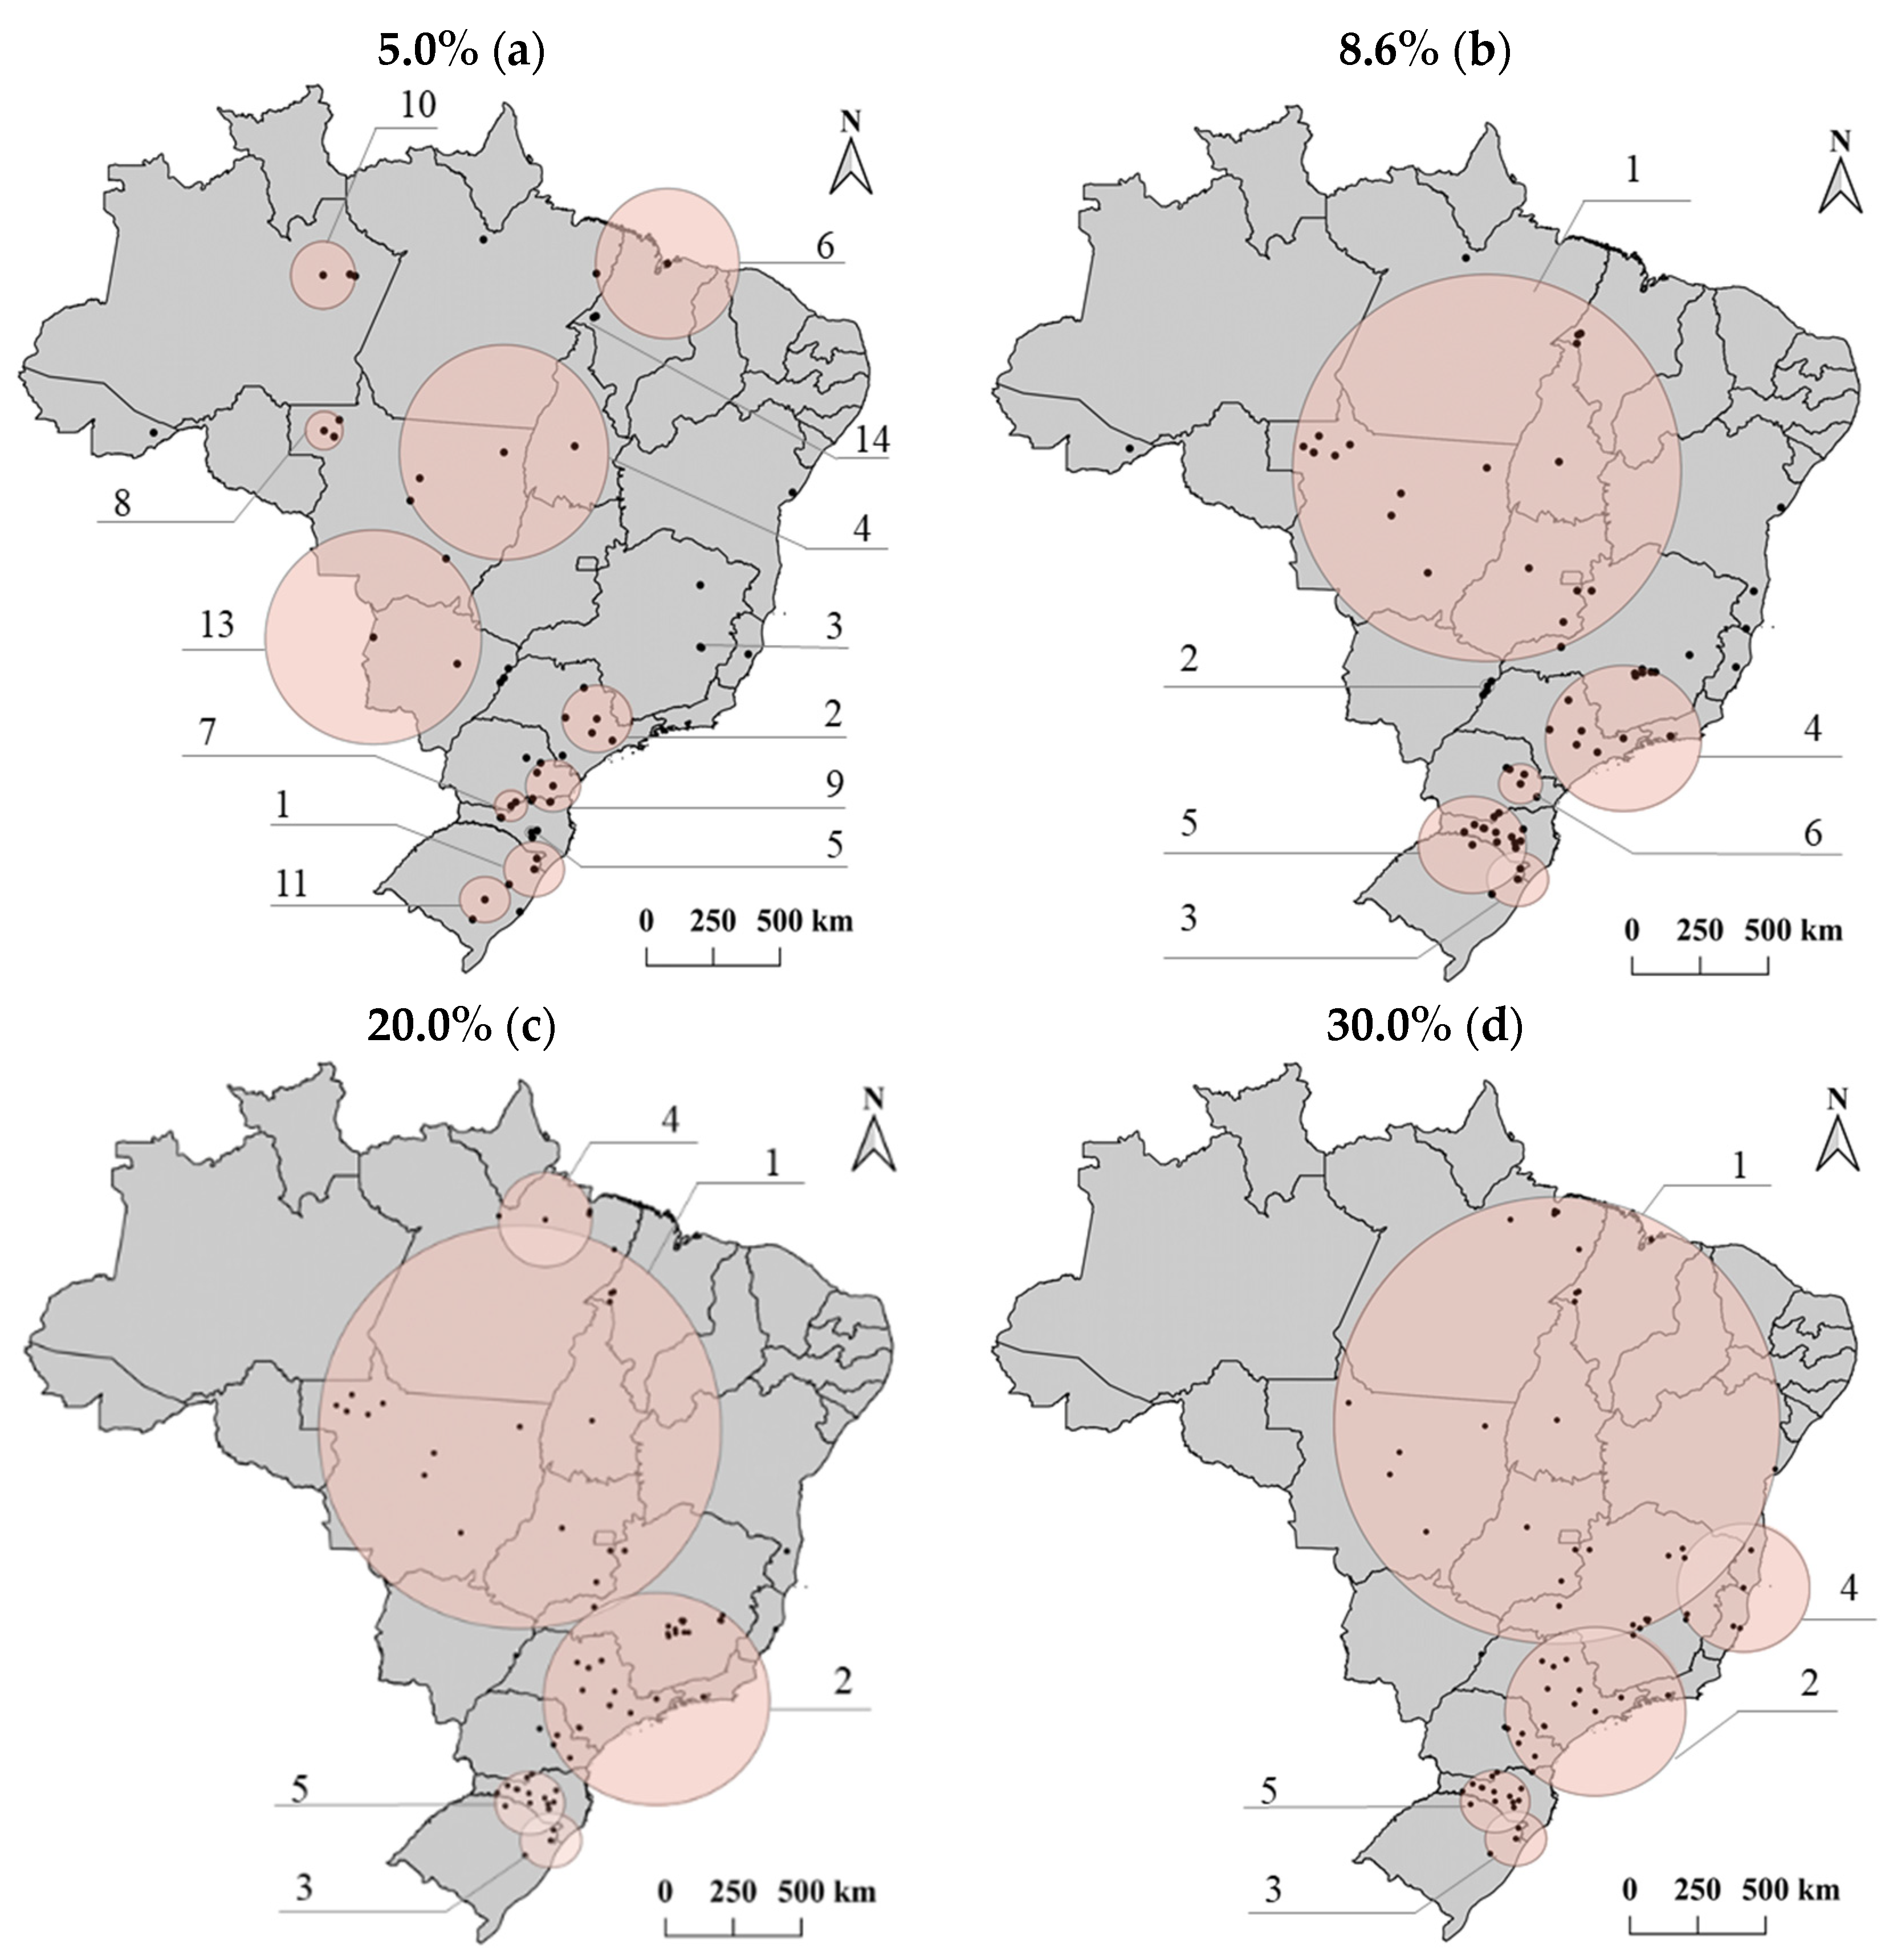
Figure 2 shows the clusters of forest-based power plants in Brazil, from 2000 to 2019, regarding the probability of 5.0% (a), 8.6% (b), 20.0% (c), and 30.0% (d) that the electricity generation is forest-based.
For the probability of 5.0% of electricity generation being forest-based (Figure 2a), 24 clusters were observed, 11 of which were purely temporal (radius = 0 km), and 13 were spatio-temporal clusters that were in the regions: South (5), Southeast (3), Midwest (3), Northeast (1), North (1). For this low level of association (5.0%), areas with low power were observed, presenting a high amount of conglomerates of forest-based power plants. For the probabilistic window of 8.6% of electricity generation being forest-based (Figure 2b, 14 clusters were observed, 8 of which were temporal (radius = 0 km), and 6 temporal spaces, of which five were in the southern portion of the country and only one to the north of the territory. At the regional level, they were: three in the South, one in the Southeast, and two in the Midwest. The location of the clusters explained the dominance of the central south region of the country over the supply of bioelectricity. Bichel and Telles [33] identified the same region as the main producer of forestry wood resources for Brazil between 1998 and 2017. This behavior was also observed by Simioni et al. [34], the high production of wood from forestry favors the implementation of sustainable energy chains for the generation of forest-based bioelectricity. With this, it is noted the relevance of spatial and temporal aspects in the planning of electric generation in Brazil. The grouping of resources results in regional inequalities in installed capacities, with the expansion of wind energy to the North and Northeast regions and of biomass to the Southeast and Midwest regions [35].
In regard to the probability of 20.0% of the electricity generation being forest-based (Figure 2c), there were nine clusters (five temporal spaces and four temporals). These clusters had a radius greater than the observations for 5.0% and 8.6%, showing the influence of the probabilistic scanning window. The centroids were divided into regions: South (2), Southeast (1), Midwest (1) and North (1). Figure 2d shows the 30.00% probability level clusters, in which the behavior was similar to the 20.0% scan window. There were 7 clusters (5 temporal spaces and 2 temporal ones), the spatial ones were centered in the South (2), Southeast (1), Midwest (1) and Northeast (1) regions. The characterization of the clusters was carried out based on the association of the probabilistic window probability of 8.6% (Figure 2b). This window represents the share of power granted from biomass in the national electricity matrix in 2019, and therefore showed better representation and detailing of clusters, avoiding conglomerates of excessive proportions. Brasil [36] showed that this percentage is significant for the national supply of electricity, and also pointed out growth estimates for the period from 2022 to 2027, considering the generation from sugarcane bagasse, biogas and forest residues, mainly in the subsystem Southeast/Midwest.
Table 1 presents the characterization of forest-based power plant clusters in Brazil, from 2000 to 2019, and all clusters were statistically significant, with p-value < 0.05. Cluster 1 had the centroid in Porto Alegre do Norte-MT, with a radius of 957.48 km and RVG of 211,586.11. The statistical validation of the conglomerate of forest-based plants was from 2012 to 2019, with an average of the observed granted power of 386.92 MW, as opposed to the expected 264.37 MW. Maranhão was the Brazilian state with the highest average of granted power (281.29 MW) within the cluster and only the Suzano Maranhão (MA) plant, through black liquor, was granted for the generation of 254.84 MW.
Cluster 2 presented centroid in Três Lagoas-MS and temporal window from 2011 to 2019. Although the cluster area encompassed the states of Mato Grosso do Sul and São Paulo, the participating plants were only in MS, all located in the intermediate region of Campo Grande-MS, which makes up a region called Bolsão Sul-Mato-grossense, where Mato Grosso do Sul is linked to the states of São Paulo and Paraná. This conglomerate reinforces the existence of technological overflow between the participating areas, as presented by Porter [14]. Conglomerate 3 was centered in Cambará do Sul-RS and the average granted (2018 and 2019) was 68.70 MW, with only 3 participating plants (Cambará, CGVE Inova and Forespel) using forest residues. Cluster 4 encompassed the Southeast states (Minas Gerais, São Paulo and Rio de Janeiro) and with statistical significance between 2002 and 2010. With its centroid located in Pindamonhangaba—SP, the conglomerate added the thermoelectric plants for forest residues, black liquor, charcoal, and blast furnace gas (GAF). Ripasa, located in Limeira-SP, was the thermoelectric plant with the highest average power granted (42.79 MW) within the cluster.
For Minas Gerais, the coal-fired thermal plants (Barreiro and Cisam) and GAF (Siderúrgica União and Metalsider) are the result of the national steel industry, located in the region of the iron quadrilateral, Bichel and Telles [33] identified the state of Minas Gerais as the largest producer of charcoal in Brazil, which can boost the supply of bioelectricity. In addition to the high supply of coal in the region, the existence of cluster 4 is also related to cogeneration in the steel industries, which seek to reduce pressures on native forests and improve the supply of bio-reducers [37]. Silva, Mathias, and Bajay [38] indicated that the Brazilian steel sector presented prospects for an increase in the self-production of electricity, inferring a growth for blast furnace gas and charcoal in the domestic supply of electricity. With a centroid in Erechim-RS, cluster 5 had a radius of 239.66 km, RVG of 63,438.13 and occurred between 2002 and 2010. In the period of statistical existence of the conglomerate, 10 forest-based power plants were identified; among the resources were forest residues, black liquor, and firewood. Conglomerate 6, centered in Carambeí—PR, had a radius of 98.74 and RVG of 51,839.53, with four plants, all in the state of Paraná.
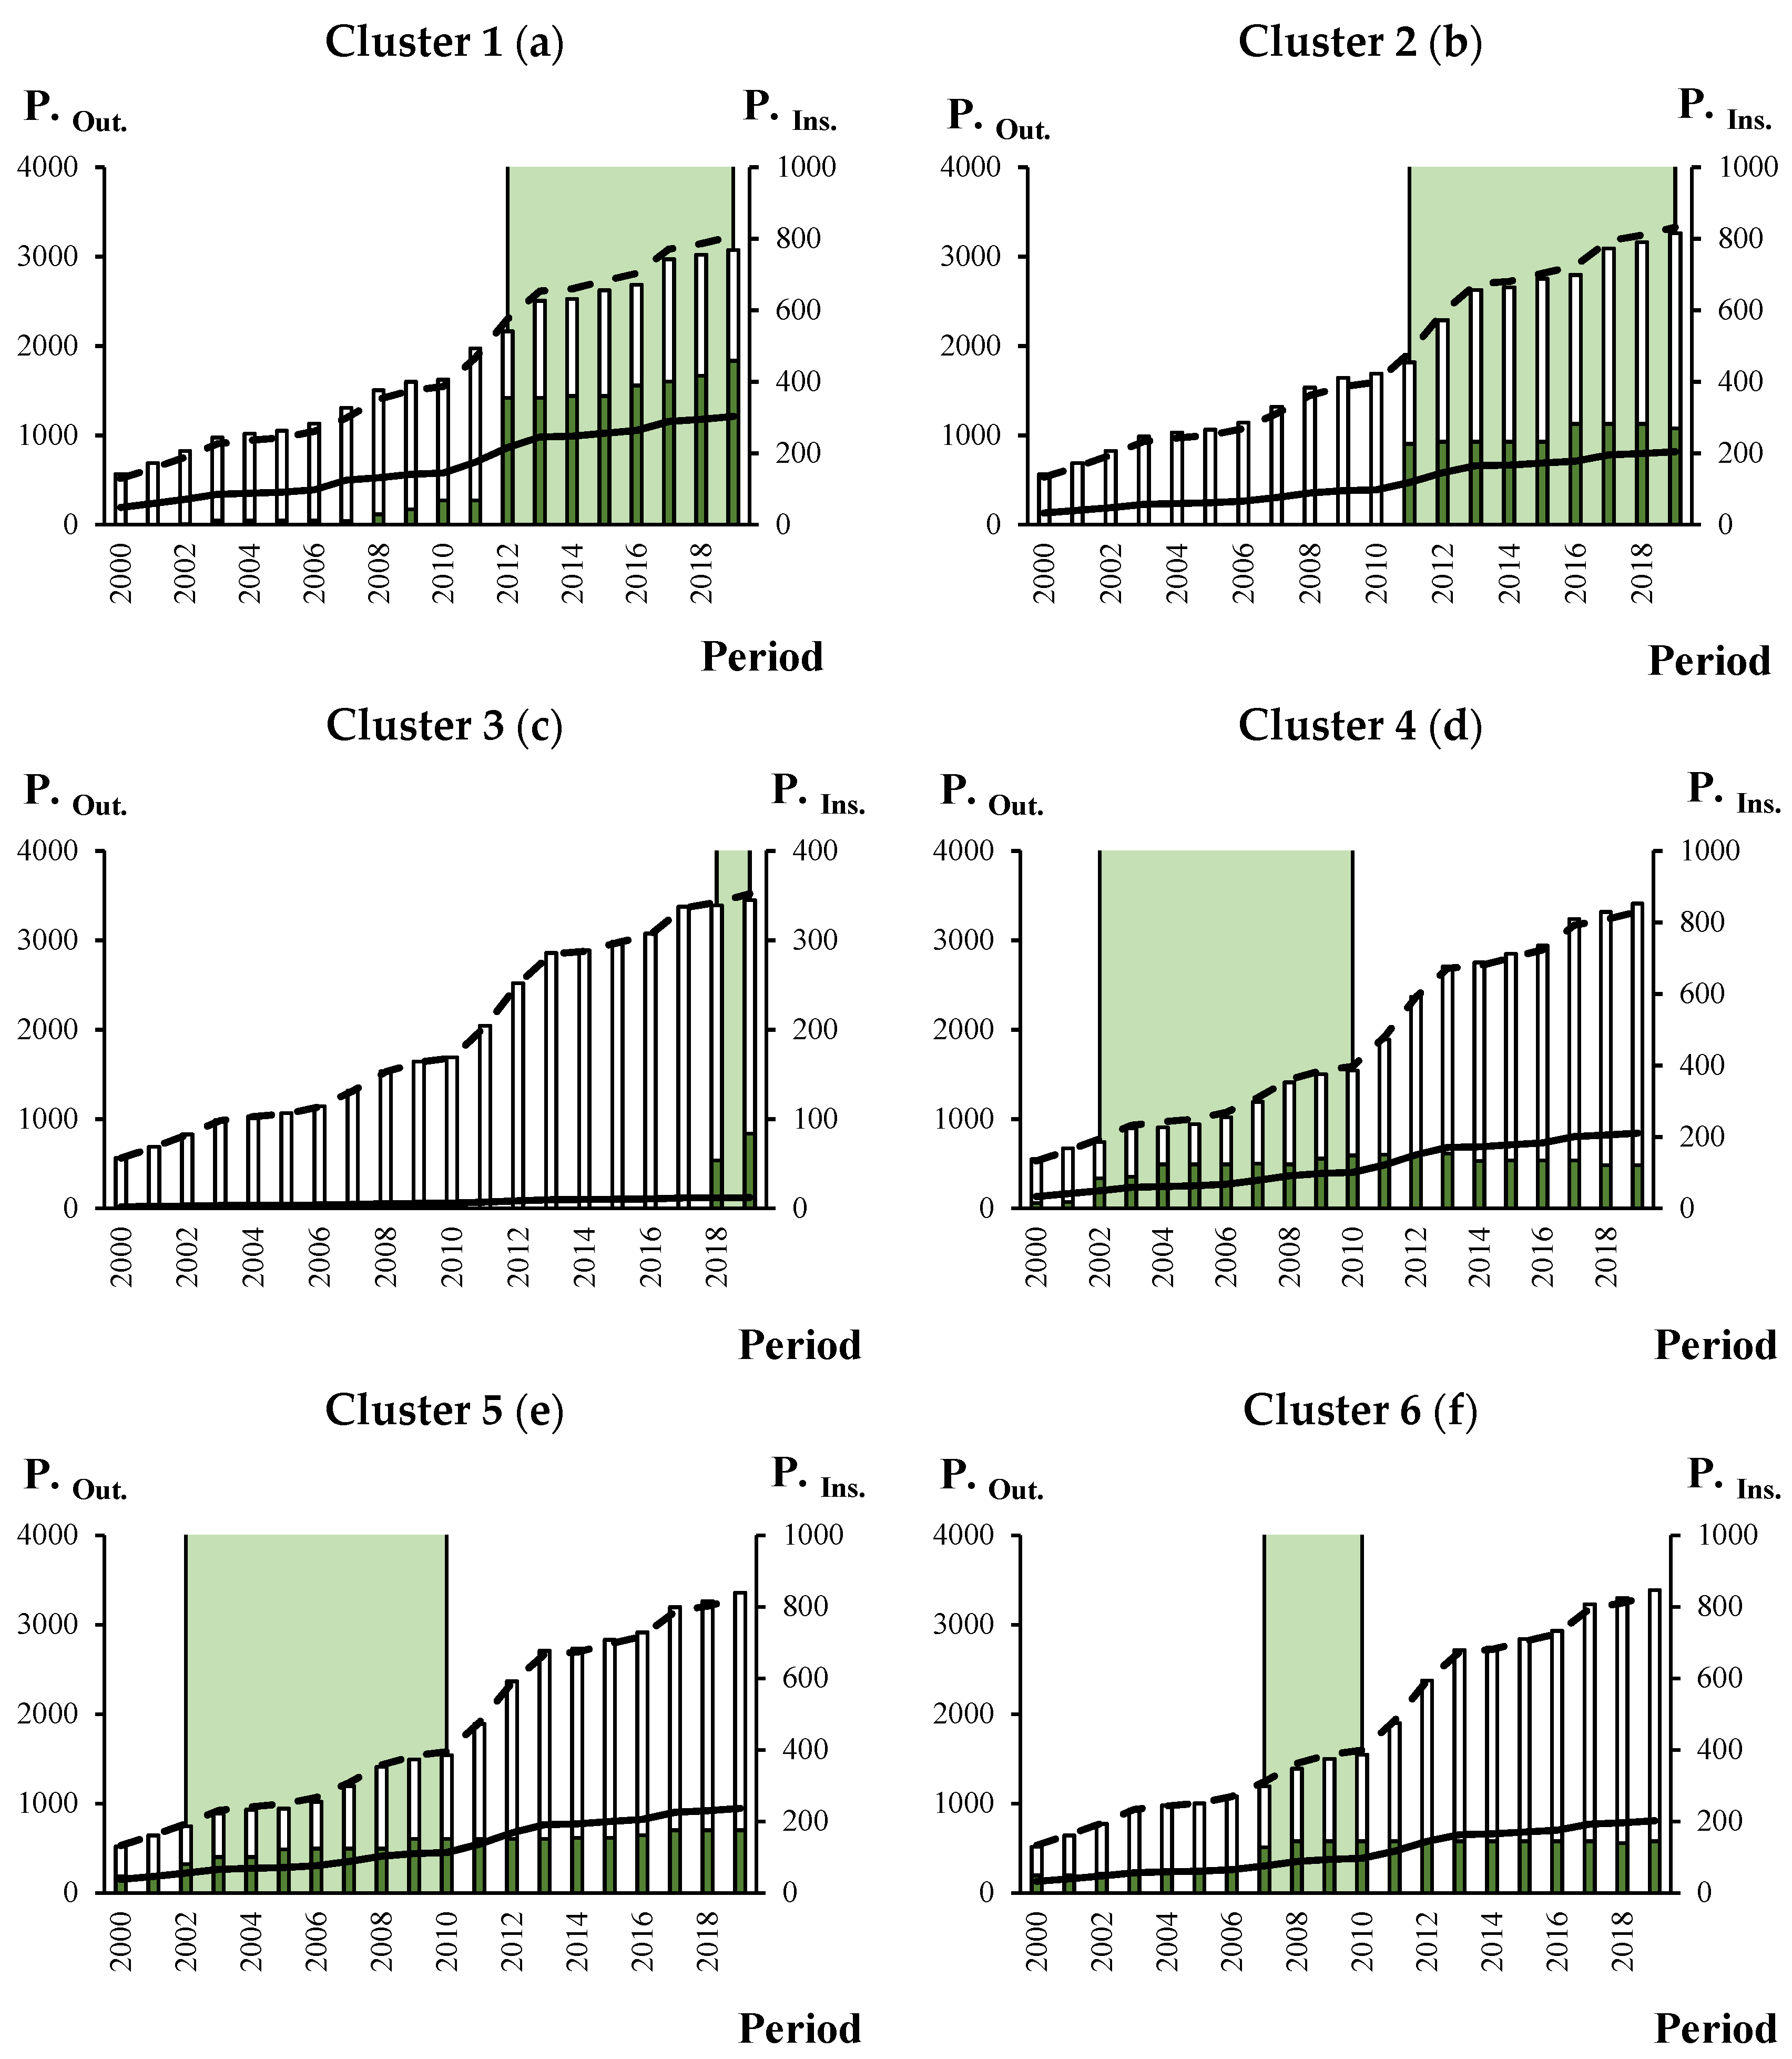
The conglomeration in the southern region of the country was associated with the high production of planted forests and the region’s sawmills and paper industries. Coelho Junior et al. [25] highlighted the Center-South region of Brazil as the main hub for generating Brazilian bioelectricity, also highlighting the importance of black liquor (from the pulp and paper industries) and forest residues (from sawmills). Broughel [39] pointed out that, along with public policies, the consolidation of the pulp and paper sector is essential for the use of forest biomass for energy generation. The temporal evolution of the power granted (MW), observed and expected, outside (Pot.Out.) and inside (Pot.Ins.) of forest-based power plants clusters in Brazil is shown in Figure 3.
Under the region of cluster 1, Figure 3a, between 2000 and 2011, the average power granted was 22.20 MW. In 2012, with the granting of the thermal plants Suzano Maranhão—MA (254.84 MW) and Guaçu—MT (30.00 MW), the region became a statistical cluster, with an average of 386.92 MW, while the expected power average was 264.37 MW (2012–2019). During the existence of the conglomerate, the available capacity went from 354.94 MW (2012) to 458.89 MW (2019), indicating an average increase of 3.74% p.a.; after 2012, the following stand out: F&S Solutions (18.00 MW), in 2016, and Inpasa—MT (42.30 MW), in 2019.
In cluster 1, the intermediate regions of Sinop—MT, with six forest based thermoelectric plants, and Imperatriz—MA, with two power plants, stood out. Angelo, Silva, and Silva [40] highlighted the high performance of the wood industries in the region of Sinop-MT, evidencing a consolidated forestry sector, relevant to the bioelectricity production chain. Souza and Pietrafesa [41] developed an economic assessment for Maranhão (MA) and inferred that from 2012 there was an increase in economic growth. However, the results found show that the clusters promoted local and regional development, due to the exchange of experiences, technological overflow, and more intensified foreign investments.
Cluster 2, Figure 3b, took place between 2011 and 2019, with an observed average power of 252.23 MW granted and 171.82 MW expected. In 2011, the power within the cluster was 226.00 MW, rising to 270.10 MW in 2019. The existence of this cluster can be attributed mainly to the black liquor plant, Eldorado Celulose (226.00 MW), located in the municipality of Três Lagoas-MS. The other participants were Cargill—Três Lagoas, with 6.00 MW (2012–2019) and Onça Pintada, with 50.00 MW (2016–2019). Although cluster 2 is still registered, the scan statistic indicated growth prospects of 7.09% p.a. (2011 to 2019) for expected power, while the increase in installed potential was only 2.25% p.a. Thus, it is possible that there will be statistical exclusion of the conglomerate in the coming years, unless new grants occur.
The third conglomerate (Figure 3c) was identified from 2018, with the granting of thermoelectric plants Cambará-RS (50.00 MW) and Forespel-RS (3.70 MW), in 2018, and Cgve Innova-RS (30.00 MW), in 2019; all the plants went to forest residues. The average power within the cluster was 68.70 MW, as opposed to the expected 12.21 MW. The geographic region of cluster 4, Figure 3d, during the entire study period presented granted power, however, from 2002 onwards, it became statistically relevant in terms of temporal space. The conglomerate counted on the expansion of the Ripasa—SP thermoelectric plant, which increased its granted capacity from 15.00 MW to 49.63 MW. Cluster 4 plants recorded an average growth of 6.42% p.a. (2002 to 2010); however, as of 2012, black liquor thermoelectric plants were implemented in other parts of the country, in addition to the closing of the PIE RP (30.00 MW) plants in 2013 and Barreiro (12.90 MW) in 2017, resulting in the end of temporal significance.
Cluster 5, Figure 3e, took place between 2002 and 2010. The power granted increased from 80.75 MW (2002) to 150.97 MW (2010), with an average rate of 7.20% pa. of the conglomerate was 119.66 MW granted (2002–2010), as opposed to the expected 83.49 MW. Thus, similarly to cluster 4, the increase in the power granted abroad resulted in the dissolution of the conglomerate. The plants were in the states of Paraná (Pizzato and Miguel Forte) and Santa Catarina (Chapecó, Irani, Celulose Irani, Bragagnolo, Thermoazul, Klabin Correia Pinto, Klabin Otacílio Costa, Lages and Rohden). He highlighted the intermediaries of Curitiba-PR (2 thermoelectric plants), Chapecó—SC (3 thermoelectric plants) and Lages—SC (3 thermoelectric plants). Coelho Junior et al. [26] identified a cluster for the supply of bioelectricity from black liquor, in the region of clusters 4 and 5, which corroborates the statistical validation and shows the regional relevance of the energy resource. According to Furtado et al. [42], the region’s economy is based on the forest-based industry and since the beginning of the 2000s, the use of waste in cogeneration systems has increased, highlighting pine bark, pine bark chip, sawdust, dry Pine, and wood chips.
The last grouping (Figure 3f) became significant from 2007 onwards due to the technological expansion of the Klabin thermoelectric plant, which went from 48.85 MW (2006) to 113.25 MW (2007) granted. Energy Green, Rickli, Piraí, Klabin, and Berneck plants participated in the conglomerate, all located in Paraná. From 2007 to 2010, the average power granted within the conglomerate was 140.00 MW, with growth of 3.18% p.a., against 6.72% p.a. outside the region, for the same period, which resulted in the end of the conglomerate’s statistical relevance.
Table 2 presents the characterization of isolated clusters of forest-based power plants in Brazil, between 2000 and 2019. Of the eight highlighted thermoelectric plants, six were black liquor (Fibria MS—II, Klabin Celulose, Cenibra, Veracel, Jari Celulose, Bahia Pulp, and Suzano Mucuri), one for forest residues (Triunfo) and one for charcoal (João Neiva). Klabin Celulose (330.00 MW) was the largest forestry biomass plant in Brazil, located in Ortigueira-PR, it was around cluster 6, which highlighted the high capacity to offer forest bioelectricity in the south of the country.
Almeida, Silva and Angelo [43] highlighted that wood for pulp was more valued within the region where Klabin operates, making it an area conducive to timber development and a potential area for the supply of forest bioelectricity. Fibria MS II (269.58 MW), although not presented by cluster 2, was located in Três Lagoas-MS, which showed the existence of a large industrial center in the region. Cenibra (100.00 MW), located in Belo Oriente-MG, presented as one of the main companies in the initial years (2000 to 2007). The João Neiva thermoelectric plant, with 3.50 MW granted, was relevant between 2014 and 2019, using charcoal, common in the state of Minas Gerais due to the high number of industries in the steel sector.
In the Northeast, the highlights were Veracel (121,823 MW), Bahia Pulp (108.60 MW), and Suzano Mucuri (92.00 MW), all granted in Bahia, and with greater impact in the initial years of analysis (2000 to 2010). Marques (2015) highlighted Bahia and Mato Grosso do Sul as the main states for the pulp and paper sector outside the South-Southeast axis. It is important to emphasize that the use of the scan statistic with probability levels above 30.00% (Figure 2d) can highlight the Bahian complex as a significant spatio-temporal cluster. In the North region were Jari Celulose (55.00 MW), belonging to the Jari Celulose Papel e Embalagens S.A. group, and the Triunfo plant (28.97 MW) using forest residues.
The existence of new clusters in the Brazilian supply shows the development of bioelectricity in the national scenario. Da Silva, Marchi Neto, and Seifert [44] highlighted that the evolution in the regulation of the electricity sector allowed the injection of surplus electricity into the grid and motivated the increase of participants in the sector. Another point that intensifies the offer from forest biomass was indicated by Melo [45] who highlighted that the practice of energy auctions, especially those of renewable energies, which provide advances for the expansion of projects in the sector, motivating the search for technological improvements and increased energy efficiency in associated sectors.
Auctions do not eliminate the problems of competitive market structure or mitigate all risks associated with project implementation. In Brazil, most of the risks and impediments to the expansion of the forest bioelectricity sector are related to environmental licensing, site selection, and grid connection, which often result in technical-economic infeasibility [36,46]. The Brazilian energy development plan points out the importance of forest-based power plants for the growth of the national mix, but highlights the need for new projects and business designs that facilitate the operational viability of the systems [36]. Thus, the identification of clusters favors the implementation of forest bioelectricity projects, indicating areas with greater regional and technological development for this form of generation, and, consequently, reducing the risks of investments.
More recently, in 2017, Brazil approved the National Biofuels Policy, RenovaBio, to expand low-carbon fuels, within the commitments of the Paris Agreement NDC (SI.15). Although focused on liquid fuels, the policy provides incentives for the use of biomass for energy generation based on targets for reducing GHG emissions in the fuel mix, decarbonization credits, biofuels certification and fiscal, financial, and credit incentives [47]. Although investments in forest-based electricity are associated with industries, new incentives can help with expansion.

4. Conclusions

The use of scan statistics to assess the Brazilian supply of forest bioelectricity was validated in this study. From the offers offered for bioelectricity, it is concluded that there was conglomerate forestry in the Center-South region of Brazil, for all indicators of tested circular windows. Among the level 2 sources, the main inputs were: black liquor and forest residues.
For the geographic window associated with 8.60%, there are six spatiotemporal clusters, in addition to eight isolated clusters with temporal contribution. The existence of conglomerates was associated with regions with greater wood production capacity and complexes in the pulp and paper sector. These results control that forestry studies are optimized for optimization and efficiency increase, have been successfully implemented in the Brazilian industry. It was observed that, as of 2012, a group of large mills, or mainly the Suzano Celulose and Klabin S.A. group, resulted in the development of space-temporal clusters. Areas with great development of this form of generation were also highlighted, such as the mesoregions of Imperatriz-MA, Sinop-MT, Campo Grande-MS, and Lages-SC, which reflects that the comparative areas located inside the clusters present effective advantages, with relation to others.
This work collaborates with the scientific development of space research on forest bioelectricity, being innovative in time analysis. This can help feasibility studies for the implementation of bioelectricity research and/or encourage the development of public policies, focused on cluster regions and adjacent areas, promoting the sector. Finally, the results motivate the diversification and complementarity of the national electricity matrix, which increases its energy security.
To increase the accuracy of the results found, further studies are needed to investigate the existence of clusters for other renewable energies, under the assumption that different regions will dominate the supply. The results will help in the better management of resources and strategies for expanding the domestic supply of energy, providing guidance for decision-making and public policy guidance.

Author Contributions

Conceptualization, E.P.S.J. and L.M.C.J.; methodology, E.P.S.J. and L.M.C.J.; software, E.P.S.J.; validation, L.M.C.J.; formal analysis, E.P.S.J. and L.M.C.J.; investigation, E.P.S.J. and L.M.C.J.; resources, E.P.S.J.; data curation, E.P.S.J.; writing—original draft preparation, E.P.S.J. and L.M.C.J.; writing—review and editing, L.M.C.J.; visualization, E.P.S.J. and L.M.C.J.; supervision, L.M.C.J.; project administration, L.M.C.J.; funding acquisition, L.M.C.J. All authors have read and agreed to the published version of the manuscript.

Funding

This research was funded by the Federal University of Paraíba (UFPB)-Brazil; National Council for Scientific and Technological Development-CNPq by Productivity Research Grants, nº: 310871/2021-2; Coordination of the Coordination for the Improvement of Higher Education Personnel-CAPES, through the master’s grant nº 88882.440994/2019-01, and the APC was funded by UFPB.

Institutional Review Board Statement

Not applicable.

Informed Consent Statement

Not applicable.

Data Availability Statement

Conflicts of Interest

The authors declare no conflict of interest.

References

  1. Deboni, T.L.; Simioni, F.J.; Brand, M.A.; Lopes, G.P. Evolution of the quality of forest biomass for energy generation in a cogeneration plant. Renew. Energy 2019, 135, 1291–1302. [Google Scholar] [CrossRef]
  2. Kilpeläinen, A.; Alam, A.; Torssonen, P.; Ruusuvuori, H.; Kellomäki, S.; Peltola, H. Effects of intensive forest management on net climate impact of energy biomass utilisation from final felling of Norway spruce. Biomass Bioenerg. 2016, 87, 1–8. [Google Scholar] [CrossRef]
  3. Nunes, L.J.R.; Causer, T.P.; Ciolkosz, D. Biomass for energy: A review on supply chain management models. Renew. Sustain. Energy Rev. 2020, 120, 109658. [Google Scholar] [CrossRef]
  4. Nishiguchi, S.; Tabata, T. Assessment of social, economic, and environmental aspects of woody biomass energy utilization: Direct burning and wood pellets. Renew. Sustain. Energy Rev. 2016, 57, 1279–1286. [Google Scholar] [CrossRef]
  5. Acda, M.N.; Devera, E.E. Physico-chemical properties of wood pellets from forest residues. J. Trop. For. Sci. 2014, 26, 589–595. [Google Scholar]
  6. Evans, A.; Strezov, V.; Evans, T.J. Sustainability considerations for electricity generation from biomass. Renew. Sustain. Energy Rev. 2010, 14, 1419–1427. [Google Scholar] [CrossRef]
  7. International Energy Agency Statistics Data Browser. 2022. Available online: https://www.iea.org/statistics/ (accessed on 19 March 2022).
  8. Empresa de Pesquisa Energética. EPE Brazilian Energy Balance 2019 Year 2018; EPE—Empresa Pesquisa Energética: Rio de Janeiro, Brazil, 2019; 297p. [Google Scholar]
  9. Coelho Junior, L.M.; Martins, K.L.C.; Carvalho, M. Carbon Footprint Associated with Firewood Consumption in Northeast Brazil: An Analysis by the IPCC 2013 GWP 100y Criterion. Waste Biomass Valoriz. 2019, 10, 2985–2993. [Google Scholar] [CrossRef]
  10. Jin, E.; Sutherland, J.W. An integrated sustainability model for a bioenergy system: Forest residues for electricity generation. Biomass Bioenerg. 2018, 119, 10–21. [Google Scholar] [CrossRef]
  11. Food and Agriculture Organization of the United Nations Wood Energy. Available online: https://www.fao.org/forestry/energy/en/ (accessed on 19 March 2022).
  12. Da Costa Martins, K.D.L.; Melquíades, T.F.; de Rezende, J.L.P.; Coelho Junior, L.M. Plant Extractivism Production Disparity Between Northeast Brazil and Brazil. Floresta Ambient. 2018, 25, e20160456. [Google Scholar] [CrossRef]
  13. Marshall, A. Princípios de Economia; Nova Cultura: Sao Paulo, Brazil, 1984. [Google Scholar]
  14. Porter, M.E. Location, Competition, and Economic Development: Local Clusters in a Global Economy. Econ. Dev. Q. 2000, 14, 15–34. [Google Scholar] [CrossRef]
  15. Porter, M.E. Clusters and the new economics of competition. Harv. Bus. Rev. 1998, 76, 77–90. [Google Scholar] [PubMed]
  16. Capello, R. Regional Economics; Routledge: London, UK, 2015; ISBN 9781138855885. [Google Scholar]
  17. Pereira, M.G.; Caramelo, L.; Orozco, C.V.; Costa, R.; Tonini, M. Space-time clustering analysis performance of an aggregated dataset: The case of wildfires in Portugal. Environ. Model. Softw. 2015, 72, 239–249. [Google Scholar] [CrossRef]
  18. Kulldorff, M. A spatial scan statistic. Commun. Stat. Theory Methods 1997, 26, 1481–1496. [Google Scholar] [CrossRef]
  19. Arroyo, L.H.; Yamamura, M.; Protti-Zanatta, S.T.; Fusco, A.P.B.; Palha, P.F.; Ramos, A.C.V.; Uchoa, S.A.; Arcêncio, R.A. Identificação de áreas de risco para a transmissão da tuberculose no município de São Carlos, São Paulo, 2008 a 2013. Epidemiol. Serviços Saúde 2017, 26, 525–534. [Google Scholar] [CrossRef]
  20. Lieu, T.A.; Ray, G.T.; Klein, N.P.; Chung, C.; Kulldorff, M. Geographic Clusters in Underimmunization and Vaccine Refusal. Pediatrics 2015, 135, 280–289. [Google Scholar] [CrossRef] [Green Version]
  21. Nigatu, A.M.; Gelaye, K.A.; Degefie, D.T.; Birhanu, A.Y. Spatial variations of women’s home delivery after antenatal care visits at lay Gayint District, Northwest Ethiopia. BMC Public Health 2019, 19, 677. [Google Scholar] [CrossRef]
  22. Randolph, K.D. Using satscan spatial-scan software with national forest inventory data: A case study in South Carolina. Math. Comput. For. Nat. Sci. 2017, 9, 1–13. [Google Scholar]
  23. Vega Orozco, C.; Tonini, M.; Conedera, M.; Kanveski, M. Cluster recognition in spatial-temporal sequences: The case of forest fires. Geoinformatica 2012, 16, 653–673. [Google Scholar] [CrossRef] [Green Version]
  24. Shekede, M.D.; Mupandira, I.; Gwitira, I. Spatio-temporal clustering of active wildfire pixels over a 19-year period in a southern African savanna ecosystem of Zimbabwe. S. Afr. Geogr. J. 2020, 103, 283–302. [Google Scholar] [CrossRef]
  25. Coelho Junior, L.M.; Santos Junior, E.P.; Nunes, A.M.M.; Simioni, F.J.; Abrahao, R.; Junior, P.R. Concentration and Spatial Clustering of Forest-Based Thermoelectric Plants in Brazil. IEEE Access 2020, 8, 221932–221941. [Google Scholar] [CrossRef]
  26. Coelho Junior, L.M.; Santos Junior, E.P.; Nunes, A.M.M.; de Souza, A.N.; Borges, L.A.C.; Simioni, F.J. Concentration and Clusters of Black Liquor Thermoelectric Plants in Brazil. IEEE Lat. Am. Trans. 2021, 19, 2122–2129. [Google Scholar] [CrossRef]
  27. Agência Nacional de Energia Elétrica. Sistema de Informações de Geração da ANEEL. 2020. Available online: http://www2.aneel.gov.br/aplicacoes/capacidadebrasil/OperacaoCapacidadeBrasil.cfm (accessed on 5 September 2020).
  28. Instituto Brasileiro de Geografia e Estatística. Malhas Territoriais. 2022. Available online: https://www.ibge.gov.br/geociencias/organizacao-do-territorio/malhas-territoriais.html (accessed on 1 April 2022).
  29. Kulldorff, M. SaTScanTM user guide for version 9.4. J. Geogr. Inf. Syst. 2015, 13, 116. [Google Scholar]
  30. Kulldorff, M.; Heffernan, R.; Hartman, J.; Assunção, R.; Mostashari, F. A Space-Time Permutation Scan Statistic for Disease Outbreak Detection. PLoS Med. 2005, 2, e59. [Google Scholar] [CrossRef] [PubMed] [Green Version]
  31. Dwass, M. Modified Randomization Tests for Nonparametric Hypotheses. Ann. Math. Stat. 1957, 28, 181–187. [Google Scholar] [CrossRef]
  32. Cuenca, G.M.A.; Dompieri, M.H.G. Dinâmica espacial da canavicultura e análise dos efeitos sobre o valor bruto da produção, na região dos tabuleiros costeiros da Paraíba, Pernambuco e Alagoas. Rev. Econômica Do Nordeste 2016, 47, 91–106. [Google Scholar]
  33. Bichel, A.; Telles, T.S. Spatial dynamics of firewood and charcoal production in Brazil. J. Clean. Prod. 2021, 313, 127714. [Google Scholar] [CrossRef]
  34. Simioni, F.J.; Moreira, J.M.M.Á.P.; Fachinello, A.L.; Buschinelli, C.C.D.A.; da Matsuura, M.I.S.F. Evolução e concentração da produção de lenha e carvão vegetal da silvicultura no Brasil. Ciência Florest. 2017, 27, 731–742. [Google Scholar] [CrossRef] [Green Version]
  35. De Oliveira, L.L.; de Oliveira Ribeiro, C.; Qadrdan, M. Analysis of electricity supply and demand intra-annual dynamics in Brazil: A multi-period and multi-regional generation expansion planning model. Int. J. Electr. Power Energy Syst. 2022, 137, 107886. [Google Scholar] [CrossRef]
  36. Brasil Plano Decenal de Expansão de Energia 2027, Brasília. 2018. Available online: http://antigo.mme.gov.br/web/guest/secretarias/planejamento-e-desenvolvimento-energetico/publicacoes/plano-decenal-de-expansao-de-energia (accessed on 2 April 2022).
  37. Dufourny, A.; Van De Steene, L.; Humbert, G.; Guibal, D.; Martin, L.; Blin, J. Influence of pyrolysis conditions and the nature of the wood on the quality of charcoal as a reducing agent. J. Anal. Appl. Pyrolysis 2019, 137, 1–13. [Google Scholar] [CrossRef]
  38. Da Silva, R.R.; de CarvalhoMathias, F.R.; Bajay, S.V. Potential energy efficiency improvements for the Brazilian iron and steel industry: Fuel and electricity conservation supply curves for integrated steel mills. Energy 2018, 153, 816–824. [Google Scholar] [CrossRef]
  39. Broughel, A.E. Impact of state policies on generating capacity for production of electricity and combined heat and power from forest biomass in the United States. Renew. Energy 2019, 134, 1163–1172. [Google Scholar] [CrossRef]
  40. Angelo, H.; da Silva, G.F.; Moraes, V.F. Análise econômica da indústria de madeiras tropicais: O caso do pólo de Sinop, MT. Ciência Florest. 2004, 14, 91. [Google Scholar] [CrossRef] [Green Version]
  41. De Souza, J.R.F.; Pietrafesa, P.A. A nova indústria do sudoeste maranhense: Impactos socioeconômicos na cidade de Imperatriz—MA. Desenvolv. Reg. Debate 2019, 9, 143–155. [Google Scholar]
  42. Furtado, T.S.; Ferreira, J.C.; Brand, M.A.; de Muñiz, G.I.B.; Quirino, W.F. Mapeamento da frequência de uso e características da biomassa florestal utilizada para geração de energia em Lages, SC. Ciência Florest. 2012, 22, 795–802. [Google Scholar] [CrossRef] [Green Version]
  43. De Almeida, A.N.; da Silva, J.C.G.L.; Angelo, H. Influência da Klabin no mercado de madeira em tora do estado do Paraná. Cerne 2012, 18, 153–158. [Google Scholar] [CrossRef] [Green Version]
  44. Da Silva, R.C.; de Marchi Neto, I.; Seifert, S.S. Electricity supply security and the future role of renewable energy sources in Brazil. Renew. Sustain. Energy Rev. 2016, 59, 328–341. [Google Scholar] [CrossRef]
  45. De Melo, C.A.; de MartinoJannuzzi, G.; Bajay, S.V. Nonconventional renewable energy governance in Brazil: Lessons to learn from the German experience. Renew. Sustain. Energy Rev. 2016, 61, 222–234. [Google Scholar] [CrossRef]
  46. Tolmasquim, M.T.; de Barros Correia, T.; Addas Porto, N.; Kruger, W. Electricity market design and renewable energy auctions: The case of Brazil. Energy Policy 2021, 158, 112558. [Google Scholar] [CrossRef]
  47. Mercure, J.-F.; Paim, M.A.; Bocquillon, P.; Lindner, S.; Salas, P.; Martinelli, P.; Berchin, I.I.; de Andrade Guerra, J.B.S.; Derani, C.; de Albuquerque Junior, C.L.; et al. System complexity and policy integration challenges: The Brazilian Energy-Water-Food Nexus. Renew. Sustain. Energy Rev. 2019, 105, 230–243. [Google Scholar] [CrossRef]
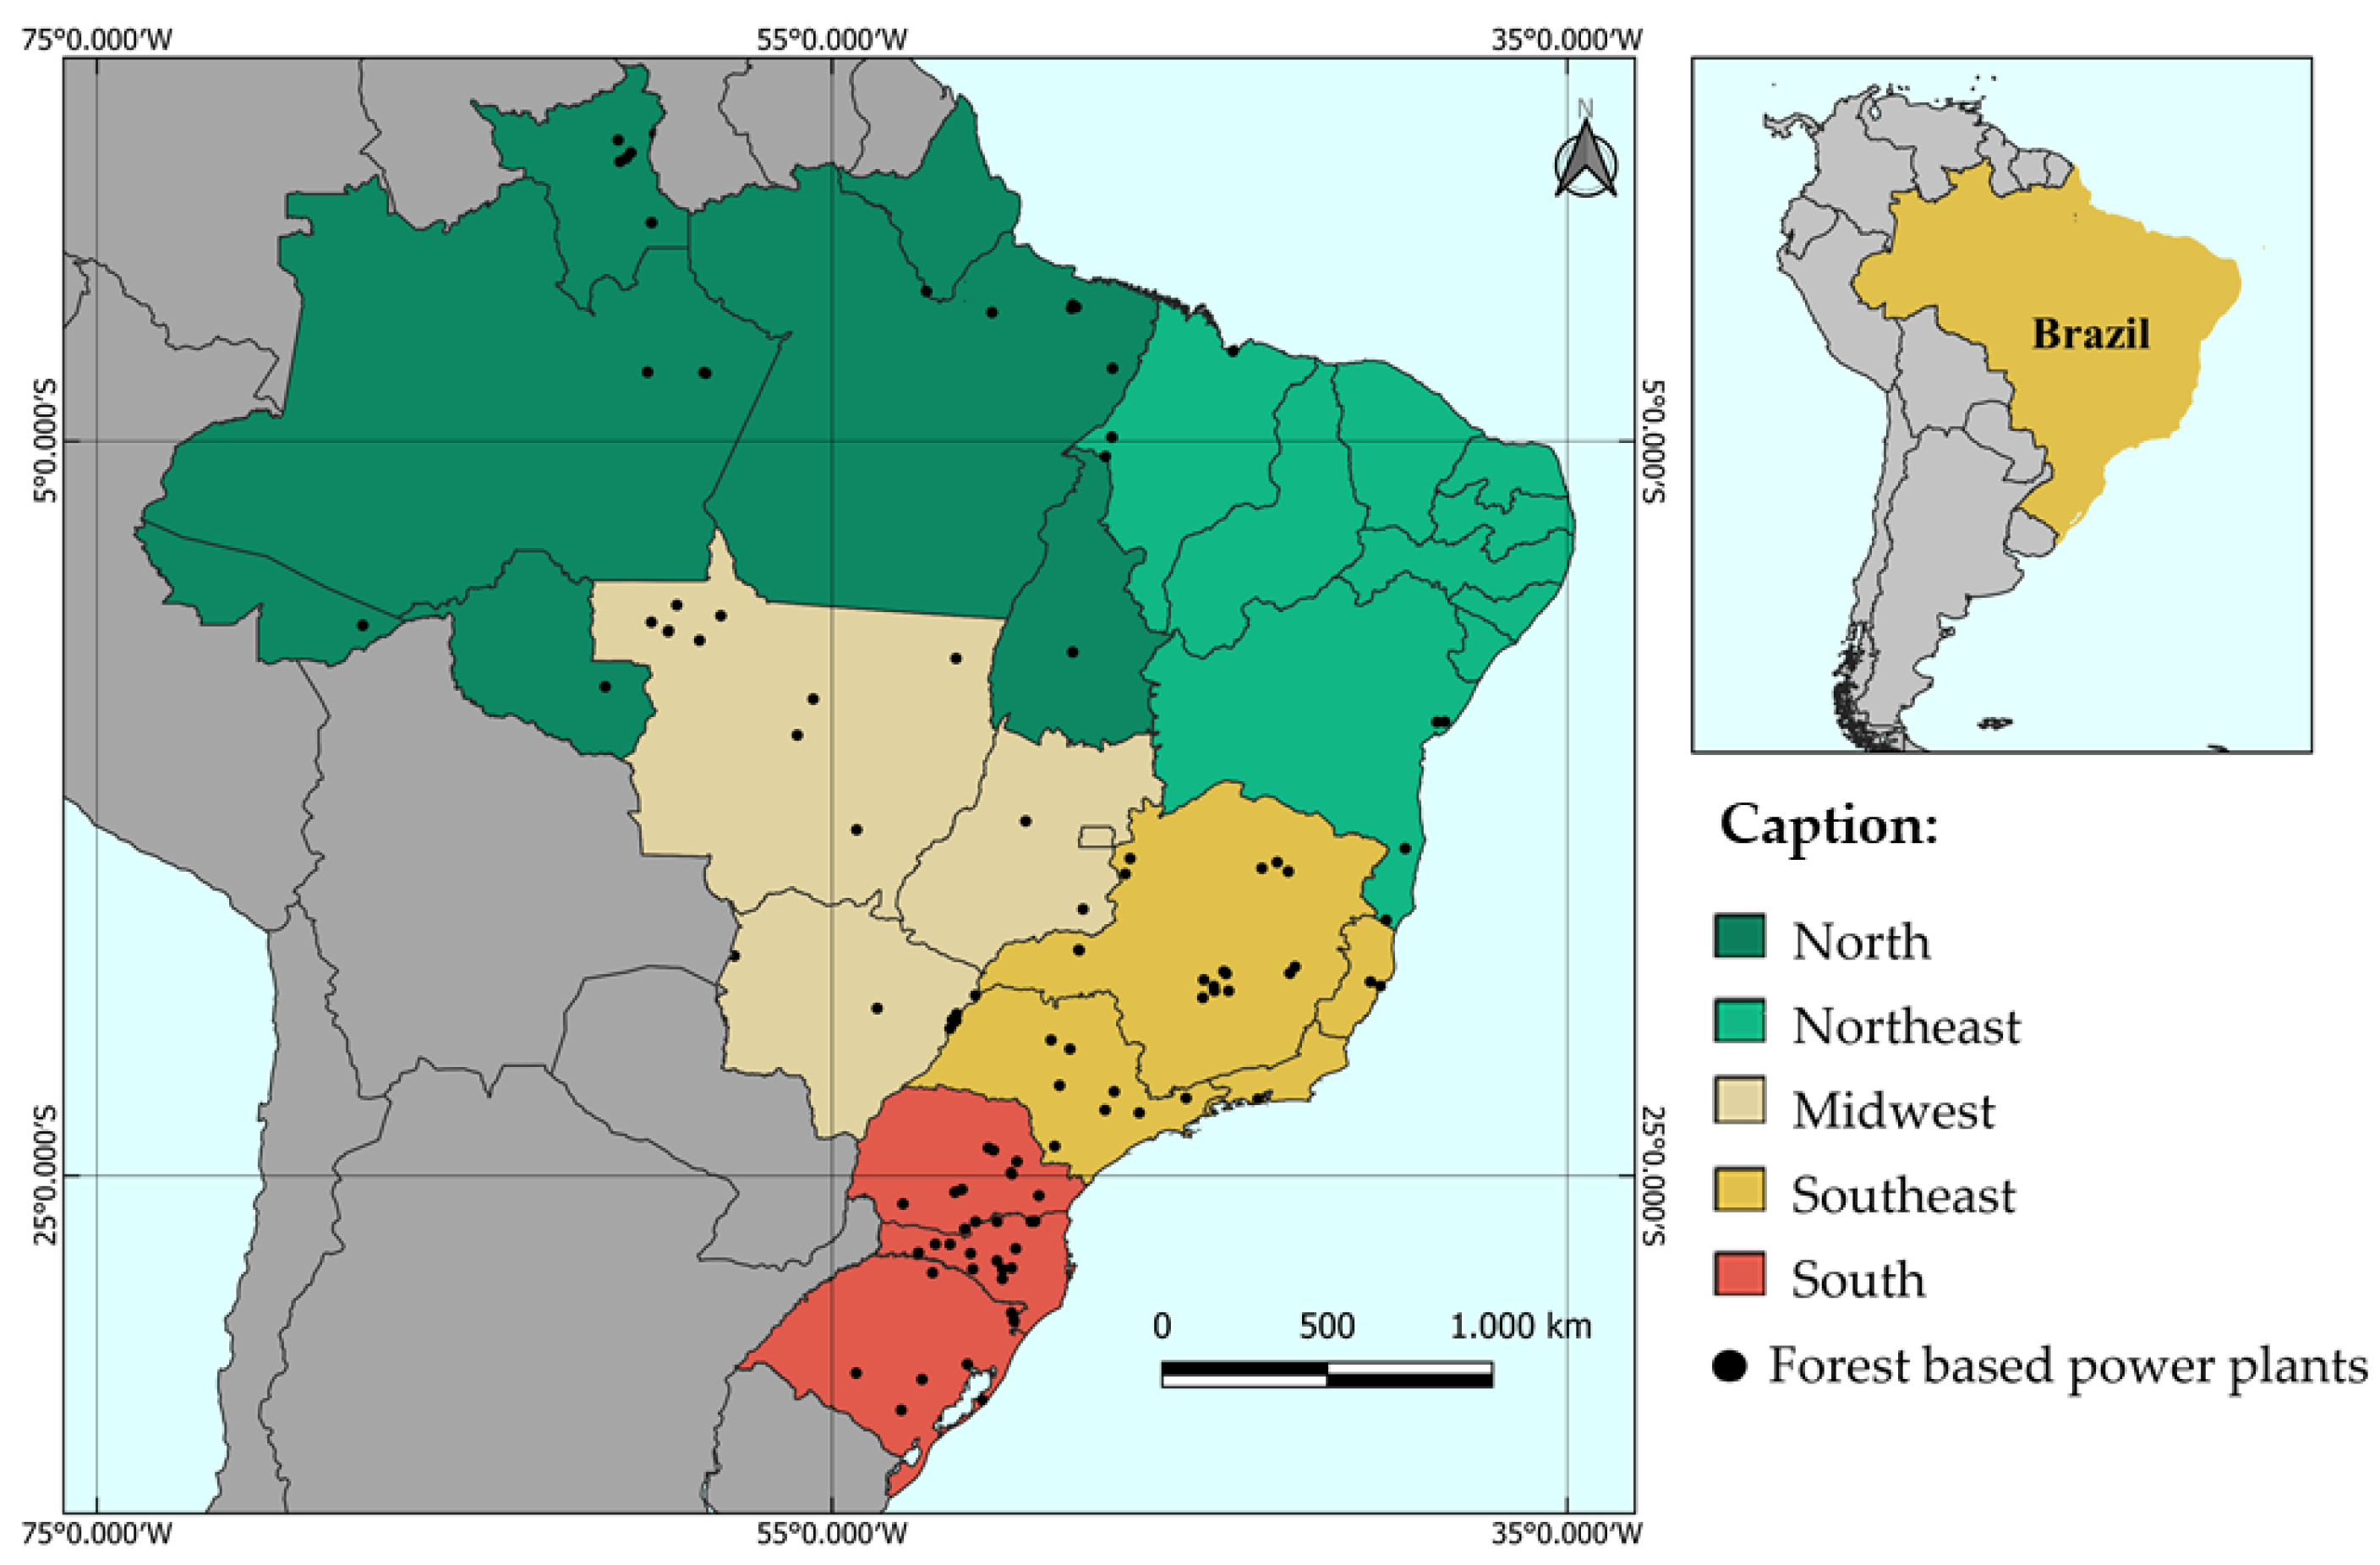
Figure 1. The spatial distribution of forest-based power plants in Brazil regions, in 2019. Source: [28].
Energies 15 04113 g001
Figure 2. Forest-based power plants clusters in Brazil for regarding the probability of 5.0%, 8.6%, 20.0%, and 30.0% probability of that the electricity generation being is forest-based, from 2000 to 2019.
Energies 15 04113 g002
Figure 3. Evolution of granted power (MegaWatts-MW), observed and expected, outside (P.Out.) and inside (P. Ins.) of forest-based power plants clusters in Brazil, 2000–2019. Energies 15 04113 i001 Pot. expected inside the cluster, Energies 15 04113 i002 Pot. expected outside the cluster, Energies 15 04113 i003 Pot. observed inside the cluster, Energies 15 04113 i004 Pot. observed outside the cluster, Energies 15 04113 i005 Cluster.
Energies 15 04113 g003
Table 1. Characterization of clusters of forest-based power plants in Brazil, 2000–2019. Caption: C. = Cluster; R = radius; LRG = generalized likelihood ratio; Obs.Avg. = average observed power during the period of existence of the cluster; Exp.Avg. = average expected power over the lifetime of the cluster.
C.CentroidR (km)LRGObs.Avg.Exp.Avg.Timep-Value
1Porto Alegre do N.-MT957.48211,586.11386.92264.372012–2019<0.001
2Três Lagoas—MS30.60154,784.35252.23171.822011–2019<0.001
3Cambará do Sul—RS134.23124,508.2868.7012.212018–2019<0.001
4Pindamonhangaba—SP360.24106,219.37119.9174.662002–2010<0.001
5Erechim—RS239.6663,438.13119.6683.502002–2010<0.001
6Carambeí-PR98.7451,839.53140.0088.312007–2010<0.001
Table 2. Characterization of isolated clusters of forest-based power plants in Brazil, 2000–2019. Caption: Obs. = Significant observations; R = radius; LRG = generalized likelihood ratio; Obs.Avg. = average observed power during the period of existence of the cluster; Exp.Avg. = average expected power over the lifetime of the cluster.
C.TermelétricaCountyLRGObs.Avg.Exp.Avg.Timep-Value
1Fibria—MS IITrês Lagoas-MS486,909.02269,580.0071,110.792017–2019<0.001
2Klabin CeluloseOrtigueira-PR327,648.46330,000.00186,411.812013–2019<0.001
3CenibraBelo Oriente-MG167,727.27100,000.0048,658.052000–2007<0.001
3VeracelEunápolis-BA128,345.16121,822.5069,882.342003–2010<0.001
4Jari CeluloseAlmeirim-PA91,706.3155,000.0026,761.932000–2007<0.001
5Bahia PulpCamaçari-BA67,399.03108,600.0063,262.772007–2011<0.001
6Suzano MucuriMucuri-BA37,517.0292,000.0052,059.602000–2002<0.001
7TriunfoRio Branco-AC35,093.9028,970.0014,251.902014–2019<0.001
8João NeivaJoão Neiva-ES4229.263500.001721.842014–2019<0.001
Publisher’s Note: MDPI stays neutral with regard to jurisdictional claims in published maps and institutional affiliations.