Article

Possible Pathways toward Carbon Neutrality in Thailand’s Electricity Sector by 2050 through the Introduction of H2 Blending in Natural Gas and Solar PV with BESS

by
Radhanon Diewvilai
1 and
Kulyos Audomvongseree
1,2,*
1
Department of Electrical Engineering, Chulalongkorn University, Bangkok 10330, Thailand
2
Energy Research Institute, Chulalongkorn University, Bangkok 10330, Thailand
*
Author to whom correspondence should be addressed.
Energies 2022, 15(11), 3979; https://doi.org/10.3390/en15113979
Submission received: 21 April 2022 / Revised: 23 May 2022 / Accepted: 25 May 2022 / Published: 27 May 2022

Abstract

:
To avoid the potential adverse impacts of climate change from global warming, it is suggested that the target of net zero emissions should be reached by this mid-century. Thailand is aiming to achieve carbon neutrality by 2050. Since electricity generation is one of the largest producers of carbon dioxide emission, the associated emissions must be greatly reduced to achieve the targets mentioned above. Thus, new generation expansion plans must be well developed. This paper discusses the development of generation expansion plans considering Thailand’s latest policies along with enhancement of the existing multi-period linear programming model, allowing new electricity generation technologies having low emissions, e.g., solar PV with battery and hydrogen blending in natural gas, to be integrated into generation expansion planning. Then, four generation expansion plans with different levels of hydrogen blending in natural gas are proposed and discussed. It is found that Thailand can achieve carbon neutrality by 2050 by promoting more use of renewable energy altogether with trade-off between land for solar PV installation and amount of hydrogen blended in natural gas. The lesson learned from this study provides crucial information about possible pathways to achieve carbon neutrality in the electricity sector for policy makers in other countries.

1. Introduction

Global warming is one of the most important problems facing contemporary society. To avoid the potentially serious adverse impact of climate change, the International Panel on Climate Change (IPCC) report recommends that the rise in the global average surface temperature should be limited to no more than 1.5 °C above pre-industrial levels by reaching net zero carbon emission around the year 2050 (2045–2055 interquartile range) [1]. To achieve this goal, the Glasgow Climate Pact was agreed upon by all participants at the 26th session of the Conference of the Parties to the United Nations Framework Convention on Climate Change (COP 26); global carbon emissions must be reduced to net zero around mid-century [2]. Thus, rapid, deep, and sustained reductions in global greenhouse gas emissions are required.
As for Thailand, aggressive remarks were made by Thailand’s prime minister that Thailand is aiming to reach carbon neutrality in 2050 and net zero emission in or before 2065 [3]. This target is quite aggressive compared to an emissions reduction of 20% from the projected business-as-usual (BAU) level mentioned in Thailand’s Nationally Determined Contribution (NDC) 2030 emissions target [4], and the carbon neutrality target in 2065 stated in Thailand’s Long-Term Low Greenhouse Gas Emissions Development Strategy (LT-LEDS) [5]. Thus, achieving 2050 carbon neutrality and 2065 net zero emission requires further efforts to reduce greenhouse gas (GHG) emissions in Thailand.
According to Thailand’s LT-LEDS, the total GHG emissions in 2016 were 354 MtCO2eq. The largest contributor was the energy sector (grid-connected electricity and heat generation), accounting for 30.96% of the total. The second largest GHG emissions contributor was the transportation sector, accounting for 19.26%. These two sectors account for more than 50% of Thailand’s total GHG emissions. Thus, GHG emissions from these sectors need to be greatly reduced to achieve the 2050 carbon neutrality and 2065 net zero emission targets. Although many efforts have been made and many national plans have been developed, according to the scenario in LT-LEDS, Thailand will not achieve carbon neutrality until 2065 even with 120 MtCO2eq of GHG sink from land use, land-use change, and forestry (LULUCF) together using up to a 50% share of renewable energy. Thus, to provide possible pathways in the electricity sector toward Thailand’s carbon neutrality in 2050, plans and policies must be extended further and revised to meet the challenge. For example, increased usage of electric vehicles (EVs) and electricity generated from renewable energy resources can enhance Thailand’s efforts to meet the 2050 target. Moreover, the GHG sink from Thailand’s LULUCF may need to be increased to its maximum potential to minimize or neutralize net GHG emissions. Lastly, novel choices of power generation technologies must be considered and integrated into revised plans.
There are many options for GHG reduction in the energy sector. Expanding the use of renewable energy is the most well-known option, as evidenced by the fact that increasing the share of renewable energy in electricity generation is the target of many countries and regions, e.g., 50% for Thailand [6,7], 40% by 2030 for European Union [8], 100% by 2035 for the United Kingdom [9], and 40% by 2030 and then 80% to achieve carbon neutrality by 2060 for China [10,11].
Although many renewable energy sources are almost GHG free, the intermittency of renewable energy generation, especially with solar PV and wind power, creates variability on the supply side, which makes the task of balancing the supply and demand in the system (with high levels of variable renewable energy (VRE) penetration) more challenging [12]. To mitigate this variability and unpredictability, battery energy storage systems (BESSs) have been introduced in an effort to develop sustainable solutions that enable generation systems to integrate a high share of variable renewable energy [13]. PV in combination with BESS is one of the main interests in this paper.
In the transportation sector, electrification based on the replacement of internal combustion engine (ICE) vehicles with EVs is one of the best available options due to the difference in the efficiency of ICE vehicles (20–25%) [14] and electric motors with batteries in EVs (70–80%) [15]. Moreover, the electricity used by EVs can be produced by renewable resources with no GHG emissions compared to the petroleum fuel used in ICE vehicles. Lastly, with its built-in battery and V2G concept, an EV may be able to serve as part of an ESS to support the production of electricity from renewable resources in the future [16].
As for alternative fuel, hydrogen or hydrogen blending in existing natural gas networks has become an important alternative energy since combustion of hydrogen does not produce carbon dioxide and other greenhouse gases [17]. Studies of hydrogen blending into the natural gas network have recently become popular [18]. Moreover, investments in hydrogen-tolerant infrastructure are planned in many countries, e.g., the United States [19], Germany [20], Japan [21], and the United Kingdom [22]. However, the blending of hydrogen into natural gas networks also causes a reduction in the heating value of the mixed gases. Currently, efficient and safe operation can be achieved with up to 20% hydrogen by volume [23,24].
To achieve carbon neutrality, GHG emissions in hydrogen production must also be considered. At present, most hydrogen is produced from non-renewable processes, especially the steam reforming of methane (SRM) [25], which releases carbon dioxide as a by-product (Gray Hydrogen) since the production of hydrogen from electrolysis is less efficient [26] and unsustainable in the short term [27]. Thus, carbon capture, utilization, and storage (CCUS) must be incorporated into these systems to reduce GHG emissions from SRM processes, making this hydrogen generation a lower carbon process (Blue Hydrogen) [28] with a competitive price [29]. The development of Blue Hydrogen projects is being pursued by many energy firms, for example, ExxonMobil [30], Shell [31], and Technip Energies [32]. However, if net zero emission is to be achieved, the use of hydrogen, especially electrolysis-based hydrogen generated using renewable energy (Green Hydrogen), may need to be expanded rapidly [33].
Finally, GHG sinks are also an option for the reduction of net GHG emissions. Since plants and trees absorb carbon dioxide as they grow, land use for agriculture and forestry can be developed to absorb carbon dioxide emitted from other sectors [34]. Carbon dioxide emissions can also be reduced by CCUS applications, which capture carbon dioxide either directly from its sources or from the atmosphere. However, CCUS technology development at present is quite challenging due to the variation in exhaust emissions from carbon dioxide sources and the loss of efficiency represented by the energy penalty [35]. Thus, commercialization of CCUS with power generation is still ongoing [36].
The aim of this paper is to propose the possible pathways to achieve carbon neutrality in Thailand by 2050, from which the lesson learned may provide crucial information for policy makers in other countries to achieve carbon neutrality in their system. In this paper, Thailand’s long-term electricity demand will be forecast based on available data regarding the country’s official GDP [37] and population [38] projections. To provide enough supply for the demand forecast, new power generation technologies will need to be incorporated into these plans along with several planning constraints, e.g., reliability level, fuel mix, and carbon dioxide emission. Another contribution of this paper is to propose techniques to enhance the multi-period linear programming model developed in [39], with the ability to integrate new electricity generation technologies having low emission, e.g., solar PV with battery and hydrogen blending in natural gas, into the generation expansion planning. Then, four scenarios with different levels of hydrogen blending in natural gas are analyzed and possible plans for generation expansion leading to Thailand’s carbon neutrality target in 2050 are discussed.
The rest of this paper is organized as follows: Section 2 describes the planning methods used in developing the proposed plans. Section 3 presents the data and assumptions used as an input to the method. Section 4 describes the proposed plans developed from items discussed in Section 3. In Section 5, discussions and comparisons between the proposed plans are provided. Finally, conclusions are given in Section 6.

2. Methods

In this section, the generation expansion planning method used in this study is presented. Details of the method used can be found in [39], with a few modifications in generation modeling that will be mentioned in this section.

2.1. Summary of the Method

In this study, the methodology proposed in [39] is used. To summarize, the generation expansion planning problem is divided into multiple subproblems across the planning horizon. Each subproblem considers constraints for 1 month. In each month, the existing generation system is tested by solving the linear programming problem to determine whether the entire demand can be served not only with the minimum generation cost but also with the satisfaction of all planning constraints. For example, power generation and demand must be balanced in every hour to ensure that the demand is served both in energy and power. Moreover, fuel mix and carbon dioxide emission constraints must also be satisfied. This will result in acceptable reliability indices of the system.
If there is any demand that cannot be served, or the system reliability is below the criteria, new generation units having the least total cost and satisfying all planning constraints will be added into the system. The process is repeated in the current period until the generation system can serve all demand and satisfy all constraints with acceptable reliability indices. With these processes applied, a generation expansion plan can be created by iteratively solving a series of linear programming problems. The optimal solution for the previous period is then used as the initial condition of the next period. The planning method is summarized in the flow chart in Figure 1.

2.2. Modifications and Improvement

Since the methodology proposed in [39] is not quite suitable for GEP with carbon neutrality as a target, the constraints equation used in this study will be slightly modified, as discussed in Section 2.2.1. The reliability model of the generation unit is also introduced separately from the dispatch model, as described in Section 2.2.2.

2.2.1. Constraint Modification

According to [39], the carbon dioxide emission constraint is with the average carbon dioxide emission (kgCO2/kWh) as the criterion. However, since the emission criteria in this study is shown in the amount of emitted carbon dioxide, this constraint is replaced by Equation (1):
f = 1 F j = 1 N f , y , m E F f × H R f , j × P f , j , h d     E m y , m
where:
  • N f , y , m is a set of units with fuel type f available in month m , year y (-)
  • E F f is the emission factor of fuel type f (kgCO2/Btu)
  • H R f , j is the heat rate of unit j with fuel type f (Btu/kWh)
  • P f , j , h d is the power output in the dispatch model of unit j in hour h (kW)
  • E m y , m is the carbon dioxide emission criteria of month m , year y (kgCO2)

2.2.2. Generation Unit Modelling

Generation units in this study are classified into 4 groups. Each group is modelled for generation dispatch and reliability as follows:
  • Generation unit with generation profile
A generation unit with generation profile is a unit that has a scheduled operation plan, such as a solar PV unit that can supply power depending on solar irradiance, or a unit with a firm contract and pre-specified operation plan. In this study, renewable generation units are classified as generation units with a generation profile. The standard hourly generation profile G f , h of each type f is referenced from Thailand’s Power Development Plan 2018–2037 (PDP2018) [37]. For this group, power output in the dispatch model of unit j in hour h   ( P f , j , h d ) is defined by Equation (2) as a multiple of the standard generation profile and installed capacity C f , j . Improved from the model in [39], its reliability model ( P f , j , h r ) , which is incorporated by its Forced Outage Rate ( F O R f , j ) , is defined by Equation (3).
P f , j , h d = G f , h × C f , j
P f , j , h r = G f , h × C f , j × ( 1 F O R f , j )
2.
Peak-cutting unit (energy limited unit)
In this paper, different from [39], the peak-cutting unit is modelled as an energy-limited unit. Thus, the new generation model can be summarized as follows.
A peak-cutting unit is a generation unit with limited energy output that allows it to be operated for a certain period depending upon stored energy, i.e., hydro units with reservoirs, or generation units attached to energy storage systems. Thus, according to this limit, it will be used during peak load periods when high levels of power generation are required. In this study, generation units that are classified as energy-limited units are hydro units, both domestic and imported, pumped hydroelectric storage (PHS), and Solar Photovoltaic with battery energy storage system (PVBESS) units. Reliability of the peak-cutting unit is modelled according to [40]. Power output in the dispatch model of this generation type is defined by the difference between the load duration curve (LDC) before and final peak-shaving from Equations (4) and (5). Its reliability model is defined by Equations (6) and (7).
L D C h d = L D C h d ( C j × D j , m )
L D C h d = { L D C h d , h r = 0 h L D C h r d < E j , m L D C h d , h r = 0 h L D C h r d E j , m
L D C h r = L D C h r ( C j × D j , m ) × ( 1 F O R j )
L D C h r = { L D C h r , h r = 0 h L D C h r r < E j , m L D C h r , h r = 0 h L D C h r r E j , m
where:
  • L D C h is the original load duration curve (MW)
  • L D C h is the second state modified load duration curve (MW)
  • L D C h is the final load duration curve (MW)
  • C j is the installed capacity of peak-cutting unit j (MW)
  • D j , m is the dependable factor of peak-cutting unit j in month m (%)
  • F O R j is the forced outage rate of peak-cutting unit j (-)
  • E j , m is the expected energy output of unit j in month m (MWh)
In this study, since the amount of water stored in the reservoir of a hydro unit is usually large compared to the power output of the unit, and because water can flow into the reservoir at any time, the monthly LDC and model according to [40] are used for the hydro unit. However, since the BESS of a PVBESS unit can be charged only during the defined charging period (daytime), the BESS is not allowed to discharge during this period. Moreover, BESS capacity is only designed to supply power on a day-to-day basis. Consequently, for the PVBESS units, the daily modified LDC of the loads during charging period that are set to zero is used as the load model in (4) to (7).
3.
Energy storage unit
An energy storage unit is a unit that can be charged to store electricity from the system and discharged to supply stored electricity to the system. Energy storage units considered in this study comprise PHS and BESS. In this study, the energy storage unit will be modelled as stated in [39].
4.
Conventional generation unit
A conventional generation unit is a large-scale generation unit using conventional fuels such as coal, bunker oil, or natural gas. In this study, it is assumed that these units can be dispatched if needed. The generation output of this type will be determined using the linear programming problem stated in [39], and the reliability model of this group can be represented by the Capacity Outage Probability Table (COPT).

3. Materials

In this section, the data and assumptions used to prepare a generation expansion plan for carbon neutrality by 2050 in Thailand’s electricity sector will be presented. Firstly, Thailand’s current plans and policies to reduce GHGs emissions will be presented. Secondly, Thailand’s system demand forecast (2021 to 2050) will be described. Then, Thailand’s power system and planning assumptions will be provided. Lastly, planning constraints such as carbon dioxide emissions and reliability constraints will be indicated.

3.1. Thailand’s Plans and Policies to Reduce GHGs Emissions

There have been many efforts to limit Thailand’s GHG emissions, especially from the electricity and transportation sectors. According to Thailand’s LT-LEDS, 64.20 MtCO2eq was reduced from Thailand’s projected BAU level in 2019 through implementation of Thailand’s Nationally Appropriate Mitigation Actions (NAMAs). Moreover, additional actions are planned to further reduce Thailand’s GHG emissions. For example, it is mentioned in the Energy Efficiency Plan 2018–2037 (EEP2018) [41] that the Energy Intensity is now targeted to be reduced by 30% by 2037 compared to the 2010 projected BAU. According to Thailand’s Alternative Energy Development Plan 2018–2037 (AEDP2018) [6], a renewable energy generation capacity of 29,411 MW should be commissioned into the grid by 2037. Moreover, the target for average carbon dioxide emissions from electricity generated for the electricity grid shall be continually decreased from 0.442 kgCO2/kWh in 2020 [42] to 0.271 kgCO2/kWh by 2037, as detailed in PDP2018 [43].
In the transportation sector, a national electric vehicle roadmap was developed in 2015 [44]. Moreover, various incentives have been provided to attract foreign investment in the EV industry. Recently, a “30/30 policy” was announced to promote EV manufacturing, i.e., at least 30% of total domestic vehicle production in Thailand shall comprise EVs by 2030 [45]. With this policy, at least 725,000 electric passenger cars and pickup trucks and 675,000 electric motorcycles shall be produced in Thailand annually by 2030 [46].

3.2. System Demand Forecast

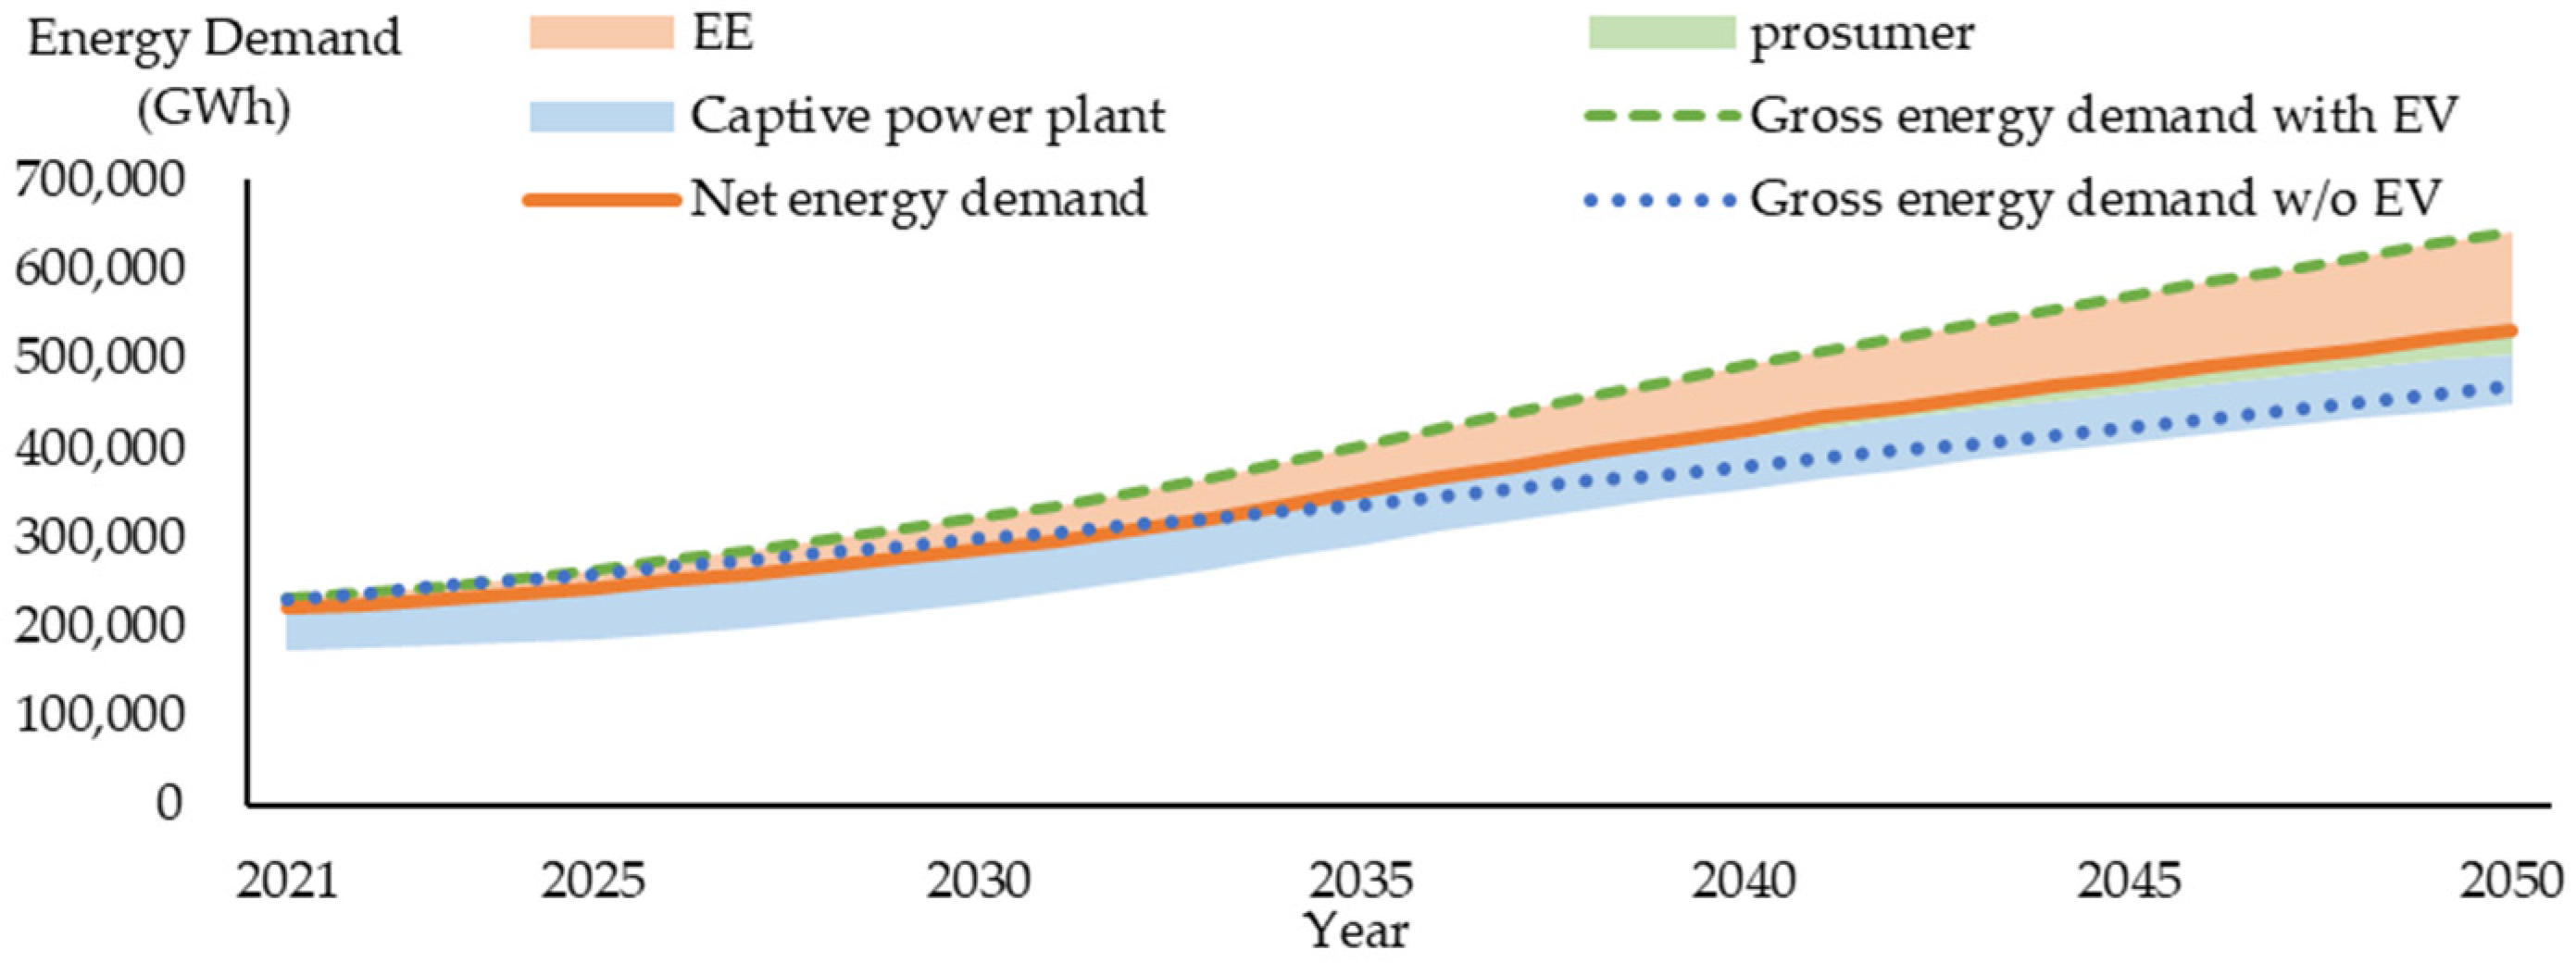
To forecast future system demand, i.e., gross electricity peak demand and energy demand (captive power plant load and prosumer load included; a prosumer is an individual who both consumes and produces electrical energy), not only demand portfolio, load factor [43], and energy elasticity [47] are considered, but related forecast data, i.e., estimation of decrease in population [38] and projection of GDP growth [43], are also taken into account. This forecast data is combined with Thailand’s actual full-year hourly load curve of 2017 (base year) in order to create an hourly load pattern from 2021 to 2050. This hourly load pattern will be used as the load model in generation expansion planning. The demand forecast at this state is shown as the blue dot line in Figure 2 and Figure 3.
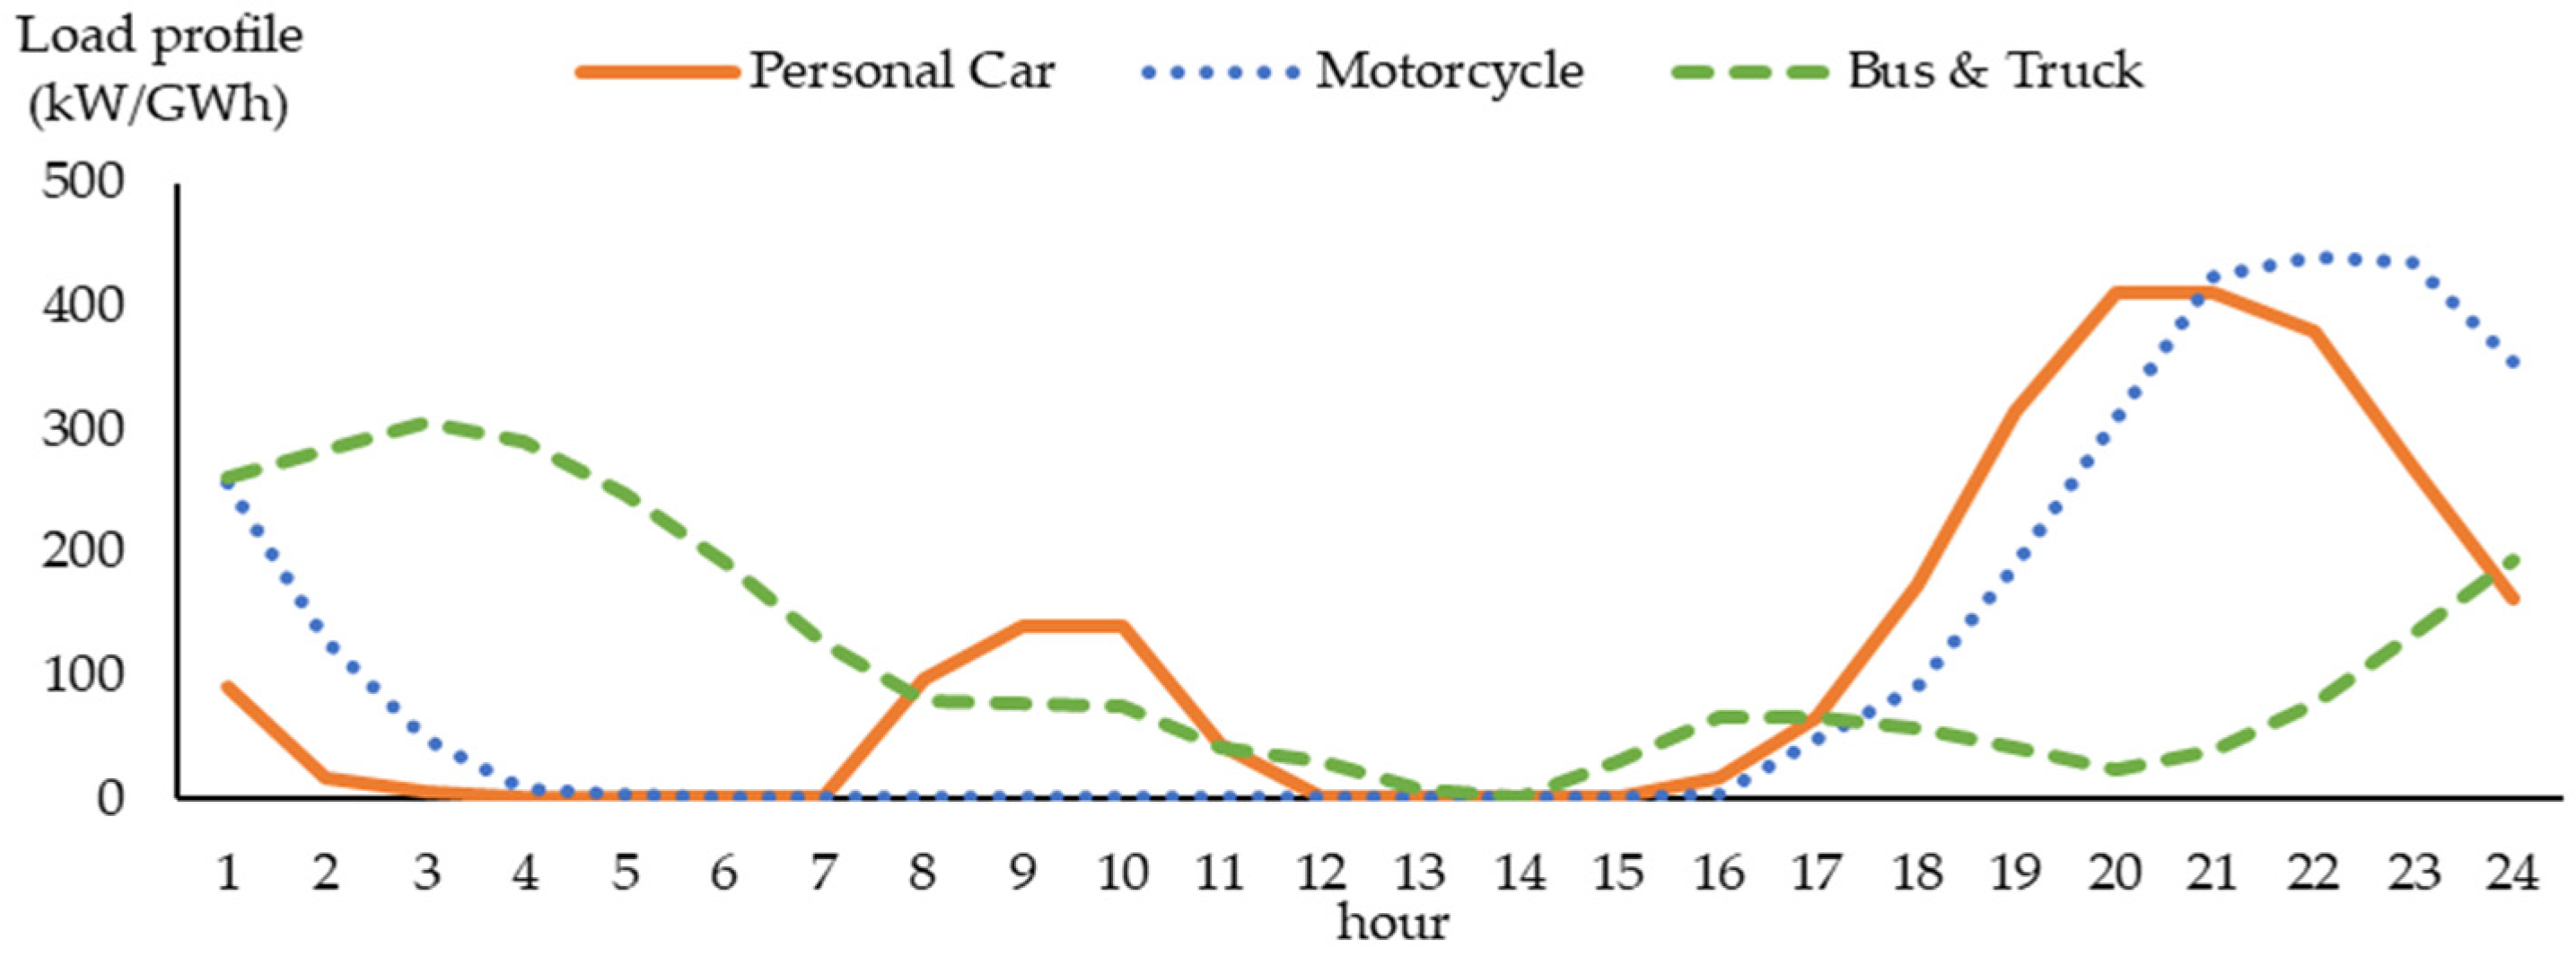
Since this system demand forecast is based on the load characteristics in 2017, several adjustments must be carried out to ensure that only the net demand that will need to be served by the generation system is considered, and that future load characteristics are represented in the load model. Firstly, while EV promotion is the main method to reduce GHG emissions in the transportation sector, there was almost no EV load in Thailand in 2017 [48]; therefore, demand from EVs shall be added into the load model to represent future EV use. This demand is forecast annually from the EV usage forecast of each type of vehicle, i.e., personal cars, pickup trucks, motorcycles, buses, and heavy-duty trucks. Then, this is converted into multiple load profiles with corresponding charging patterns for each type of vehicle [49]. Since the expected future energy usage per EV unit in each year varies according to the assumption of driving range improvement, the charging profile of EVs in kW per GWh demand of EV as shown in Figure 4 is modeled and used in planning. Each EV charging profile shown in Figure 4 is then multiplied by the future EV demand, such as 103,086 GWh for a personal car in 2050. Then, all profiles are added together to create an EV total demand profile. Next, the obtained EV total demand profile is added to the hourly load model. The demand forecast with EV load is shown as a green dashed line in Figure 2 and Figure 3. From Figure 2, it is clear that EV demand in 2050 accounts for 27% of gross demand.
Next, the load is reduced to account for improved energy efficiency (EE) of the system, based on EEP2018 [41]. As the EEP2018 ends at 2037, the energy intensity is projected to fall by the same trend from 2038 to 2050. Thus, the reduction in demand attributable to EE can be forecast and is shown as an orange solid line. Finally, the generation capacity of captive conventional power plants and prosumers comprising solar PV units for self-consumption is forecast. In this forecast, residential rooftop PV systems up to 10,000 MW will be installed by 2037 [50]. Some of these rooftop PV systems are expected to be integrated with BESS in order to fully utilize generated energy as mentioned in [50,51,52]. Generation profiles created from the capacity forecast of these units will be deducted from the hourly load model, since these captive power plants and prosumer generation units will be used to supply their demand directly. The forecast values of EE, captive power plants, prosumers, and EV demand can be found in Appendix A.

3.3. Generation System Data and Assumptions

In this subsection, information about generation data, including commissioning and retiring dates for existing generation units, committed generation units, additional renewable energy generation units, and candidate generation units, is provided. This information is used to create the system generation model for generation expansion planning.

3.3.1. Existing Generation Unit

In this paper, generation units as well as PHS as of 31 December 2020 is used as the initial (existing) system for generation expansion planning. The names of existing units, their capacity, and commissioning dates can be found in the database of Electricity Generating Authority of Thailand (EGAT) [53,54,55] and the database of the Energy Regulatory Commission (ERC) [56]. A summary of these data can be found in Appendix B.

3.3.2. Committed Generation Unit

Committed generation units are generation units that are already planned to be commissioned into the generation system. These units can be divided into two groups, which are committed units with signed contracts and committed units according to policy or plans. The list of units with signed contracts can be found in PDP2018rev1 [43], the EGAT database [53,54,55], and the ERC database [56]. Additionally, renewable energy capacity that will be commissioned to achieve the renewable energy target can be found in AEDP2018 [6]. A summary of these data and retired units can be found in Appendix C of this paper.

3.3.3. Additional Renewable Energy Generation Unit

Recently, the National Energy Policy Committee (NEPC) of Thailand reached a conclusion regarding the policy direction to increase the share of renewable energy from new generation units to a level of at least 50% of additional capacity [7]. Thus, additional renewable energy generation units on top of those of the AEDP2018 will be commissioned into the system. Given that solar PV prosumer capacity forecast is at its potential, and considering potential renewable energy resources in Thailand, additional biomass, biogas, and wind power generation units are planned for annual commissioning from 2030 to 2050, as shown in Figure 5, in order to increase the share of new generation units powered by renewable energy to the 50% target level.
Moreover, the imported power from Lao PDR, mainly from hydropower generation, is planned to increase from 9000 MW to 10,500 MW, to reduce the amount of GHG generated from electricity generation in Thailand. Thus, 1500 MW of imported hydropower generation is planned. These additional units are mentioned in Appendix C.
Lastly, to fully utilize the energy generated from renewable energy sources, it is assumed that BESS will be installed, starting from 2026. In this study, the ESS is also planned to act as a part of the spinning reserves. Hence, the storage capacity (MWh) of the BESS (with the C-rate equal to 1) in each year is set to 5% of net peak demand (MW), from 2030 onward. Thus, the additional and cumulative storage capacity of BESS units can be shown as in Figure 6. Because the BESS is expected to be used for approximately 1 cycle per day, the estimated lifetime of the BESS components is 20 years. After that, the BESS components will be replaced accordingly. The parameters of ESS units, i.e., PHS and BESS, are provided in Appendix D.

3.3.4. Candidate Generation Unit

In the planning stage [39], more generation units will be installed in the system when
  • the reliability criterion violates the target reliability level, or
  • there is no optimal solution provided by unit commitment/economic dispatch.
If more generation units are needed, those with the lowest unit cost will be selected from the set of pre-defined available generation types. However, those units must meet all the planning constraints, such as fuel mix or maximum carbon dioxide emissions. In this study, to comply with the carbon neutrality target, only two generation units with zero or near-zero emissions were selected as candidate units. Uncertainty of the cost of the electricity generated from these candidate units was also considered. This uncertainty is described in the next section.
  • Solar PV with BESS unit (PVBESS)
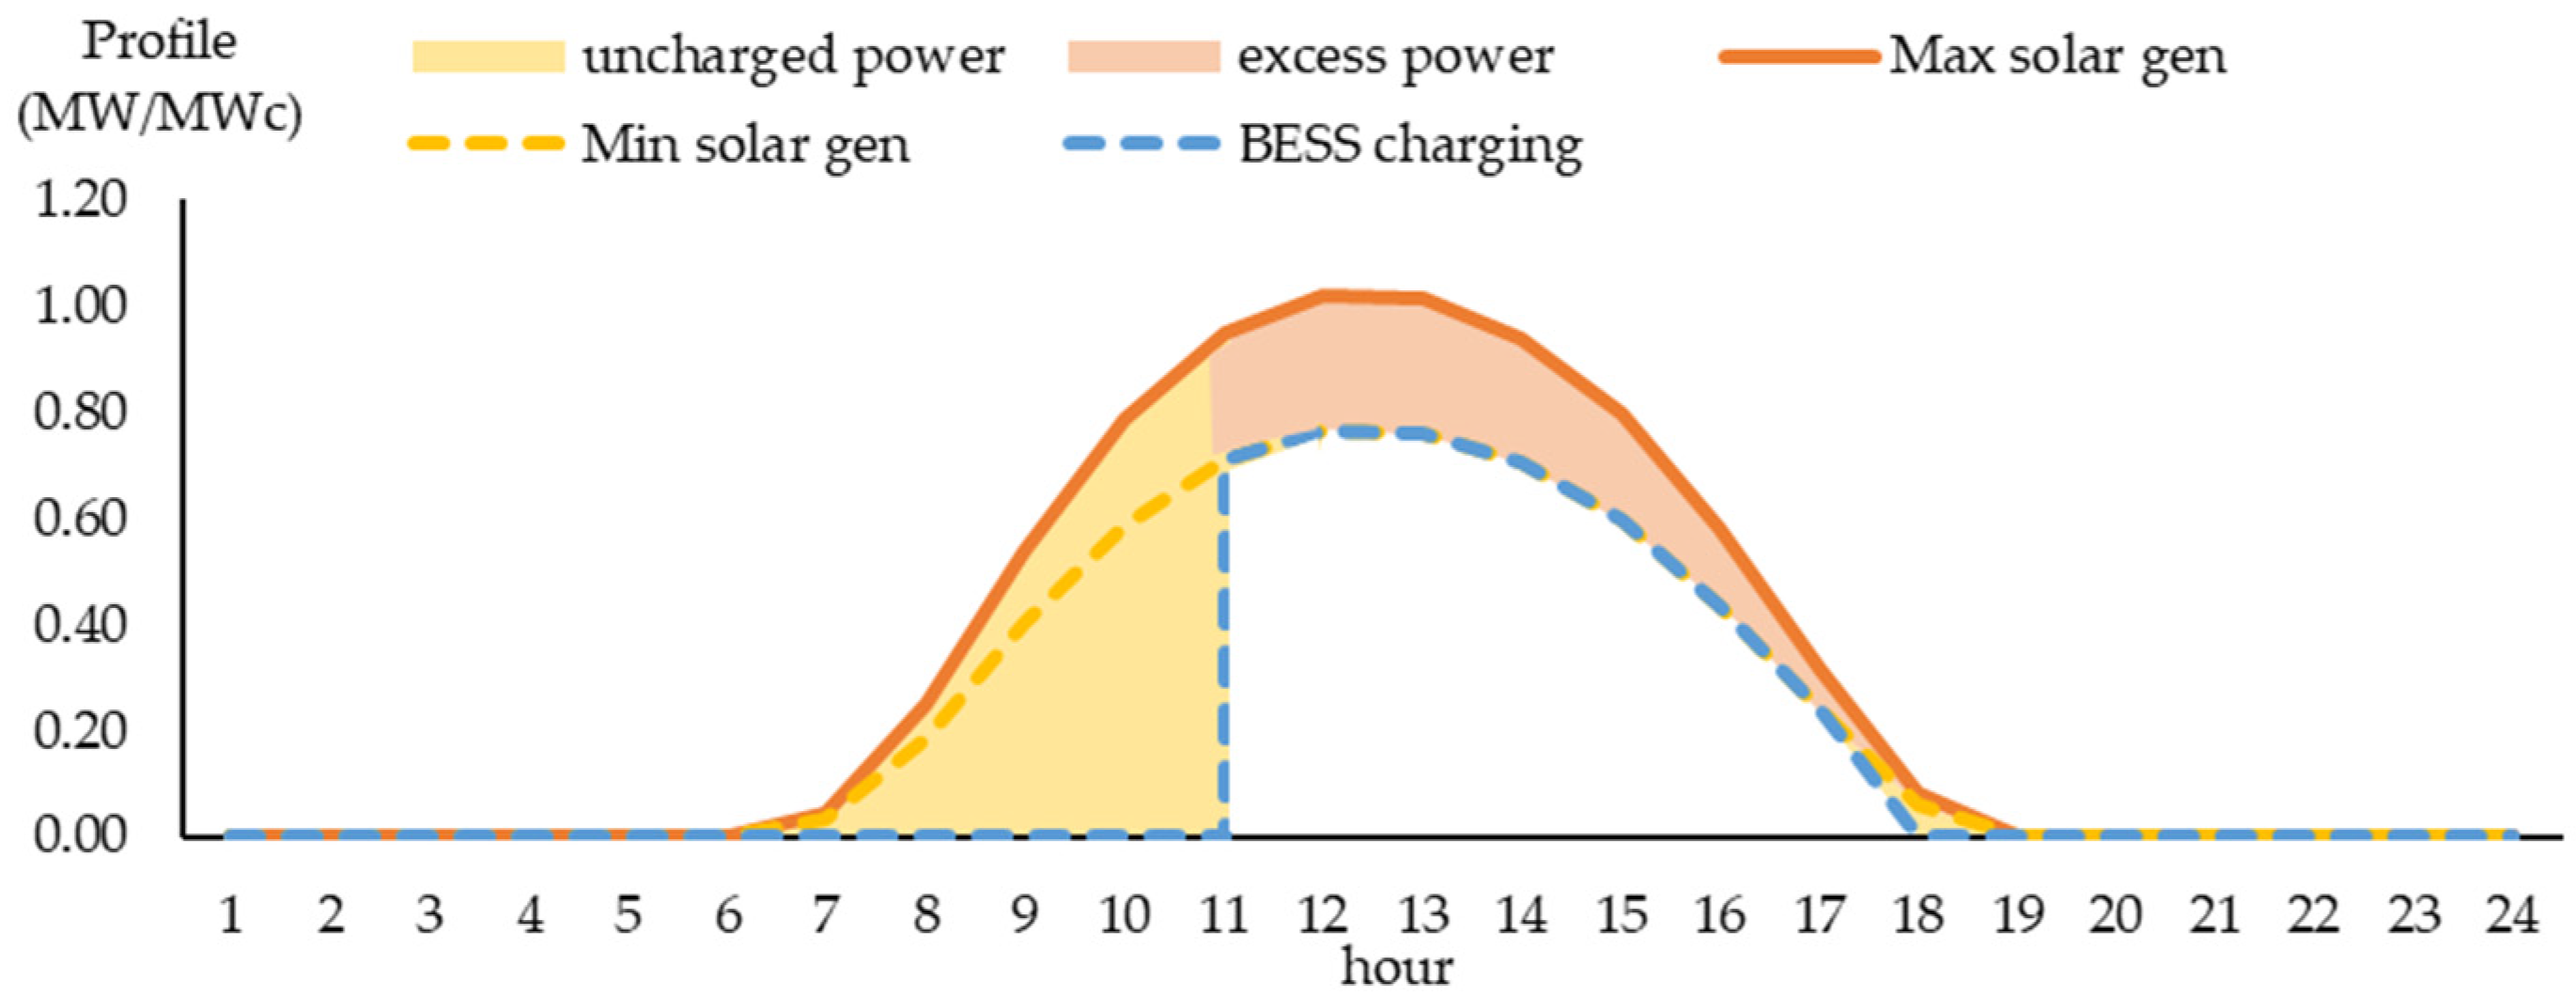
The combination of solar PV and BESS (PVBESS) comprises the first candidate unit. In this study, this unit is designed to supply power at its contracted capacity for 4 h a day in every season of the year. Therefore, the size of the generating capacity must be selected with consideration of the worst solar irradiance of the year. Moreover, the BESS must be able to be charged during a fixed interval from 11:00 to 18:00 (7 h) to comply with the PV generation profile. During this period, the BESS of the PVBESS unit will not allowed to discharge. However, on some days, if there is PV power in excess of the predefined charging power of the BESS unit, this excess power will directly flow into the system. The PV generation profile and BESS charging profile are shown in Figure 7. In this study, a PVBESS unit with the contracted capacity of 1 MW with 4 h of operation a day consists of 1.7 MW of PV combined with 5.13 MWh of BESS.
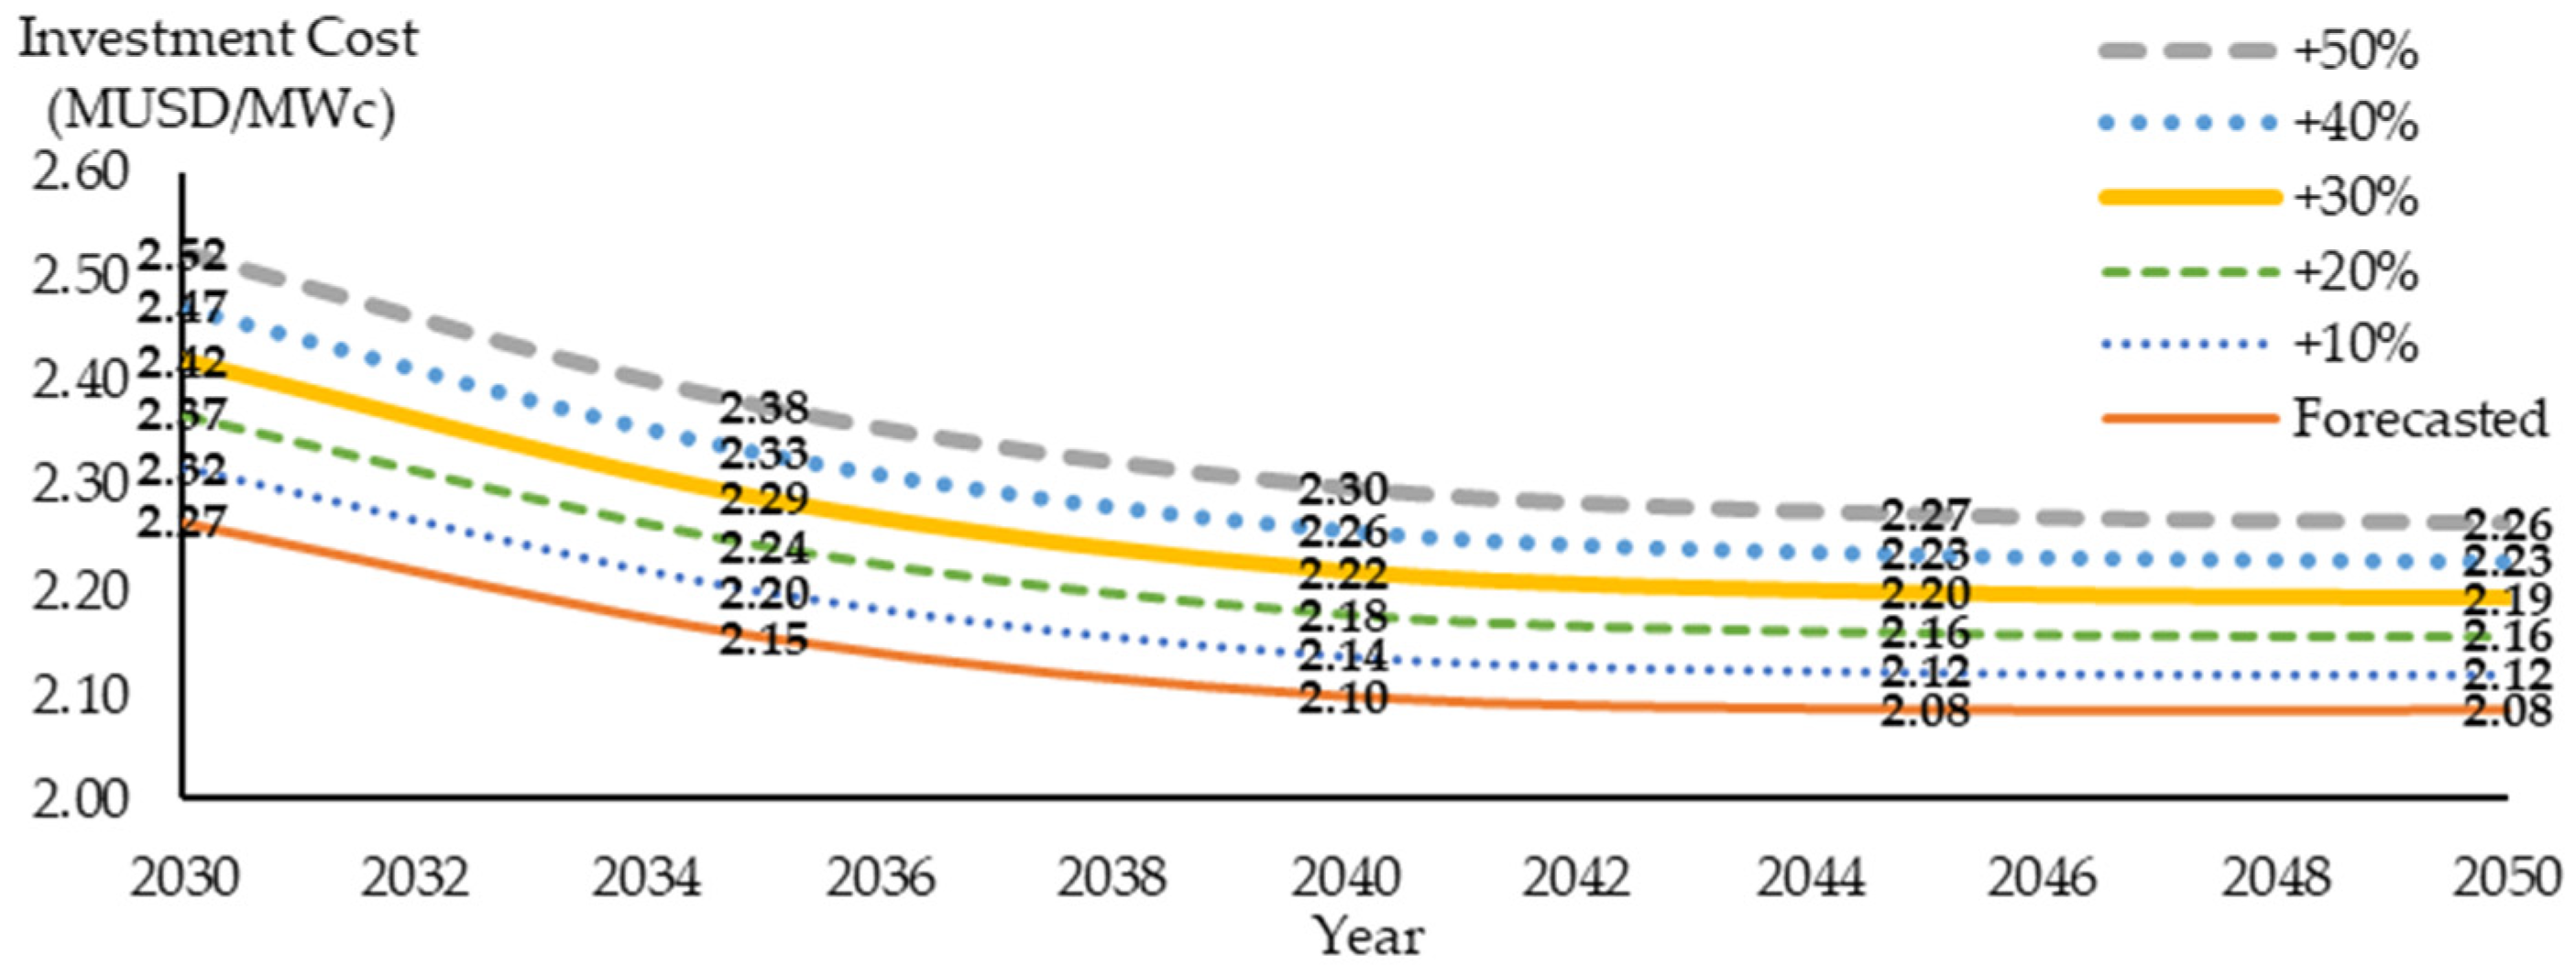
Although the investment cost of PVBESS is currently high due to the high cost of the battery, this cost is expected to fall in the future [57,58]. Thus, in this study, PVBESS units are considered as a candidate from 2030 onward, and the relevant investment cost is assumed to decline. Uncertainty of the BESS cost is also considered in this study. The probability of the projected cost is 0.5, and it is assumed that future BESS costs may be 10% to 50% above this projected value, with the associated probability shown in Table 1. Given this, future PVBESS costs can be calculated and are shown in Figure 8. PV and BESS cost projections are provided in Appendix E.
2.
Combined cycle gas turbine unit using natural gas blended with hydrogen
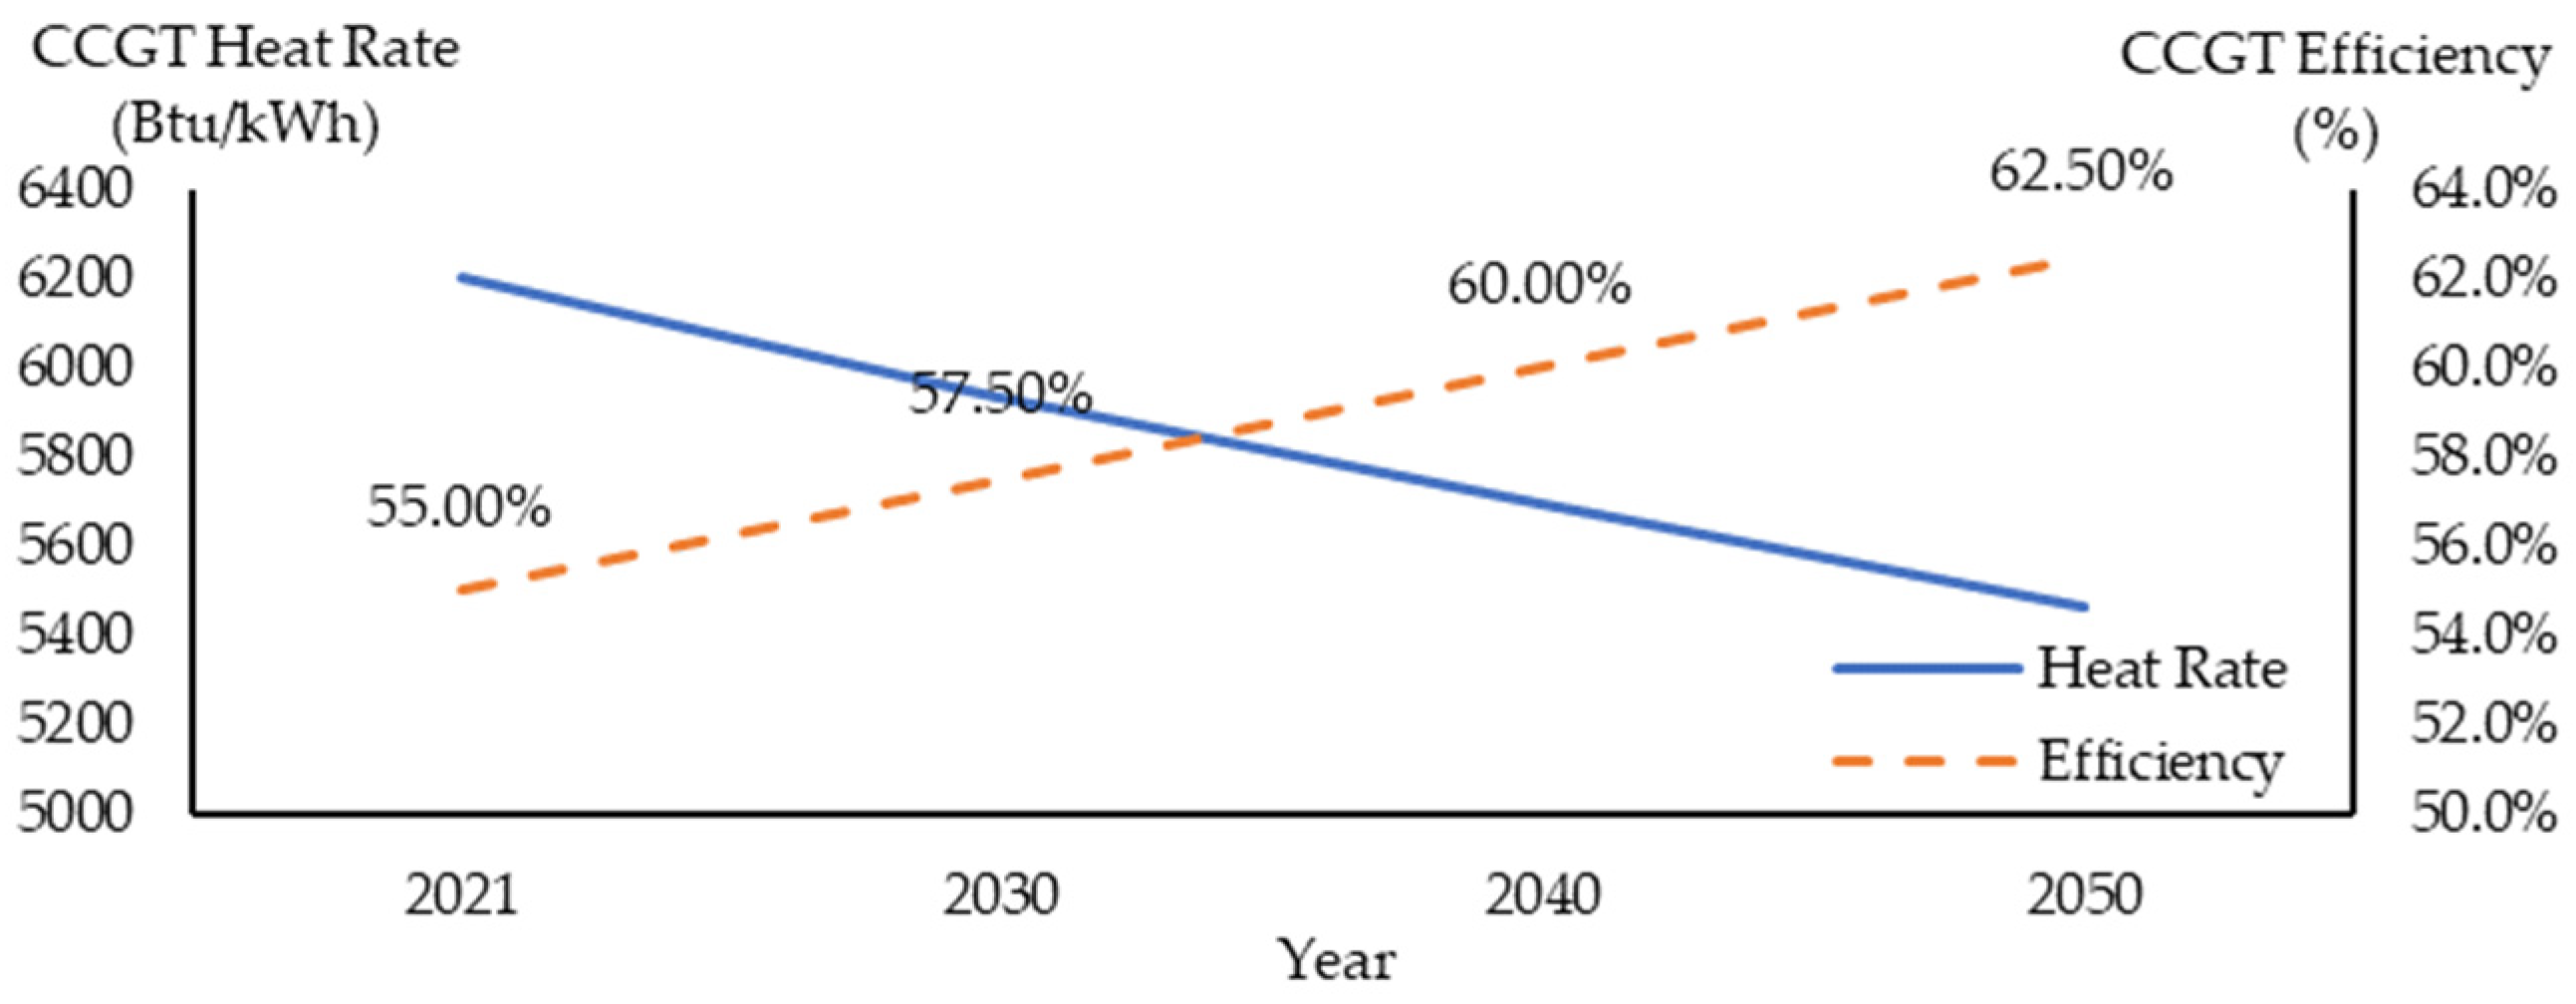
Another candidate unit considered in this study is the conventional combined cycle gas turbine (CCGT) unit. Since carbon neutrality must be achieved, fuel gas used in the system is hydrogen blended with natural gas (mixed gas). The investment cost of the candidate CCGT unit is fixed throughout the planning horizon (2021 to 2050), but the efficiency of the new power plant is expected to be improved every year (i.e., its heat rate is projected to decrease), as shown in Figure 9.

3.4. Planning Constraints

In this study, to ensure availability, reliability, and carbon neutrality of the generation system, the following constraints are considered in generation expansion planning.
  • Full-year hourly energy balance constraint
Because the power system will comprise a high share of VRE, i.e., wind and solar, which vary by time of day and season, a full-year hourly generation profile is selected as the model for these VRE units, since it can represent their time-variation/seasonal characteristics. Thus, to ensure system adequacy throughout the year without capacity shortage, a full-year hourly energy and power balance between supply, storage, and demand is applied to every year in the planning horizon of this study.
  • Reliability constraint
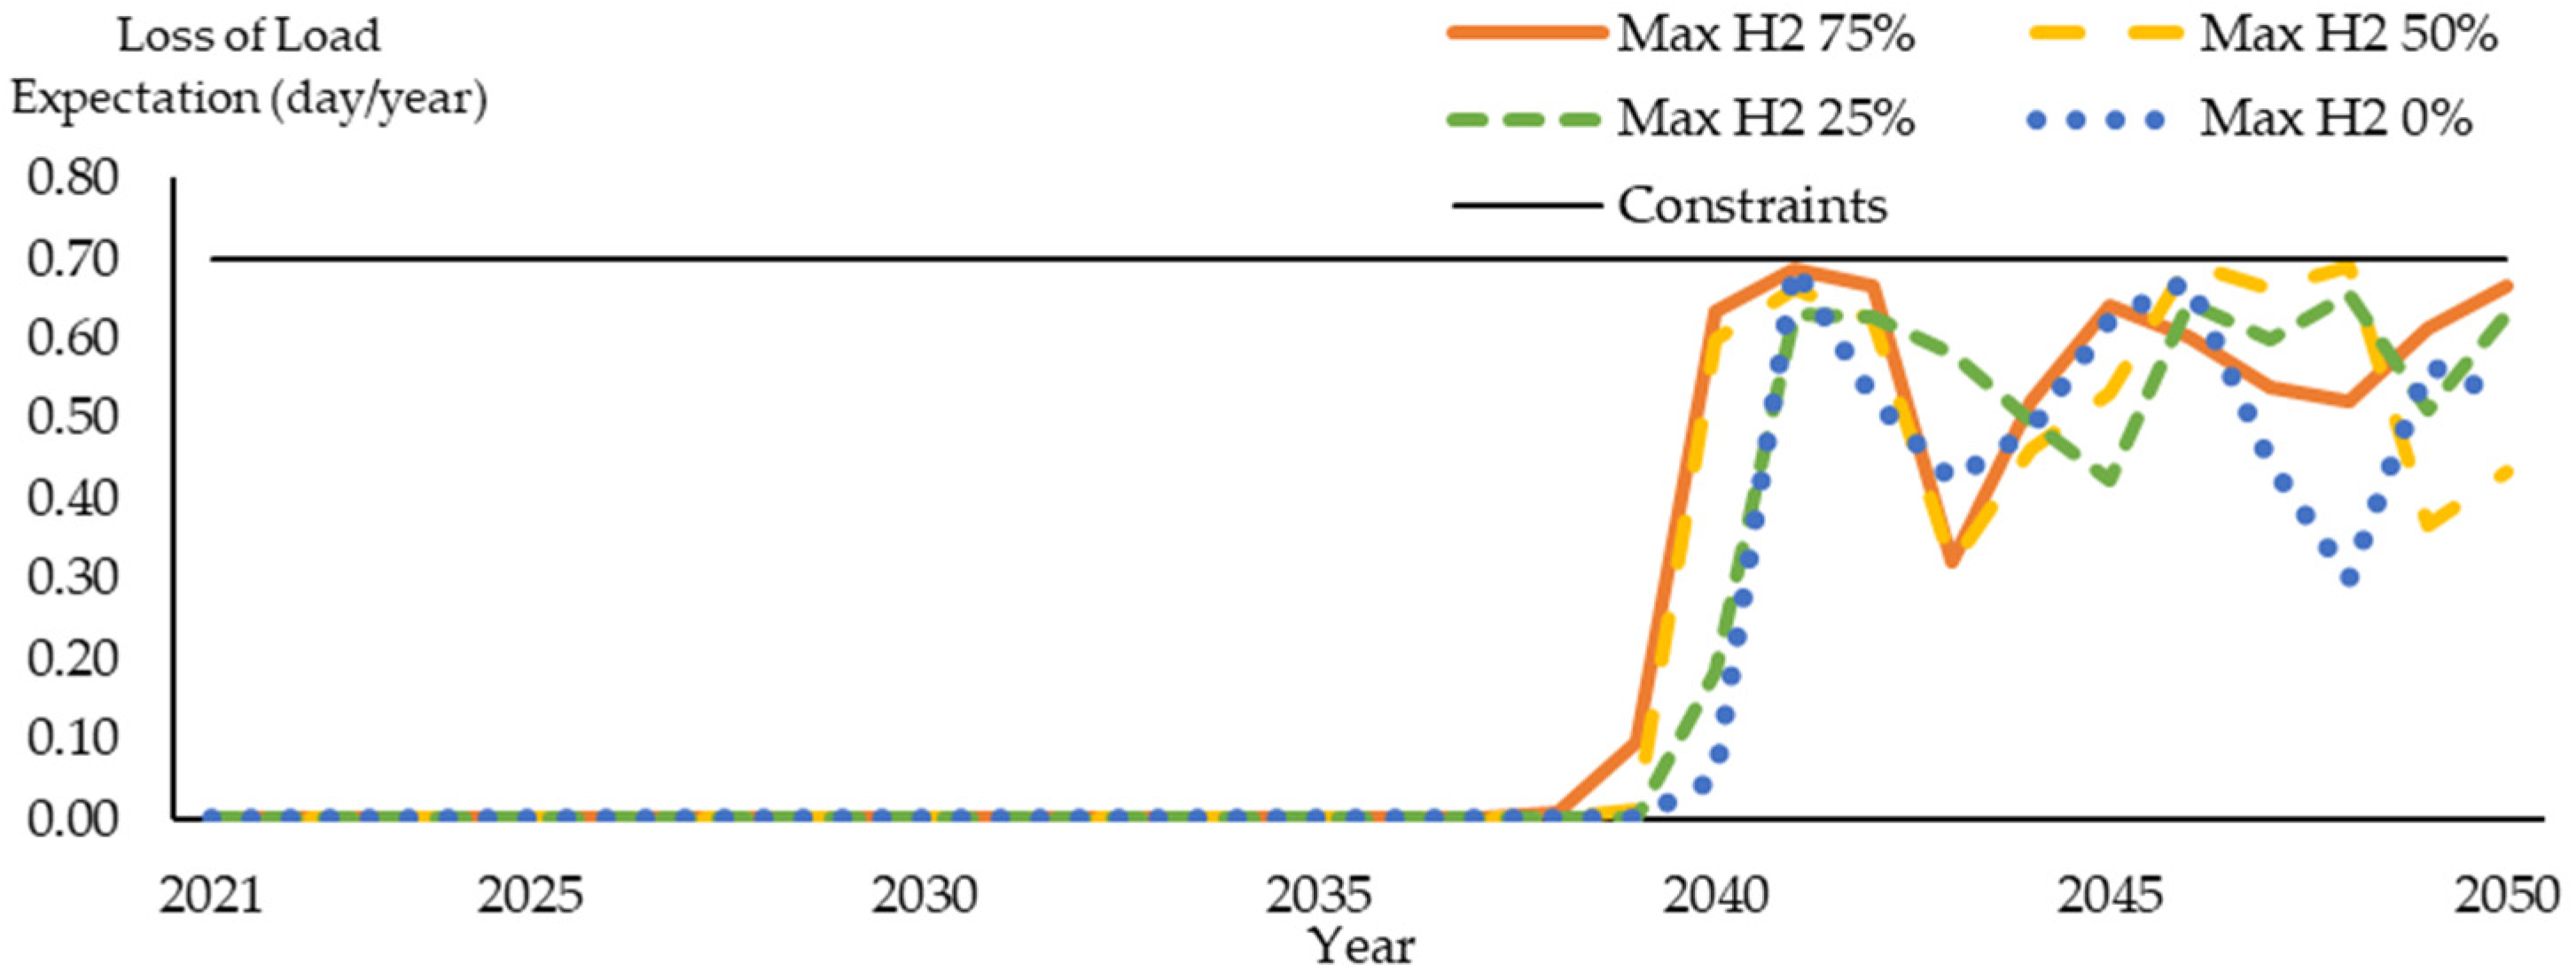
Loss of Load Expectation (LOLE), which is the number of days that capacity shortages are expected, will be used as the main reliability constraint, since the intermittency of variable renewable energy can be represented. In this study, the LOLE of the system must not be greater than 0.7 day/year for every year in the planning horizon.
  • Carbon dioxide emission constraint
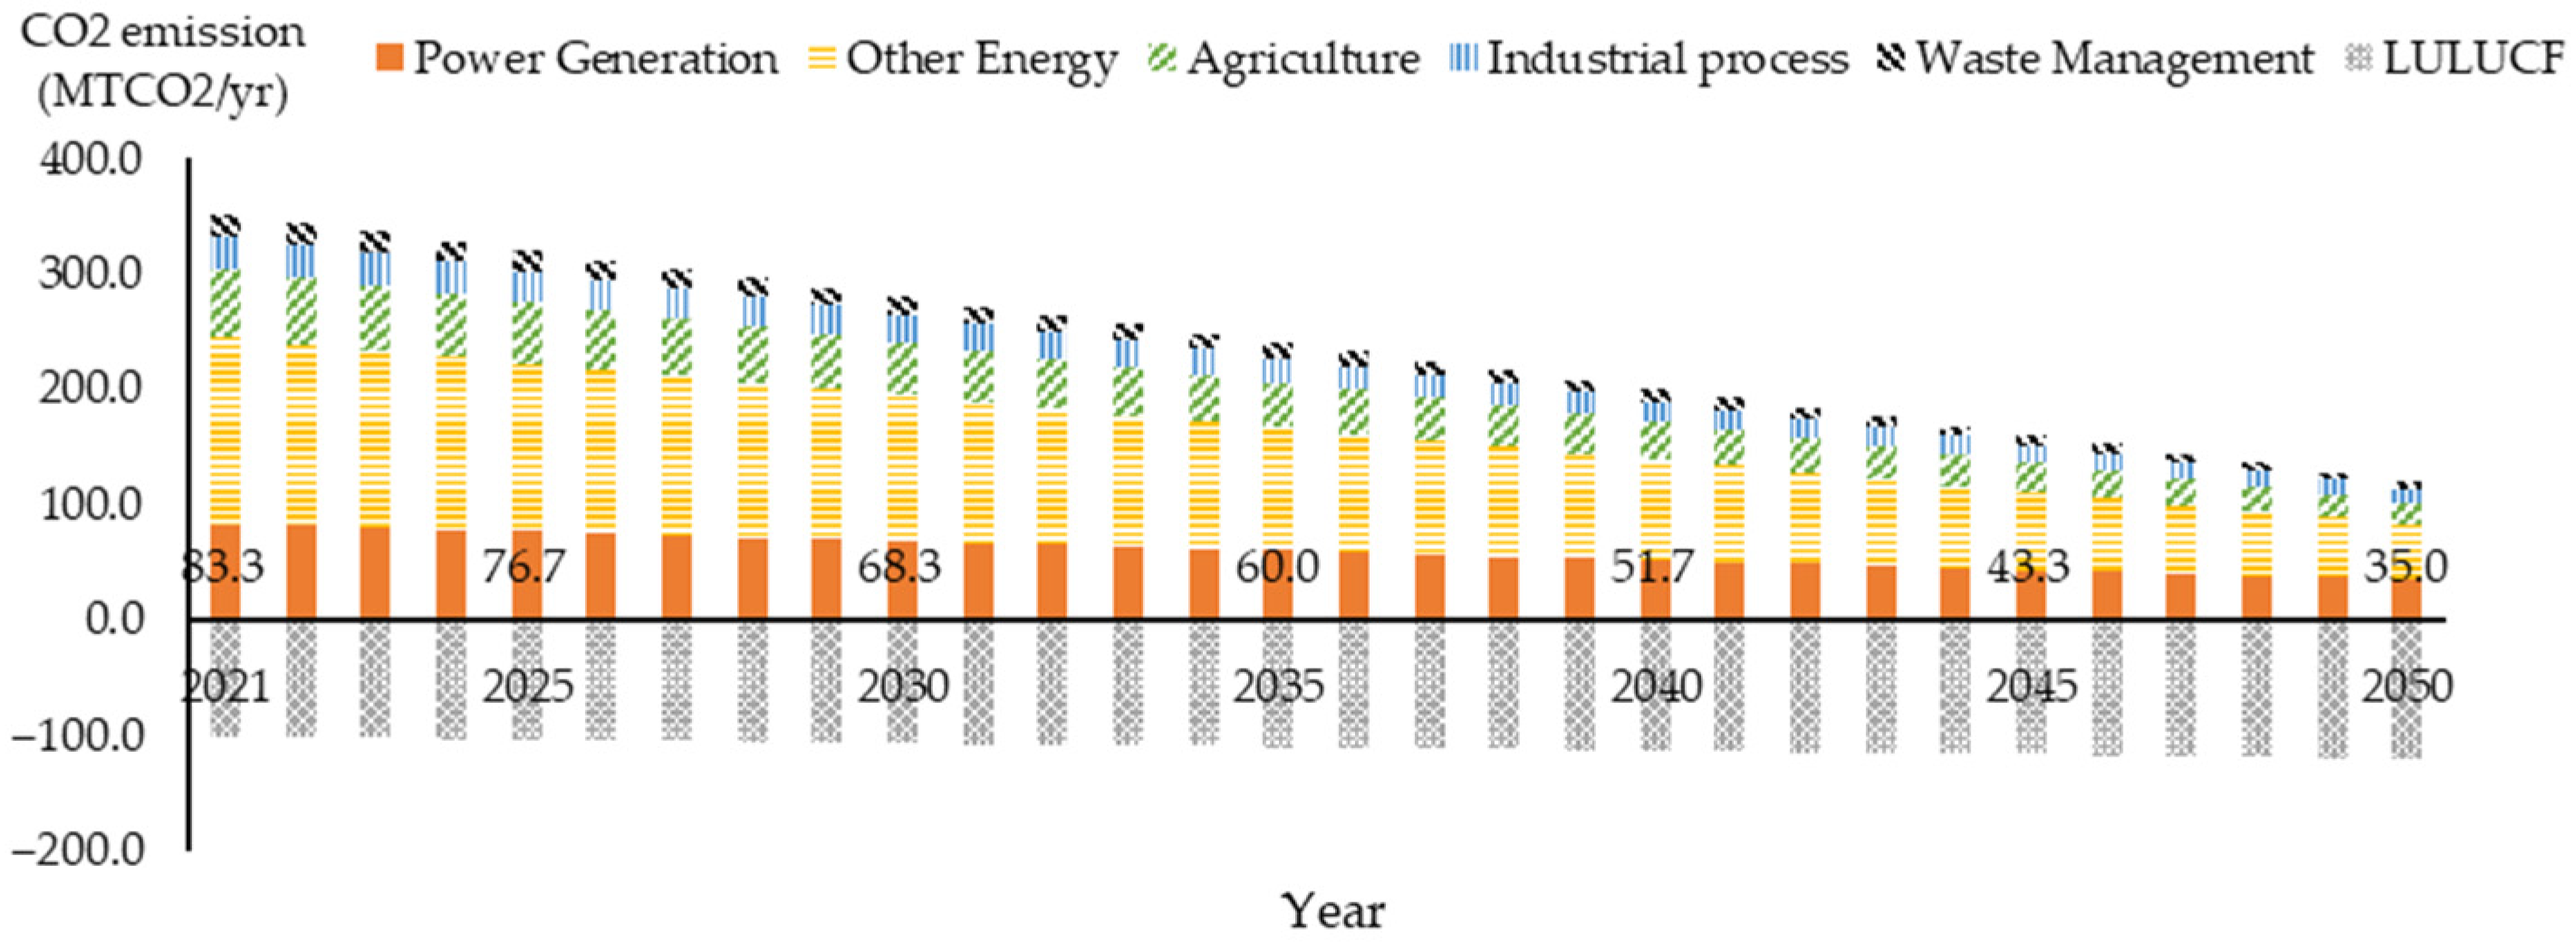
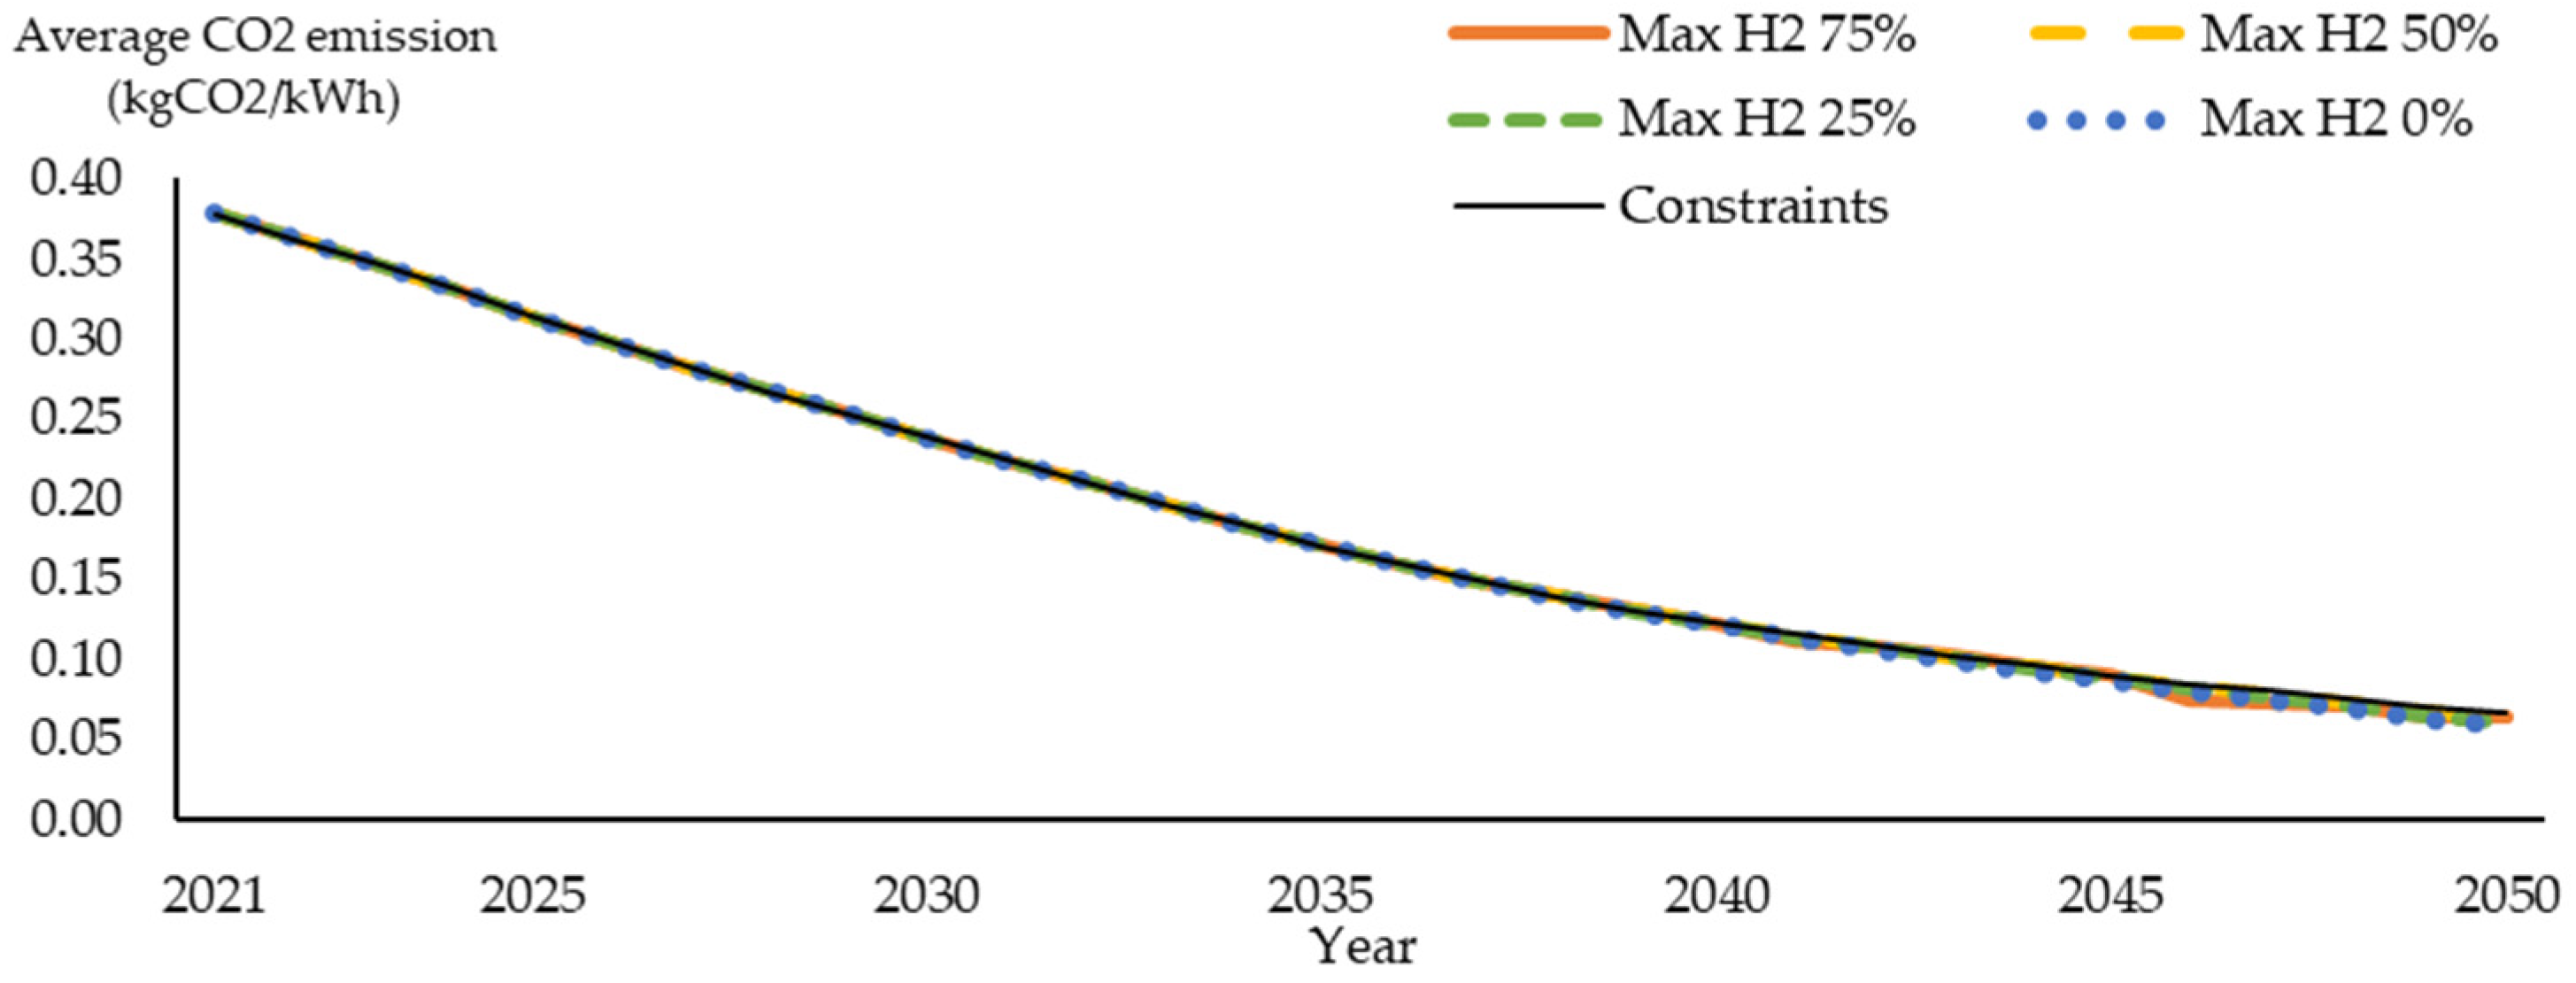
The carbon dioxide emission constraint for generation expansion planning in this study must be aligned with the carbon neutrality target in 2050. To create this emission constraint for each year in the planning horizon, the data relating Thailand’s GHG emission by sector in tonCO2eq in 2016, and at the carbon neutrality year mentioned in the LT-LEDS public hearing process, which is 35 MtCO2, are used, as shown in Figure 10.
With these data, the annual emissions of the electricity generation sector can be interpolated linearly and then allocated monthly based on projected monthly demand, since the planning is done monthly

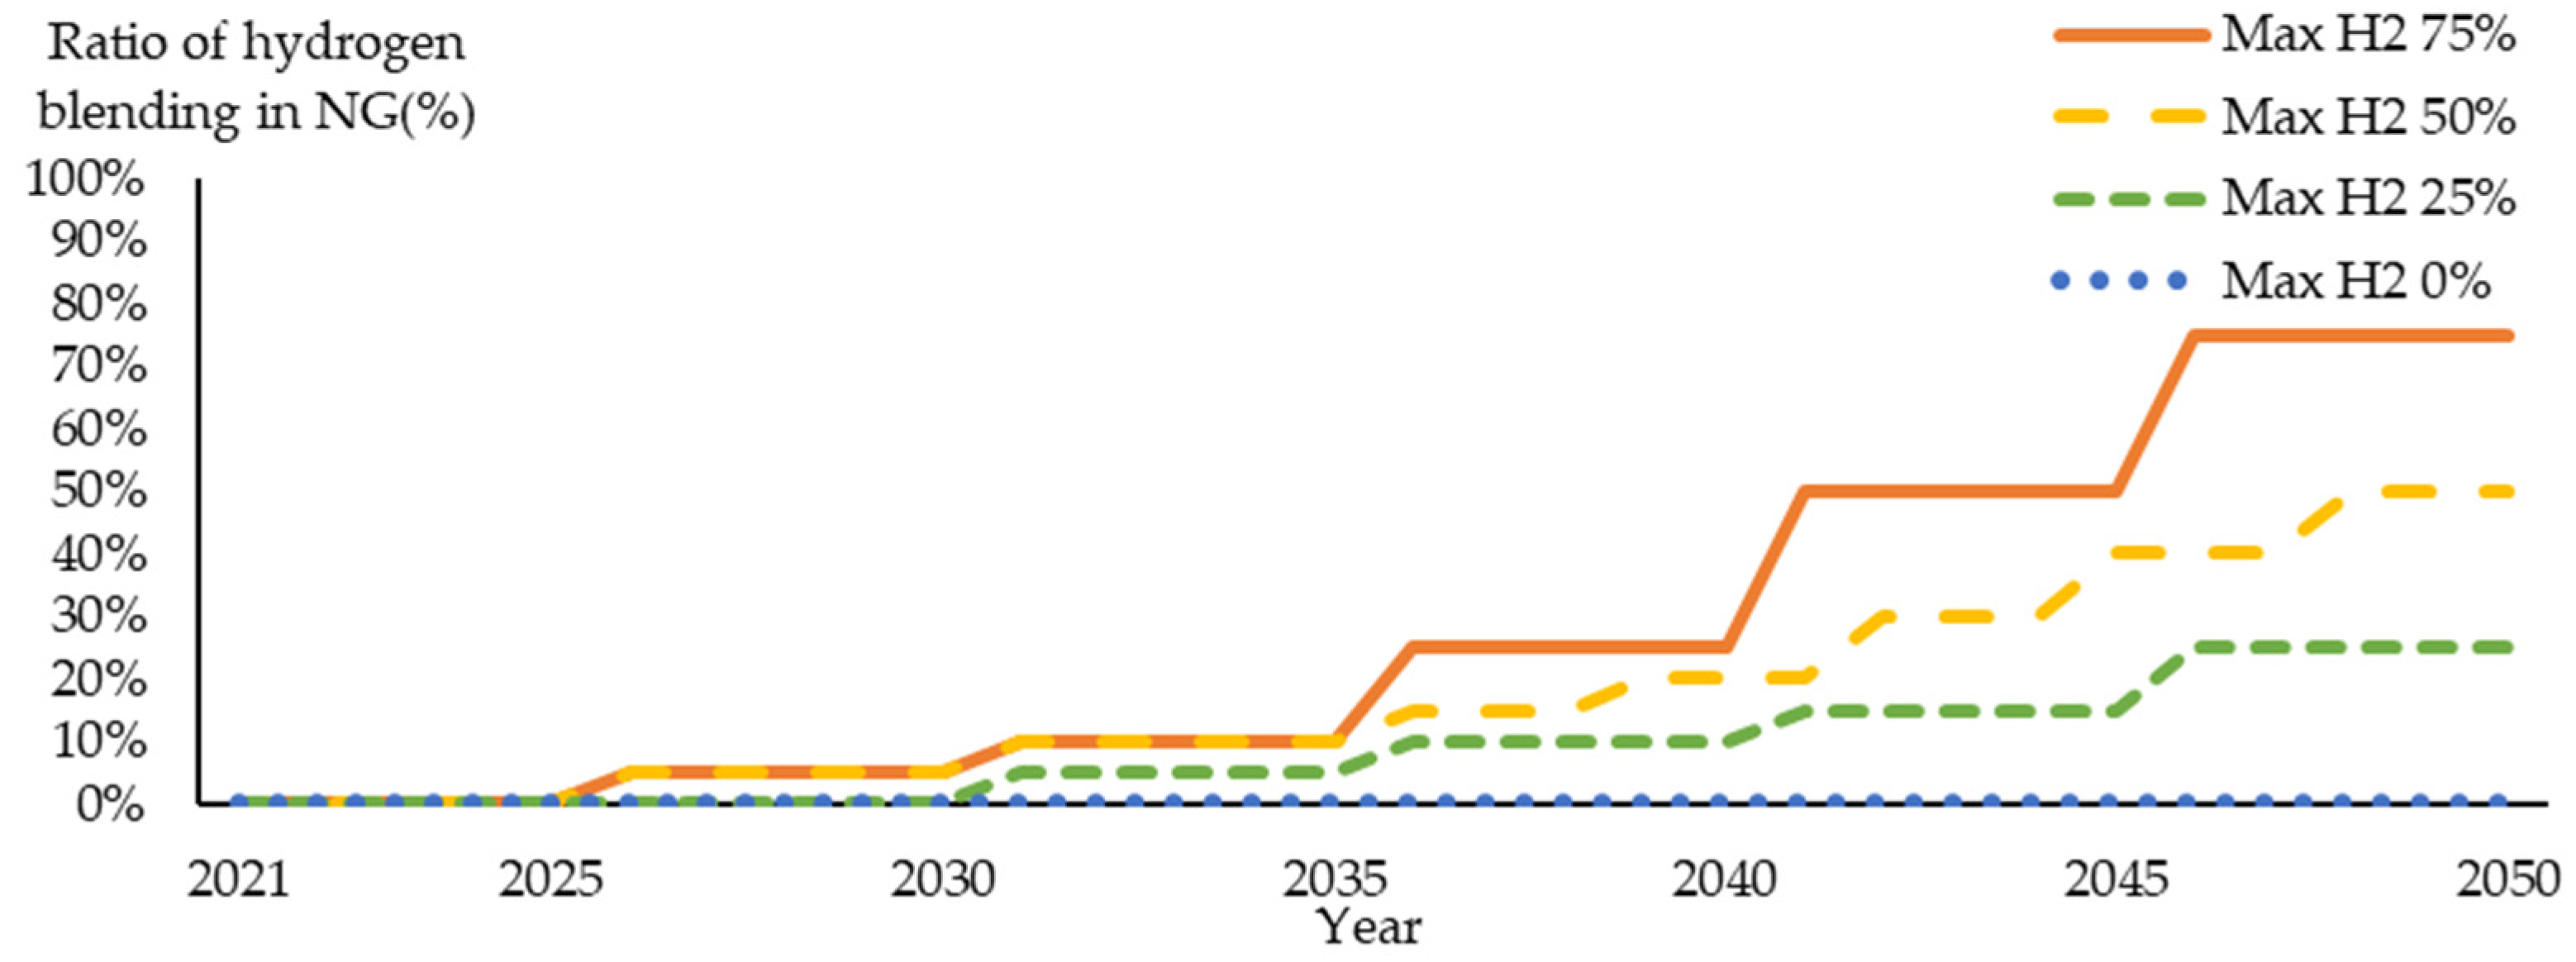
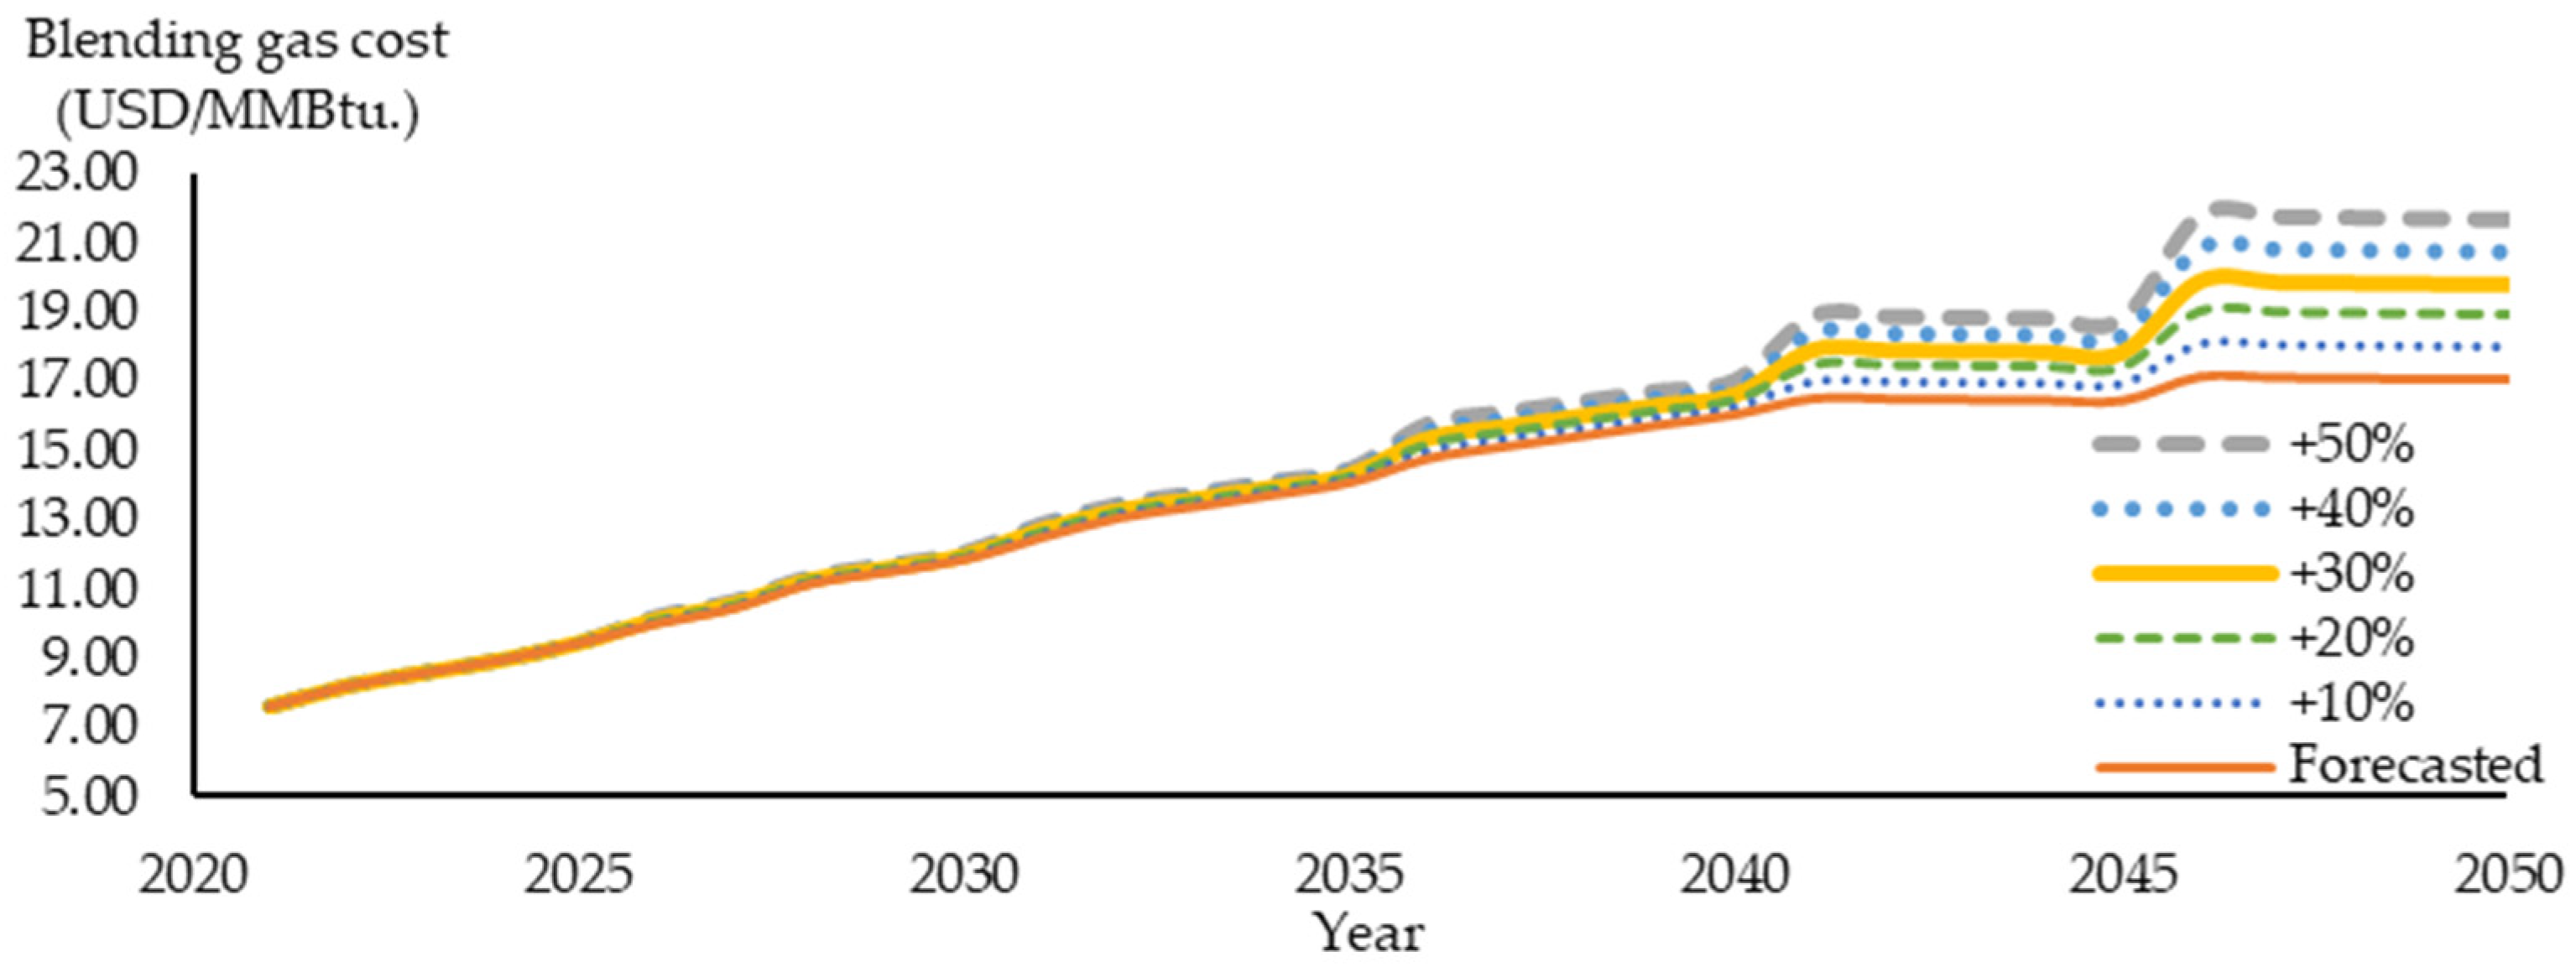
3.5. Hydrogen Blending in Natural Gas

As mentioned in Section 3.3.4, the fuel gas used in the generation system in this study is a blend of hydrogen and natural gas, in an effort to reduce carbon dioxide emissions. Since the current natural gas network cannot accept high concentrations of hydrogen, the proportion of hydrogen will be increased gradually throughout the planning horizon. This will allow retrofitting to be done, gradually enhancing the system-wide ability to make use of higher proportions of blended hydrogen. Hydrogen blending in the natural gas network can also reduce carbon dioxide emissions in not only the energy sector but also in others that use natural gas as fuel. The heating value, cost, and carbon dioxide emissions of each scenario are different and can be calculated by the following equations.
H H V B l e n d e d   g a s = ( H H V H 2 × % H 2 ) + ( H H V N G × ( 1 % H 2 ) )
B l e n d e d   g a s   p r i c e = ( C H 2 × H H V H 2 × % H 2 ) + ( C N G × H H V N G × ( 1 % H 2 ) ) ( H H V H 2 × % H 2 ) + ( H H V N G × ( 1 % H 2 ) )
ε B l e n d e d   g a s = ( ε N G × H H V N G × ( 1 % H 2 ) ) ( H H V H 2 × % H 2 ) + ( H H V N G × ( 1 % H 2 ) )
where:
  • C H 2 is the price of hydrogen (USD/MMBtu)
  • H H V H 2 is the high heating value of hydrogen, which is 325 Btu/scf
  • % H 2 is the ratio of hydrogen in blended gas (%)
  • C N G is the price of natural gas (USD/MMBtu)
  • H H V N G is the high heating value of natural gas, which is 1000 Btu/scf
  • ε N G is the carbon dioxide emission factor of natural gas, which is 57.3 kgCO2/MMBtu

3.6. Carbon Capture, Utilization, and Storage

Although CCUS is recognized as one of the solutions for GHG emission reduction, its commercialization is still under development, as discussed in [36]. Since carbon dioxide concentrations from the combustion process of CCGT power plants is quite low due to the percentage of nitrogen gas in the atmosphere, capturing carbon dioxide from this exhaust gas is costly and inefficient compared to exhaust gases from other process with higher concentrations [35], such as steam methane reforming [59]. Moreover, the investment and operation cost of CCGT with CCUS technologies is double compared to power plants without CCUS [60]. Lastly, renewable energy with storage provides a more energetically effective approach to climate mitigation than constructing CCUS fossil-fuel power plants [61]. Thus, in this study, the usage of CCUS in fossil-fuel generation units is not considered.

4. Scenarios and Results

Generation expansion scenarios with different maximum ratios of hydrogen blended in the natural gas are developed in this section. In each plan, additional capacity, LOLE, average carbon dioxide emission, fuel mix ratio, and electricity cost are calculated and compared. Then, a sensitivity study to verify the effect of BESS and hydrogen costs is carried out.

4.1. Hydrogen Blending in Natural Gas Network Scenarios

In this study, four scenarios with different percentages of hydrogen blending in the natural gas in 2050, i.e., 0%, 25%, 50%, and 75% by volume, are considered. The percentage of hydrogen mixed into the network of each scenario can be found in Figure 11.
In this study, the cost of hydrogen is based on the blue hydrogen cost. The blue hydrogen cost is forecast based on the cost structure shown in [62] and the projected cost shown in [62,63] The uncertainty of the hydrogen cost is also considered in this study. Given that the probability of the projected hydrogen cost is 0.5, and assuming that the future hydrogen cost may be 10% to 50% above this projected value, the associate probability as shown in Table 2, the blended gas cost can be calculated. An example of the cost for the 75% maximum hydrogen blending case is shown in Figure 12. Natural gas and hydrogen price projections are provided in Appendix F.

4.2. Assumptions regarding Planning Constraints

The planning constraints and assumptions used in this manuscript are as follows:
  • Planning horizon is 2021–2050.
  • Existing generation system as of December 2020 is used as initial generation system.
  • Committed generation unit shall be commissioned as stated in Section 3.3.2.
  • Additional generation unit shall be commissioned as stated in Section 3.3.3.
  • LOLE is considered as reliability criteria. LOLE must not be greater than 0.7 day/year.
  • Average CO2 emission constraint follows information shown in Figure 10.

4.3. Planning Results

With the generation expansion planning method and planning criteria explained in the previous sections, the programming tool was developed. Using this tool, four generation expansion plans, based on each scenario, can be obtained. Using these four plans, a summary of the additional capacity in each scenario is shown in Figure 13. Details of the candidate units added into each scenario are shown in Figure 14a–d.
With the results of the additional capacity as discussed above, the fuel mix of all four scenarios can be found in Figure 15, Figure 16, Figure 17 and Figure 18. From these figures, it can be seen that the ratio of electricity from hydrogen blended with natural gas and PVBESS is relevant to the additional capacity of CCGT units and PVBESS units, respectively.
From these four scenarios, the system reliability measured by LOLE of each scenario is calculated and compared, as shown in Figure 19. In addition, the average electricity cost is shown in Figure 20, and the average carbon dioxide emission is shown in Figure 21.
Given that 1 MW of installed PV capacity requires 12,800 square meters of land and 1 MWh of installed BESS capacity requires 900 square meters of land, details of the land use for PVBESS installation are established, as shown in Table 3.

4.4. Uncertainty, Sensitivity Analysis, and Impact on Electricity Cost

From the results in the previous section, the 75% scenario is chosen for the analysis of uncertainty, sensitivity, and impact on electricity cost. Given the uncertainties of BESS cost and hydrogen cost as described in Section 3.3.4 and Section 4.1, and assuming that the movement of BESS and hydrogen costs are independent, a joint probability density function can be created, as shown in Table 4
With the joint probability distribution, the expected average electricity cost and its corresponding boundary of the 75% scenario can be calculated, as shown in Figure 22.

5. Discussion

The four resulting plans and sensitivity study results will be discussed in this section. The impact of the BESS and hydrogen costs on the expected electricity cost is also analyzed and discussed.

5.1. Discussion of Hydrogen Blending in Natural Gas Network Scenarios

It can be seen that new generation units will be added into the system only for two reasons: (1) the system’s LOLE exceeds the criteria, or (2) the existing generation system cannot satisfy the average carbon dioxide emission constraints. Intuitively, considering both candidate units’ average electricity cost, CCGT units with a lower cost should be added into the generation system if the LOLE criteria is violated. Moreover, in the case of generation capacity insufficiency, CCGT units will be added if the system’s carbon dioxide emissions are still lower than the criteria. Otherwise, PVBESS with zero emissions but higher electricity cost will be added instead. Therefore, from Figure 13, it shows that, since the natural gas of the scenario with 0% hydrogen has the highest carbon dioxide emissions, more PVBESS units are required compared to the other scenarios. In addition, since PVBESS units can supply only up to 4 MWh, unlike CCGT units, which can supply power all day long, more PVBESS units are required to supply the same amount of energy. Thus, the 0% hydrogen scenario has the highest additional capacity in MW, followed by the 25% hydrogen scenario, 50% hydrogen scenario, and 75% hydrogen scenario.
From Figure 14a, it can be seen that most of the units added into the 0% hydrogen scenario are PVBESS units (126,500 MW in total), since the carbon dioxide emissions of CCGT units powered by natural gas are quite high compared to the constraints. Thus, only 13,300 MW of the CCGT units can be added into the system, and most is added between 2041 and 2050. From Figure 14b, it can be seen that additional units added into the 25% scenario are almost the same as in the 0% scenario, with 120,000 MW of PVBESS units and 13,300 MW of CCGT units; with 25% hydrogen blended with natural gas, the heating value and carbon dioxide emission factor of the CCGT are just slightly changed from the 0% scenario. Thus, the difference between these two scenarios is also small, and most of the difference is found from 2041 onward.
From Figure 14c, it can be seen that additional units added into the 50% hydrogen scenario comprise 105,000 MW of PVBESS units and 16,800 MW of CCGT units. Since the emission factor is reduced by about 20%, more CCGT units are added and fewer PVBESS units are selected. From Figure 14d, it can be seen that, with 75% hydrogen blended with natural gas, the emission factor of blended gas is reduced by about 50%. Thus, only 67,500 MW of PVBESS units are selected, along with 25,200 MW of CCGT units, and with no PVBESS units selected from 2046 onward. It can be concluded that the more hydrogen that is blended into the natural gas network, the less PVBESS capacity that is needed.
Considering Figure 19, although the total additional capacity of all four scenarios is not the same, the LOLE of all four scenarios can still be maintained under the LOLE criteria. CCGT units can supply electricity at maximum capacity all day long if dispatched, unlike PVBESS units, which can supply electricity at maximum capacity for only 4 h per day. Thus, greater PVBESS capacity is required compared to CCGT to maintain the same level of reliability. In Figure 20, it can be seen that since every scenario uses the same assumptions and constraints (apart from percentage of hydrogen blending), the average electricity cost of each scenario depends greatly on the type of additional units added into the generation system. The average electricity cost of a scenario with more PVBESS units, which has higher electricity costs compared to CCGT units, is, of course, higher. Thus, the 0% hydrogen scenario has the highest average electricity cost, followed by the 25%, 50%, and 75% hydrogen scenarios. However, the cost of retrofitting natural gas systems to tolerate high levels of hydrogen concentration is not considered in this study.
From Figure 21, It can be seen that carbon dioxide emission in all scenarios is the active planning constraint. Thus, every scenario provides almost the same average carbon dioxide emission result, which is at the limit. However, the average carbon dioxide emissions in the last five years of the 0% and 25% scenarios are slightly lower than the criteria, since a large amount of PVBESS capacity is commissioned in that period, while some fossil-fuel power plants are decommissioned. With the lower capacity of the fossil-fuel power plants, the average carbon dioxide emissions of the 0% and 25% scenarios are slightly lower than the criteria and those of the 50% and 75% scenarios.
From Table 3, it is found that, if hydrogen gas is not blended into the natural gas network, more than 120,000 MW of PVBESS must be commissioned into the power system by 2050. With this level of contracted capacity, a land area about 3192 square kilometers will be needed for the PVBESS installation, This accounts for roughly 26% of the unused land in Thailand in 2018, which is 12,351 square kilometers [64]. Thus, increasing the use of hydrogen blending in the natural gas network should be done to limit the amount of land required for PVBESS installation.
With hydrogen blending scenarios considered, the effect of the 25% scenario is negligible, since the heating value and carbon dioxide emission factor are just slightly changed. The 50% scenario does have benefits with respect to electricity costs and dependency on PVBESS; however, at 50% concentration of hydrogen in natural gas network, retrofitting of the natural gas system is required. The required investment is the same for the 50% scenario as for the 75% scenario. If investment must be undertaken in both scenarios, the 75% scenario is the most suitable since it results in the lowest electricity cost.

5.2. Discussion on Uncertainty, Sensitivity Analysis, and Impact on Electricity Cost

From Figure 22, it can be seen that the alteration of the average electricity cost starts in 2031 and increases as the installed capacity of additional PVBESS and CCGT units increases. In 2050, the average electricity cost is in the range of 3.81–4.21 THB/kWh, with the expected value of 3.89 THB/kWh. Although the expected average cost is slightly higher than the forecast case (optimistic case) of around 0.08 THB/kWh, the electricity cost could potentially increase (at maximum) by 0.40 THB/kWh (around 10%) from the optimistic case if both hydrogen and BESS costs are 50% higher than the forecast values. This sensitivity analysis can provide crucial information to policymakers to ensure planning outcomes.

6. Conclusions

This paper discusses possible generation expansion plans for Thailand, which will enable the country to achieve carbon neutrality in the electricity sector by 2050, in accordance with the remarks made at the World Leaders Summit of COP 26. Thailand’s future electricity demand is forecast with disruptive technologies for both demand and generation. Four scenarios are set as options for planning, corresponding to variations of hydrogen concentration blended into the natural gas network. Since the use of CCUS in the electricity generation system is not considered in this study, there are only two options remaining, i.e., renewable energy or hydrogen blending in the natural gas network. Both of these allow production of electricity with less carbon dioxide emissions, which would help Thailand achieve the stated carbon neutrality target. Due to the limitations of bio-based resources and low average wind speed in Thailand, solar PV with BESS for load-shifting is the major renewable energy option with the potential for very large-scale installation (100,000 MW or beyond). Thus, options for additional units are limited to PVBESS and CCGT using mixed hydrogen and natural gas. The generation planning method used in this study follows the technique described in [40] with a few modifications as explained in Section 2. Then, four generation expansion plans were developed and compared. These expansion plans can be used for policy makers for the development of electricity generation systems with the carbon neutrality target of 2050.
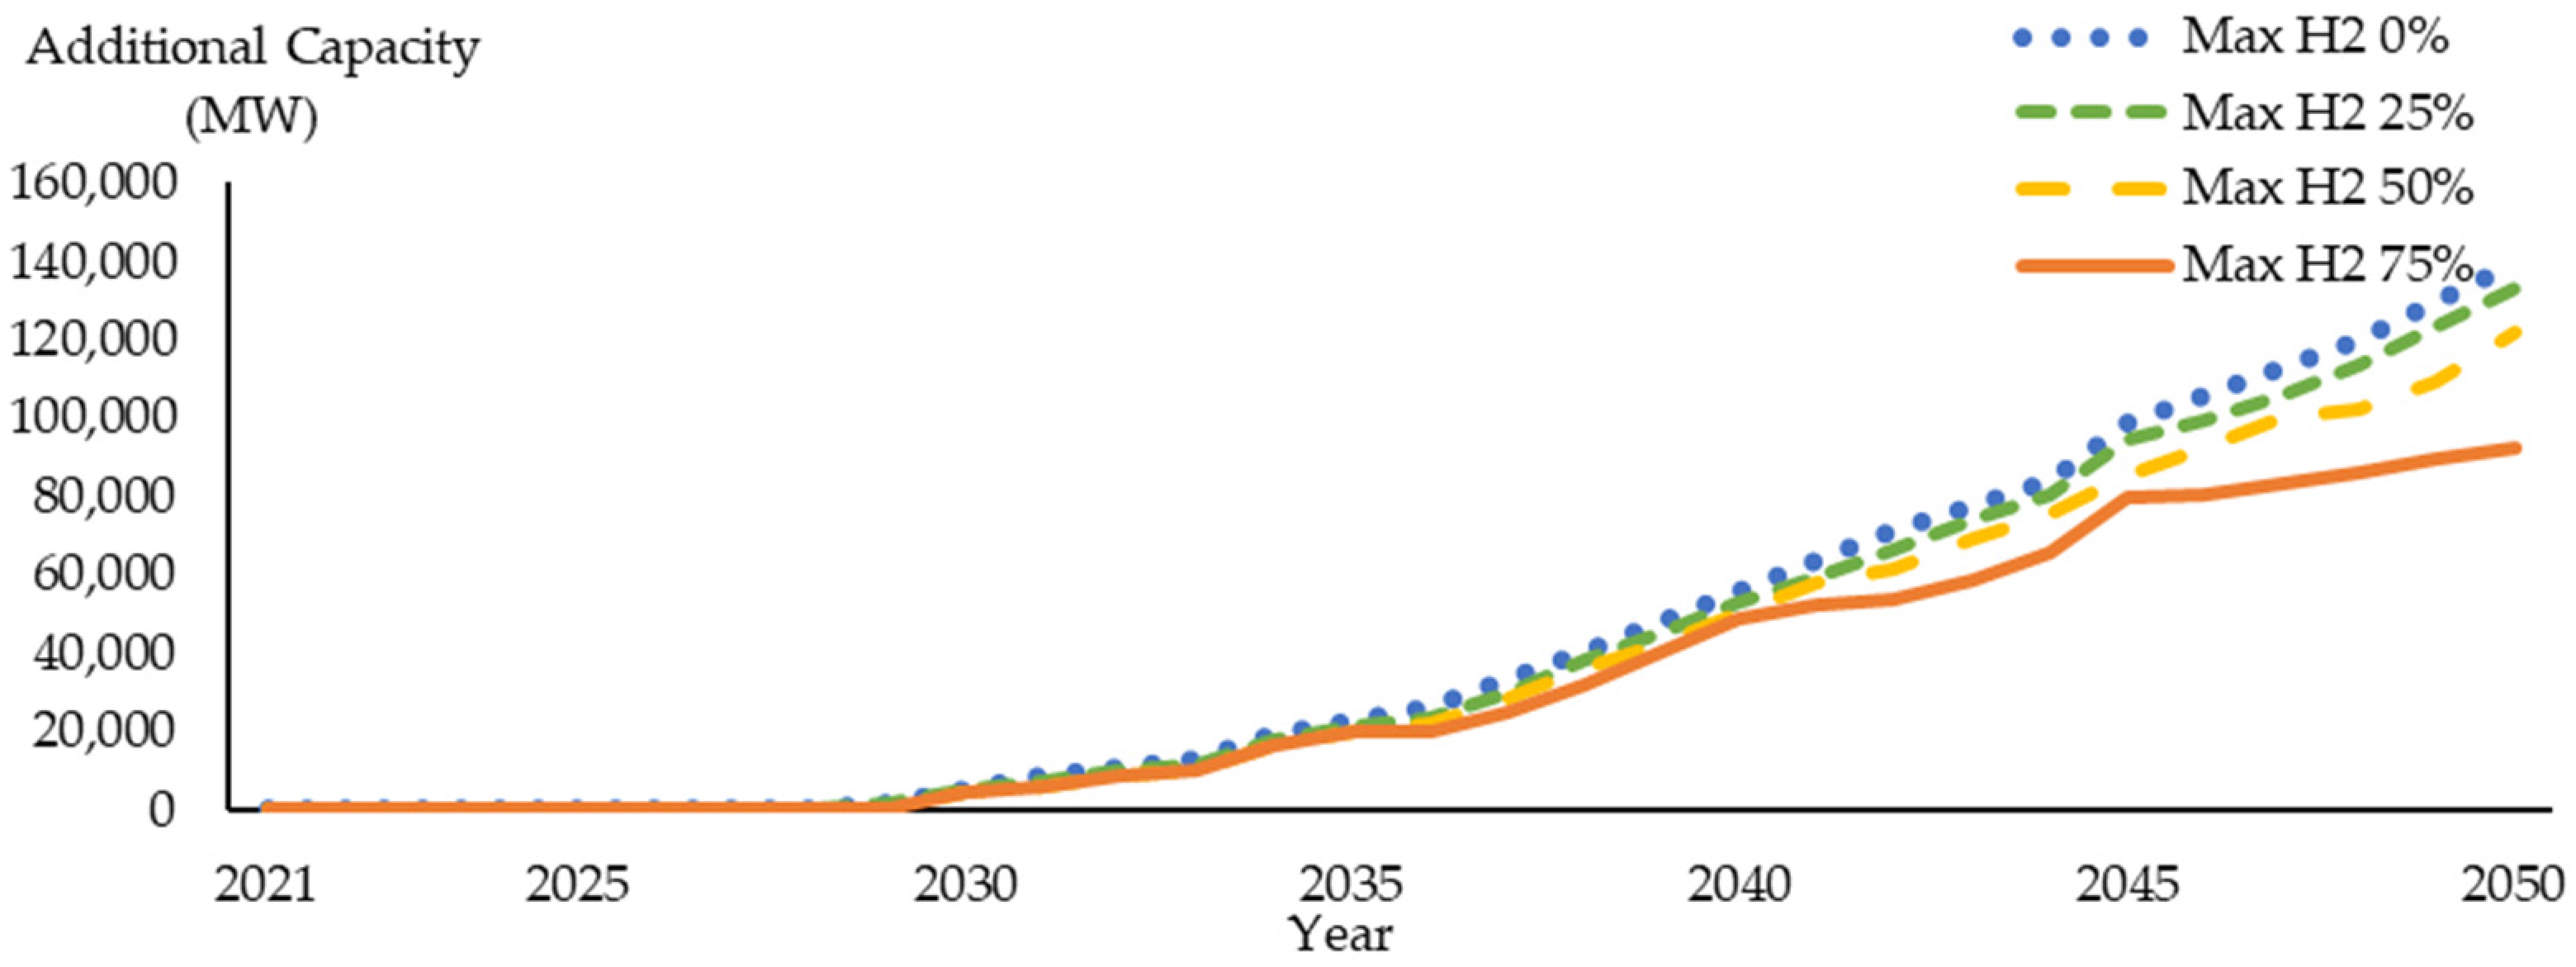
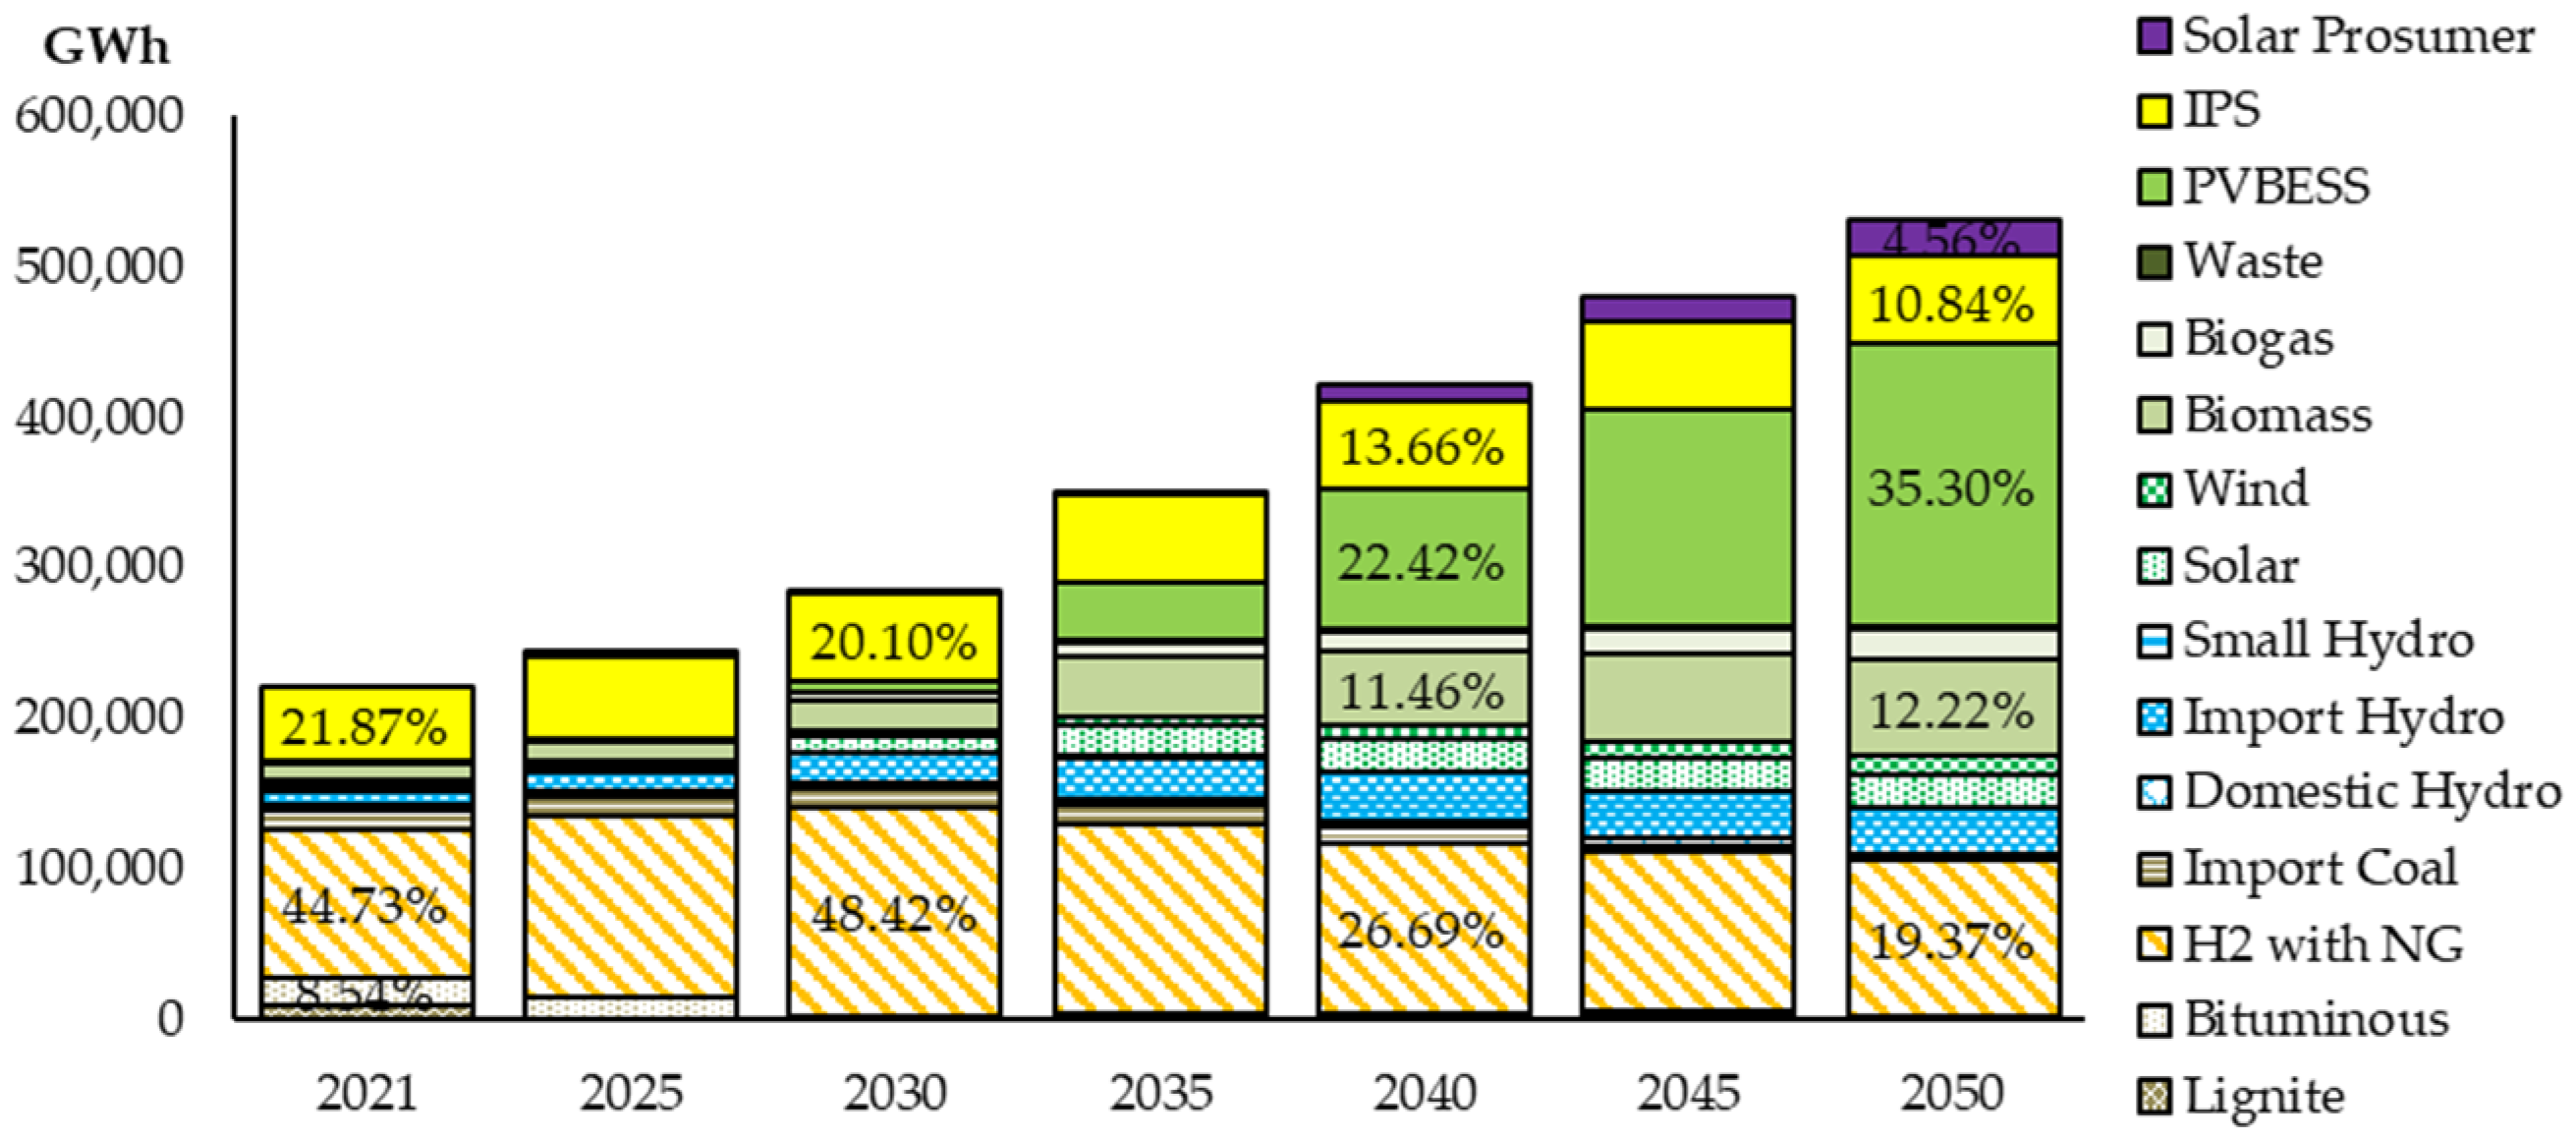
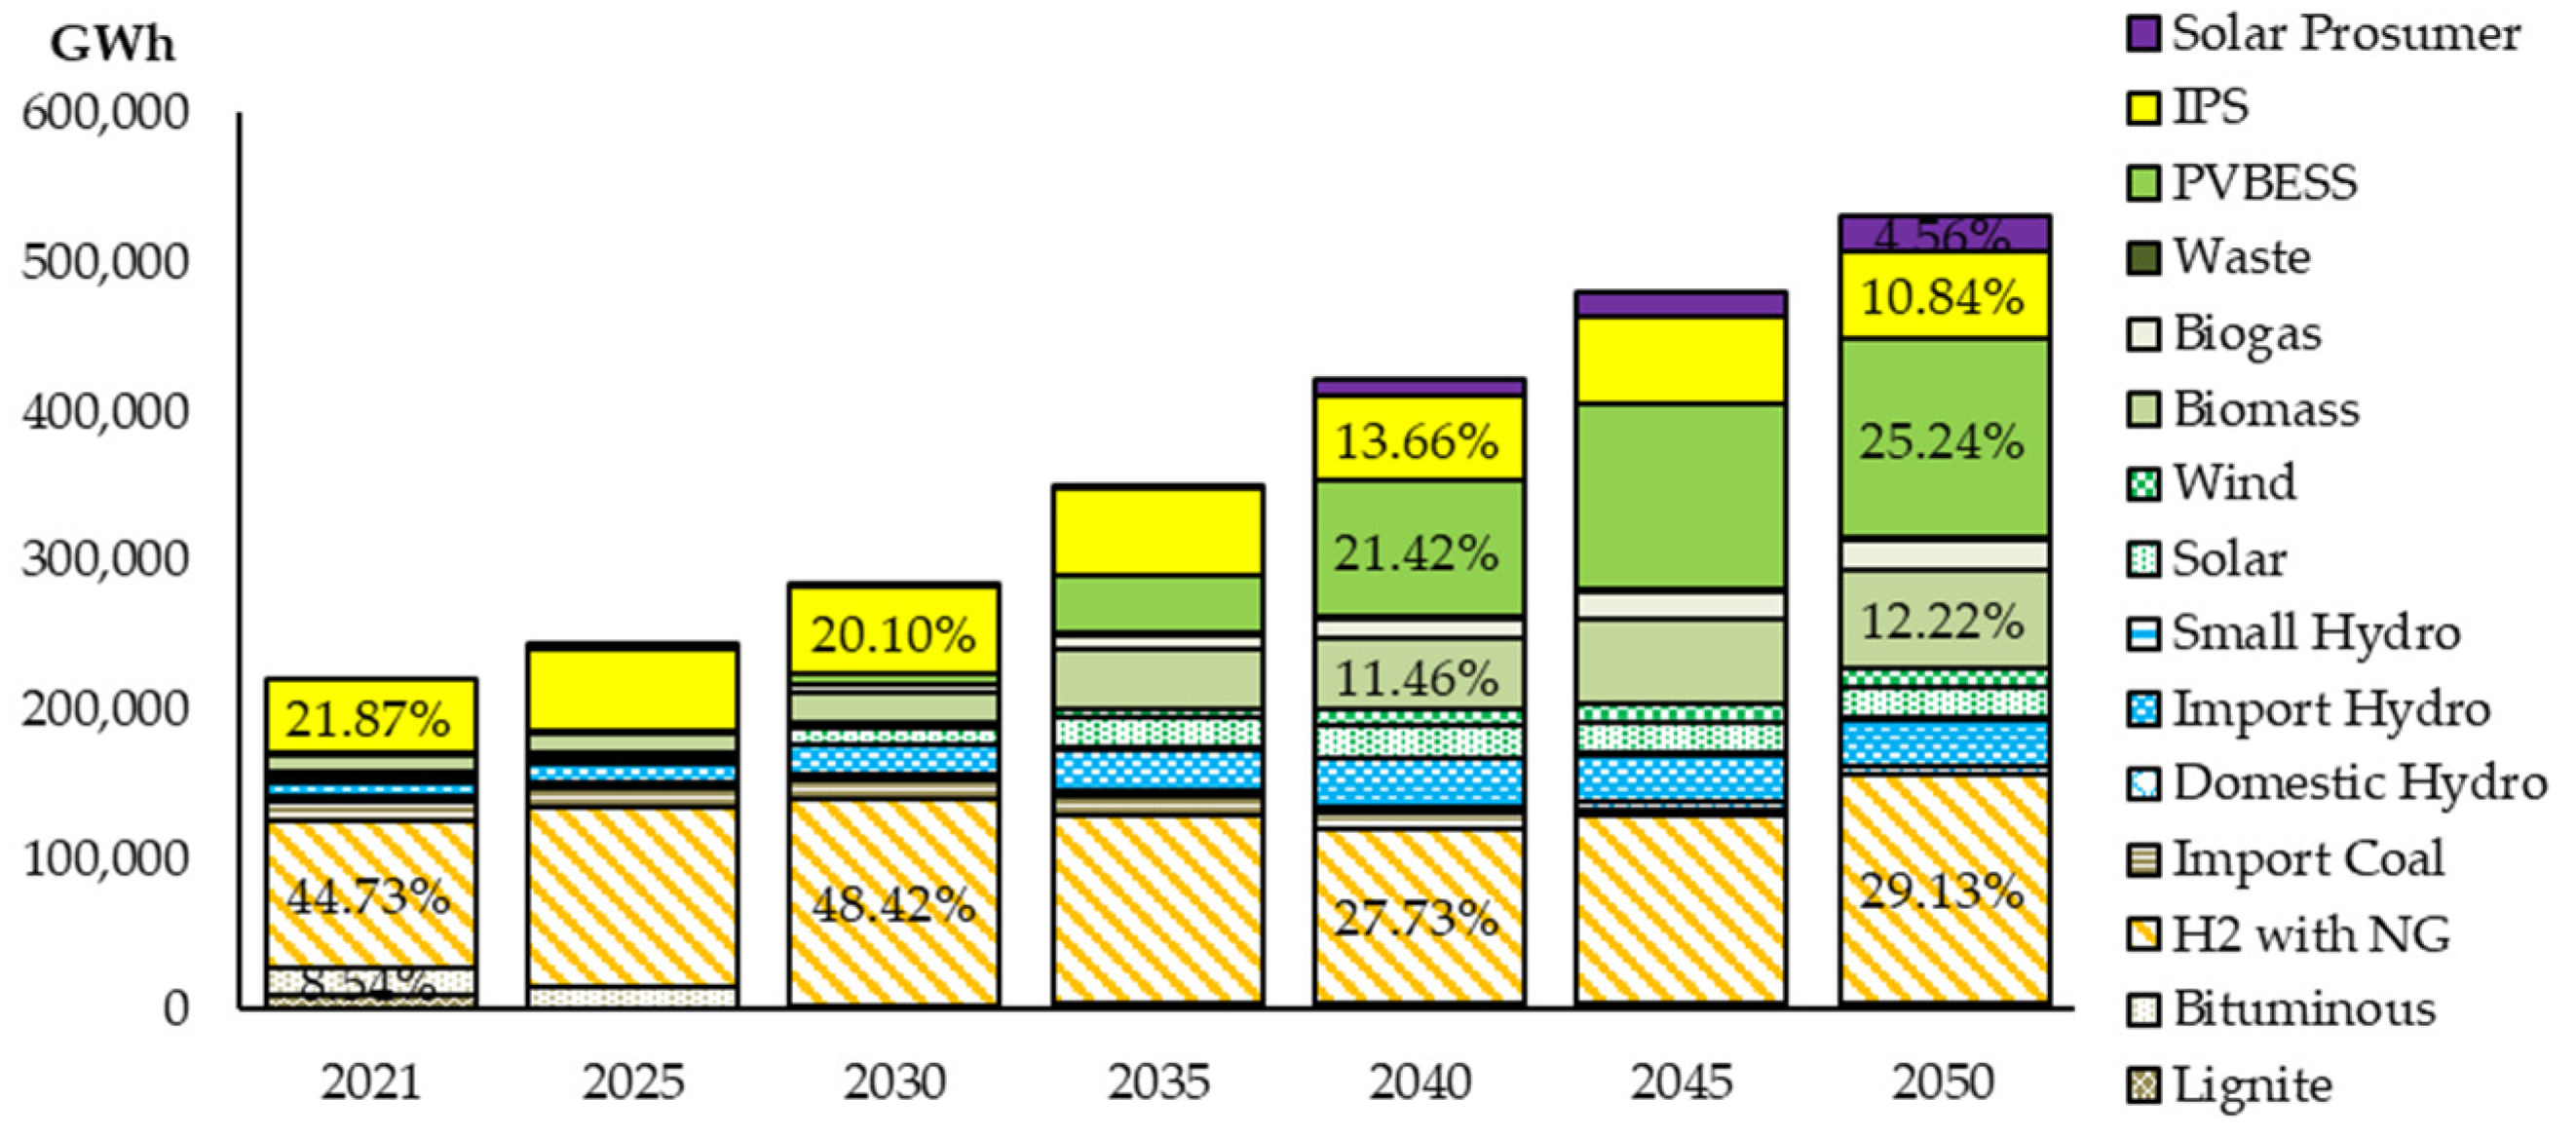
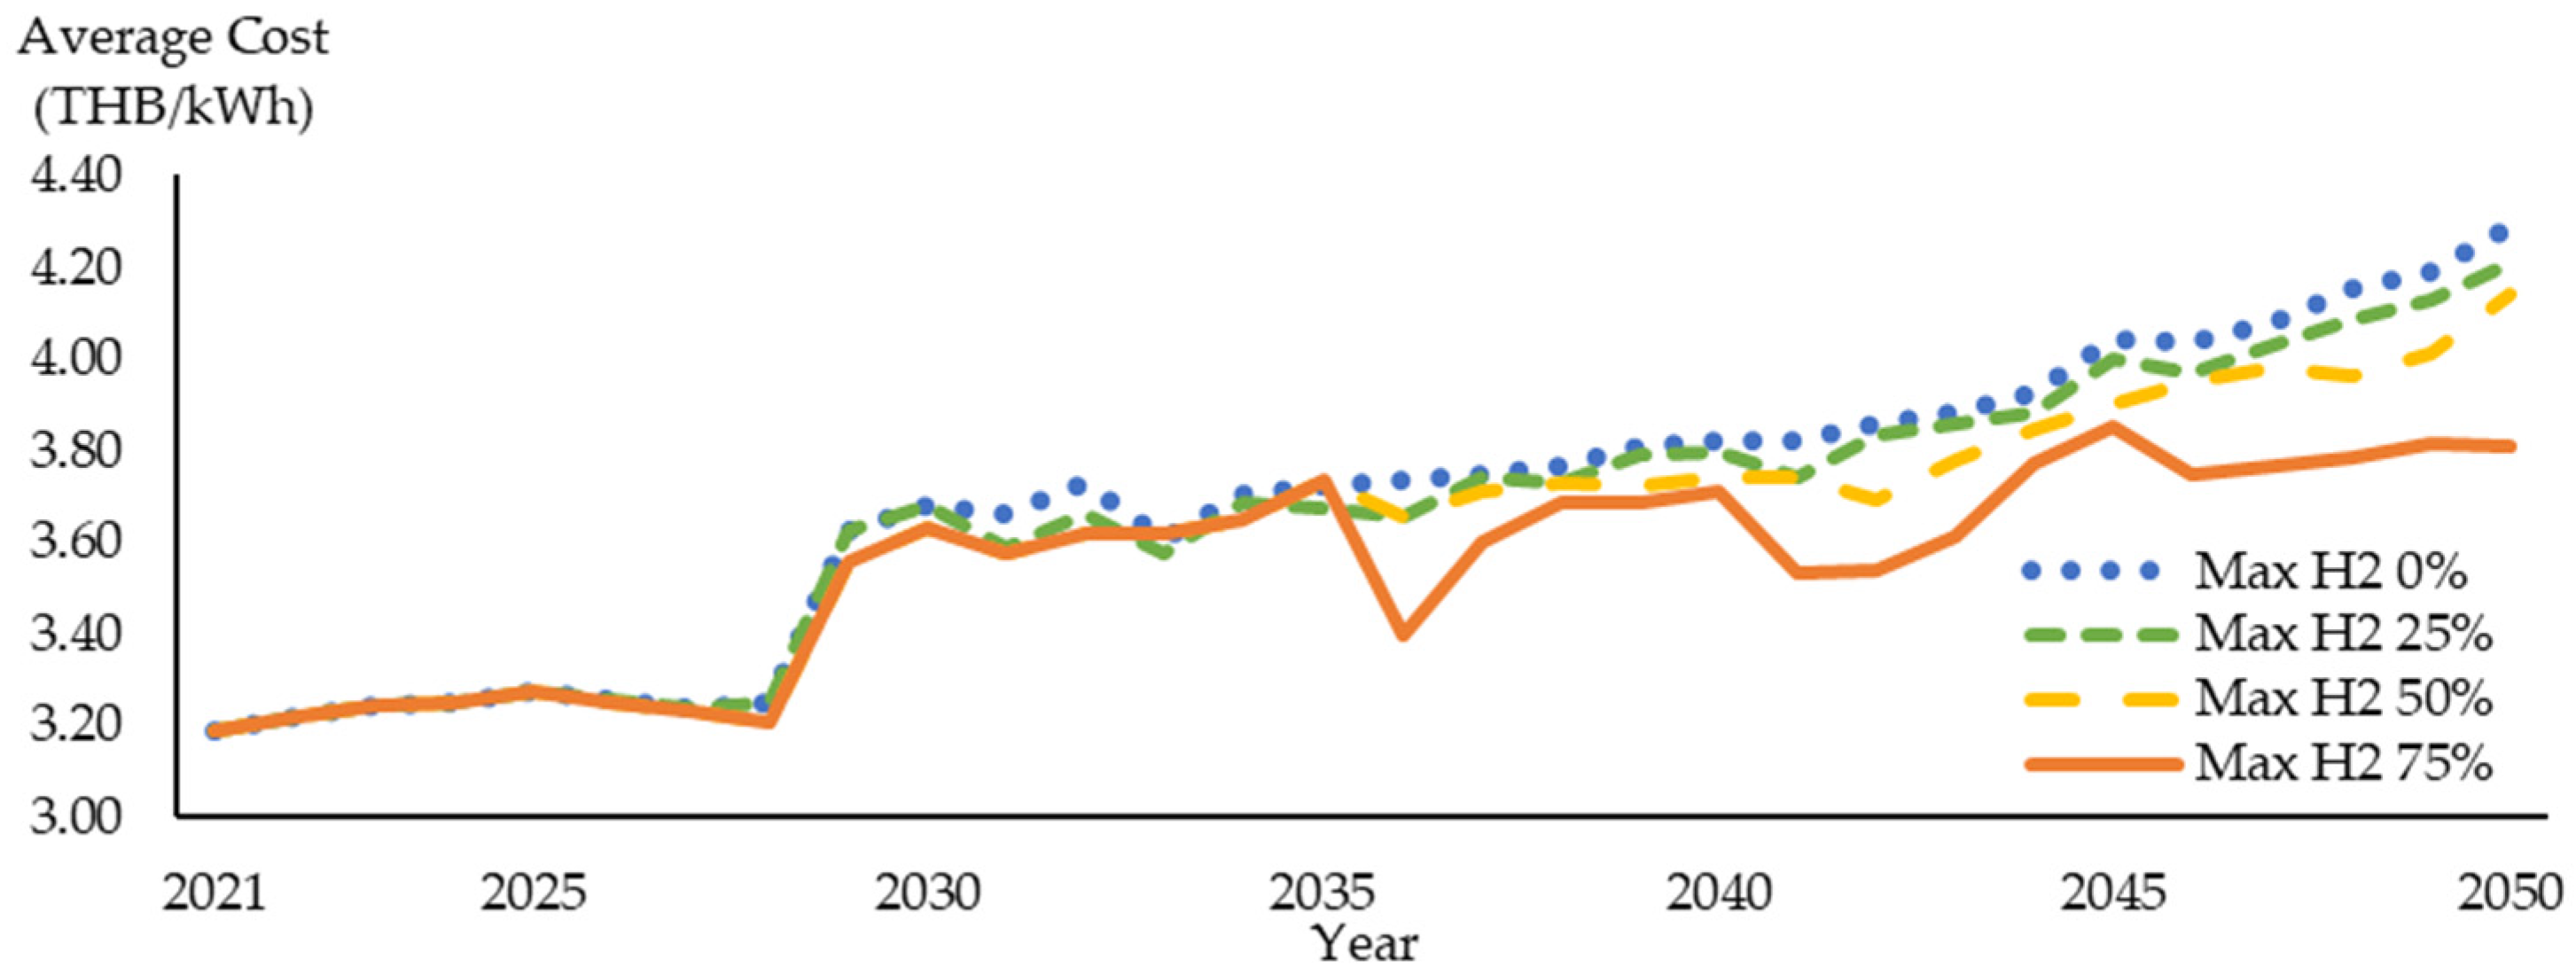
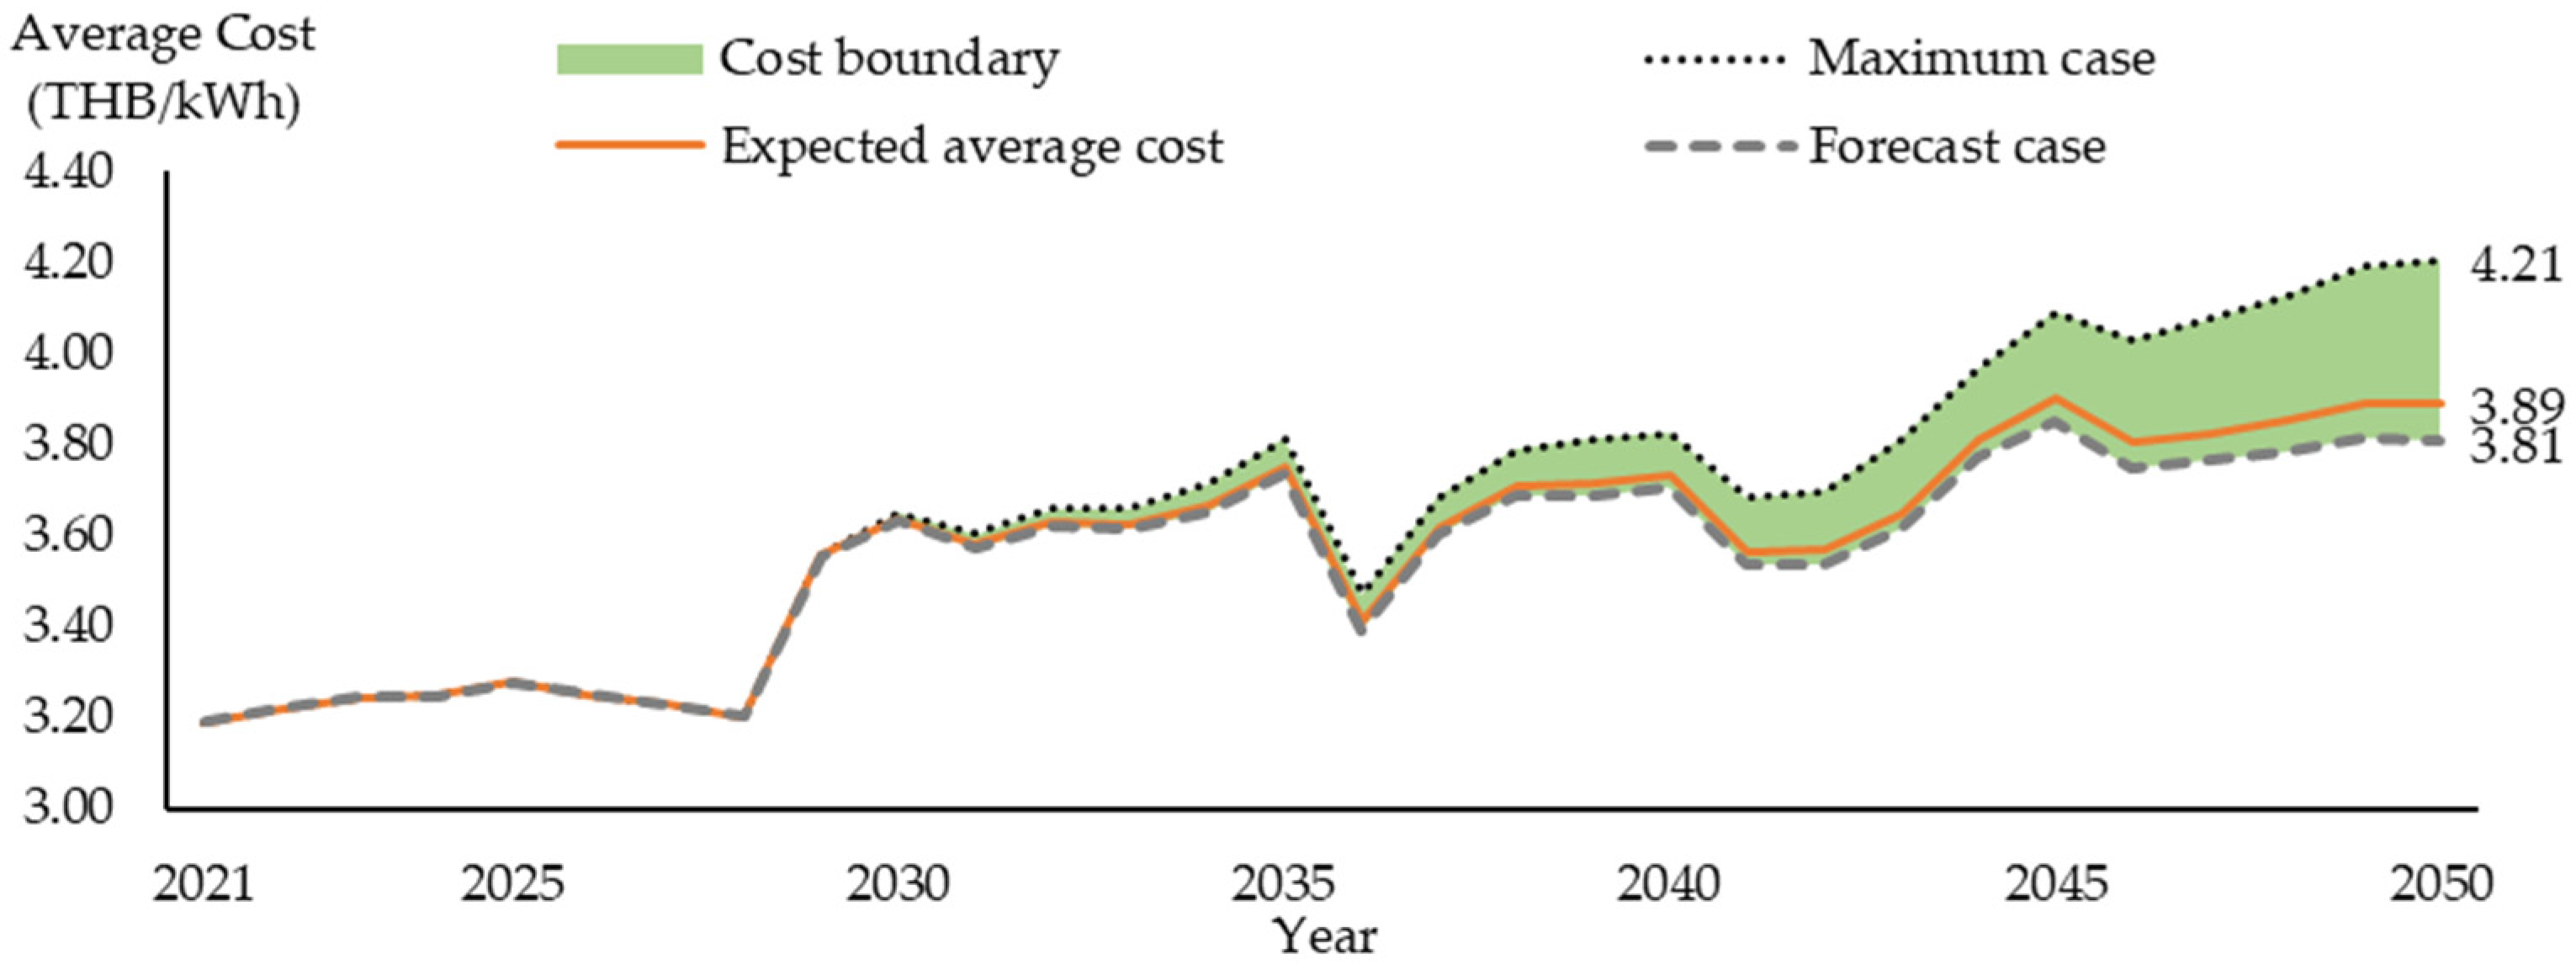
In this study, it was found that the concentration of hydrogen blending in natural gas plays a critical role in the development of power generation expansion plans, considering carbon neutrality as the main target. Although Thailand’s carbon neutrality can be achieved without hydrogen blending in natural gas, a large area of land is required to install a large PVBESS capacity. Furthermore, the cost of electricity is higher without hydrogen blending in natural gas, due to the forecast high cost of BESS. Hydrogen blending with low concentration can reduce PVBESS capacity only marginally, since the carbon dioxide emissions of blended gas are reduced slightly. Thus, higher concentrations of hydrogen are needed to limit the areas required for PVBESS installation. Moreover, the scenario with higher concentrations of hydrogen results in a lower average cost of electricity. Finally, based on the sensitivity study, it was found that, at the end of the plan, if the costs of BESS and hydrogen do not decline as expected, or more expensive hydrogen such as green hydrogen is used, the average electricity cost will increase above the forecast cost only in the range of 0.07–0.40 THB/kWh or about 10%. This sensitivity analysis can provide crucial information to policymakers to ensure planning outcomes.
From this study, to achieve Thailand’s carbon neutrality in electricity generation systems by 2050, several tasks need to be done. Firstly, generation capacity from renewable resources needs to be increased to its potential. Secondly, only candidate generation units with low or no carbon dioxide emissions are allowed for generation expansion. Finally, without the use of a large land area, Thailand’s natural gas network needs to be retrofitted to enable usage of high concentrations of hydrogen. This study can provide guidelines and lessons learned for system operators or policy makers of other countries to develop their own pathway toward carbon neutrality. The method to integrate PVBESS into dispatch and reliability models for generation expansion planning is also provided in this study. Although details of a possible pathway toward Thailand’s carbon neutrality are provided in this study, in future work, the cost of natural gas network retrofitting still needs to be taken into account. This cost shall be compared with the cost of land use in other alternative options to find the most suitable pathway toward Thailand’s carbon neutrality.

Author Contributions

Conceptualization, R.D. and K.A.; Methodology, R.D. and K.A.; Software, R.D.; Validation, K.A.; Formal analysis, R.D.; Investigation, K.A.; Resources, R.D. and K.A.; Data curation, R.D.; Writing—original draft preparation, R.D.; Writing—review and editing, K.A.; Visualization, R.D.; Supervision, K.A. All authors have read and agreed to the published version of the manuscript.

Funding

This research received no external funding. The APC is partially funded by the Energy Research Institute, Chulalongkorn University.

Institutional Review Board Statement

Not applicable.

Informed Consent Statement

Not applicable.

Data Availability Statement

Data is contained within the Appendix A.

Conflicts of Interest

The authors declare no conflict of interest.

Abbreviations

AEDPAlternative Energy Development Plan
BAUbusiness as usual
BESSbattery energy storage system
BtuBritish thermal unit
CCGTcombined cycle gas turbine
CCUScarbon capture, utilization, and storage
COP 26the 26th session of the Conference of the Parties to the United Nations Framework Convention on Climate Change
COPTCapacity Outage Probability Table
EEenergy efficiency
EEPEnergy Efficiency Plan
EGATElectricity Generating Authority of Thailand
ERCEnergy Regulatory Commission
EVelectric vehicle
GDPgross demestic product
GHGgreenhouse gas
H2hydrogen
ICEinternal combustion engine
IPCCInternational Panel on Climate Change
kgCO2kilogram of carbondioxide
kWkilowatt
kWhkilowatt hour
LDCload duration curve
LOLELoss of Load Expectation
LT-LEDSLong-Term Low Greenhouse Gas Emissions Development Strategy
LULUCFland use, land-use change, and forestry
MWmegawatt
MWhmegawatt hour
NAMANationally Appropriate Mitigation Actions
NDCNationally Determined Contribution
NEPCNational Energy Policy Committee
PDPPower Development Plan
PHSpumped hydroelectric storage
PVphotovoltaic
PVBESSsolar photovoltaic with battery energy storage system
SRMsteam reforming methane
THBThai Baht
USDUS dollar
VREvariable renewable energy

Appendix A. Data for Load Forecast

Table A1. Total EV load forecast (GWh).
YearPersonal CarMotorcycleBus, Truck
20211397109
202523661912335
203011,95384511,443
203535,795209327,484
204062,533402245,512
204585,114481956,997
2050103,086507764,442
Table A2. EE, captive power plant, and prosumer forecasts (GWh).
YearEE SavingsCaptive Power PlantsProsumer (Solar PV)
202110,17548,1480
202520,12954,1933204
203035,70757,5083145
203551,64257,5081310
204071,12957,50810,191
204590,10757,50817,182
2050112,50057,50824,174

Appendix B. Existing Power Generation System as of December 2020

Table A3. Thailand’s power generation system as of December 2020.
Fuel TypeNumber (Unit)Total Capacity (MW)Lifetime (Years)Heat Rate (Btu/kWh)FOR
(%)
lignite7222030–3910,6005.00
bituminous15241721–308300–91005.00–7.00
natural gas11727,94521–356800–95004.00–7.00
import coal314733091006.00
diesel76125–308300–10,4007.00–10.00
oil232021–308300–10,4007.00–10.00
HVDC130025-0.00
hydro19293650-3.58–6.76
import hydro4210525–50-3.58–4.00
PHS2100050-2.86
renewableN/A7209---
Table A4. Thailand’s renewable energy generation units as of December 2020.
Fuel TypeTotal Capacity (MW)Lifetime (Years)FOR (%)
biomass205721–257.90
biogas3662510.58
solar2777250.60
wind1488250.80
small hydro13725–5015.79
waste384257.90

Appendix C. Committed Generation Units

Table A5. Committed conventional generation units (MW).
YearLigniteBituminousNatural GasImported Hydro
2021 102936
2022 1310514
2023 1280
2024 902100
2025 301380
2026600 700700
2027 2640
2028 700700
2029 700
2032 700
2033 700
2035 700700
2036 765
Table A6. Committed renewable generation units (MW).
YearBiomassBiogasSolarWindSmall HydroWaste
202124816621614
202260 5090
202313575749018
2024 5090
2025 6
2026 298 4
2027 50 4
2028 850 6
2029 1930 2
2030400 1200 4
2031300502500 2
20321001007501303
203310001502038 3
2034200 140 286
2035500 725300515
203628050490657214
2037 5017512819
Table A7. Retired conventional fuel unit (MW).
YearLigniteBituminousNatural gasOilImported Coal
2021 −10−232
2022 −712
2023 −1077
2024−540−270−360
2025−1080−90−2880
2027 −2617
2028 −1289
2032 −1347−734
2033 −2134
2034 −710−315
2035 −1510
2036 −670
2037 −660−254
2038 −1080
2039 −3206
2040 −1870
2041 −3198
2042 −1080
2043 −630
2044 −1850−5
2045 −1476 −1473
2046 −10−1550
2047 −1310
2048−600 −1280
2049 −120−1400
2050 −30

Appendix D. ESSs parameters

Table A8. PHS parameters.
ParametersValueUnit
C-rate0.125-
Round-trip efficiency75%
minimum state-of-charge0%
maximum state-of-charge100%
Table A9. BESS parameters.
ParametersValueUnit
C-rate1-
Round-trip efficiency95%
minimum state-of-charge10%
maximum state-of-charge90%

Appendix E. Projection cost of PVBESS unit

Table A10. Projection cost of 1 MW PV unit (M.USD/MW).
YearPV ModuleInverterBOSTotal
20300.340.100.120.56
20350.300.100.120.52
20400.260.100.130.49
20450.240.100.130.48
20500.230.100.140.47
Table A11. Projection cost of 1 MWh BESS unit (optimistic case) (M.USD/MWh).
YearBatteryInverterBOSTotal
20300.100.040.120.26
20350.090.040.120.25
20400.080.040.130.25
20450.070.040.130.25
20500.070.040.140.25

Appendix F. Blended gas price forecast and calculation

Table A12. Hydrogen and natural gas price forecast (USD/MMBtu).
YearHydrogenNatural Gas
202122.067.59
202521.159.43
203020.2211.72
203519.5113.91
204019.0015.76
204518.6515.76
205018.4415.76

References

  1. International Panel of Climate Change. Global Warming of 1.5 C. Available online: https://www.ipcc.ch/sr15/ (accessed on 30 December 2021).
  2. United Nation Climate Change. Glasgow Climate Pact. Available online: https://unfccc.int/sites/default/files/resource/cop26_auv_2f_cover_decision.pdf (accessed on 30 December 2021).
  3. Government Public Relation Department of Thailand Remarks by Prime Minister Prayut Chan-o-cha at COP26 in Glasgow. Available online: https://thailand.prd.go.th/ewt_news.php?nid=11944&filename=index (accessed on 30 December 2021).
  4. Office of Natural Resources and Environmental Policy and Planning of Thailand. Thailand’s Updated Nationally Determined Contribution; Office of Natural Resources and Environmental Policy and Planning of Thailand: Bangkok, Thailand, 2020. [Google Scholar]
  5. Office of Natural Resources and Environmental Policy and Planning of Thailand. Mid-Century, Long-Term Low Greenhouse Gas Emission Development Strategy; Office of Natural Resources and Environmental Policy and Planning of Thailand: Bangkok, Thailand, 2021. [Google Scholar]
  6. Depertment of Alternative Energy Development and Efficiency. Alternative Energy Development Plan 2018–2037. Available online: https://policy.asiapacificenergy.org/node/4351/portal (accessed on 30 December 2021). (In Thai).
  7. National Energy Policy Committee. Conclusion of the 2/2021 National Energy Policy Committee Meeting. Available online: http://www.eppo.go.th/index.php/th/component/k2/item/17213-nepc-prayut04-08-64#s3 (accessed on 8 January 2022). (In Thai).
  8. European Environment Agency. Share of Energy Consumption from Renewable Sources in Europe. Available online: https://www.eea.europa.eu/ims/share-of-energy-consumption-from (accessed on 12 January 2022).
  9. S&P Global Platts UJ Targets Power from 100% Renewable Sources by 2035. Available online: https://www.spglobal.com/platts/en/market-insights/latest-news/energy-transition/100421-uk-targets-power-from-100-renewable-sources-by-2035 (accessed on 12 January 2022).
  10. Reuters. China Plans to Raise Minimum Renewable Power Purchase to 40% by 2030: Government Document. Available online: https://www.reuters.com/article/us-china-climatechange-renewables-idUSKBN2AA0BA (accessed on 12 January 2022).
  11. People’s Republic of China. China’s Mid-Century Long-Term Low Greenhouse Gas Emission Development Strategy; UNFCCC: Bonn, Germany, 2021; pp. 1–45. [Google Scholar]
  12. Oree, V.; Sayed Hassen, S.Z.; Fleming, P.J. Generation expansion planning optimisation with renewable energy integration: A review. Renew. Sustain. Energy Rev. 2017, 69, 790–803. [Google Scholar] [CrossRef]
  13. Saber, H.; Moeini-Aghtaie, M.; Ehsan, M. Developing a multi-objective framework for expansion planning studies of distributed energy storage systems (DESSs). Energy 2018, 157, 1079–1089. [Google Scholar] [CrossRef]
  14. Leach, F.; Kalghatgi, G.; Stone, R.; Miles, P. The scope for improving the efficiency and environmental impact of internal combustion engines. Transp. Eng. 2020, 1, 100005. [Google Scholar] [CrossRef]
  15. Verma, S.; Mishra, S.; Gaur, A.; Chowdhury, S.; Mohapatra, S.; Dwivedi, G.; Verma, P. A comprehensive review on energy storage in hybrid electric vehicle. J. Traffic Transp. Eng. (Engl. Ed.) 2021, 8, 621–637. [Google Scholar] [CrossRef]
  16. Bibak, B.; Tekiner-Moğulkoç, H. A comprehensive analysis of Vehicle to Grid (V2G) systems and scholarly literature on the application of such systems. Renew. Energy Focus 2021, 36, 1–20. [Google Scholar] [CrossRef]
  17. Zeng, Q.; Zhao, M.; Yuan, Y. Hydrogen-rich fuel combustion characteristics of a counter dual-swirl combustor at fixed power. Energy Rep. 2022, 8, 91–100. [Google Scholar] [CrossRef]
  18. Ozturk, M.; Midilli, A.; Dincer, I. Effective use of hydrogen sulfide and natural gas resources available in the Black Sea for hydrogen economy. Int. J. Hydrogen Energy 2021, 46, 10697–10707. [Google Scholar] [CrossRef]
  19. Fuel Cell and Hydrogen Energy Association. Road Map to a Us Reducing Emissions and Driving Growth across the Nation; Fuel Cell and Hydrogen Energy Association: Washington, DC, USA, 2020. [Google Scholar]
  20. Fraunhofer. A Hydrogen Roadmap for Germany: Executive Summary; Fraunhofer: München, Germany, 2019. [Google Scholar]
  21. Japanese Ministry of Economy Trade and Industry. The Strategic Road Map for Hydrogen and Fuel Cells. Available online: https://www.meti.go.jp/english/press/2019/pdf/0312_002b.pdf (accessed on 22 March 2022).
  22. UK Hydrogen and Fuel Cell Association. The Case for Green Hydrogen; UK Hydrogen and Fuel Cell Association: London, UK, 2021. [Google Scholar]
  23. Zhao, Y.; McDonell, V.; Samuelsen, S. Influence of hydrogen addition to pipeline natural gas on the combustion performance of a cooktop burner. Int. J. Hydrogen Energy 2019, 44, 12239–12253. [Google Scholar] [CrossRef]
  24. John, J.S. Green Hydrogen in Natural Gas Pipelines: Decarbonization Solution or Pipe Dream? Available online: https://www.greentechmedia.com/articles/read/green-hydrogen-in-natural-gas-pipelines-decarbonization-solution-or-pipe-dream (accessed on 22 March 2022).
  25. Lee, B.; Heo, J.; Kim, S.; Sung, C.; Moon, C.; Moon, S.; Lim, H. Economic feasibility studies of high pressure PEM water electrolysis for distributed H2 refueling stations. Energy Convers. Manag. 2018, 162, 139–144. [Google Scholar] [CrossRef]
  26. Anwar, S.; Khan, F.; Zhang, Y.; Djire, A. Recent development in electrocatalysts for hydrogen production through water electrolysis. Int. J. Hydrogen Energy 2021, 46, 32284–32317. [Google Scholar] [CrossRef]
  27. Gómez-Camacho, C.E.; Ruggeri, B. Energy Sustainability Analysis (ESA) of energy-producing processes: A case study on distributed H2 production. Sustainability 2019, 11, 4911. [Google Scholar] [CrossRef] [Green Version]
  28. Energy Factor. What are blue hydrogen and green hydrogen? Available online: https://energyfactor.exxonmobil.asia/reducing-emissions/alternative-fuels/blue-green-hydrogen/ (accessed on 12 January 2022).
  29. Global Carbon Capture and Storage Institute. Blue Hydrogen. Available online: https://www.globalccsinstitute.com/wp-content/uploads/2021/04/Circular-Carbon-Economy-series-Blue-Hydrogen.pdf (accessed on 12 May 2022).
  30. Energy Factor. Hydrogen: Another Chapter in ExxonMobil’s Lower-Emissions Ambitions. Available online: https://energyfactor.exxonmobil.com/reducing-emissions/carbon-capture-and-storage-baytown-blue-hydrogen-video/ (accessed on 12 May 2022).
  31. Shell. The Shell Blue Hydrogen Process. Available online: https://www.shell.com/business-customers/catalysts-technologies/licensed-technologies/refinery-technology/shell-blue-hydrogen-process.html (accessed on 12 May 2022).
  32. Technip Energies Hydrogen. Available online: https://www.technipenergies.com/markets/hydrogen (accessed on 12 May 2022).
  33. International Energy Agency. Net Zero by 2050: A Roadmap for the Global Energy Sector; International Energy Agency: Paris, France, 2021. [Google Scholar]
  34. United Nation Climate Change. Land Use, Land-Use Change and Forestry (LULUCF). Available online: https://unfccc.int/topics/land-use/workstreams/land-use--land-use-change-and-forestry-lulucf (accessed on 12 January 2022).
  35. Gür, T.M. Carbon Dioxide Emissions, Capture, Storage and Utilization: Review of Materials, Processes and Technologies. Prog. Energy Combust. Sci. 2022, 89, 100965. [Google Scholar] [CrossRef]
  36. Khosroabadi, F.; Aslani, A.; Bekhrad, K.; Zolfaghari, Z. Analysis of Carbon Dioxide Capturing Technologies and their technology developments. Clean. Eng. Technol. 2021, 5, 100279. [Google Scholar] [CrossRef]
  37. Ministry of Energy. Thailand’s Power Development Plan (PDP) 2018. Available online: http://www.eppo.go.th/images/POLICY/PDF/PDP2018.pdf (accessed on 16 January 2022). (In Thai).
  38. Department of Economic and Social Affiars of the United Nations Secretatiat. 2019 Revision of World Population Prospects. Available online: https://population.un.org/wpp/Download/Files/1_Indicators(Standard)/EXCEL_FILES/1_Population/WPP2019_POP_F01_1_TOTAL_POPULATION_BOTH_SEXES.xlsx (accessed on 4 January 2022).
  39. Diewvilai, R.; Audomvongseree, K. Generation expansion planning with energy storage systems considering renewable energy generation profiles and full-year hourly power balance constraints. Energies 2021, 14, 5733. [Google Scholar] [CrossRef]
  40. Billinton, R.; Harrington, P.G. Reliability Evaluation in Energy Limited Generating Capacity Studies. IEEE Trans. Power Appar. Syst. 1978, PAS-97, 2076–2085. [Google Scholar] [CrossRef]
  41. Depertment of Alternative Energy Development and Efficiency. Energy Efficiency Plan 2018–2037. Available online: https://policy.asiapacificenergy.org/node/4352/portal (accessed on 30 December 2021). (In Thai).
  42. Energy Policy and planning Office. Thailand’s Carbon Dioxide Emission per kWh (Generation). Available online: http://www.eppo.go.th/epposite/images/Energy-Statistics/energyinformation/Energy_Statistics/Emission/T09_01_15.pptx (accessed on 31 December 2021). (In Thai).
  43. Ministry of Energy. Thailand’s Power Development Plan (PDP) 2018 Rev. 1. Available online: https://policy.asiapacificenergy.org/node/4347/portal (accessed on 31 August 2021). (In Thai).
  44. Thananusak, T.; Punnakitikashem, P.; Tanthasith, S.; Kongarchapatara, B. The Development of Electric Vehicle Charging Stations in Thailand: Policies, Players, and Key Issues (2015–2020). World Electr. Veh. J. 2021, 12, 2. [Google Scholar] [CrossRef]
  45. The Nation. Thailand unveils roadmap to 30% EV production in 10 years. Available online: https://www.nationthailand.com/blogs/tech/40000851 (accessed on 3 January 2022).
  46. Baker McKenzie. Electric Vehicles: A new automotive world order. Available online: https://bakerxchange.com/rv/ff007bffaa0a31f71b959b406d4795b3c11c2e1a#bookmark2 (accessed on 3 January 2022).
  47. Energy Policy and Planning Office. Electricity Elasticity. Available online: http://www.eppo.go.th/epposite/images/Energy-Statistics/energyinformation/Energy_Statistics/Energy_indicators/T10_02_02.pptx (accessed on 4 January 2022). (In Thai).
  48. Electric Vehicle Association of Thailand. Thailand Electric Vehicle Current Status. Available online: http://www.evat.or.th/attachments/view/?attach_id=257398 (accessed on 4 January 2022). (In Thai).
  49. ENSOL. Study on the Preparation for the Future Use of Electric Vehicles in Thailand. Available online: http://www.eppo.go.th/images/Infromation_service/studyreport/ensol.pdf (accessed on 6 January 2022). (In Thai).
  50. Srikranjanapert, M.; Junlakarn, S.; Hoonchareon, N. How an Integration of Home Energy Management and Battery System Affects the Economic Benefits of Residential pv System Owners in Thailand. Sustainability 2021, 13, 2681. [Google Scholar] [CrossRef]
  51. Chaianong, A.; Bangviwat, A.; Menke, C.; Breitschopf, B.; Eichhammer, W. Customer Economics of Residential PV–Battery Systems in Thailand. Renew. Energy 2020, 146, 297–308. [Google Scholar] [CrossRef]
  52. Tangwiwat, B.; Audomvongseree, K. Benefit and Cost Analysis of the Installation of Rooftop Solar PV with Battery System. In Proceedings of the 2018 15th International Conference on Electrical Engineering/Electronics, Computer, Telecommunications and Information Technology (ECTI-CON), Chiang Rai, Thailand, 18–21 July 2018; pp. 505–508. [Google Scholar] [CrossRef]
  53. Electricity Generating Authority of Thailand. IPP Power Purchase Agreement Management Department. Available online: http://www.ppa.egat.co.th/ippx/ (accessed on 8 January 2022). (In Thai).
  54. Electricity Generating Authority of Thailand. SPP Power Purchase Agreement Management Department. Available online: http://www.ppa.egat.co.th/sppx/ (accessed on 8 January 2022). (In Thai).
  55. Electricity Generating Authority of Thailand. Foreign Power Purchase Agreement Management Department. Available online: http://www.ppa.egat.co.th/fppdx/ (accessed on 8 January 2022). (In Thai).
  56. Energy Regulatory Commission of Thailand. SPP/VSPP Database. Available online: http://www.erc.or.th/ERCSPP/Default.aspx (accessed on 8 January 2022). (In Thai).
  57. DNV GL AS. Energy Transition Outlook 2019; DNV GL AS: Høvik, Norway, 2018. [Google Scholar]
  58. DNV GL AS. Technology Outlook 2030; DNV GL AS: Høvik, Norway, 2020. [Google Scholar]
  59. International Panel of Climate Change. IPCC Special Report on Carbon Dioxide Capture and Storage, Chapter 2. Sources of CO2. Available online: https://www.ipcc.ch/site/assets/uploads/2018/03/srccs_chapter2-1.pdf (accessed on 18 April 2022).
  60. U.S. Energy Information Administration Cost and Performance Characteristics of New Generating Technologies, Annual Energy Outlook 2021. Available online: https://www.eia.gov/outlooks/aeo/assumptions/pdf/table_8.2.pdf (accessed on 18 April 2022).
  61. Sgouridis, S.; Carbajales-Dale, M.; Csala, D.; Chiesa, M.; Bardi, U. Comparative net energy analysis of renewable electricity and carbon capture and storage. Nat. Energy 2019, 4, 456–465. [Google Scholar] [CrossRef] [Green Version]
  62. The National Academy of Sciences. The Hydrogen Economy: Opportunities, Costs, Barriers, and R&D Needs; The National Academies Press: Washington, DC, USA, 2004; ISBN 9780309388108. [Google Scholar]
  63. Bhavnagri, K. Blue Hydrogen Could Become the White Elephant on Your Balance Sheet. Available online: https://www.bloomberg.com/news/articles/2021-12-16/market-risks-white-elephant-in-push-for-blue-hydrogen-bnef-view (accessed on 13 May 2022).
  64. Land Development Department of Thailand Land Use Map of Thailand 2017–2018. Available online: http://www1.ldd.go.th/web_OLP/result/map60-61/60-61A3.jpg (accessed on 19 April 2022). (In Thai).
Figure 1. Flow chart of generation expansion planning used in this paper.
Energies 15 03979 g001
Figure 2. Gross demand forecast and net energy demand forecast.
Energies 15 03979 g002
Figure 3. Gross peak demand forecast and net peak demand forecast.
Energies 15 03979 g003
Figure 4. EV charging profiles.
Energies 15 03979 g004
Figure 5. Additional renewable energy capacity.
Energies 15 03979 g005
Figure 6. Additional and cumulative BESS storage capacity.
Energies 15 03979 g006
Figure 7. PVBESS profile of 1 MW contracted capacity unit.
Energies 15 03979 g007
Figure 8. Investment cost of new PVBESS unit in each year with uncertainty.
Energies 15 03979 g008
Figure 9. Heat rate of new CCGT unit in each year.
Energies 15 03979 g009
Figure 10. Average carbon dioxide emission constraints.
Energies 15 03979 g010
Figure 11. Percentage of hydrogen blended into the natural gas network.
Energies 15 03979 g011
Figure 12. Example of cost of 75% maximum hydrogen blending case.
Energies 15 03979 g012
Figure 13. Additional capacity of each scenario.
Energies 15 03979 g013
Figure 14. Additional capacity of candidate units in each scenario. (a) 0% hydrogen; (b) 25% hydrogen; (c) 50% hydrogen; (d) 75% hydrogen.
Energies 15 03979 g014
Figure 15. Fuel mix ratio of the 0% hydrogen scenario.
Energies 15 03979 g015
Figure 16. Fuel mix ratio of the 25% hydrogen scenario.
Energies 15 03979 g016
Figure 17. Fuel mix ratio of the 50% hydrogen scenario.
Energies 15 03979 g017
Figure 18. Fuel mix ratio of the 75% hydrogen scenario.
Energies 15 03979 g018
Figure 19. Loss of load expectation comparison.
Energies 15 03979 g019
Figure 20. Average electricity cost comparison.
Energies 15 03979 g020
Figure 21. Average carbon dioxide emission comparison.
Energies 15 03979 g021
Figure 22. Average electricity cost with uncertainties.
Energies 15 03979 g022
Table 1. Uncertainty of projected BESS cost.
% BESS cost above projected value+0%+10%+20%+30%+40%+50%
Associated probability0.500.250.100.0750.050.025
Table 2. Uncertainty of forecast hydrogen cost.
% Hydrogen cost above projected value+0%+10%+20%+30%+40%+50%
Associated probability0.500.250.100.0750.050.025
Table 3. Land use for PVBESS installation by 2050.
Item0% H225% H250% H275% H2
PVBESS capacity by 2050 (MW)121,000114,500100,50063,000
PV capacity (1.7×) (MW)205,700194,650170,850107,100
BESS capacity (5.13×) (MWh)620,730587,385515,565323,190
Area usage (sq.km.)3192302026511662
Table 4. Joint probability density function for BESS and hydrogen cost uncertainties.
Parameters% Hydrogen Cost above Projected Value
+0%+10%+20%+30%+40%+50%
% BESS cost above projected value0%0.250.1250.050.03750.0250.0125
+10%0.1250.06250.0250.018750.01250.00625
+20%0.050.0250.010.00750.0050.0025
+30%0.03750.018750.00750.0056250.003750.001875
+40%0.0250.01250.0050.003750.00250.00125
+50%0.001250.006250.00250.0018750.001250.000625
Publisher’s Note: MDPI stays neutral with regard to jurisdictional claims in published maps and institutional affiliations.

