Abstract
The article presents a method of controlling the size of droplets generated by a system that sprays a high-viscosity liquid containing particles of a solid body, i.e., a catalyst. The work is a continuation of previous research concerning the spraying of liquids with a catalyst, which improves the efficiency of the process. As a result of the conducted CFD calculations, it was found that to bring the catalyst to the system, a droplet with a diameter of at least 30 µm should be generated. The tests were carried out on a laboratory scale on a model isopropanol-water system. A polymer containing Raney nickel particles was added to the suspension. The analysis of the obtained data confirmed the possibility of generating droplets with the desired diameters in order for the liquid carrying the catalyst to not evaporate before it is delivered to the combustion chamber. The designed and constructed test system allows the diameters of the generated droplets to be controlled by changing the settings of the spraying nozzle. Moreover, it enables the parameters of the process, and the spraying itself, to be controlled. In further work, tests on a real 0.5 MW facility are planned. Due to the use of a catalyst, a greater degree of fuel burnout can be obtained, and the dynamics of the combustion process can be improved. Additionally, the parameters of the emitted exhaust gases and ash composition can also be enhanced.
1. Introduction
Coal-fired boilers are the most popular solution used in power plants and combined heat and power plants. However, new requirements in the field of environmental protection and sustainable energy have caused an increase in the costs of coal combustion due to the costs and maintenance of devices that monitor and control pollution. Most of the currently operating boilers have reached the end of their service life, which in turn is associated with a deterioration in their efficiency and reliability. Moreover, this results in an increase in their operating costs, and replacing them with new devices generates high outlays. A better solution is to modernize them, while ensuring that the currently required operational indicators and environmental protection standards are met. Other hazards related to the physical properties of hard coal, such as methane accumulation and spontaneous combustion, which can lead to explosions and fires, also need to be considered [1]. Finding a balance between environmental protection requirements and maintaining the further widespread use of coal as the main energy resource requires several projects [2]. The key activity among them is the development and implementation of new, highly efficient combustion technologies with the simultaneous development of the treatment of the generated exhaust gases. One of the most important combustion techniques is combustion in furnaces such as pulverized coal boilers. This is associated with the many advantages of such systems, such as: the flexibility of furnaces, the adaptation to various types of burned coal, or the large power range of power units. Coal dust is delivered to the boiler pneumatically through dust pipes, and is then blown into the furnace with the use of pulverized dust burners [2]. It is possible to control the dynamics of the process at the stage of fuel transport [3]. The most popular solution for modifying the course of the combustion process itself is the use of properly selected catalysts [4,5,6]. A very important aspect here is the method of dosing and delivering the catalyst to its destination.
Before the implementation of a new solution on an industrial scale, one very important stage is the creation of simulation models for the system under consideration, as well as conducting experiments on a laboratory scale. Such action allows for the reduction of costs that would be generated by experiments on a real scale, and also enables the considered solution to be optimized at the design stage [7]. In the literature concerning the issue of dust channels, a number of experimental and model (based on numerical calculations) studies can be found. The proposed models always require validation, and therefore more and more research covers both of these elements [8].
In recent years, in order to reduce soot emissions, the DFI (ducted fuel injection) concept has attracted a lot of attention. This solution involves injecting atomized fuel through a small cylindrical tube that is located inside the combustion chamber at a distance from the nozzle injector’s opening. The use of such a structure results in increased aeration in the vicinity of the nozzle due to the high spray velocity, which is caused by the pumping effect at the inlet of the channel. In addition, the mixing process is also intensified as a result of the turbulence distribution at the outlet of the channel. This in turn results in a narrower equivalence distribution during ignition. Millo et al. [9] analyzed the influence of such a design solution on spraying characteristics, air-fuel mixture, and soot formation. They conducted experimental studies for various thermodynamic conditions and injection pressures, which were followed by CFD simulations. It was shown that the use of DFI reduces soot emissions by up to 80% when compared to a non-atomizing device.
Al-Hamouz [10] determined (experimentally, and with the use of a numerical algorithm) the influence of the geometrical and operational parameters of single-stage wire-duct electrostatic precipitators (WDEP) on the efficiency of fly ash collection. The analyzed parameters were: wire radii, wire-to-wire spacing, wire-to-plate spacing, fly ash flow velocity, and applied voltage polarity. It was proved that under negative applied voltage, collection efficiency is higher than that under positive applied voltage. As wire-to-wire spacing increases, the collection efficiency initially increases and then decreases. In contrast, the collection efficiency decreases when the discharging wires’ radii increases. When the flow velocity increases, the collection efficiency increases to the maximum value, and then decreases. The results of numerical simulations prove that for particles with a diameter of above 4 µm, the efficiency of collecting coal ash increases with an increase of the particles’ diameter. In contrast, the efficiency decreases when the particles’ concentration at the inlet increases and the particles’ resistivity decreases.
Blondeau et al. [11] conducted experimental studies on a large scale (660 MW). Their goal was to obtain data that would allow for the optimization of the existing system. The subject of the research was the particle size distribution and the flow rate distribution to the burners in a coal-fired power plant. This is a difficult area to optimize, which is due to the fact that the course of the flow needs to be monitored on-line. Transport of the catalyst through a dust pipe to a fuel combustion chamber is a multi-threaded issue. It is necessary to consider many variables that influence the dosing process. The most important factors include: the parameters of the stream that transports the catalyst, the assumed amount and form of the catalyst, its concentration, and the geometry of the system. In order for the catalyst to fulfill its function, it needs to be dosed in the form of a suspension. Solid particles are suspended in a highly viscous liquid solution, and in this form the system is delivered to the conduit by means of a specially adapted nozzle [11]. The high viscosity of the suspension results in specific requirements for the dosing nozzles. It is expected that spraying will produce droplets of a certain diameter (diameter distribution), the process itself will be stable, and the nozzle will operate without failure (no risk of clogging the outlet opening). Droplet size is a critical problem in a boiler’s operation and one of the key factors in determining combustion efficiency. There is still insufficient knowledge of the influence of fluid properties, process operating conditions, and nozzle design on the characteristics of spraying. The influence of liquid viscosity, especially high-viscosity liquids, on the stability of atomization has been discussed in many papers [12,13,14]. Loebker and Empie [14] described the issue of burning black liquor in a recovery boiler. Black liquor is a by-product of the sulphate process during the digestion of wood mass. Black liquor with a solids content of 80–85% behaves like a Newtonian fluid with its viscosity ranging from 0.3 to more than 30 Pa·s. The authors analyzed the droplet size, which is a critical parameter that determines the operation of a recovery boiler and the efficiency of the combustion process. The authors [14] showed that the use of a bubble atomizer allows droplet sizes that are typical for a recovery boiler to be obtained—even in the case of high-viscosity liquids. The authors noticed that the increase in viscosity hinders the secondary breakdown of the droplets. In addition, the droplets become deformed with an increase in viscosity and/or a decrease in the GLR (gas to liquid ratio). The atomization characteristics are also likely to be influenced by the initial homogeneity of the gas-liquid mixture.
The influence of many factors on the atomization process makes determining equivalent droplet sizes difficult, and possibly more inaccurate. Mlkvik et al. [12,13] examined the influence of viscosity on the stability of atomization when comparing the Y-jet nozzle with atomizers that use two types of mixing: outside-in-liquid (OIL) and out-side-in-gas (OIG). The Y-jet nozzle is a well-known nozzle design that can be found in industrial applications. This type of nozzle is interesting, as in the atomization process it also uses a high velocity gas stream that is combined with the injection of the liquid stream. The authors [13] noticed that most of the injected liquid in the Y-jet penetrates into the high velocity gas stream and reaches the opposite wall. It then flows towards the outlet. The remaining liquid separates from the compact stream and forms different sized droplets within the mixing chamber. As the viscosity increases, the deformation is slower, which in turn causes the liquid to break up further away from the outlet opening. Mlkvik et al. [12] noticed that the characteristic feature of the Y-jet atomizer was the low sensitivity of the quality of the generated droplets to the liquid viscosity. This is a significant difference when compared to the discussed devices of the OIL and OIG types, in which the intensity of spray pulsation, as well as the size of the droplets, depended on the viscosity of the liquid.
The presence of solid particles also affects the droplet formation process. Watcher et al. [15] investigated the influence of the mass share of suspensions, gas velocity, and the GLR value on the size of the formed droplets. An external-mixing twin-fluid atomizer was used in the study. A high-speed camera and a Spraytec particle analyzer were used for the measurements. It was shown that the mean Sauter diameter decreases with an increase in gas velocity, but increases with a rise in the viscosity of the suspension. The droplets also increased with an increase in the mass share of solid particles. The primary disintegration instability changed as a function of dynamic viscosity—analogous to the mass share of the solid particles. A simultaneous simulation of a three-phase system and the movement of solid particles and droplets in a gas stream was also the subject of research involving multi-scale models [16].
Due to the insufficient amount of information concerning the method of spraying catalyst suspensions when feeding them to pulverized furnaces, the main goal of the paper was to develop and construct a laboratory stand that would allow for the correct dosing of the catalyst to the combustion chamber. Moreover, the stand was meant to enable the effectiveness of the developed concept to be analysed during experimental tests. The proposed solution makes it possible to increase the efficiency of energy production. The laboratory tests also aimed to validate the numerical models of this system, which were presented in previous work [7].
2. Materials and Methods
2.1. Dust Duct
The experimental tests were carried out on a model system with a geometry that corresponds to the real system of a dust duct supplying coal dust to an existing coal dust boiler at a combined heat and power (CHP) plant in Poland [7]. The temperature in the dust channel was >100 °C. The dust channel was a cylindrical steel pipe with a diameter of 300 mm and a length of 2.5 and 6.0 m. From the point of view of this publication, the most important part of the dust duct was a 2.5 m long pipe in which the catalyst feeding system was installed. It was located 1.0 m from the burner. On an industrial scale, the gas flow rate through the dust duct is equal to 5000 m3n/h (at a speed of 26.8 m/s), the amount of supplied dust is 1.2 t/h, and its grain size ranges from 20 to 200 μm. The reactant/catalyst at 25 °C is fed at a volumetric flow rate of 300 mL/h at a speed of 120 m/s. The diameter of the generated droplets should be >30 μm [7] so that the catalyst can cover a length of the dust duct equal to 1.0 m and reach the boiler (combustion zone) in its liquid state. This system is described in detail in [7].
Figure 1 shows the test stand on a laboratory scale, which includes: an open-type dust duct; a flow, temperature and pressure controlling unit; a Sprayatec device (Malvern Instruments, Worcestershire, UK); and a spraying nozzle with a controller, which supplies the catalyst in a liquid form. A quartz pipeline, i.e., a dust duct with a length of 1.265 m and a diameter of 31 mm, at the ends of which supports with measuring instruments were mounted, was placed on the supporting structure. Six IR heaters with a total power of 3600 W were used for heating. The station allows for the precise control of operating parameters in a wide range of their variability, and enables a constant temperature along the entire length of the dust duct to be obtained. In the research, a PLC controller that can test both the hydrodynamics of the system and the generation of catalyst droplets was used. An alternative solution to this controller can be the application of the Field Programmable Gate Array [17].
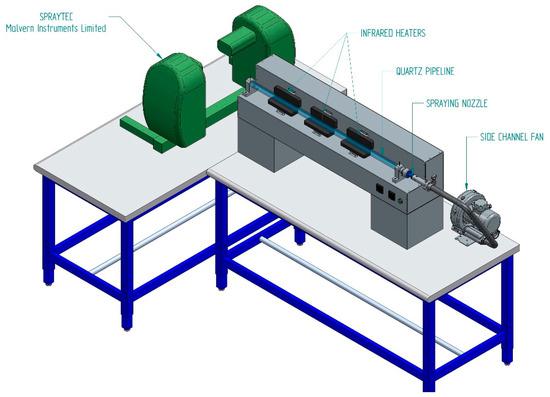
Figure 1.
Test stand.
One of the most important elements is the catalyst droplet generator—a two-phase atomizing nozzle. Due to its capabilities and construction, it should be labelled as an “aerodynamic multi-phase reactor”, but since in this case, it administers only one substance, the authors decided to use the name that better reflects its operation. The schematic diagram of the nozzle is shown in Figure 2. The nozzle and the principle of its operation are described in detail in [18]. Its use allows for the controlling/regulating of the size of the generated droplets of the suspension of a catalyst in liquid—depending on the operational parameters of the process and the viscosity of the catalyst (a liquid containing catalyst particles in a solid form—suspension). The liquid supply nozzle was positioned at an angle of 90 ° to the gas nozzle, whereas the wall’s cut angle was equal to 30°. This cut was on the opposite side of the central conduit, as shown in Figure 2 (see detail A on Figure 2c). The diameter of the opening was equal to 0.5 mm.
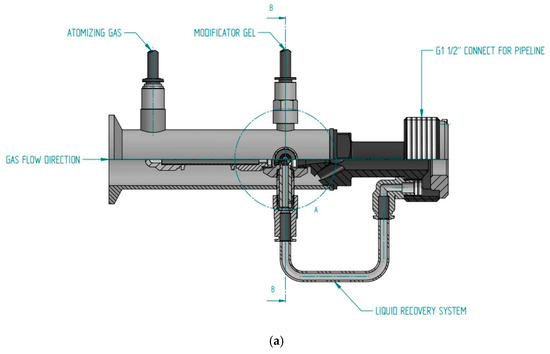
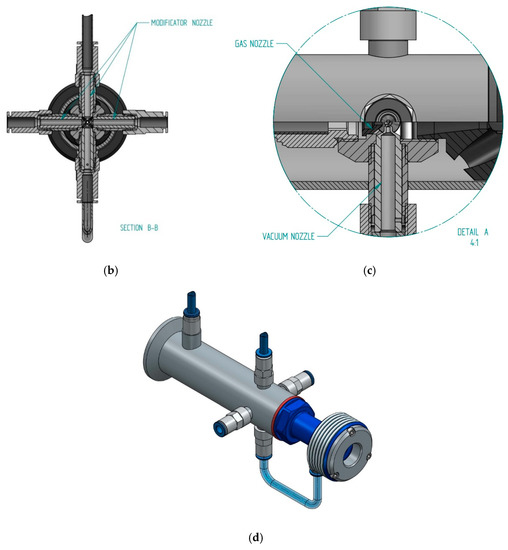
Figure 2.
The catalyst atomizing nozzle: (a) construction, (b) B-B section, (c) the position of the liquid nozzle, (d) visualization.
2.2. Liquid Viscosity Tests
A Brookfield DV-II + Pro sp. 02 rotational viscometer made by AMTEK [19] was used to measure the dynamic viscosity of the liquid. Brookfield viscometers are widely used for measuring the viscosity of food and cosmetics. Their advantages include their ease of use, reliability, and low cost. They are equipped with a spindle that is driven by a calibrated spring, the deflection of which determines the viscous drag of fluids. A rotary transducer is used to determine the deflection of the spring. The measured torque, after being calibrated for the Newton standard, is converted into dynamic viscosity. The measuring range of the DV-II + Pro depends on the rotational speed of the spindle, its size and shape, the container it is rotating in, and the full-scale torque of the calibrated spring. The viscous drag increases with an increase in the size of the spindle and/or rotational speed. The measurement involves the immersing of the spindle of the viscometer in a container with the tested liquid, and the turning on of the rotation of the spindle. The rotor is driven by a compressed spring and an electric motor, which are located in the head of the viscometer. The dynamic viscosity measurement is performed with a changing spindle rotation speed. After setting the spindle’s rotation speed, it is required to wait 45 s until the value of the dynamic viscosity stabilizes. The measurement result is shown directly on the viscometer’s display. Depending on the viscosity of the tested liquid, spindles of various shapes and sizes are used. They are attached to the viscometer by being screwed to the lower shaft.
The liquids tested in the study were 33% aqueous isopropanol solutions with various additions of Hostacerin MCP polymer (Clariant Iberica Production, Barcelona, Spain) at a concentration of 0.3 to 0.6%. The RV2 spindle was used in the tests. Viscosity measurements were made for a spindle rotation speed of 50 and 100 rpm at a temperature of 20 ± 1 °C. The dynamic viscosity values for individual solutions are presented in Table 1.

Table 1.
The obtained test results and operation parameters.
2.3. Droplet Size Testing with the Use of a Spraytec
The study of the size of the aerosol droplets that are released from the atomizing nozzle was carried out using the diffraction method and a Spraytec laser spectrometer. The measuring instrument records the deflection of the coherent radiation beam at the edges of the particles of the dispersed phase, which as a result of this interaction become the source of the secondary spherical wave. Due to the fact that the beam is scattered simultaneously by all the droplets of the tested aerosol located in the measurement space, spherical waves interfere with the formation of interference fringes, which are recorded by the device’s detector unit. The use of advanced optical models in Spraytec software, (which include the effect of multiple scattering and the reflection and absorption of radiation), as well as the knowledge that large aerosol particles scatter most of the light energy at a smaller angle in relation to small particles (while maintaining a higher radiation intensity), enables data that describe the volume distribution of the droplet size of the studied aerosol to be generated [20,21,22].
The measuring range of the device used in the tests was between 0.1 and 900 µm. The measurements were performed in an open bench mode, i.e., the aerosol was released directly into the laser beam, with the distance between the aerosol source and the laser beam being constant and equal to 10 cm. The refractive index (RI) of the continuous phase (air) was set (as default) at 1.0, whereas the refractive index of the dispersed phase was set at 1.33. The multiple scattering analysis was on and the detector range was full. In order to limit the unfavorable recirculation of the aerosol in the environment (which may hinder the analysis of the optical background), it was decided to use a point extraction device that removed the aerosol from the measuring space. The tests were carried out with the sampling frequency at the level of 1 Hz, which, with the measurement time of 60 s, allowed 60 measurement points to be generated. On their basis, the average droplet size distribution was determined, which was calculated in relation to their volume. Afterwards, for each of the distributions, the following numerical indicators were obtained:
- –
- percentile values: Dv10, Dv50, Dv90 in [µm], which denote the diameters below which there is: 10%, 50%, and 90% of the droplets’ volume,
- –
- the width of the volumetric distribution, the so-called “Span”, which is calculated from the following equation:
- –
- geometric standard deviation (GSD):
- –
- surface-volume diameter D[3][2] (Sauter) [µm],
- –
- volumetric share of particles larger than 30 µm [vol. in %].
Due to the fact that the research was carried out with a minimum of three repetitions, the mean values of each of the analyzed indicators and the standard deviation were determined based on the obtained data.
The scope of the conducted tests included the measurement of the size of the aerosol droplets that were released from the two-phase spraying nozzle, while also taking into account three selected pressures (1–3 bar) of compressed air supplied to the atomizing nozzle, and one volume flow of liquid, which was set at 500 mL/h. The liquid flow was provided by a screw pump [MD 0005-24, SEEPEX, Yeovil, UK], while compressed air was supplied from the installation through a regulator that was equipped with electronically controlled valves. In addition to the air that was supplying the gas nozzle installed in the droplet generator, an additional air flux was supplied from an external side-channel fan [SC101MG0.2M, Emmecon, Italy]. It enabled the linear gas velocity at the level of 26–30 m/s to be obtained at the generator’s outlet.
3. Results
Model isopropanol solutions (suspensions) with the addition of a polymer that contained Raney nickel particles with a viscosity from 0.146 to 0.415 (Pa·s) were subjected to the spraying process. Based on the conducted research, the values of the most important parameters were estimated, which in turn allowed the properties of the generated aerosol and the efficiency of the atomization process to be characterized. Exemplary values are summarized in Table 2.

Table 2.
The obtained test results and the operation parameters.
The data from Table 2 prove that there is a clear influence of an increase in both the air flow rate and pressure on the individual indicators (determined on the basis of the spraying spectra). The authors noticed a significant decrease in the obtained values for Dv10, Dv50 and D[3][2] in the case of all the tested systems. The remaining analyzed values not only showed a dependence on pressure, but also on the viscosity of the sprayed system. In the case of the liquids with lower viscosities (ZBCN1 and ZBCN2), a significant decrease in the values of Dv90, GSD and Span was observed with the increase of the applied pressure. In turn, for the liquids with a higher viscosity (ZBCN3 and ZBCN4), a decrease in the Dv90, GSD and Span values was initially observed with an increase in pressure from 1 to 2 bar. Afterwards, there was an increase of these values due to a rise in the pressure to a value of 3 bar. The clear influence of pressure on the properties of the aerosol in the process of pneumatic atomization was also confirmed by Vecellio [23], Ari and Restrepo [24], and Matuszak et al. [25].
Figure 3 shows an example of the distribution spectra for an aerosol generated as a result of spraying the liquid that had the highest and lowest viscosity (ZBCN1 and ZBCN4) at the pressure of 1 and 3 bar. Parameters D and N describe the fitting of the obtained results to the log-normal distribution model. Parameter D is the so-called scale parameter, and parameter N is the location parameter. It was noticed that the distribution spectra obtained for the ZBCN4 are significantly more shifted to the right towards larger mean diameters. In the case of using a higher pressure value, the spectrum of the diameter distribution for the ZBCN4 has a bimodal character. The obtained distribution spectra also confirm the fact that in both cases a larger volumetric share of larger droplets was obtained when spraying at the lowest pressure (1 bar).
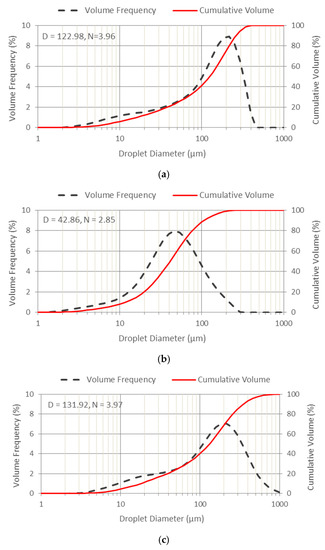
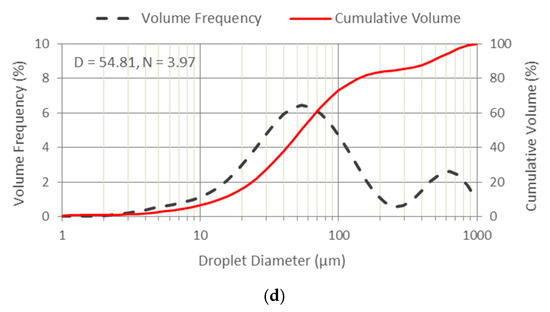
Figure 3.
Distribution spectra of the droplet diameters obtained for: (a) ZBCN1 and a pressure of 1 bar, (b) ZBCN1 and a pressure of 3 bar, (c) ZBCN4 and a pressure of 1 bar, (d) ZBCN4 and a pressure of 3 bar. The red solid curve indicates the cumulative volume percentage per droplet size; the black dashed curve refers to the volume percentage per droplet size (volume frequency); and D and N are the parameters that describe the fitting of the obtained results to the log-normal size distribution.
Figure 4 and Figure 5 show exemplary graphs of the relationship between the size of the droplets and the pressure for all the tested solutions. Based on the graphs, it can be noticed that there is a decrease in the value of the analyzed mean diameters with an increase in the set pressure, and this is consistent with the assumed predictions [23,24,25]. The largest volumetric share of droplets with Dv50 and Dv[3][2], which had the values from 30 μm to 150 μm, was obtained for all the tested solutions sprayed at a pressure of 1 bar.
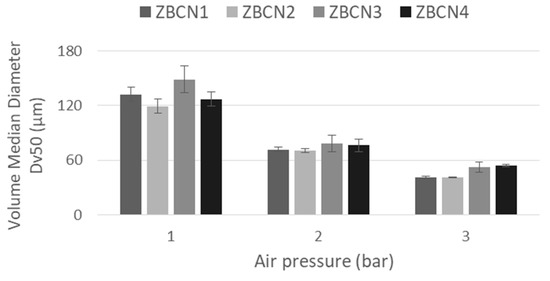
Figure 4.
Dependence between the median diameter and air pressure.
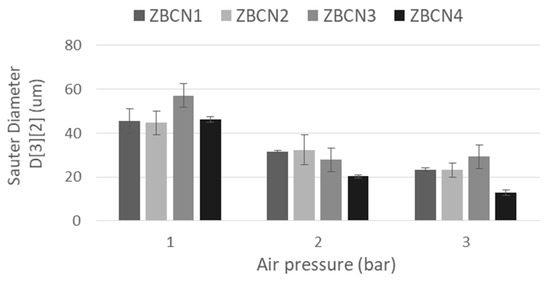
Figure 5.
Dependence between the volume-surface diameter and air pressure.
Figure 6 shows the dependence between the width of the volumetric distribution, the parameter calculated on the basis of Formula (1), and the pressure. The analysis of the presented dependencies showed that the Span index not only depends on the set pressure, but also on the physicochemical properties of the sprayed system. For liquids with the highest viscosities, which were sprayed at a pressure of 3 bar, the highest Span values were obtained, i.e., the spraying spectra assumed the widest range of diameters, and the generated aerosol was the most polydisperse in nature. In the case of the liquids with viscosities ≤ 0.228 (Pa·s), the change in the pressure value showed a negligible effect on the SPAN value. It is worth emphasizing, however, that the lowest Span values were obtained for the ZBCN1 and ZBCN2 liquids (with the lowest viscosities).
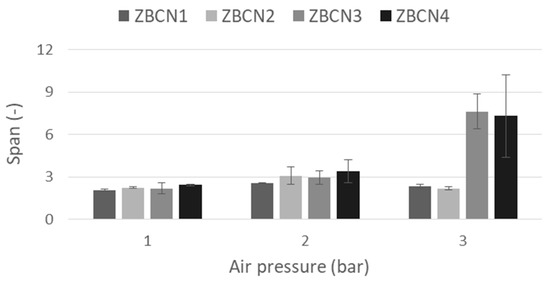
Figure 6.
Dependence between the span and air pressure.
Moreover, the conducted tests showed that the highest volume fraction of the droplets with a diameter greater than 30 µm was obtained for all the tested solutions with different viscosity, which were sprayed at the lowest pressure, i.e., 1 bar. There was also a clear downward trend in %V > 30 µm with an increase in pressure, as shown in Figure 7. The increasing pressure causes a decrease in the volumetric share of droplets with diameters of above 30 µm, which is confirmed by literature report [26]. This study indicates that an increase in the atomizing gas pressure causes a reduction of the formed droplets. The volumetric share of the droplets with diameters of above 30 µm at a pressure of 1 bar is about 82%, at a pressure of 2 bar it is about 79%, and at a pressure of 3 bar it is about 65%. At the same time, no significant and specific influence of the sprayed substance’s viscosity was observed, which may indicate the suitability of the spraying nozzle for spraying liquids with different properties, and also the possibility of spraying high-viscosity liquids when using it.
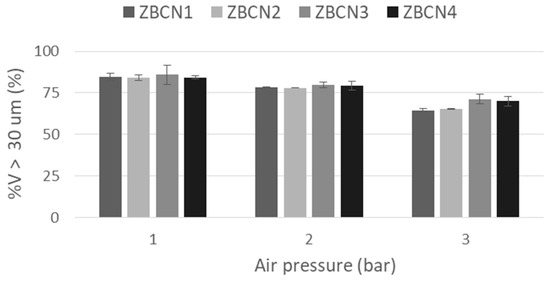
Figure 7.
Dependence between the air pressure and the volumetric share of the droplets with diameters greater than 30 µm.
Taking into account the specifics of the catalyst atomizing nozzle, as well as the properties of the dispersed phase (the presence of volatile compounds in the tested droplets) that was examined in this paper, it is important to choose the appropriate method of measuring the size of aerosol droplets. There are many measurement techniques that have been analyzed in detail by the authors in their previous studies, but only some of them meet specific requirements [27]. The selected laser diffraction method is suitable for testing concentrated aerosols such as those released by catalyst atomizing nozzles. This is due to the fact that it is not necessary to dilute the tested aerosol, which could favor the evaporation of droplets and, consequently, negatively affect the obtained results. Additionally, this method is characterized by a high sampling rate, thanks to which it is possible to test short-lasting particle clouds. The only limitation of this measurement technique is the need to know the refractive indexes of the measured droplets and the continuous phase, which in some cases may be difficult to determine.
4. Conclusions
As a result of the conducted laboratory tests, the previous CFD simulation predictions, which were related to the droplet size, were confirmed. The droplet size limit of 30 µm has proven to be correct, and such droplets can be fed to the system without evaporating. The research has also shown that by appropriately controlling the flow parameters it is possible to obtain the optimal, i.e., the desired (larger), droplet size. This is of great importance because the real objects on which the solution is meant to be applied have different geometries and operating parameters. The designed system, which allows for the precise dosage of the catalyst that improves the parameters of solid fuel combustion in the boiler, will be verified on a real object. Due to the proposed method, it will be possible to improve the dynamics of a boiler’s operation, and thus increase the flame stability and the degree of fuel burnout. The parameters of flue gas and ash will improve, and the energy consumption for producing the same amount of power will decrease. This research should be continued by extending it with studies concerning the phenomenon of evaporation.
5. Patents
There are patents resulting from the work reported in this manuscript—Bielecki, Z.; Szajna, E.; Ochowiak, M. Aerodynamics multi-phase reactor, European patent application, 2022—zbielecki@post.pl (Z.B.).
Author Contributions
Conceptualization: Z.B., M.O. (Marek Ochowiak), J.D., E.S. and D.C.; Formal analysis: Z.B., M.O. (Marek Ochowiak), J.D., E.S. and D.C.; Investigation: Z.B., M.O. (Marek Ochowiak), K.J., J.D., E.S., D.C., M.O. (Marcin Odziomek) and T.R.S.; Methodology: Z.B., M.O. (Marek Ochowiak), J.D., E.S., D.C., S.W., A.K., M.M., M.O. (Marcin Odziomek) and T.R.S.; Writing: Z.B., M.O. (Marek Ochowiak), M.M., A.K., S.W., K.J., J.D., E.S., D.C., M.O. (Marcin Odziomek) and T.R.S. All authors have read and agreed to the published version of the manuscript.
Funding
This research was supported by the project “Development and implementation of innovative technology intensification of the combustion of solid fuels” co-financed by the Polish National Centre for Research and Development, national program—R&D works and commercialization of R&D—Regional Scientific and Research Agendas/2017 (contract no. POIR.04.01.02-00.068/17-00). This research work was supported by Polish Ministry of Education and Science too.
Institutional Review Board Statement
Not applicable.
Informed Consent Statement
Not applicable.
Data Availability Statement
The data presented in this study are available on request from the corresponding author (Z.B.).
Acknowledgments
The authors thank the Polish National Centre for Research and Development and Polish Ministry of Education and Science for financial support.
Conflicts of Interest
The authors declare no conflict of interest concerning this study.
Abbreviations
%V > 30 μm—the percentage of volume of droplets that are bigger than 30 μm in diameter; 0—viscosity; —volumetric flow rate of liquid; D[3][2]—surface-volume diameter, Sauter diameter; Dv10, Dv50, Dv90—the volume median diameter (or Dv50) value indicates that half of the spray volume is contained in droplets that are smaller than this value, and half is contained in droplets that are larger than this value. Similarly, the Dv10 and Dv90 values indicate that 10 and 90%, respectively, of the spray volume is contained in droplets that are smaller than these values; GLR—gas to liquid ratio; GSD—geometric standard deviation and is calculated by the Equation (2); Span—the span quantifies the spread of the droplet size distribution and is calculated by the Equation (1).
References
- Gromaszek, K. Advanced Techniques for Controling the Coal Dust Combustion Process; Lublin University of Technology: Lublin, Poland, 2019. (In Polish) [Google Scholar]
- Hycnar, J.; Foltyn, R. Prospects of power engineering based on coal combustion. Min. Rev. 2009, 65, 14–18. (In Polish) [Google Scholar]
- Bilirgen, H.; Levy, E.K. Mixing and dispersion of particle ropes in lean phase pneumatic conveying. Powder Technol. 2001, 119, 134–152. [Google Scholar] [CrossRef]
- Sun, Z.; Zhang, Z.H.; Yuan, T.Q.; Ren, X.; Rong, Z. Raney Ni as a versatile catalyst for biomass conversion. ACS Catal. 2021, 11, 10508–10536. [Google Scholar] [CrossRef]
- Karthikeyan, D.; Saravanan, C.G. Experimental analysis of flyash based, ion exchanged zeolite as catalyst for si engine exhaust emission control. J. KONES 2013, 20, 229–235. [Google Scholar]
- Kaspar, J.; Fornasiero, P.; Hickey, N. Automotive catalytic convertors; current status and some perspectives. Catal. Today 2003, 77, 419–449. [Google Scholar] [CrossRef]
- Bielecki, Z.; Ochowiak, M.; Włodarczak, S.; Krupińska, A.; Matuszak, M.; Lewtak, R.; Dziuba, J.; Szajna, E.; Choiński, D.; Odziomek, M. The analysis of the possibility of feeding a liquid catalyst to a coal dust channel. Energies 2021, 14, 8521. [Google Scholar] [CrossRef]
- Wang, H.; Saa, Z.; Cheng, W.; Zhanga, R.; Yanga, S. Effects of forced-air volume and suction region on the migration and dust suppression of air curtain during fully mechanized tunneling process. Process. Saf. Environ. Prot. 2021, 145, 222–235. [Google Scholar] [CrossRef]
- Millo, F.; Piano, A.; Peiretti Paradisi, B.; Postrioti, L.; Pieracci, L.; Bianco, A.; Pesce, F.C.; Vassallo, A. Ducted Fuel Injection: Experimental and numerical investigation on fuel spray characteristics, air/fuel mixing and soot mitigation potential. Fuel 2021, 289, 119835. [Google Scholar] [CrossRef]
- Al-Hamouz, Z. Numerical and experimental evaluation of fly ash collection efficiency in electrostatic precipitators. Energy Convers. Manag. 2014, 79, 487–497. [Google Scholar] [CrossRef]
- Blondeau, J.; Kock, R.; Mertens, J.; Eley, A.J.; Holub, J. Online monitoring of coal particle size and flow distribution in coal fired power plants: Dynamic effects of a varying mill classifier speed. Appl. Therm. 2016, 98, 449–454. [Google Scholar] [CrossRef]
- Mlkvik, M.; Jedelsky, J.; Karbstein, H.P.; Gaukel, V. Spraying of viscous liquids: Influence of fluid-mixing mechanism on the performance of internal-mixing twin-fluid atomizers. Appl. Sci. 2020, 10, 5249. [Google Scholar] [CrossRef]
- Mlkvik, M.; Stähle, P.; Schuchmann, H.; Gaukel, V.; Jedelsky, J.; Jicha, M. Twin-fluid atomization of viscous liquids: The effect of atomizer construction on breakup process, spray stability and droplet size. Int. J. Multiph. Flow 2015, 77, 19–31. [Google Scholar] [CrossRef]
- Loebker, D.; Empie, H. High Mass Flow Rate Effervescent Spraying of High Viscosity Newtonian Liquid. In Proceedings of the 10th Annual Conference on Liquid Atomization and Spray Systems, Ottawa, ON, Canada, 18–21 May 1997; pp. 253–257. [Google Scholar]
- Wachter, S.; Jakobs, T.; Kolb, T. Effect of solid particles on droplet size applying the time-shift method for spray investigation. Appl. Sci. 2020, 10, 7615. [Google Scholar] [CrossRef]
- Choiński, D.; Metzger, M.; Nocoń, W. Multiscale three-phase flow simulation dedicated to model based control. In Proceedings of the ICCS 2008—International Conference on Computational Science 2008, Kraków, Poland, 23–25 June 2008; Bubak, M., van Albada, G.D., Dongarra, J., Sloot, P.M.A., Eds.; Part II, LNCS; Springer: Berlin/Heidelberg, Germany, 2008; Volume 5102, pp. 261–270. [Google Scholar]
- Wyrwoł, B.; Hrynkiewicz, E. Decomposition of the fuzzy inference system for implementation in the FPGA structure. Int. J. Appl. Math. Comput. Sci. 2013, 23, 473–483. [Google Scholar] [CrossRef]
- Bielecki, Z.; Szajna, E.; Ochowiak, M. Aerodynamics Multi-Phase Reactor; European Patent Application: Munich, Germany, 2022. [Google Scholar]
- Potanin, A.; Marron, G. Rheological characterization of yield-stress fluids with Brookfield viscometer. Appl. Rheol. 2021, 31, 1–9. [Google Scholar] [CrossRef]
- Mitchell, J.P.; Nagel, M.W. Particle size analysis of aerosol from medicinal inhalers. KONA 2004, 22, 34–65. [Google Scholar] [CrossRef][Green Version]
- Mitchell, J.P.; Nagel, M.W.; Nichols, S.; Nerbrink, O. Laser diffractometry as a technique for rapid assessment of aerosol particle size from inhalers. J. Aerosol Med. 2006, 19, 409–433. [Google Scholar] [CrossRef]
- Kulkarni, P.; Baron, P.A.; Willeke, K. (Eds.) Aerosol Measurement: Principles, Techniques, and Applications, 3rd ed.; John Wiley & Sons, Inc.: Hoboken, NJ, USA, 2011. [Google Scholar]
- Vecellio, L.; Abdelrahim, M.E.; Montharu, J.; Galle, J.; Diot, P.; Dubus, J.C. Disposable versus reusable jet nebulizers for cystic fibrosis treatment with tobramycin. J. Cyst. Fibros. 2011, 10, 86–92. [Google Scholar] [CrossRef]
- Ari, A.; Restrepo, R.D. American association for respiratory care. Aerosol delivery device selection forspontaneously breathing patients. Respir. Care 2012, 57, 613–626. [Google Scholar] [CrossRef]
- Matuszak, M.; Ochowiak, M.; Włodarczak, S.; Krupińska, A.; Doligalski, M. State-of-the-art review of the application and development of various methods of aerosol therapy. Int. J. Pharm. 2022, 614, 121432. [Google Scholar] [CrossRef]
- Ochowiak, M. Theory and Practice of Atomizers with Swirl Flow; BEL Studio: Warsaw, Poland, 2018. (In Polish) [Google Scholar]
- Sosnowski, T.R.; Odziomek, M. Particle size dynamics: Toward a better understanding of electronic cigarette aerosol interactions with the respiratory system. Front. Physiol. 2018, 9, 853. [Google Scholar] [CrossRef] [PubMed]
Publisher’s Note: MDPI stays neutral with regard to jurisdictional claims in published maps and institutional affiliations. |
© 2022 by the authors. Licensee MDPI, Basel, Switzerland. This article is an open access article distributed under the terms and conditions of the Creative Commons Attribution (CC BY) license (https://creativecommons.org/licenses/by/4.0/).