1. Introduction
The buildings sector is responsible for around 37% of global CO
2 emissions, of which 10% are caused by the building construction industry [
1]. The current pandemic has led to a reduction in CO
2 emissions, but this is expected to be only temporary. The world’s population continues to grow and with the number of people inevitably an increase in CO
2 emissions is expected. To achieve the 2050 neutrality targets, it will be necessary to drastically reduce current emissions and offset the rising trend in CO
2 emissions due to population growth. This can be done, as the global report describes [
1], 70% by increasing electrification and efficiency, and the remaining part by using district heating (DH) and other renewable sources and behaving responsibly. According to [
1], it is expected that by 2050 over 85% of the buildings will be zero-carbon-ready leading to a reduction of 75% of the heating intensity of which around 50% will be covered by Heat Pumps (HP) and 10% by DH.
There exist several scenarios for the development of DH in Europe. Exemplarily, two different studies, one for Austria and one for Germany, are presented to show the wide range of expected contributions of DH in a future energy system. According to [
2] in Austria, the assumption is that the buildings will be deeply renovated, and, in contrast to a further extension of the DH system, the share and size in terms of energy remain rather constant, while, for Germany, the prediction according to [
3] is that the role of DH will significantly increase with a share of 40% (see
Figure 1). The share of large-scale HP in the DH in 2050 is assumed to be almost 50%. It is noteworthy that, according to [
4], the current German DH is predominantly fossil-based and the 2030 scenario seems very ambitious in that respect.
On a parallel track to the expansion, optimization and decarbonisation of DH networks is the race to increase the share of renewables in the electricity mix. This will make, the use of HP significantly more competitive than existing DH, at least in terms of CO
2 emissions [
5].
1.1. District Heating
District Heating networks distribute thermal energy and are therefore really well suited for covering the heating and domestic hot water demand of the buildings, which represent about 50% of the energy demand of the building sector. DHs are continuously evolving [
6]: the first DH generation was based on steam distribution, the second generation on pressurized hot water over 100 °C, and the third generation on pressurized hot water below 100 °C, proceeding towards low-temperature DH with the fourth and fifth generations. Reducing the operative temperature of the DH allows for reaching higher efficiencies (i.e., reducing the distribution losses) and fosters the integration of renewable heat sources and distributed low-temperature waste. DH enables to effectively exploit also geothermal energy, solar energy, heat from biomass combustion, industrial waste heat, Combined Heat and Power (CHP), industrial waste heat, waste incineration and other heat sources; see [
7,
8,
9]. Due to the limited availability of biomass, and as medium and high-temperature industrial processes will depend on biomass, the use of biomass in DH systems will be limited. It is noteworthy to mention that the use of biomass in DH is also limited due to the following aspects [
6]: biomass boilers are not flexible; therefore, they can only be used to cover the base load unless a gasification process is applied, and it is the only competitor against fossil fuel for the production of biofuel in the transportation field.
According to IEA [
10], the average renewables share in the DH networks all over the world should increase from 8% in 2020 to 14% in 2025 until 22% in 2030. The actual share of renewables is highly dependent on each country and local sources’ availability (see [
11]).
DH systems are typically very individual and depend on the local conditions. The largest DH system in Austria is Vienna with a high share of waste incineration [
12]. The DH in Graz is dominated by CHP [
13], while the DH in Innsbruck is comparatively small and complex with several small distributed heat sources [
13] (see
Table 1).
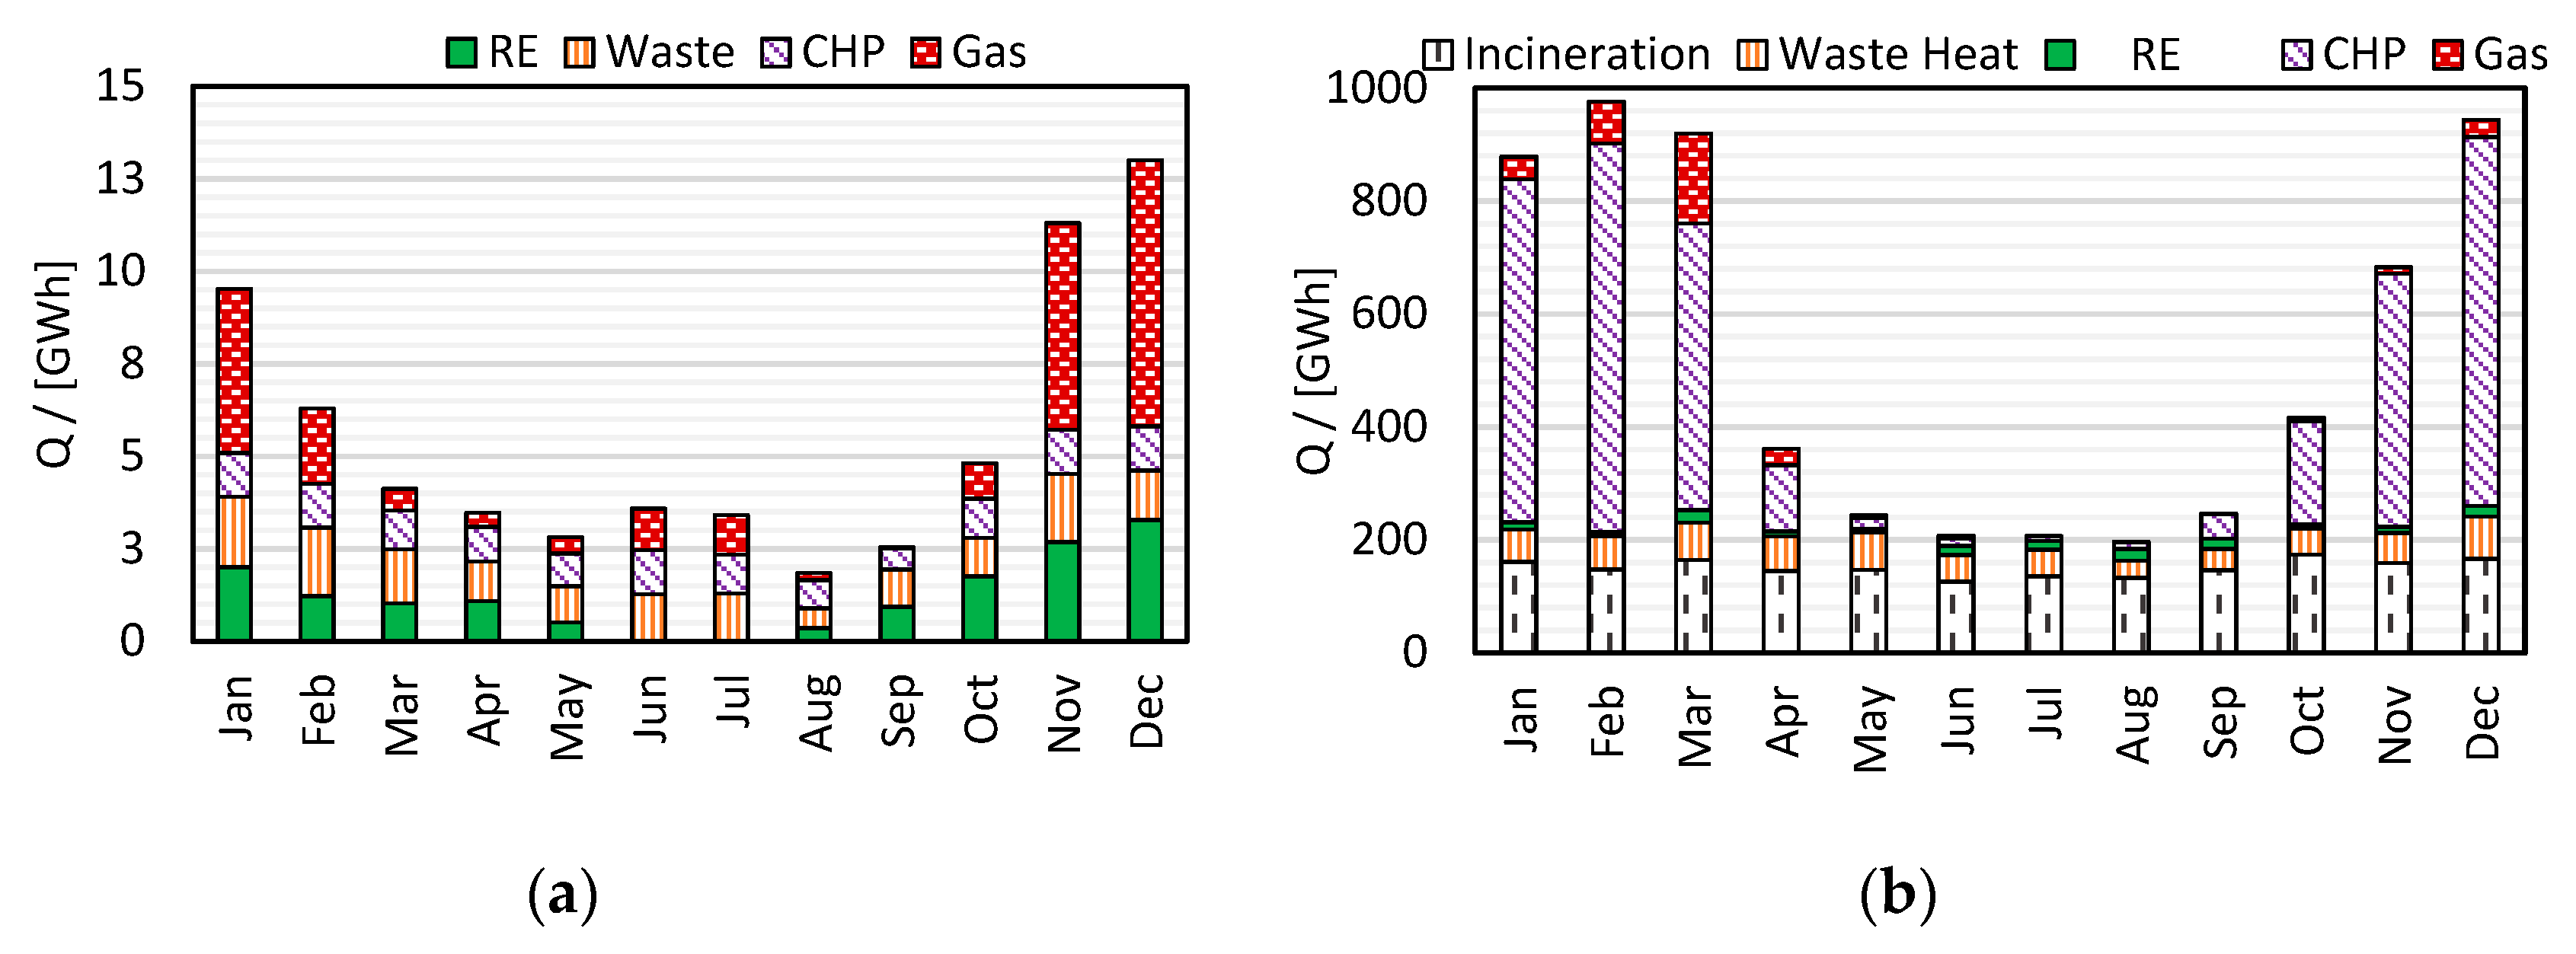
The simplified monthly energy balance of the DHs of Innsbruck and Vienna is presented in
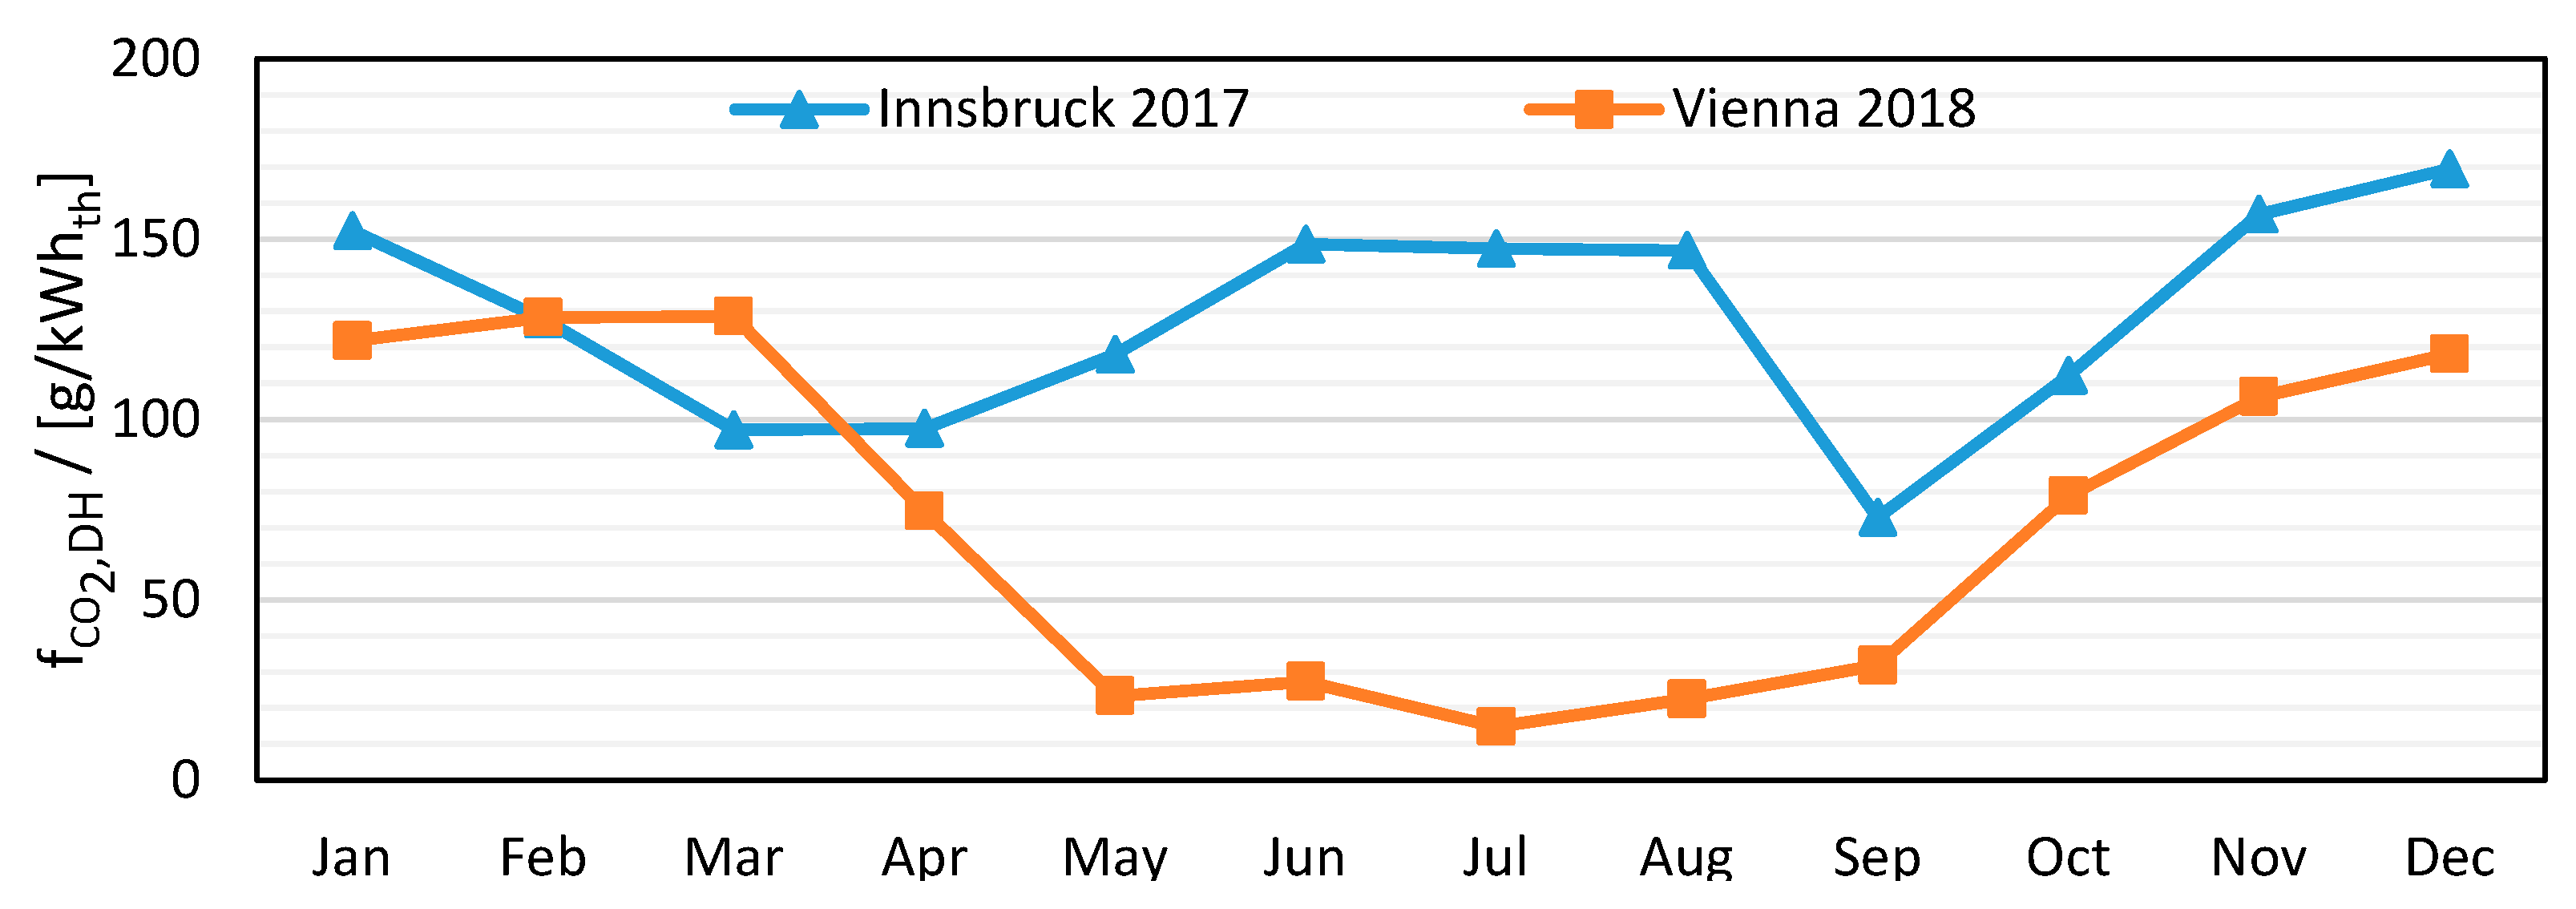
Figure 2. Both show significant seasonal variation with a high share of fossil energy contributions in winter.
1.2. Buildings
By 2021, all new buildings in the European Union (EU) must be nearly zero-energy buildings (nZEBs) in order to contribute to the achievement of the European CO
2 neutrality by 2050. Nevertheless, the European renovation rate is around 1.1%, far below the expected rate of 3% necessary to achieve the climate neutrality goals by 2050 [
14].
The energy demand, heating load and flow temperature requirement of the building stock are crucial factors in the operation of the DH networks. Ref. [
15] reviews measures for achieving a decrease of the required heating system temperatures during building renovations to allow a reduction of the DH operative temperatures. The demand of the building stock in terms of total energy and distribution over time play also an important role in the DH operation. In fact, the DH can be operated if the energy demand lies above the profitability threshold [
16].
1.3. Heat Pumps
The rising trend in the installation of HP outlined in [
1] is supported by the data reported in [
17] for the Austrian market. The report [
17] indicates a strong growth in the number of sold heating and domestic hot water HP with a nominal power up to 20 kW (i.e., for domestic use). In addition, Ref. [
17] describes a possible scenario for 2050 where the HP technologies will be strongly integrated with the urban DH networks.
It is noteworthy to mention that HP can play a major role in the transition toward low-temperature DH since they influence the energy demand and temperature required by the buildings [
15]. Booster HPs can, in fact, help in overcoming this problem [
18], allowing for operating the DH network with lower temperature, thus with reduced distribution losses and increased performance.
Manifold combinations of HP in the DH network are possible (see also
Section 2.3):
DH + Central HP (air, ground, water, waste-heat);
DH + Building/Block-wise HP for SH;
DH + Building/Block-wise HP for DHW;
DH + decentral/flat-wise Air—HP for DHW (PV-own-consumption);
DH + decentral/flat-wise RF—HP for DHW (PV-own-consumption);
DH + decentral/flat-wise Booster HP for DHW (low-ex);
Building/Block-wise HP for SH and DHW (no DH);
Decentral/flat-wise Air—HP for SH and DHW (no DH).
Typical DH systems are operated with a flow-temperature of up to typically 160 °C in winter and 90 °C in summer with a return temperature of 60 °C [
19]. HPs can be integrated as large-scale absorption or compression HPs centrally in the DH system. The source is low-grade environmental energy (air or ground) or low-temperature waste heat. The supply temperature of at least 90 °C has to be delivered if (fossil-based) post-heaters are not available.
Decentral HPs can be integrated block-wise with a low-temperature distribution system (e.g., 80/30) or building-wise [
20]. In low-energy buildings, typically 60 °C flow temperature is required for DHW, while space heating can be provided even at lower temperatures (e.g., 35 °C with underfloor heating). Decentral flat-wise HPs can deliver DHW at 50 °C to 55 °C.
1.4. Concept of the Decentral Booster Heat Pump
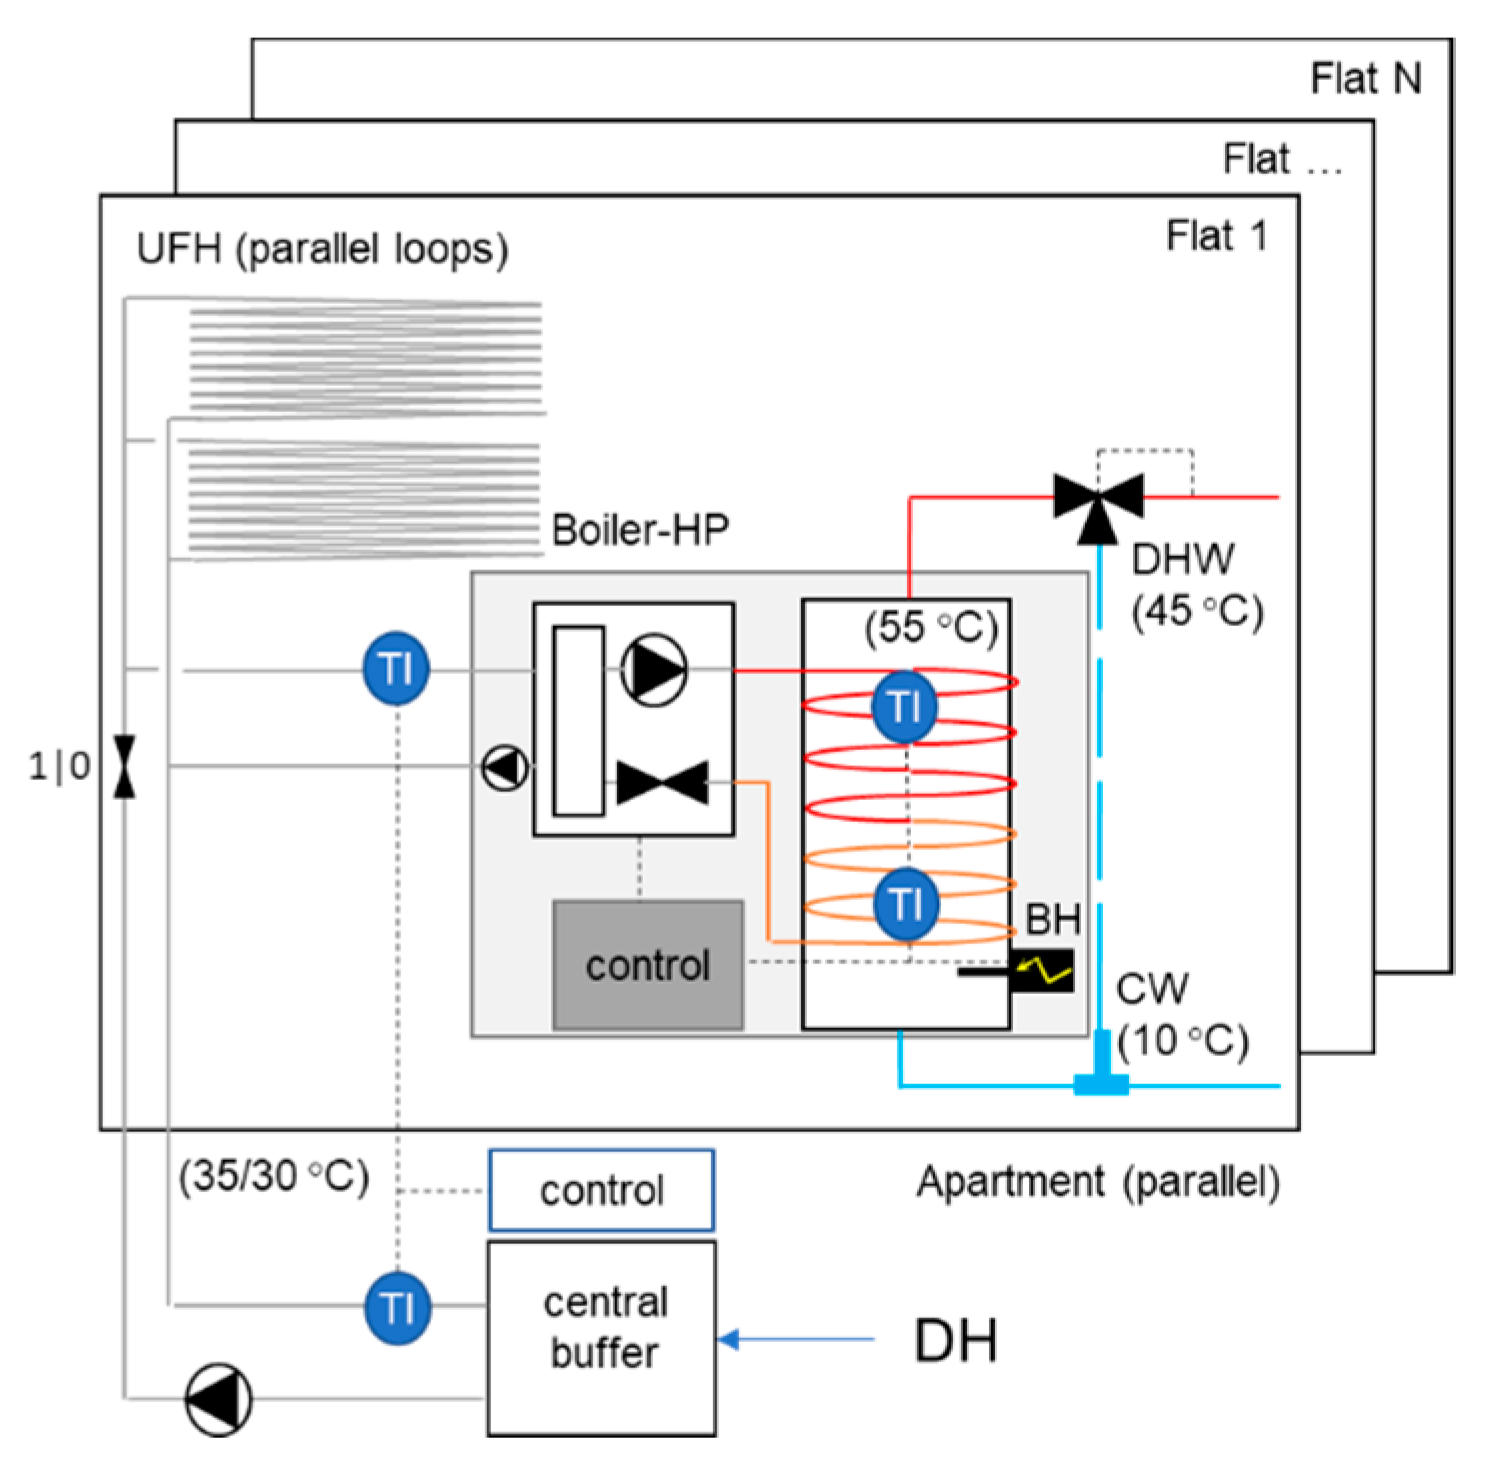
There exist different variants of these so-called decentral booster HPs. A common concept is shown schematically in
Figure 3. The apartments are heated centrally, i.e., here by means of DH. The heat emission system in the apartments is a low-temperature heating system (i.e., underfloor heating). The central heat supply from a buffer store is controlled via the return temperature. There is a decentral booster HP in each of the apartments for preparing domestic hot water. It consists of a small (1.5 kW
thermal) water-to-water HP and a small domestic hot water tank of typically 120 l or 150 l. The HP source (evaporator) is connected in parallel to the branches of the underfloor heating. Typically, there is an additional (1.2 kW) heating rod in case backup heating is required. In summer, the underfloor heating loops are used to extract heat from the conditioned space (i.e., to provide space cooling) and the central source is only activated if the underfloor heating temperature falls below a threshold or if comfort conditions in the conditioned space cannot be met anymore. Thus, in summer, only a negligible amount of heat is extracted from the DH instead.
Another concept is represented by the so-called return flow (RF) HP, where the evaporator of the HP is in a series with the floor heating loops, see [
21], which is not further considered here.
1.5. Sector Coupling—Combined Heat and Power, District Heating and Electricity Mix
Each combination of HP in the DH network (see
Section 1.3) has a different impact on the DH energy load and temperature. Therefore, HP will have an impact on the grid network, DH network and building energy demand creating a strong mutual interaction between these different elements. In his work, Volodona et al. [
22] highlight that the installation of HP in the DH network presents technical challenges related to a lack of experience with this technology and introduce an important element of risk, namely the connection of HP to the electricity network. This implies that the DH-HP-Building system will be dependent on electricity prices.
Integrating HPs in buildings will decrease the energy demand (and load) of the DH system. In addition, with the increasing thermal renovation of the building stock, a future decrease of the energy demand is anticipated [
2]. To compensate for that, and in order to maintain an economic operation, a DH system would need to be expanded.
A higher total efficiency base load is typically covered by combined heat and power plants (CHP). The CHP coefficient σ is typically in a range between 0.6 and 1. In future, it is expected that, increasingly, biomass CHP plants will contribute to heat generation in DH systems [
23]. For the evaluation of CHP, several methods are applied (allocation methods [
24]) and the thermodynamic-based Carnot method [
24] seems to be the most recommended one recently (see also
Section 2.4.3 below).
1.6. Renewables Integration and Mismatch between Source Availability and Demand
HP enables also an increased own-consumption of PV yield [
25], even though it is seen that the benefit of PV is much more important when PV-sharing in renewable energy communities is considered.
The application of renewable sources in buildings will surely increase in the next future, transforming the building from consumer to prosumer [
26]. In addition to buildings, the share of renewables in the electricity grid and DH will also have to increase in order to reach the climate neutrality targets. According to [
27], and depending on the assumed scenario, the share of fossils (coal, oil, gas) in DH will decrease from approximately 50% to 20% in 2030 and further to 30% in 2050 with main contributions from wind, biomass and PV but also nuclear power and imported hydrogen and biofuels. Nevertheless, renewable production is not always matching the load on a daily and seasonal basis. For this reason, electric and thermal storage have to be integrated on both building and network levels.
1.7. Monthly CO2 Evaluation
As depicted in
Section 1.5 in the near future, a strong mutual interaction between the electricity system, DH and load (i.e., buildings or prosumers) can be expected.
A reduction of the energy demand could also influence the DH heat production fuel mix as, e.g., biomass boiler can be operated only if a minimum baseload is needed [
16]. In addition, as is well known, the renewable availability is strongly varying throughout seasons and day/night, influencing the electricity production and price; therefore, the DH in the future has to be equipped with a generation system able to respond to the high variability of the electricity prices and storage capacity able to decouple heat generation and demand [
28].
In such a scenario, it is clear that fossil fuels will predominantly cover the winter load and that this has to be considered in the evaluation of the CO
2 emissions [
29]. This statement is equally true for the electricity grid and DH, yet annual CO
2 conversion factors are still commonly applied. This contributes to a misleading prediction of the CO
2 emission and does not allow a differentiation between energy efficiency measures that contribute to a reduction of fossil fuel consumption (i.e., reduction of the energy demand in winter) and energy efficiency measures that only contribute to increasing the overproduction of renewable energy in summer. In this work, the CO
2 conversion factors suggested by OIB-6:2019 [
30] (see
Table 2) are used as a basis for the calculation of the monthly CO
2 conversion factors.
It is remarkable that the electricity mix in Austria is characterized by a high share of hydropower, which leads to comparatively low CO
2 conversion factors compared to Germany (see
Figure 4).
The DH networks are very dependent on the local resources (see
Section 1.1), and this affects the CO
2 conversion factors (see
Figure 5 for two examples, i.e., Innsbruck and Vienna). CO
2 conversion factors are derived based on the monthly balance in
Figure 2.
Within this work, different scenarios including different shares of renewable and fossil for both DH and electricity networks are analysed, aiming at deriving more general conclusions regarding the integration of HP in DH networks, which significantly depend on the local conditions. In both the electricity and the DH systems, the share of renewables is likely to grow; however, with different speeds and different contributions (e.g., biomass CHP in electricity and DH, HP in DH and PV and wind in electricity). This can be depicted with different combinations of CO2 conversion factors.
1.8. Novelty of This Work
The review reveals that HPs will play a major role in the heating of buildings as well as in a future decarbonized DH system, and that they will contribute in combination with PV systems to decarbonize the building sector. However, a comprehensive investigation is missing on how to optimally integrate HPs in particular in densely populated areas with DH systems. Both central integration (on DH level) and decentral integration on building or on a flat level are possible and discussed. Integration of HPs on a building level will influence both the DH demand and the electricity demand. The DH system is typically very individual and specific to a location, while, for the electricity system, a local consideration makes no sense because of the European wide transmission of electricity.
Based on the energetic and environmental evaluation of two examples of DH systems in Austria (Innsbruck and Vienna), various variants of integrating HPs in DH are evaluated. Different scenarios for the European electricity grid and generic DH systems are developed and monthly CO2-conversion factors are applied for the environmental evaluation. Of particular interest is the integration of decentralized so-called booster HPs, which can be integrated into buildings on a flat level and allow in combination with photovoltaics (PV) for increasing the PV own-consumption.
A generic DH system has been developed based on the analysis of the Austrian DH systems that is used for the evaluation of the efficiency and the environmental impact of the energy supply of a typical multi-story residential building in a heating dominated climate like Austrian with DH and HPs. The novelty of this work lies on the comprehensive comparison on both an energy system and building level considering the mutual dependencies of the future development of DH systems and the European electricity system.
To the best of our knowledge, it is the first time that it is investigated how the integration of decentral HPs will influence the feasibility to operate a DH system. Thus, both the perspectives of the building and the DH are considered.
1.9. Organization of the Paper
First, in the Method sections, the reference building (a typical Austrian MFH) used for the analysis of the DH system in this work is briefly described (
Section 2.1). This reference building is applied, in
Section 2.2, as a basis for the calculation of the heat load curve of all the buildings, connected to a generic DH network in a heating-dominated climate. From this analysis, the heat load curve of the average building included in this generic DH network is defined, and it is used for the calculation of the thermal and electric balance considering different HP solutions (see
Section 2.3).
A special focus is reserved for the flat-wise booster HPs to analyse their capabilities to increase the PV own-consumption. Based on the concept of the booster HP (see
Section 1.4), a dynamic model of the booster HP is described in
Section 2.3.1, and the description of the PV system is reported in
Section 2.3.2.
Based on the dynamic simulation results, the thermal and electric balance considering different HP solutions in buildings and the district heating is determined (
Section 2.3.3). The DH level (
Section 2.3.4) and the energy system level (
Section 2.3.5) are evaluated depending on the number of buildings with HP on an annual energy balance basis.
The calculation of the CO
2 emission for each solution is done considering different scenarios (DH mixes) and is explained in
Section 2.4 and additionally considers two variants of DH, with and without CHP. The allocation method of CO
2 emissions of CHP plants is given in
Section 2.4.3.
The Results section is divided into four main parts: in
Section 3.1, the results of the dynamic simulation of the booster HP are reported, showing the possibilities and limits to increase the own-consumption under different boundary conditions (flat-level). In
Section 3.1, the results of the different possibilities for HP integration from a building perspective are discussed followed by the effects of HP integration in the DH network in
Section 3.3 (DH perspective). Finally, the energy system perspective is given in
Section 3.4.
2. Methods
2.1. Reference Building
Figure 6 shows a sketch of the reference building and summarizes its characteristics. This building is a real case study, built-in Passive House quality in Innsbruck [
5], and it is used as a basis to model the energy demand of a generic building connected to a generic DH system.
The quality of the envelope (U-value) and ventilation system (i.e., either exhaust air or MVHR) are varied. Based on Passive House Planning Package (PHPP ([
33]) calculations, heating demands and heat load curves representing the building with different ages and qualities (see
Figure 6 and
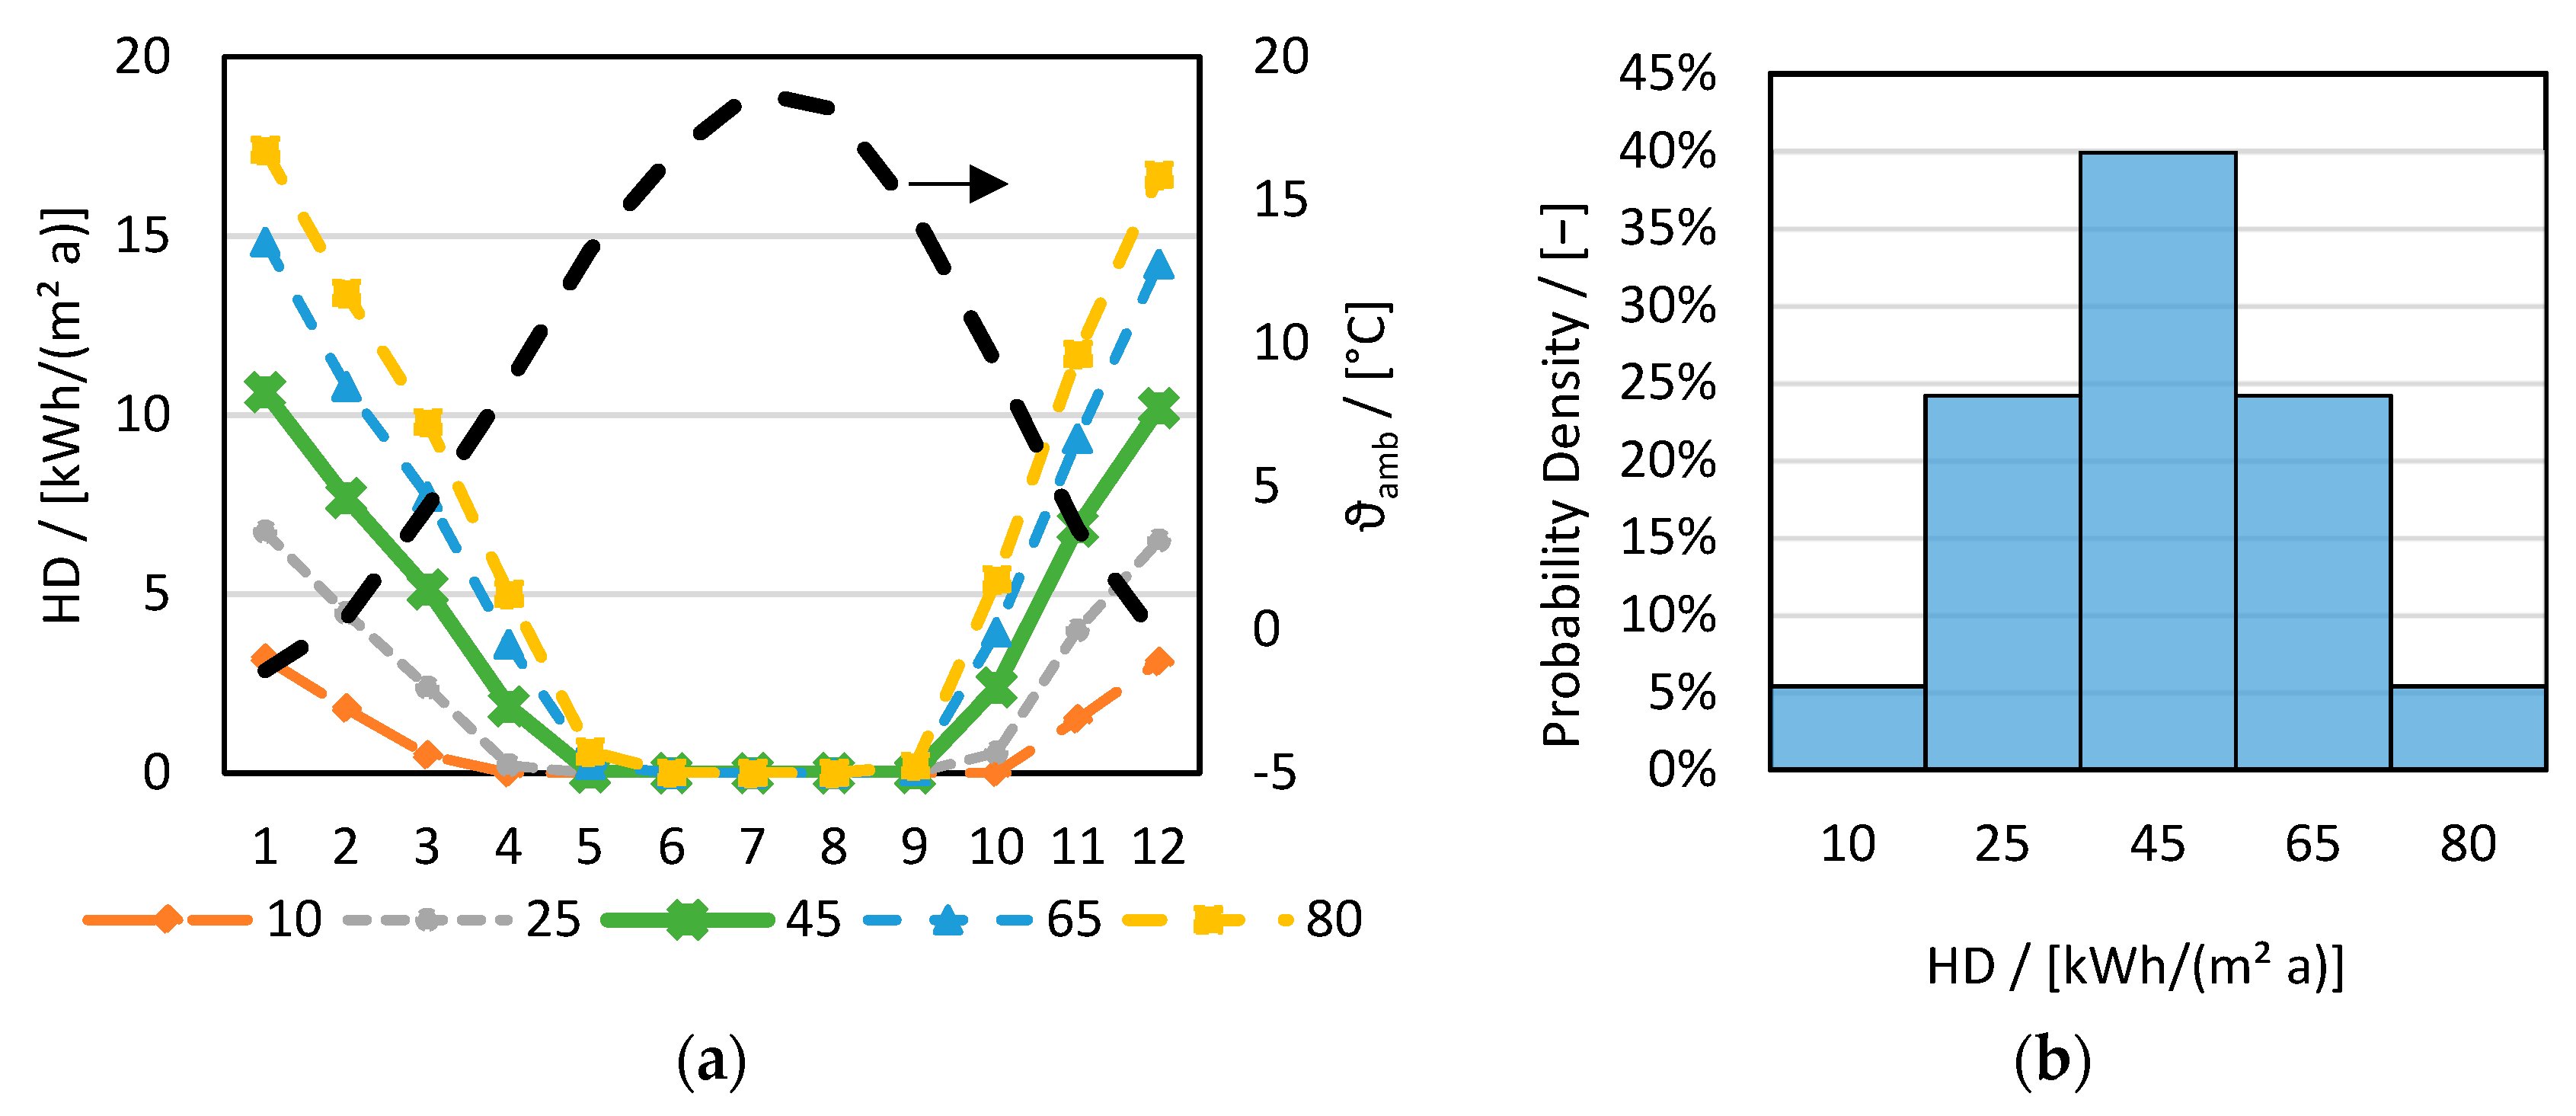
Table 3) are derived. The resulting heat load curves are reported in
Section 2.2 in
Figure 7a.
In all the variations of the building (envelope) quality, standard profiles are used for hot water consumption based on [
34] resulting in DHW demand of 20 kWh/(m
2 a) and 25 kWh/(m
2 a) including storage and distribution losses (within the building), respectively. Furthermore, standard profiles are used for household electricity (e.g., appliances, lighting, etc.) [
35] resulting in 25 kWh/(m
2 a).
2.2. District Heating System
A (future) generic DH system is assumed consisting of 100 buildings with a Gaussian distribution of SH demands (with the probability density as shown in
Figure 7b. Hence, the average building has a space HD of 45 kWh/(m
2 a) (see solid green line
Figure 7a).
The DH system’s thermal losses are assumed to be 10% with respect to the useful energy, i.e., 7 kWh/(m2 a), which is rather optimistic. Thus, the DH system can be represented with an average building with an SH demand of 45 kWh/(m2 a) and DHW of 25 kWh/(m2 a) leading to a total heat demand of 70 kWh/(m2 a) (site energy) and 77 kWh/(m2 a) of heat generation.
For the purpose of further investigation, a simplified generic DH system is developed which consists of different relative shares of biomass and gas heating: 30–70, 40–60, 50–50. The overall efficiency of the biomass and gas heater is included in the CO
2 conversion factors, see
Section 2.4.
As the availability of biomass is generally limited and in particular for heating applications, the maximum amount of biomass is kept constant in all DH variants. Hence, the following results (
Section 3.1) apply under the assumption of a limited availability of biomass of (exemplarily 32 kWh/(m
2 a) for the DH scenario 40–60), i.e., in the reference, DH system biomass contributes to approximately 40% and gas contributes to approximately 60%. Fossil gas heating (or CHP, see
Section 2.4.3) is then partly replaced by integrating decentral HPs or central HPs central or with different capacities (see
Section 2.3) and the relative share of biomass in the DH system is increasing.
As biomass is the only available directly storable renewable source, it is of high value and will not be used for heating purposes only but increasingly for electricity generation. In this case of combined heat and power (CHP), the distribution of CO
2 emissions to the electric and the heating part should be calculated using the Carnot Method. CHP has an important contribution in many DH systems (see
Section 2.4.3).
The different variants of the DH system are calculated by means of monthly energy balances with different options of HP integration, see
Section 2.3. The modelling approach for the HP is described in
Section 2.3.3.
Four perspectives are considered:
Perspective 1 is the building perspective in the DH system. The CO2 emissions are calculated supposing that all buildings in the DH system are supplied with the same system.
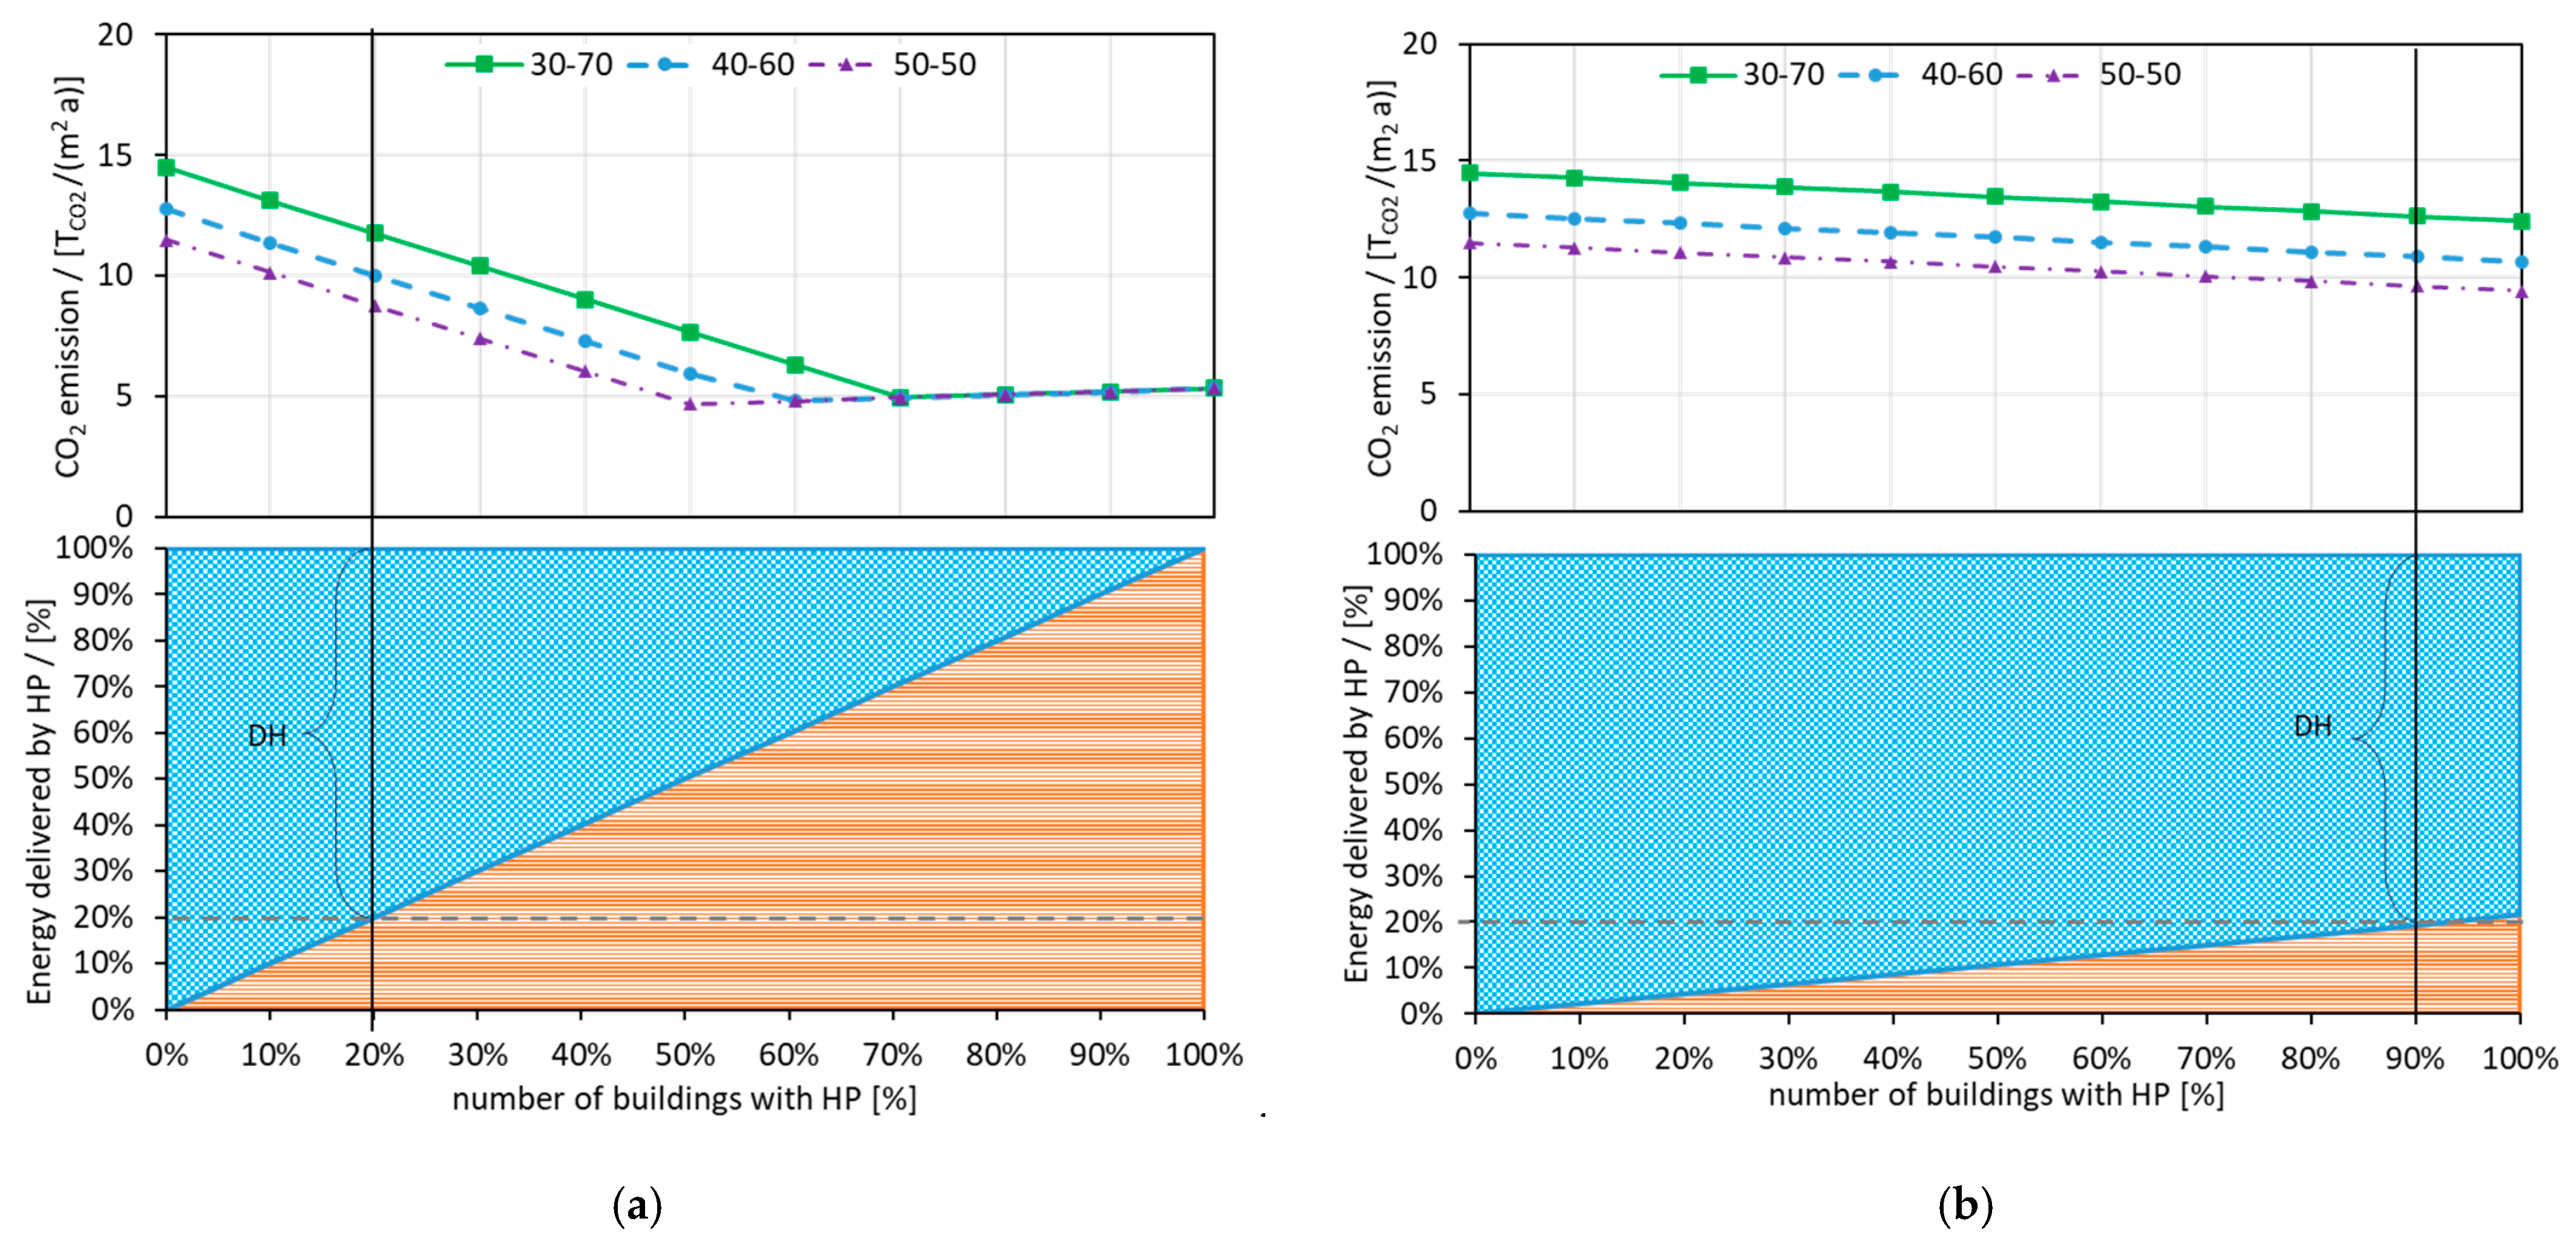
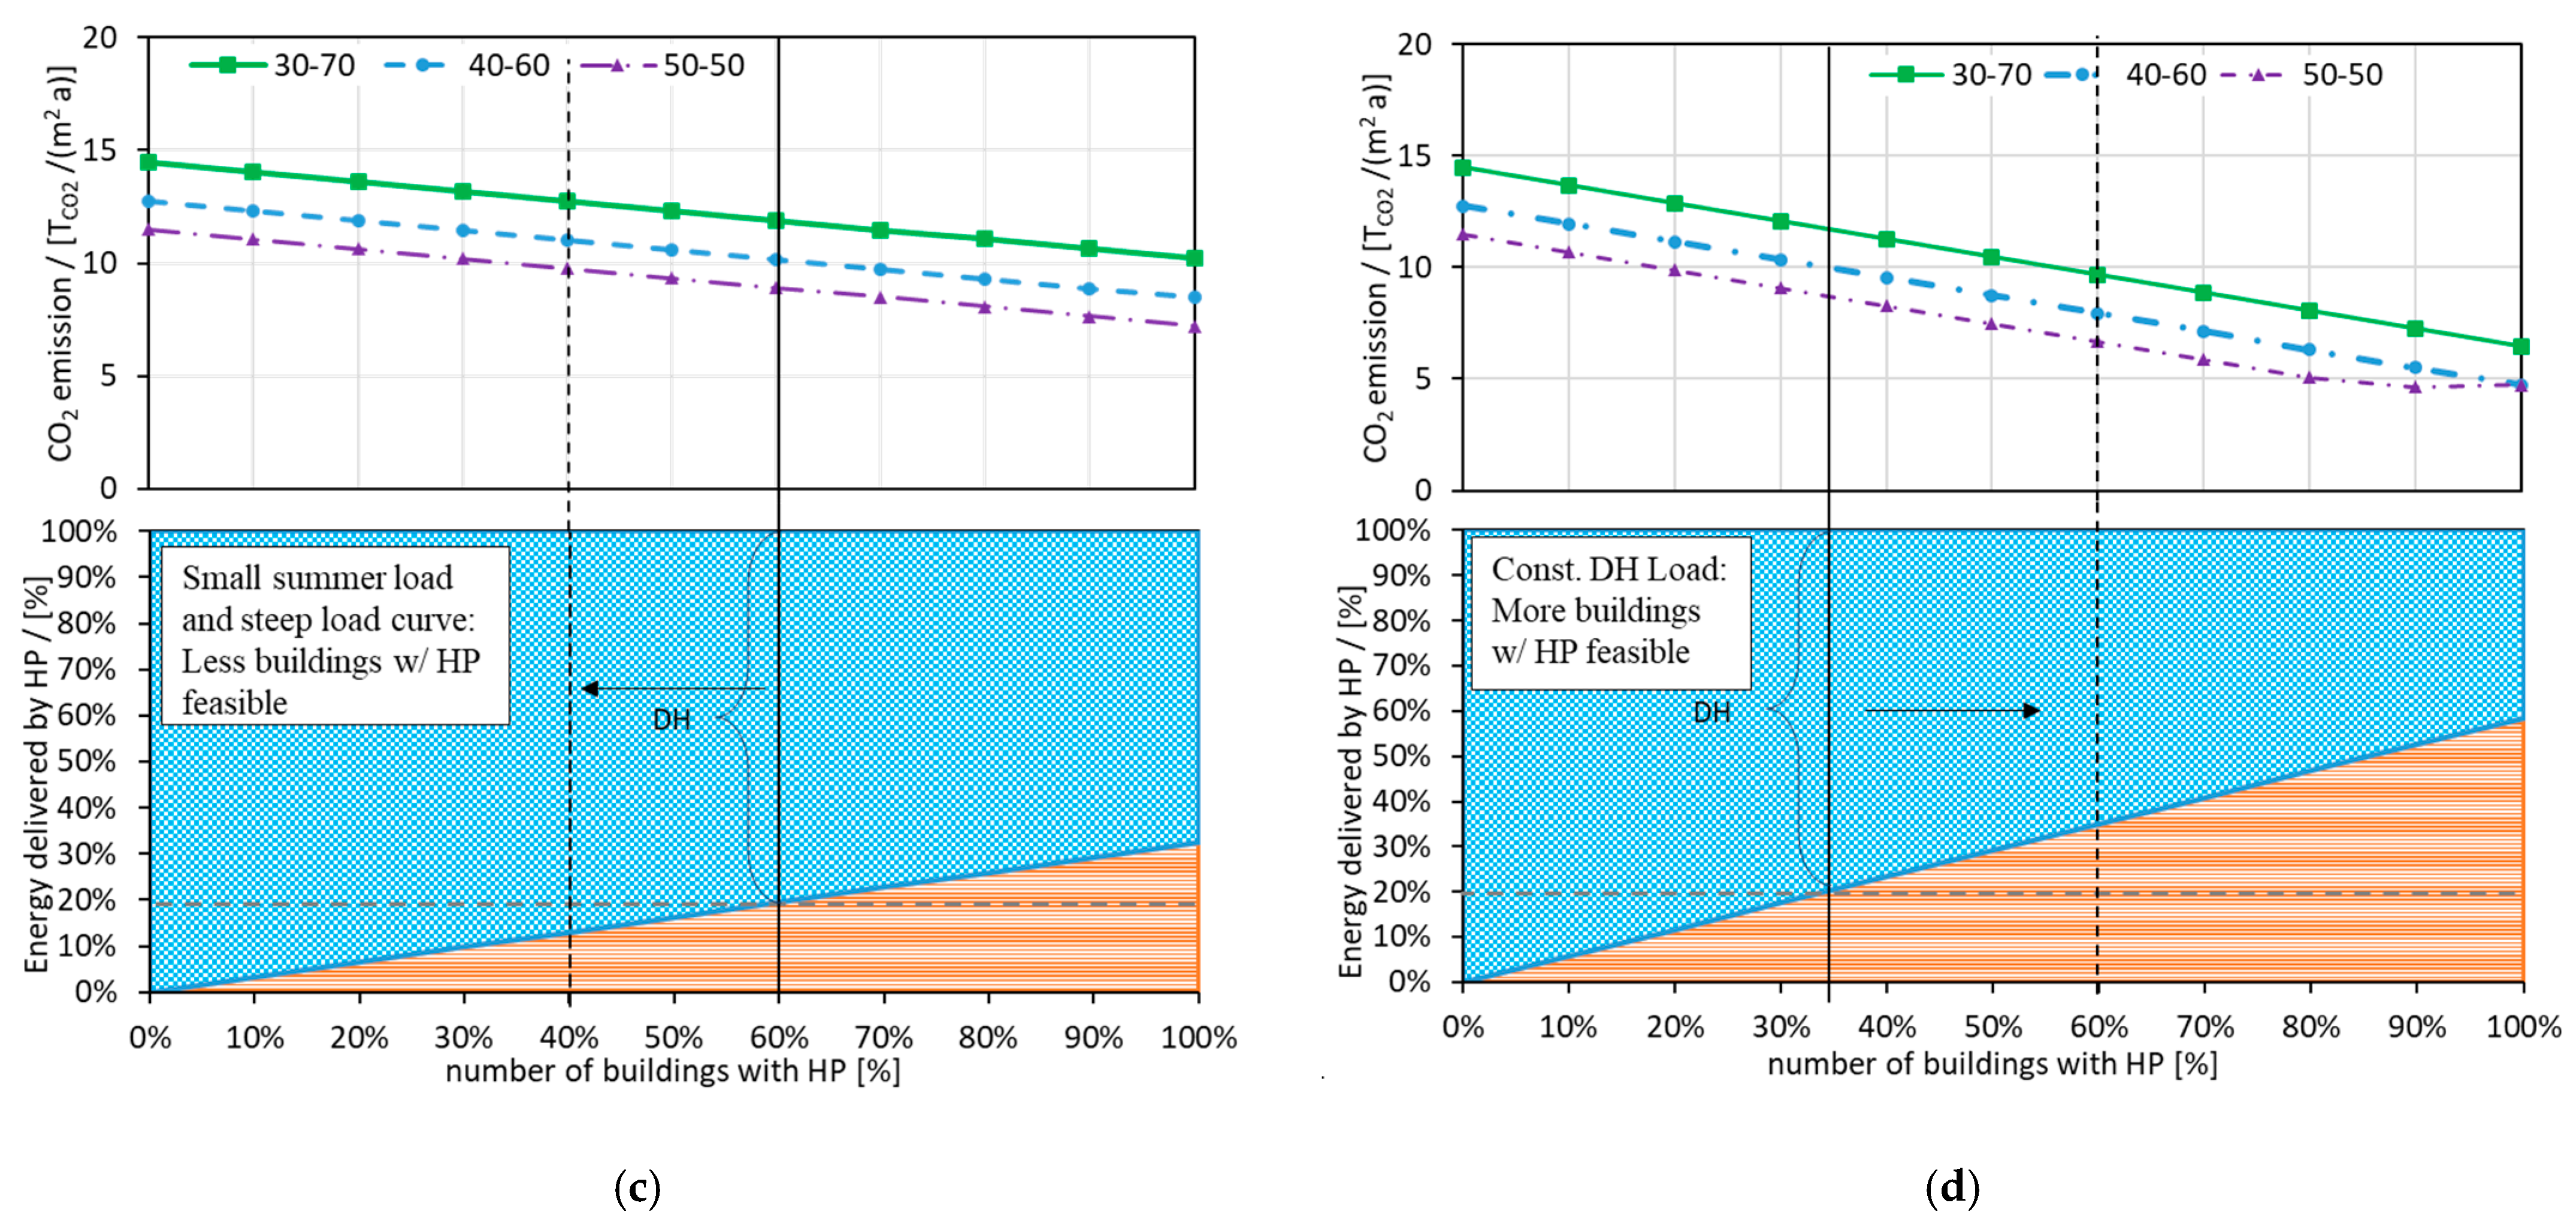
Perspective 2 is the perspective of the DH system. Every decentral HP in a building (or flat) reduces the energy demand of the DH system and, as such, the economic feasibility of the entire system. On the other hand, if a number of buildings is equipped with an HP, it allows—given a constant absolute contribution of biomass—for increasing the share of biomass in the other buildings reducing the CO2 emissions of the DH system.
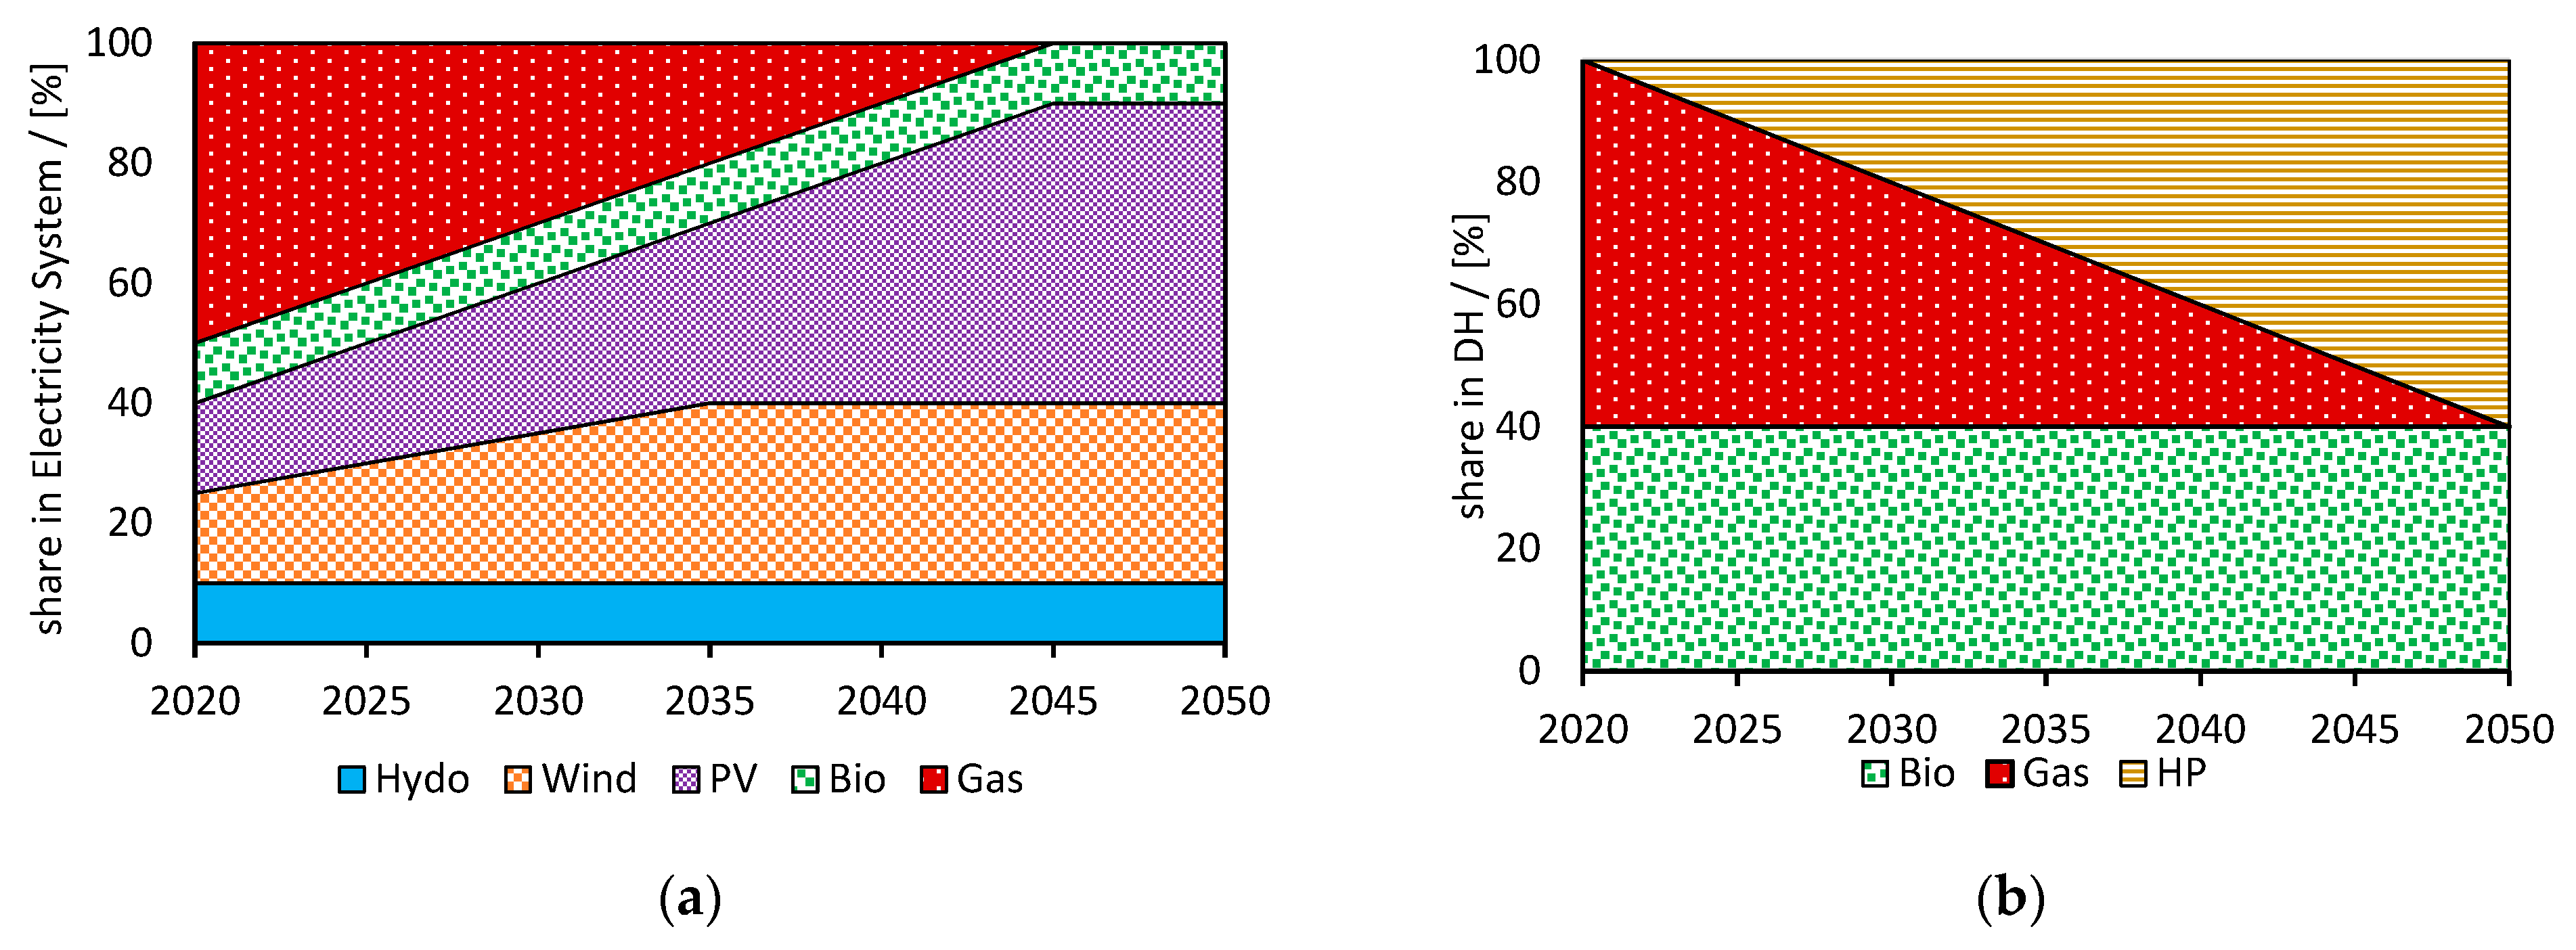
The third perspective is the future one. Both the electricity and the DH system are subject to decarbonisation. A more detailed consideration is given to the flat-wise booster-HP.
Perspective 4 focuses on the PV own-consumption.
2.3. Modelling Heat Pumps Integrated in District Heating
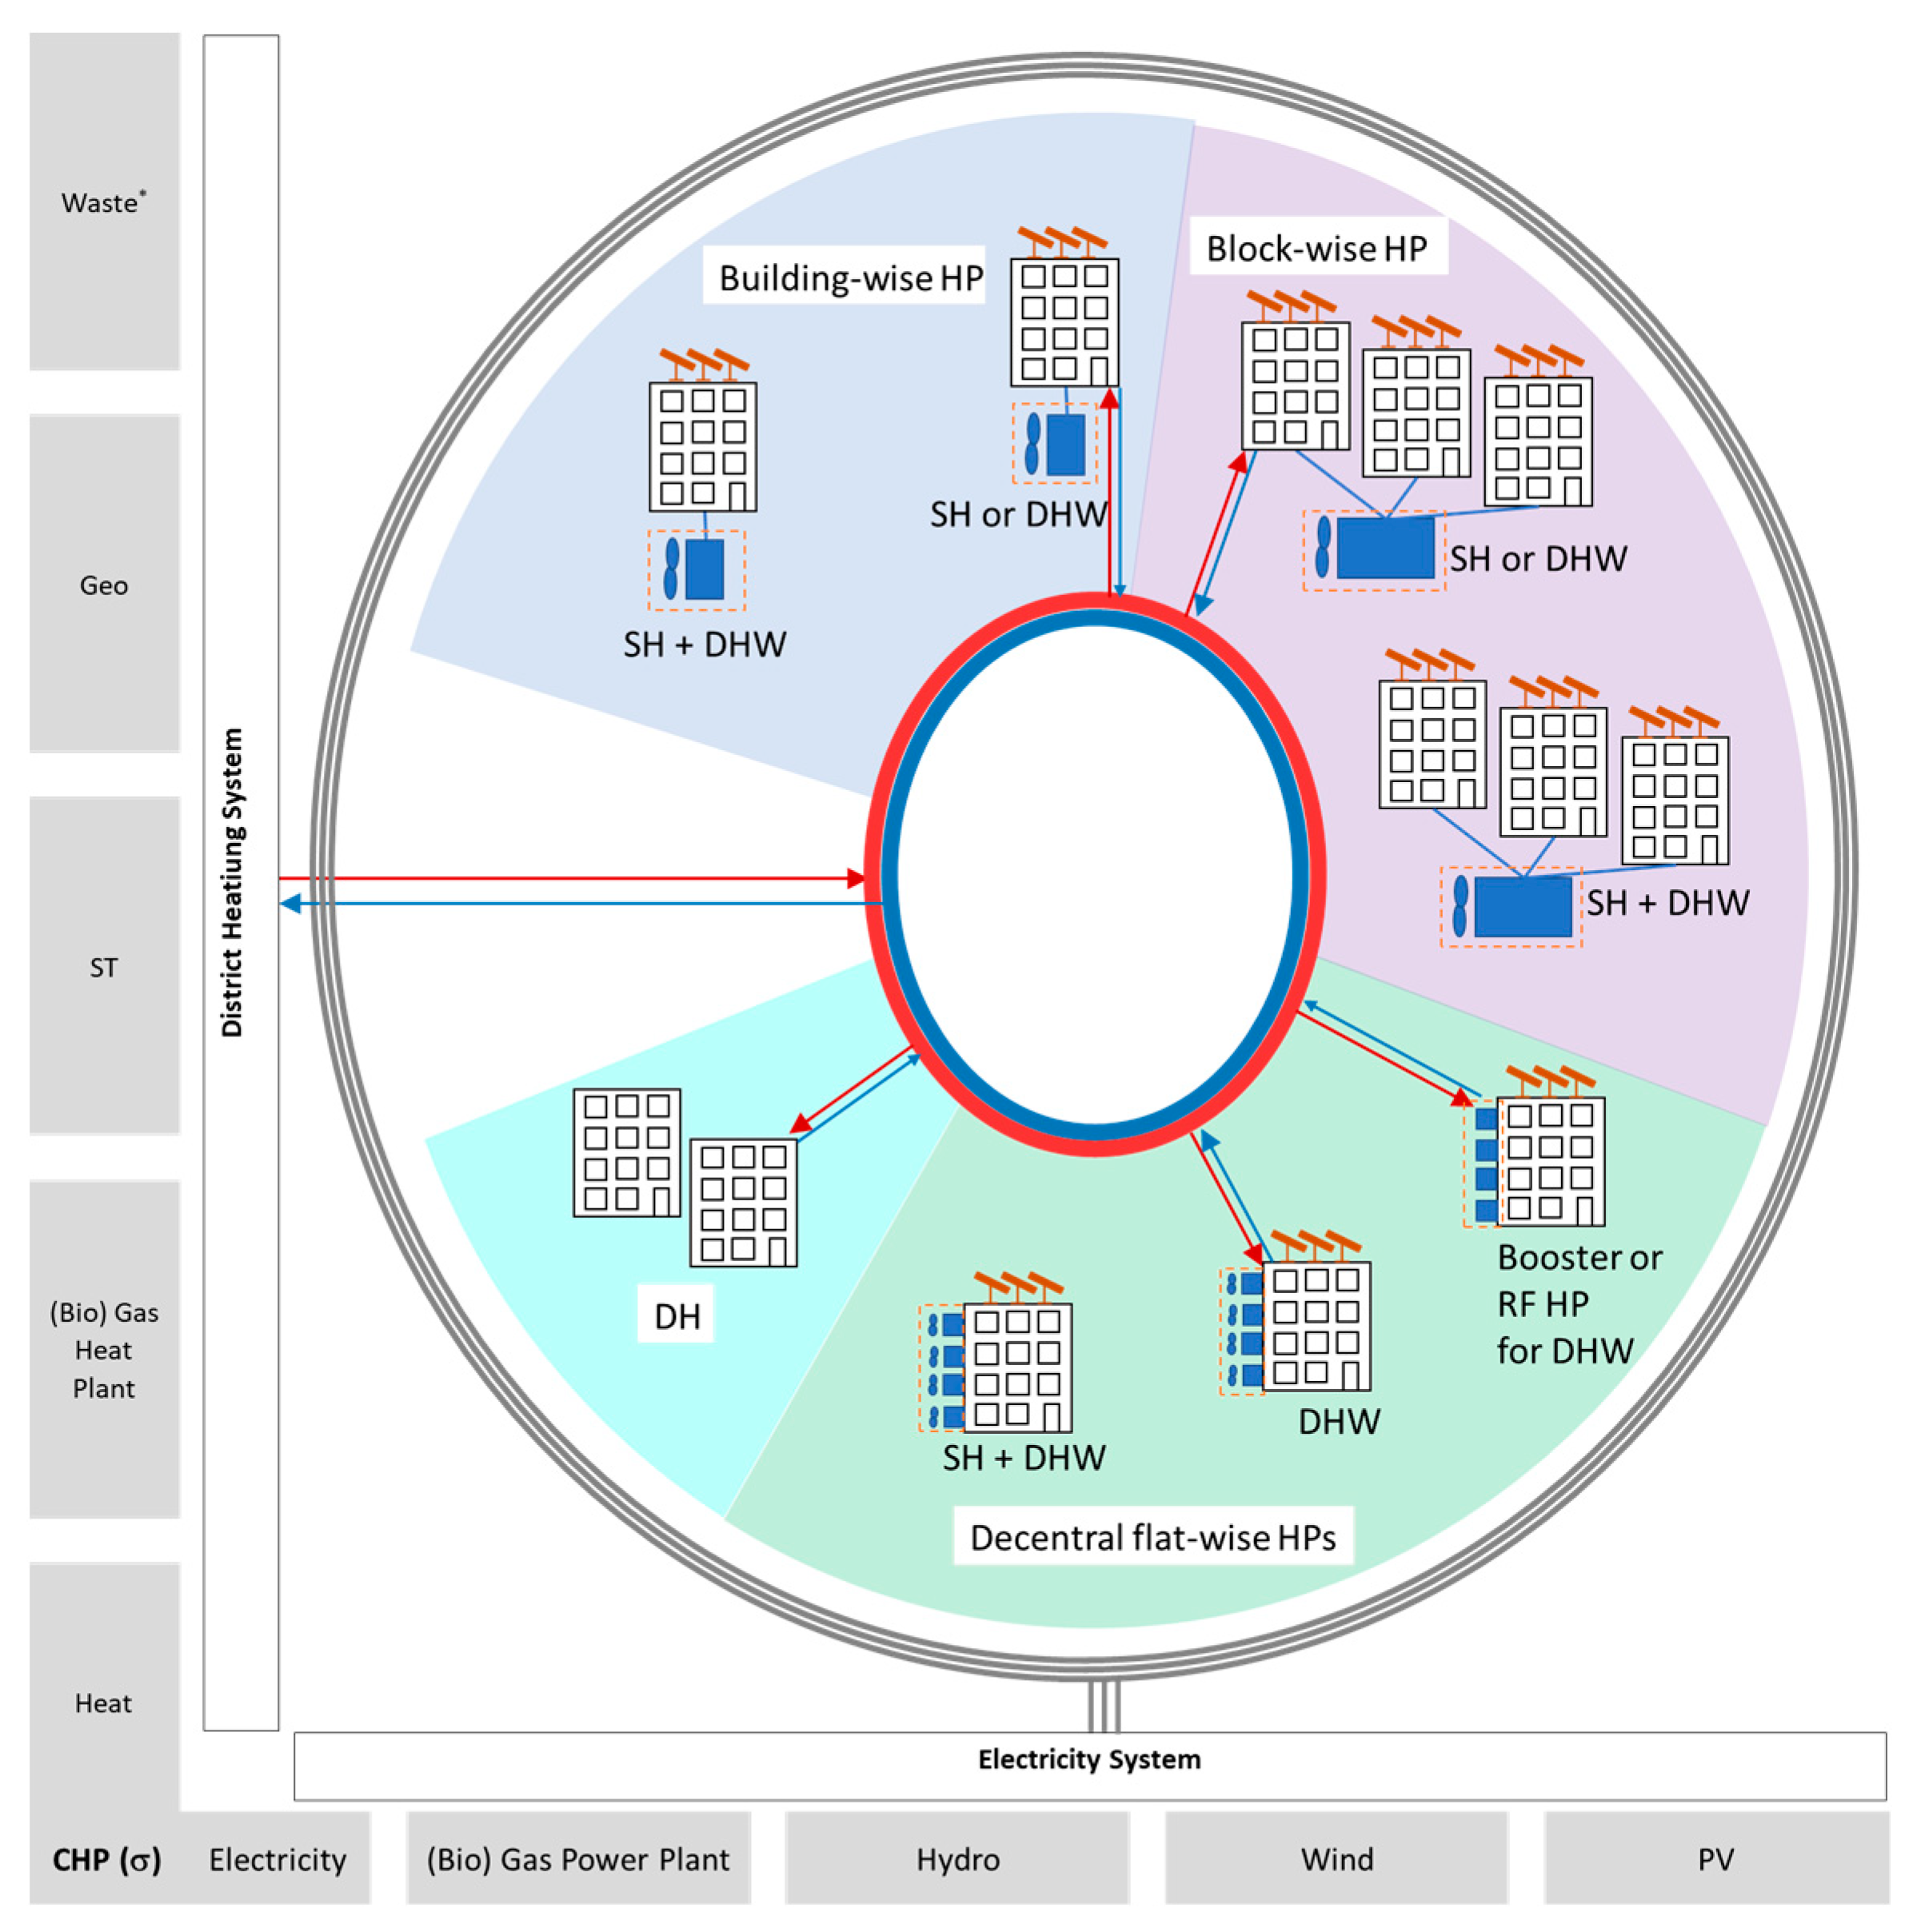
The following variants (see
Table 4) are compared on a building level and DH system level in terms of heat and electricity demand and CO
2 emissions considering the mutual interdependencies, as sketched in
Figure 8:
This picture (
Figure 8) is obviously simplified but shows the mutual dependencies of integrating HPs in DH. Furthermore, it has to be noted that nuclear energy is excluded in this investigation as not existent in Austria and being subject to phase-out in Germany and other European countries. Furthermore, electric vehicles are excluded; however, they can represent a significant further electric load.
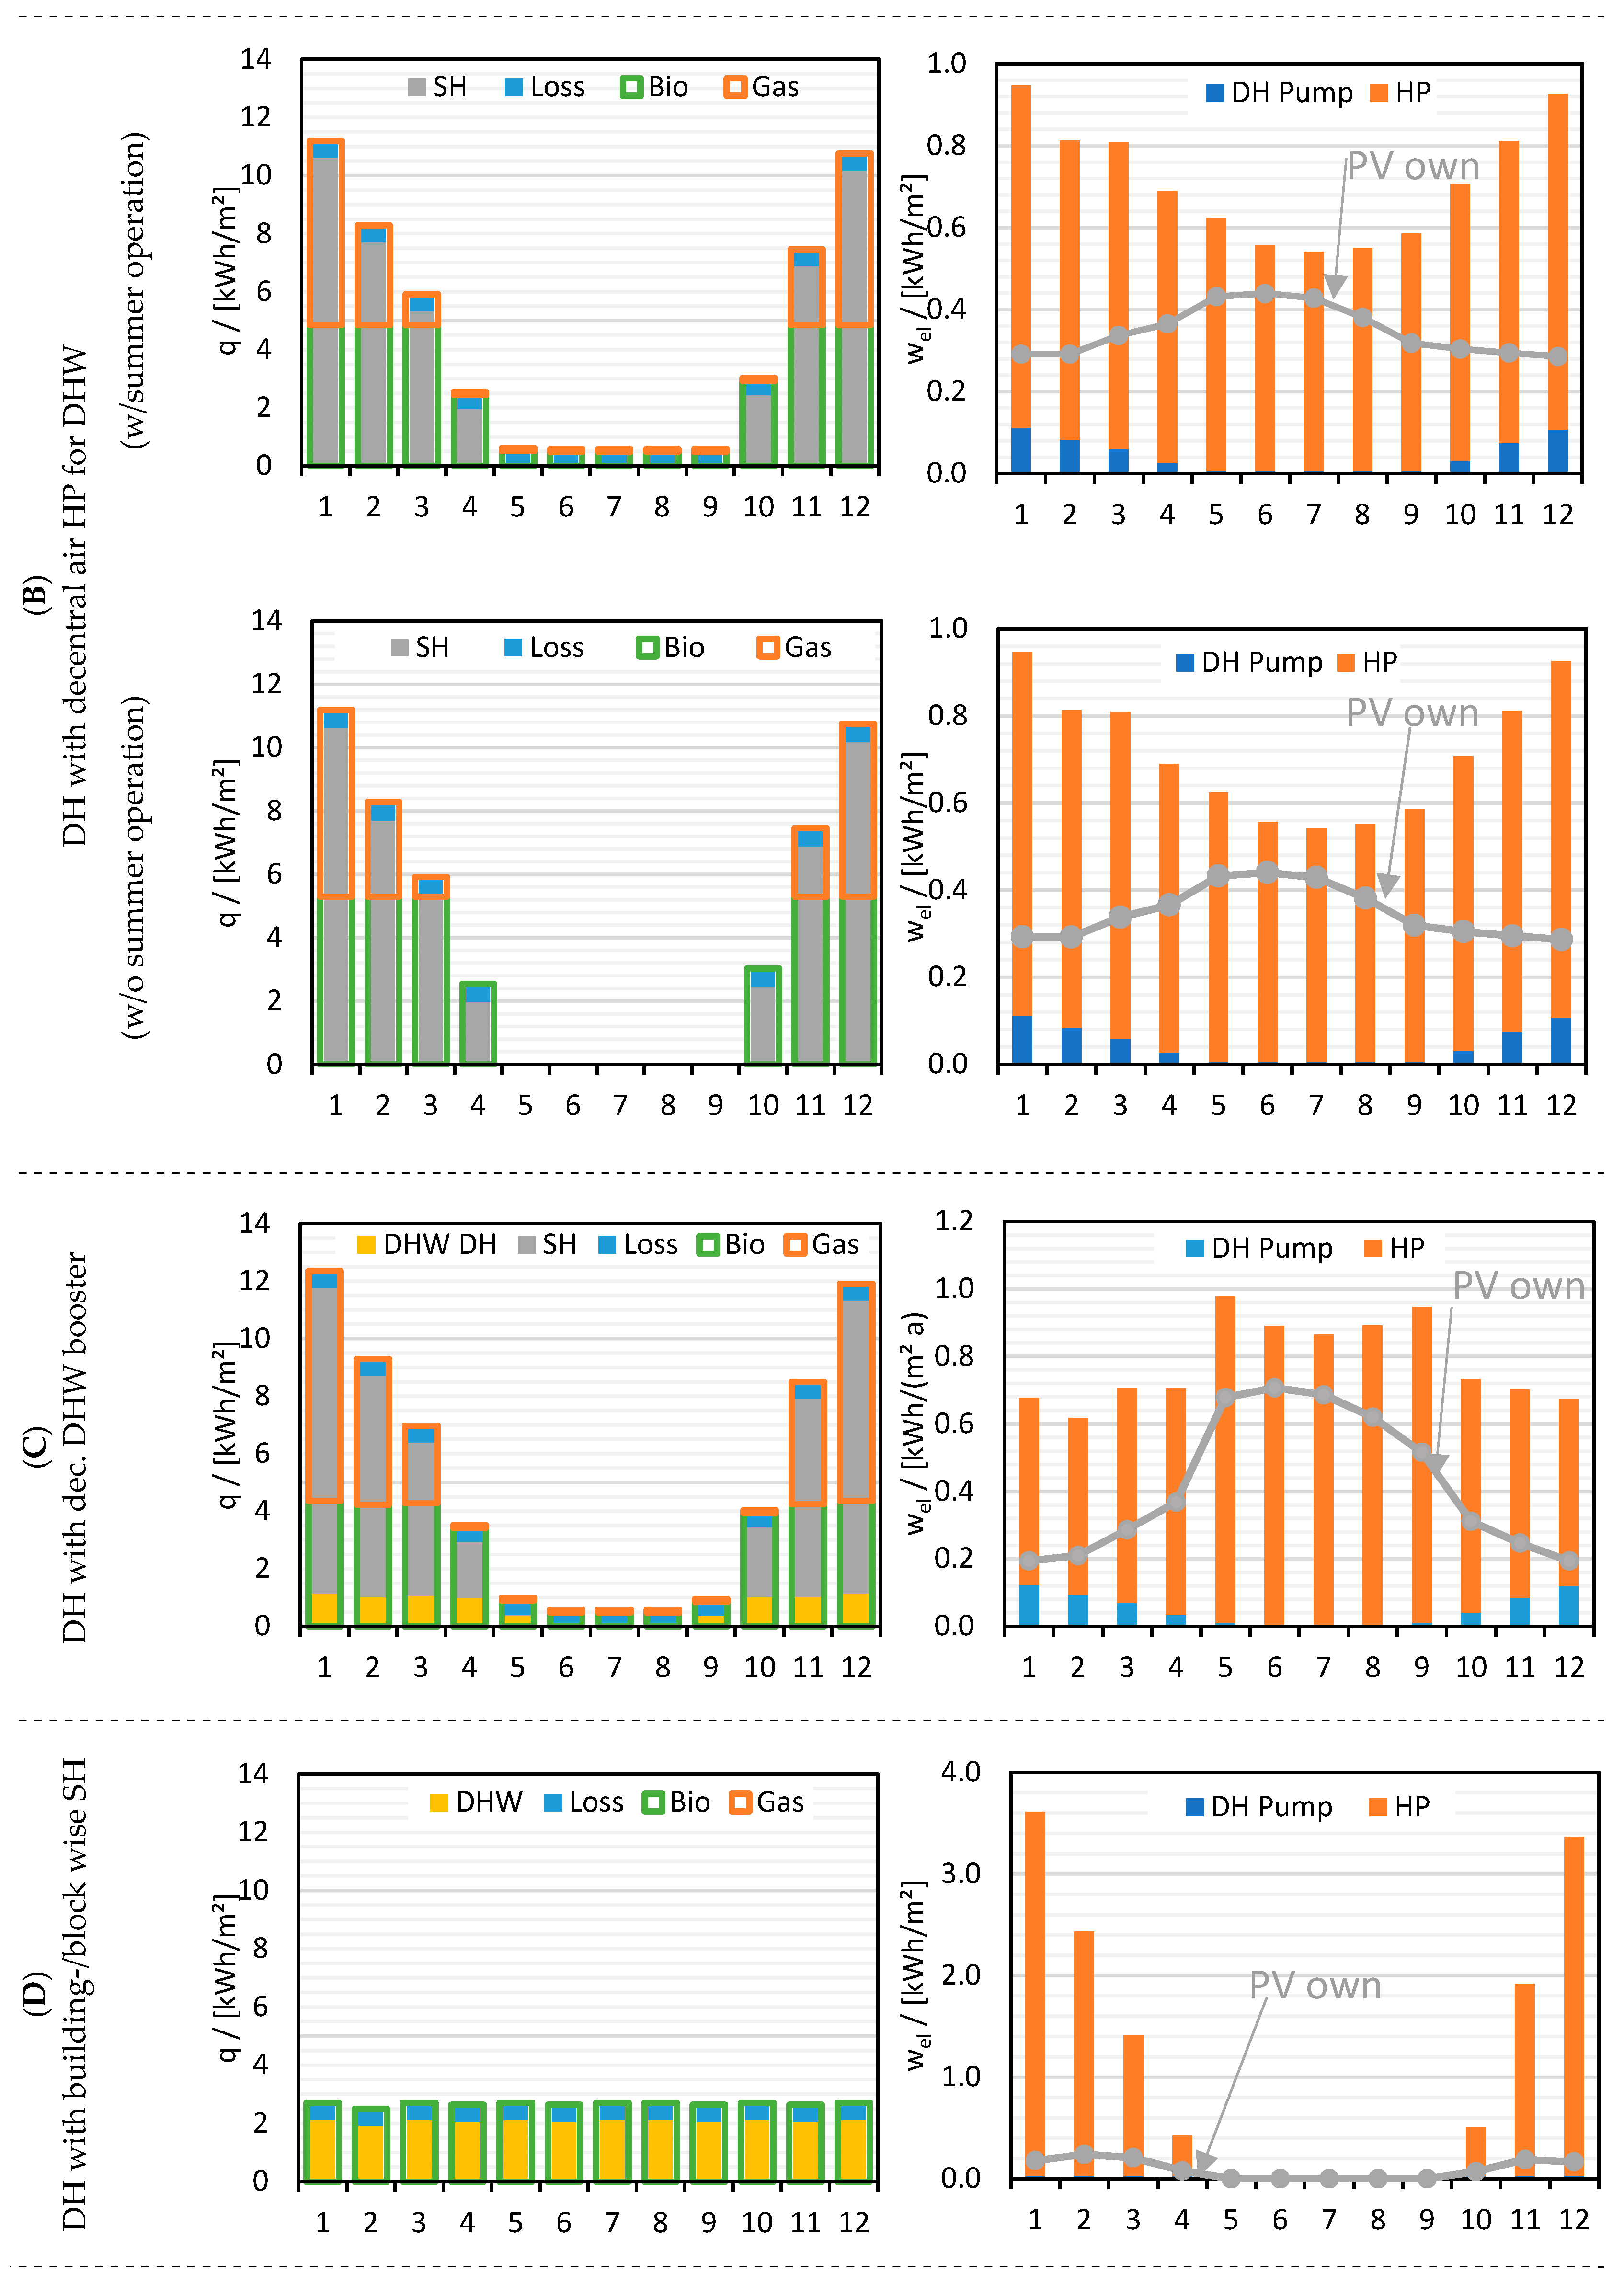
Variant A represents the reference case, namely the operation without HP, the variants B and C represent decentral solutions integrating flat-wise HP for the preparation of the DHW. These two variants are evaluated for the whole building also considering the influence of the PV own-consumption. It is noteworthy to mention that, for variant B, until at least one building of the DH network does not have a decentral HP for the DHW operation, the DH has to be operated also during the summertime with the related thermal losses. In contrast, if all the buildings of the DH are equipped with a decentral HP for the DHW operation, the DH network could be not operated in summer reducing the transmission losses of the network.
For the building/block-wise HP, the variants D and F are analysed (i.e., in variant D the HP is supplying the energy for the SH while the DHW is covered with the DH, and, in the variant F, the HP is providing the energy for both DHW and SH purposes; therefore, the building is not connected to the DH). For variant F the impact of the PV own-consumption is additionally analysed.
The variant E is considering a central high-temperature HP supplying energy to the DH. In this case, different variations are considered including different HP capacities (i.e., different energy shares supplied by the HP in the DH network).
Different model components are used and described in the following sections:
Flat level model with a detailed simulation of the booster HP (see
Section 2.3.1);
Building level model with a comparison of the different integration options (see
Section 2.3.3);
DH level with the perspective of the DH system depending on the number of buildings equipped with an HP (see
Section 2.3.4);
The energy system level looking into the future development of the electricity and DH system (see
Section 2.3.5);
For the environmental impact, the CO
2 emissions of all variants are evaluated on a monthly basis (see
Section 2.4). In the case of DH two cases being compared, with and without CHP based on the Carnot Method (see
Section 2.4.3).
2.3.1. Simulation Model of the Booster HP
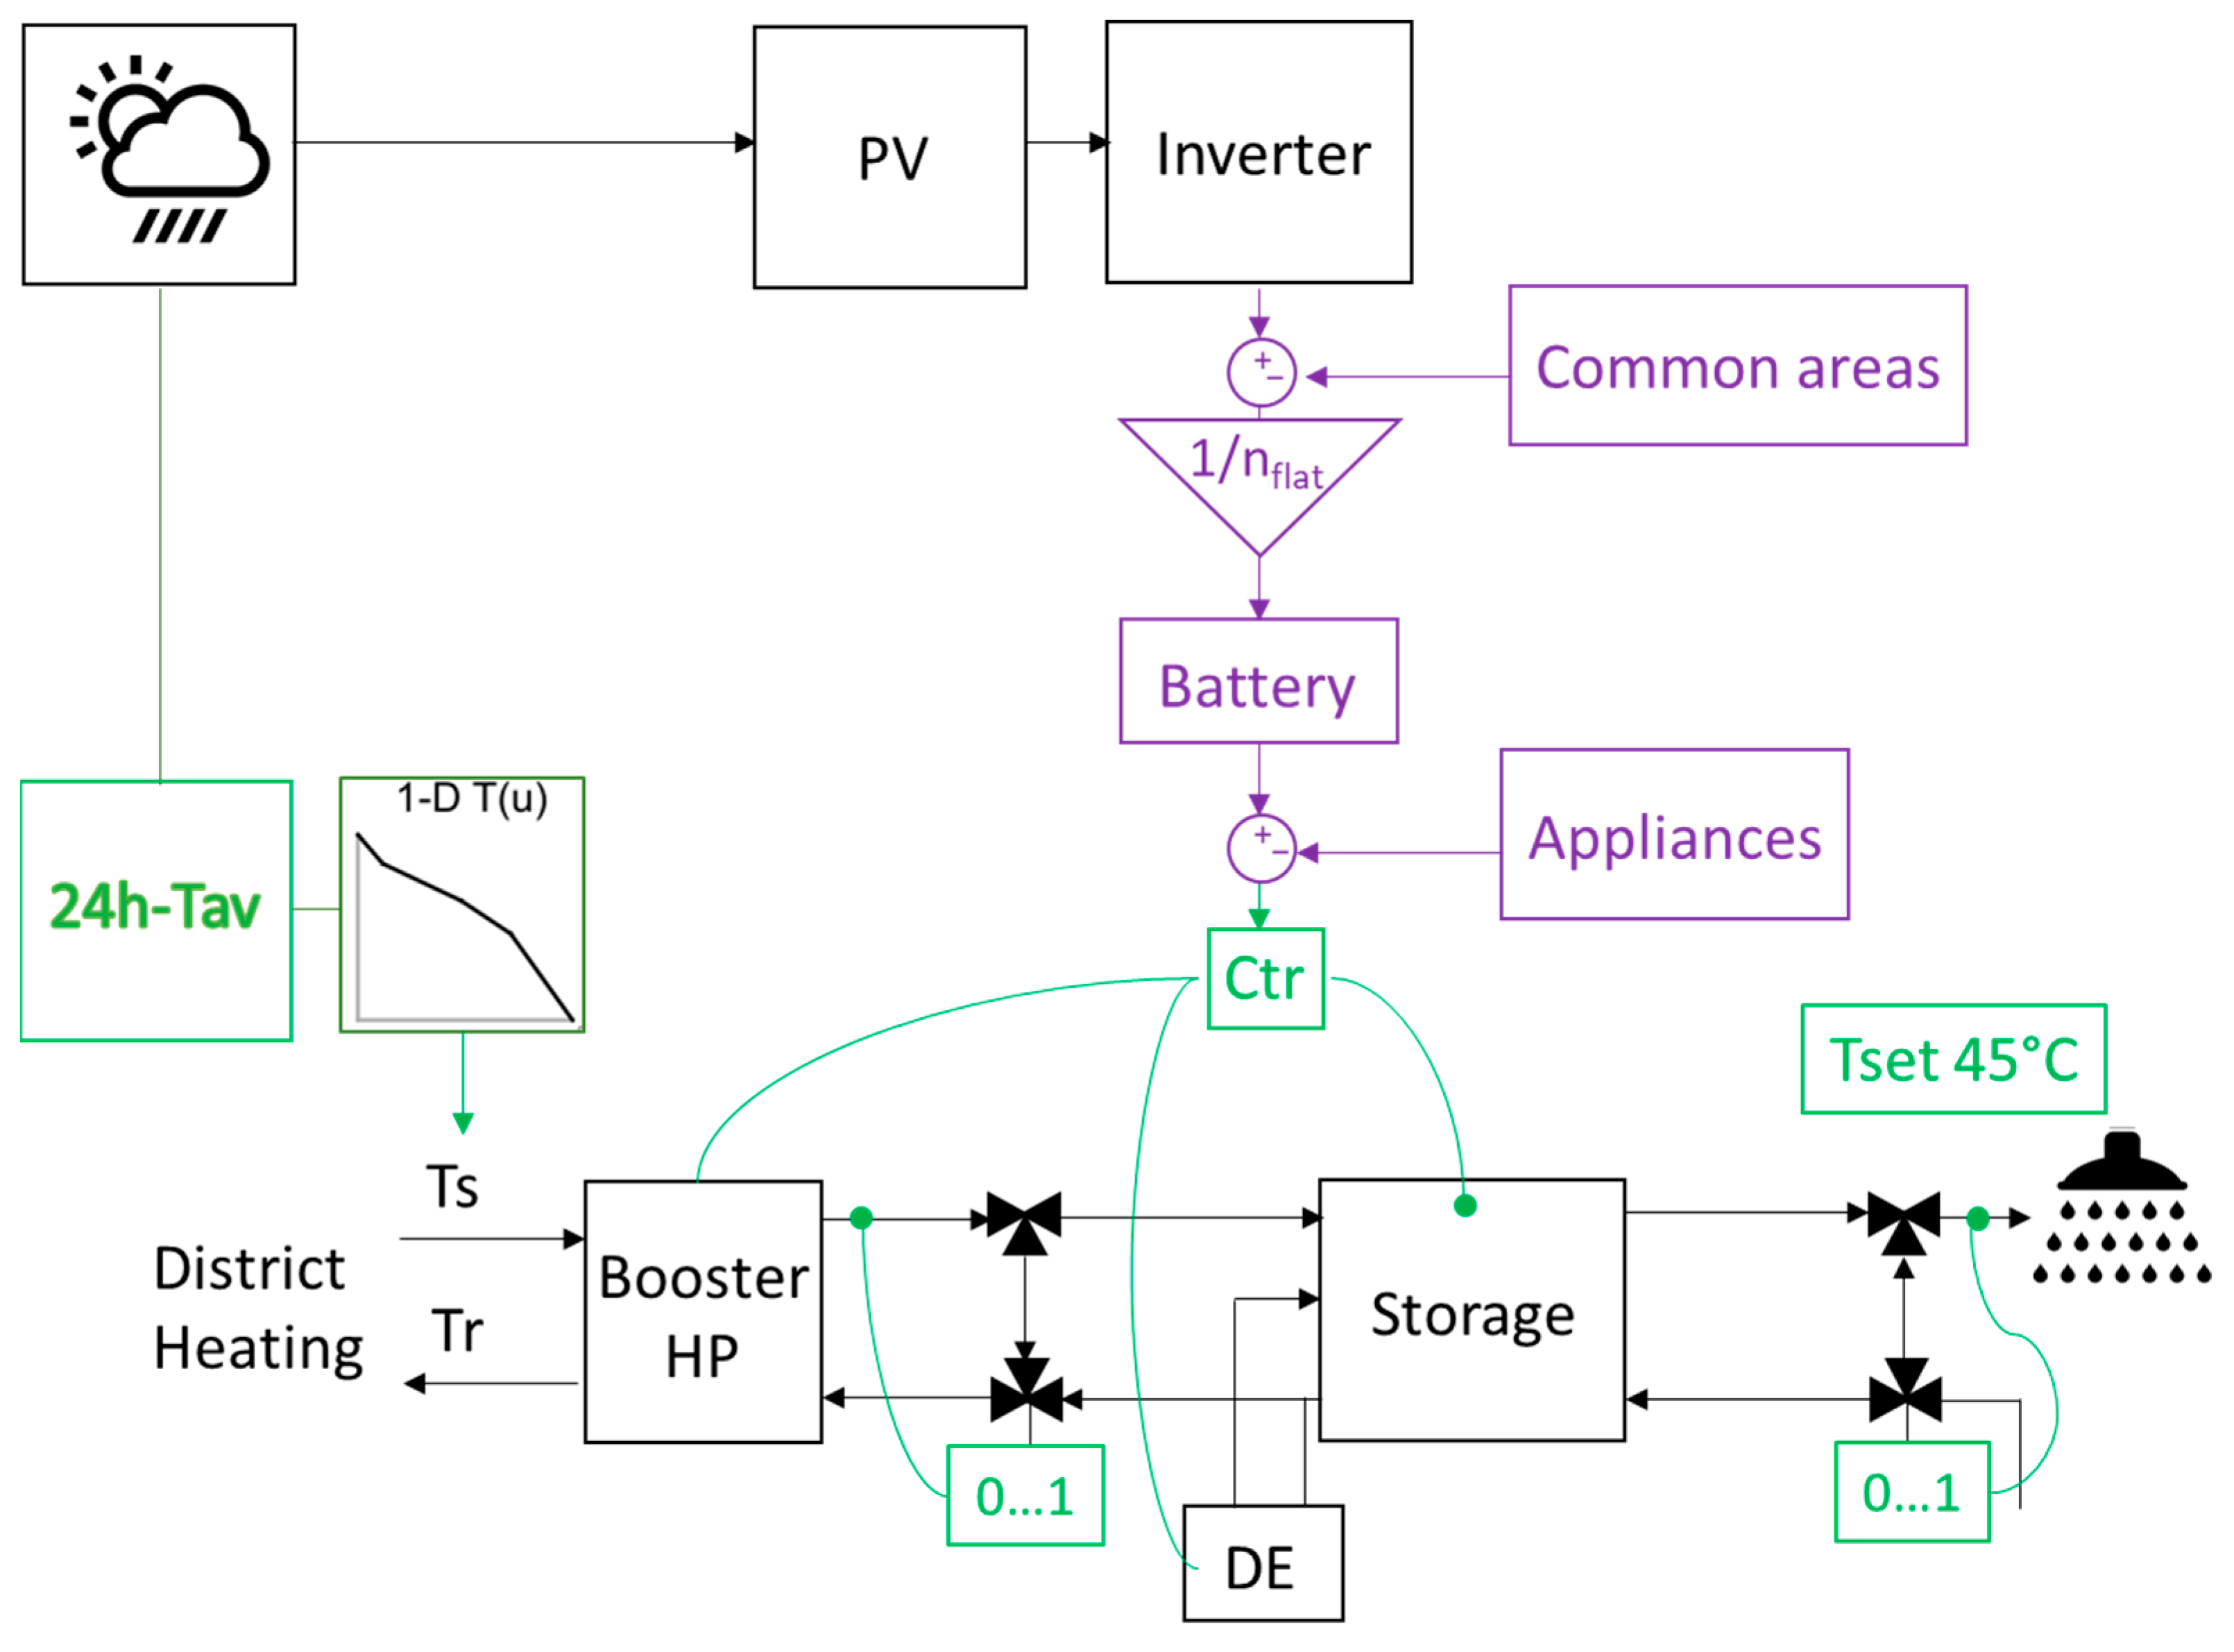
A detailed dynamic model of a booster HP providing DHW for each flat of the reference multifamily house is developed in Matlab/Simulink, and a simplified scheme of the model is reported in
Figure 9. This model is used to make a detailed analysis of the capabilities of a booster HP for what concerns the PV own-consumption.
The booster HP located in each flat uses as a source the energy from the DH. It is considered that the energy from DH is used to heat a central storage based on a set point temperature, which is a function of the ambient temperature (i.e., from 34 °C until 22 °C when the ambient temperature is −10 °C and 19 °C respectively) as the hot water from the DH is also used for the heating system of the flat. From the central storage, the warm water is supplied to the booster HPs.
The performance maps of the booster HP used in the model are reported in
Figure 10 (i.e., a: thermal power provided by the HP on the secondary side; b: Coefficient of Performances; c: electric power required by the HP considering different temperatures for the source and supply sides).
The supply temperature of the HP to the decentral storage is controlled with the three-way valve to avoid a deterioration of the stratification (see
Figure 9) and the control is based on the temperature of the highest node of the thermal storage, which has 150 L, and it is modelled considering 10 thermal nodes. Two different storage energy classes (i.e., ErP A with a heat transfer coefficient of 0.9 W/K and ErP B with an HTC of 1.2 W/K) are considered.
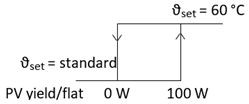
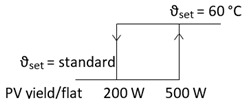
Three different variants are considered regarding control of the set point of the storage to increase the own-consumption while electricity from the PV is available (see
Table 5). The first strategy is applying the standard profile (i.e., T
set = 53 °C from 02:00:00 to 09:00:00 and from 15:00:00 to 22:00:00 otherwise T
set = 49 °C) independently of the PV yield, the second one is increasing the set point of the store to 60 °C when the PV yield per flat reaches 100 W and the third one only when the PV yield reaches 500 W.
The supply temperature on the user side is set at 45 °C, and it is controlled by means of the three-way valve after the storage (see
Figure 9). The mass flow of the tapping is controlled based on the energy (i.e., if the temperature does not reach the set point, the tapping will last longer until the set energy is reached). Three different DHW tapping profiles are considered all with tapping energy of 5.9 kWh/day but with different distributions of the tapping (see
Figure A1 in the
Appendix A). The profile “DHW1” foresee one shower in the morning and one in the evening, “DHW2” has two showers in the morning and “DHW3” has two showers in the evening.
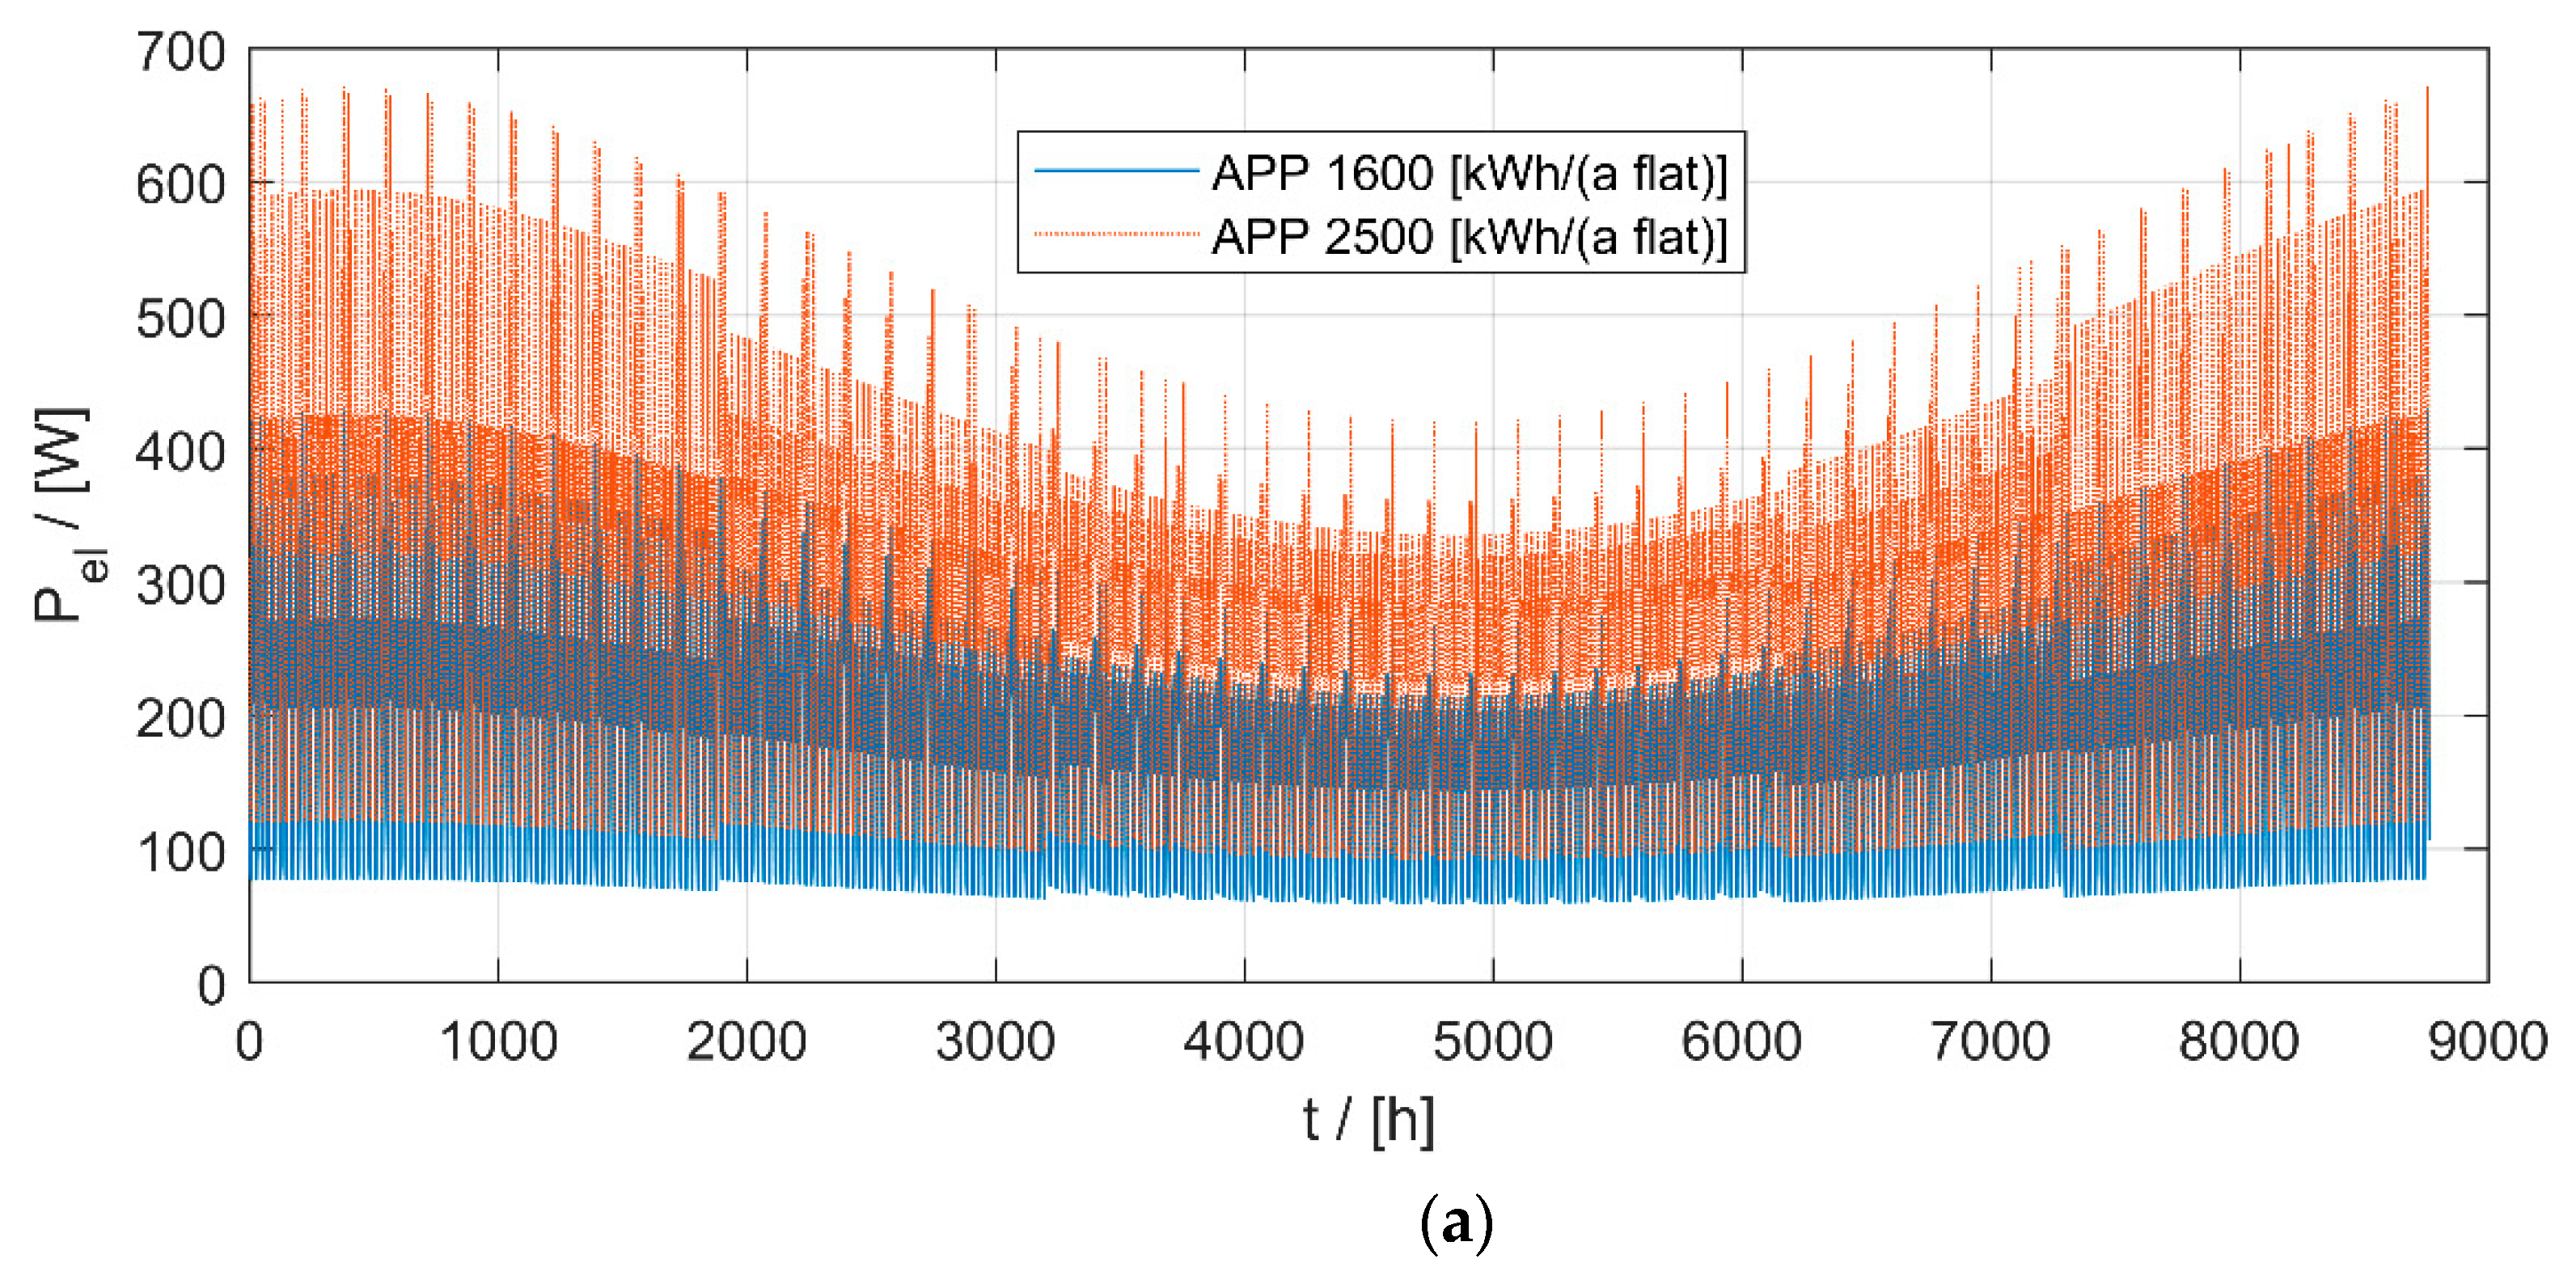
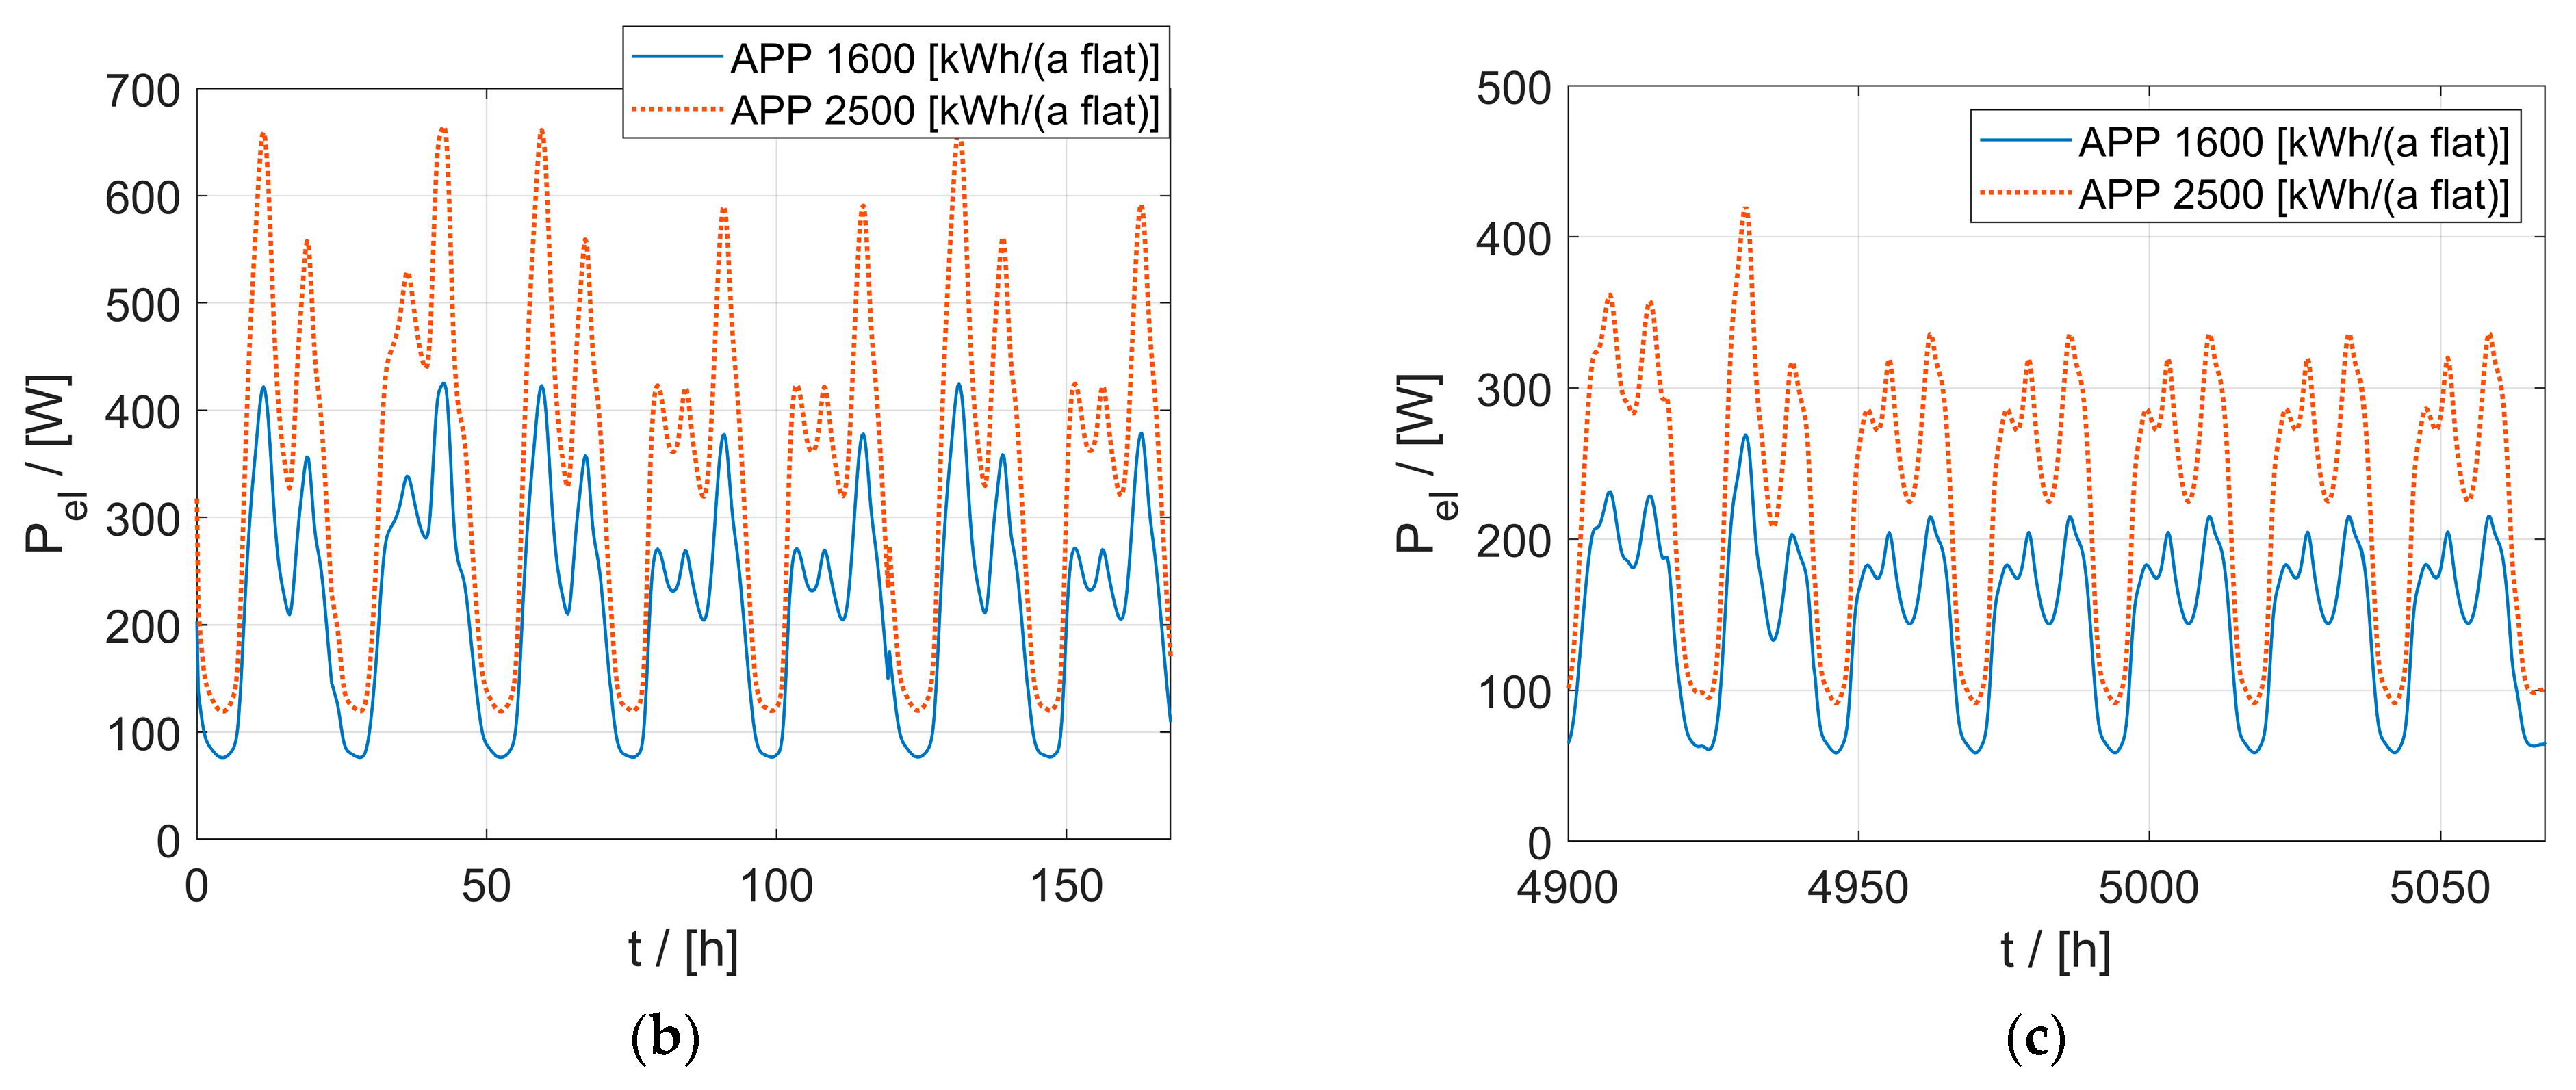
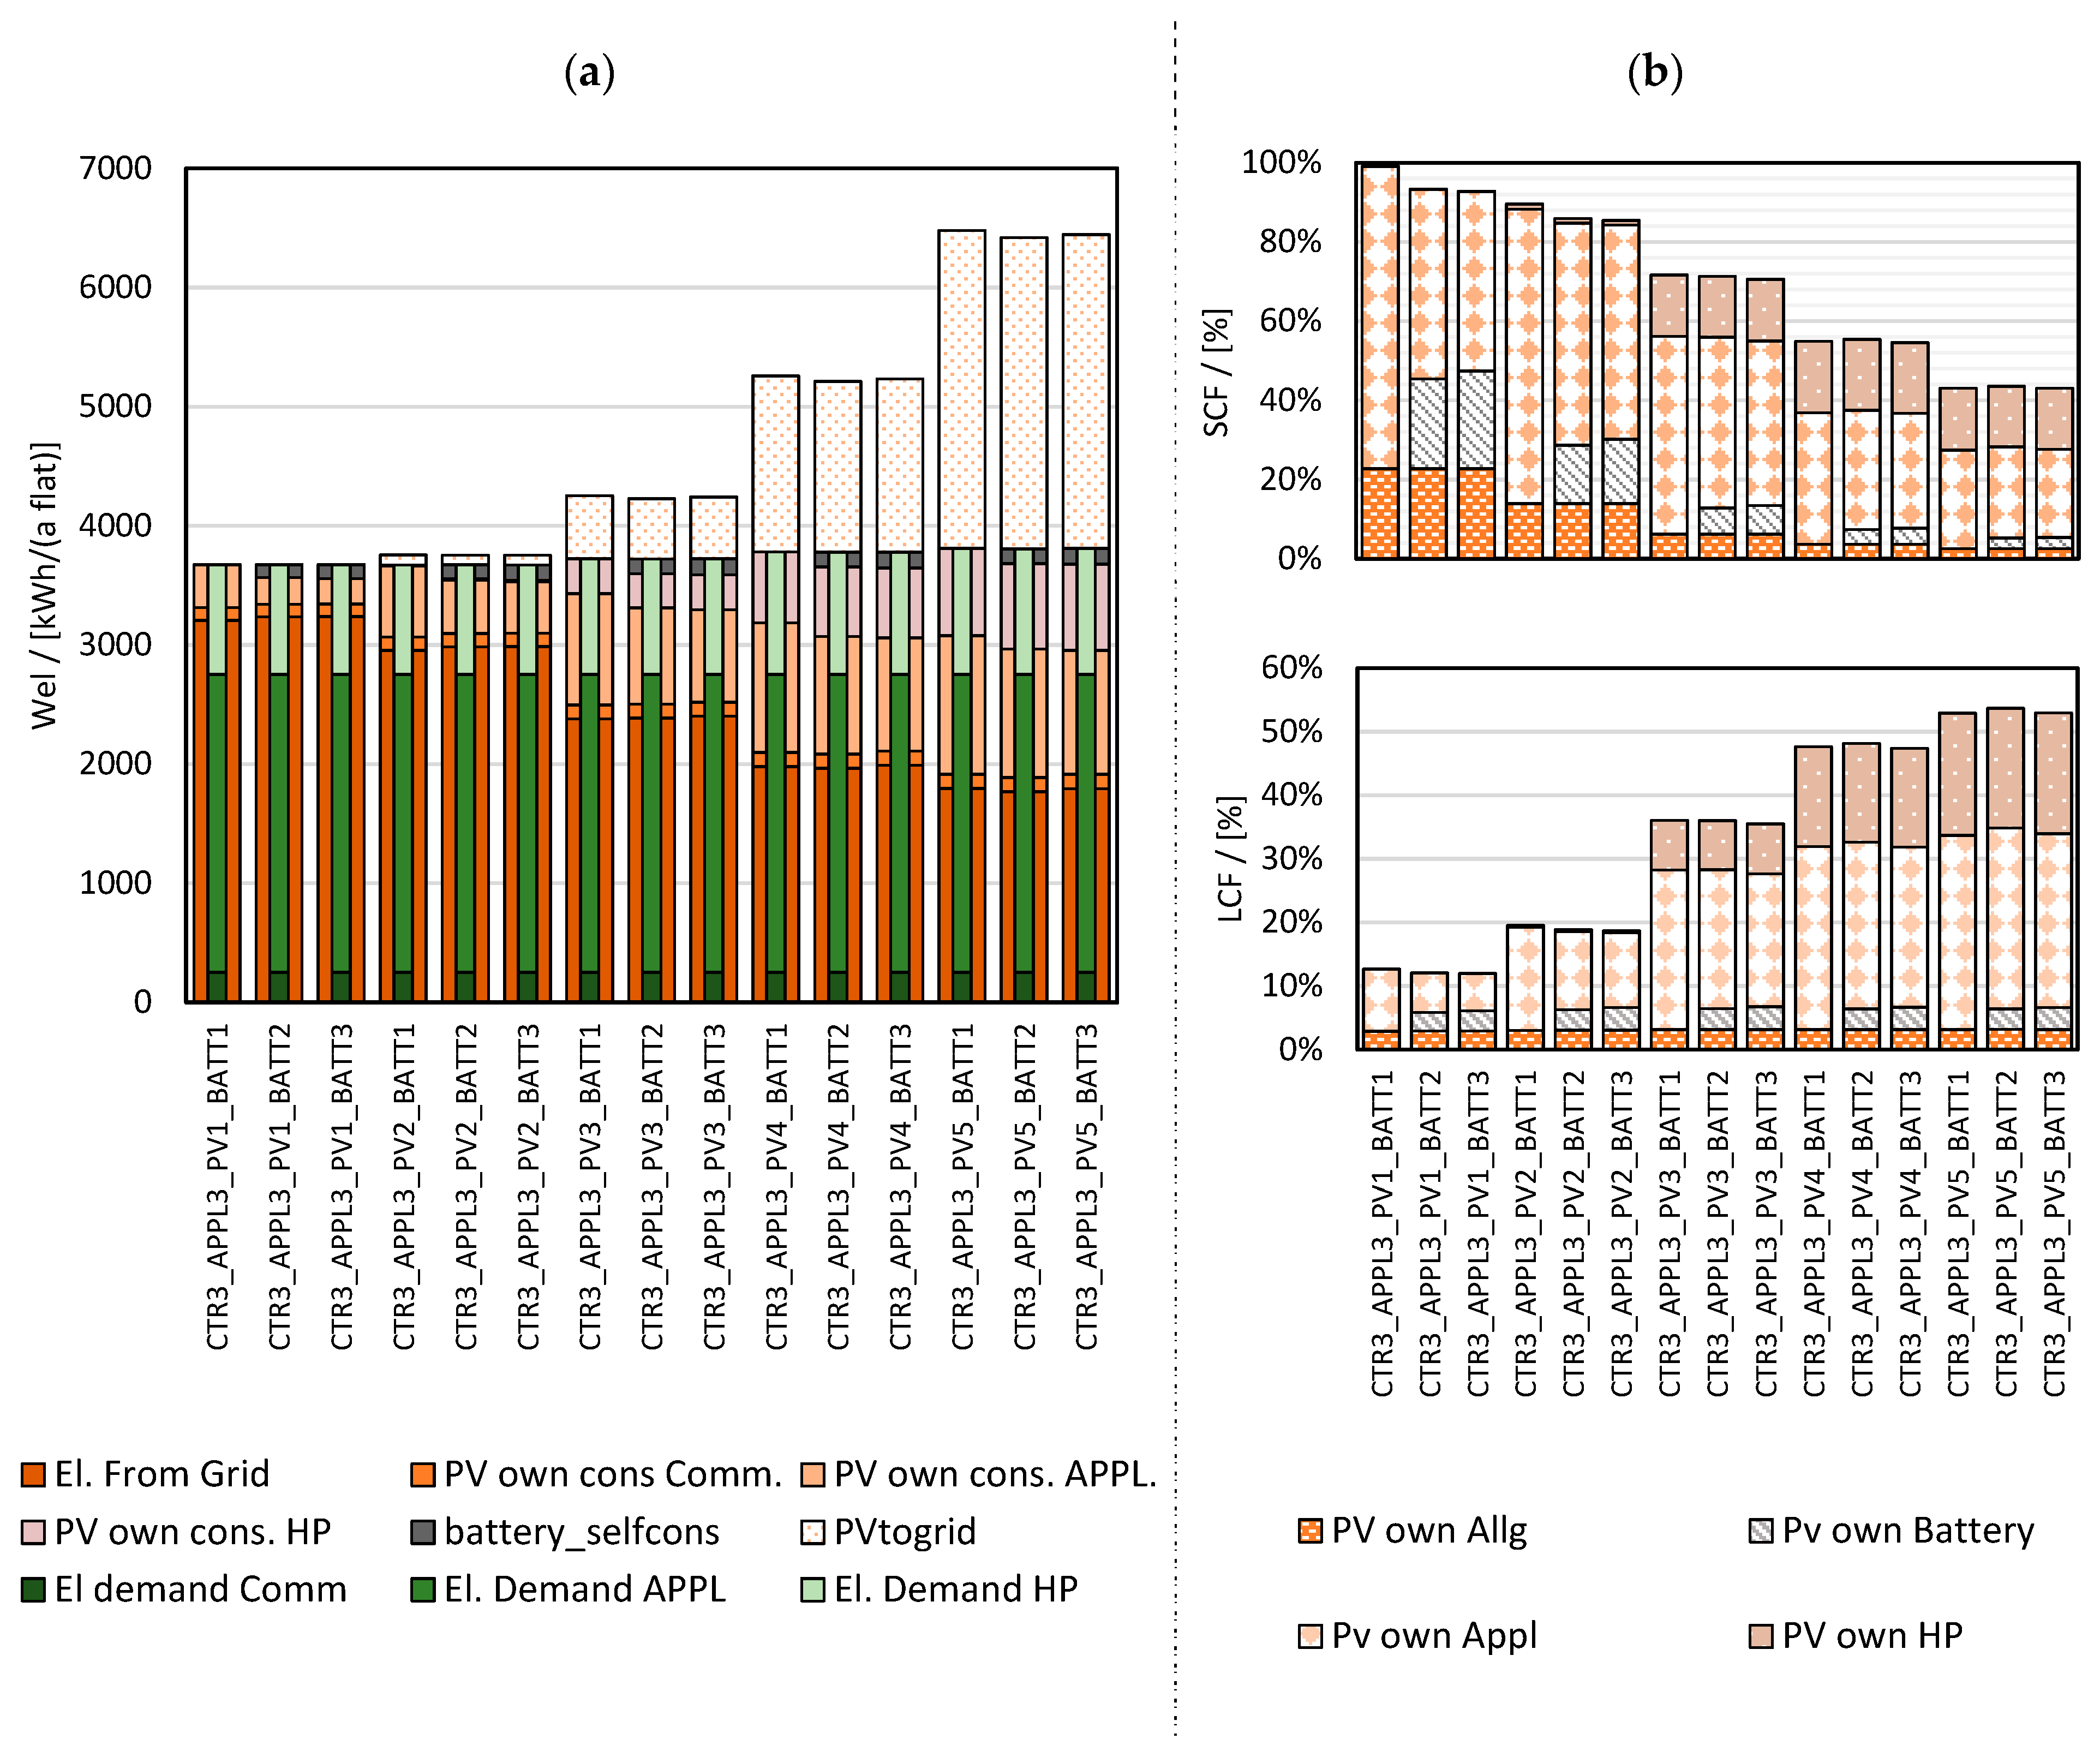
For a comprehensive analysis of the PV own-consumption (see next section), three different variants for the electricity demand of the appliances and common rooms are considered (see
Table 6). The case “APP1” disregards the electricity demands for the appliances and common areas, while in the cases “APP2” and “APP3” a constant electricity demand is considered for the common areas and a dynamic hourly profile including seasonal and daily variations is assumed and rescaled for the cases “APP2” and “APP3” (see
Figure A2 in the
Appendix A and
Table 6).
2.3.2. Modelling PV Own-Consumption
The PV panels are installed with a south orientation and 10° of inclination and they have an efficiency of 14% [
36]. An inverter efficiency of 97% is considered.
Different sizes of PV panels (see
Table 7) and different battery sizes (The battery system is used to increase the PV own-consumption for the electricity demand of the common areas). (BATT1: No battery, BATT2: 15 kWh, BATT3: 30 kWh) are analysed. It should be noted that a roof coverage of 60% is normally reachable, while reaching a share between 60% and 80% is challenging and requires accurate planning.
Because of low PV buyback prices, the share of PV that is directly used in the building shall be optimized (from the economic point of view of the building user/owner). Performing dynamic simulations, different control strategies for increasing the PV-own-consumption of the booster HP are analysed.
Typically, the PV own-consumption is evaluated in terms of load and supply cover factor (i.e., LCF and SCF respectively) as defined by Equations (1) and (2):
where PV
own is the own consumption of the PV yield, PV
tot is the total PV yield and W
el,tot is the electricity demand of the building. In the evaluation of LCF and SCF, the total electricity demand (el) including auxiliary and appliances should be considered.
2.3.3. Modelling of Heat Pumps Integrated in Buildings and District Heating
For the building perspective, monthly thermal and electric energy balances are determined for all HP integration options on a building level using the reference building energy balance and based on the simulation results.
The HPs are modelled for the sake of simplicity with a Carnot based approach (see Equations (3) and (4)):
where COP is the coefficient of performance calculated based on the COP
C, the Carnot coefficient of performance depending on T
max and T
min, the sink and source temperatures in [K], respectively, and η
C the Carnot performance factor.
Different Carnot performance factors η
C as well as maximum and minimum temperatures are used depending on the type of HP and HP integration option. The maximum temperature corresponds to the flow temperature of the heat pump, i.e., either the DHW temperature (see also [
20]) or the flow temperature of the heating system and the minimum temperature is either the ambient air or, in case of the booster-HP, the flow temperature of the heating system. In detail, the following assumptions apply:
The decentral/flat-wise air—HP for DHW is modelled as air-sourced HP that delivers hot water at 55 °C with a Carnot performance factor of 0.35. The Seasonal Performance Factor (SPF) results in being 2.49.
This variant is evaluated considering also the impact of the increased PV own-consumption due to the application of decentral HP (see
Section 2.3.2). In addition, the thermal losses of the DH are considered differently to distinguish between the case in which the DH network there is at least one building without the HP for DHW (i.e., the DH has to be operated also in summer) and the case in which all the buildings connected to the DH are equipped with the DHW-HP (i.e., no DH operation in summer).
Decentral/flat-wise Booster HP for DHW: As described in
Section 1.4, winter and summer operation have to be distinguished in the case of the Booster HP. In winter, the HP uses the flow temperature of 35 °C (max., with a heating curve) as a source to provide DHW at 55 °C. The relatively high COP of about 3 reduces the energy provided by the DH system to 2/3 in winter. In summer, instead, the source of the HP is the room temperature (20 °C in the transition seasons and 25 °C in summer) and the COP of the HP is correspondingly lower (i.e., COP = 2). In the transition months (May and September), a mixed operation (i.e., average of winter and summer conditions) is assumed. Based on the efficiency (COP) of the HP, derived from the simulation of the refrigerant cycle, for DHW preparation of 2.5 at 30 °C and 1.7 at 20 °C source temperature at 55 °C sink temperature, a Carnot performance factor η
C between 0.18 and 0.19 can be determined (see also
Figure 10 for the performance maps of the booster HP).
This variant is evaluated by considering also the impact of the increased PV own-consumption due to the application of decentral HP (see
Section 2.3.2) and by means of dynamic simulations (see
Section 2.3.1).
The Building-/Block-wise HP for SH is modelled as air sourced HP with a conservative Carnot performance factor of 0.35 leading with (ϑflow = 35 °C for SH and ϑflow = 55 °C for DHW to a SPF of 3.4.
Central HP: For the COP of large-capacity high-temperature HPs, a cascade system is assumed. The overall COP is approximated with a relative optimistic Carnot performance factor of 0.55 leading with a flow temperature of ϑflow = 90 °C to a COP in winter conditions of about 2.2 and in summer of 2.8 and a SPF of 2.5. Different variants are considered analysing different central HP sizes covering different thermal energy shared of the total DH energy (i.e., 8%, 16%, 23%, 31%, and 39%).
The Building-/Block-wise HP for DHW and SH is modelled as air sourced HP with a rather conservative Carnot performance factor of 0.35 leading to a SPF of 3.
This variant is evaluated by considering also the impact of the increased PV own-consumption (see
Section 2.3.2).
2.3.4. District Heating Perspective Model
The reference building from the DH perspective is the average building connected to DH. The reference DH system consists of only buildings without any HP. Depending on the HP integration options (see
Section 2.3) and on the number of buildings equipped with an HP in the DH system, the reduction of the total heat demand in the DH can be calculated.
Assuming an absolute limit of the amount of biomass available for the DH, the relative share of biomass increases with increasing number of buildings with HP, leading to overall lower CO2 emissions. HPs replace gas heating (or CHP) plants, but not biomass plants unless all gas plants are replaced.
Decentral (building-wise) HPs reduce the amount of heat sold by DH threatening the economic feasibility. With an increasing number of buildings disconnected from DH (in case of decentral HP for SH and DHW) or with reduced heat demand (in case of building wise HP for either SH or DHW or in case of booster-HPs), the sold heat by the DH system decreases, but the infrastructure (that has to be maintained) and the thermal losses of the DH remain the same. To compare different HP integration options under equal conditions, a threshold is defined that gives the maximum allowed number of buildings allowed in a DH system until the total heat delivered by the DH system is reduced concerning the reference. The determination of that threshold is not trivial and depends on several site-specific factors (in particular size and heat density as well as energy mix of the DH, fuel costs, electricity costs, etc.). Here, a threshold of 80% is assumed. The number of buildings and the corresponding CO2 emissions are calculated on an annual basis assuming different shares of biomass and gas plants in the DH system.
2.3.5. Energy System Perspective Model
The future development of the thermal and electric energy systems and their mutual dependencies are determined based on a scenario-based approach using annual balances. Assuming a path of 100% fossil-free electricity and DH system in 2050, an increasing share of PV and wind is anticipated in the electricity system replacing fossil-based power and CHP plants, while, in the DH, fossil heating and CHP plants are being replaced by biomass heating, large-scale central as well as medium- and small-scale decentral HPs, and remaining CHP plants (by a certain extent).
2.4. Environmental Model Based on CO2 Emissions
2.4.1. CO2 Emissions and CO2 Conversion Factor
The CO
2 emissions are evaluated on a monthly basis using Equation (5) where the q
DH is calculated according to Equation (6) and w
el according to Equations (7) and (8). Relative losses of f
loss = 10% related to the space heating (SH) and domestic hot water (DHW) demand and 1% for auxiliary energy (i.e., electric energy for circulation pumps), respectively, is taken based on measurements of the DH in Innsbruck presented in [
13]:
The monthly CO
2 conversion factors for the DH system the resulting CO
2 conversion factor can be calculated according to Equation (9):
2.4.2. Scenarios for District Heating and Electricity
Different scenarios are evaluated for what concerns the DH and electricity networks considering different shares of renewables and fossil sources.
For this purpose, conversion factors based on the OIB-6:2019 [
30] for the different energy sources are used:
The CO
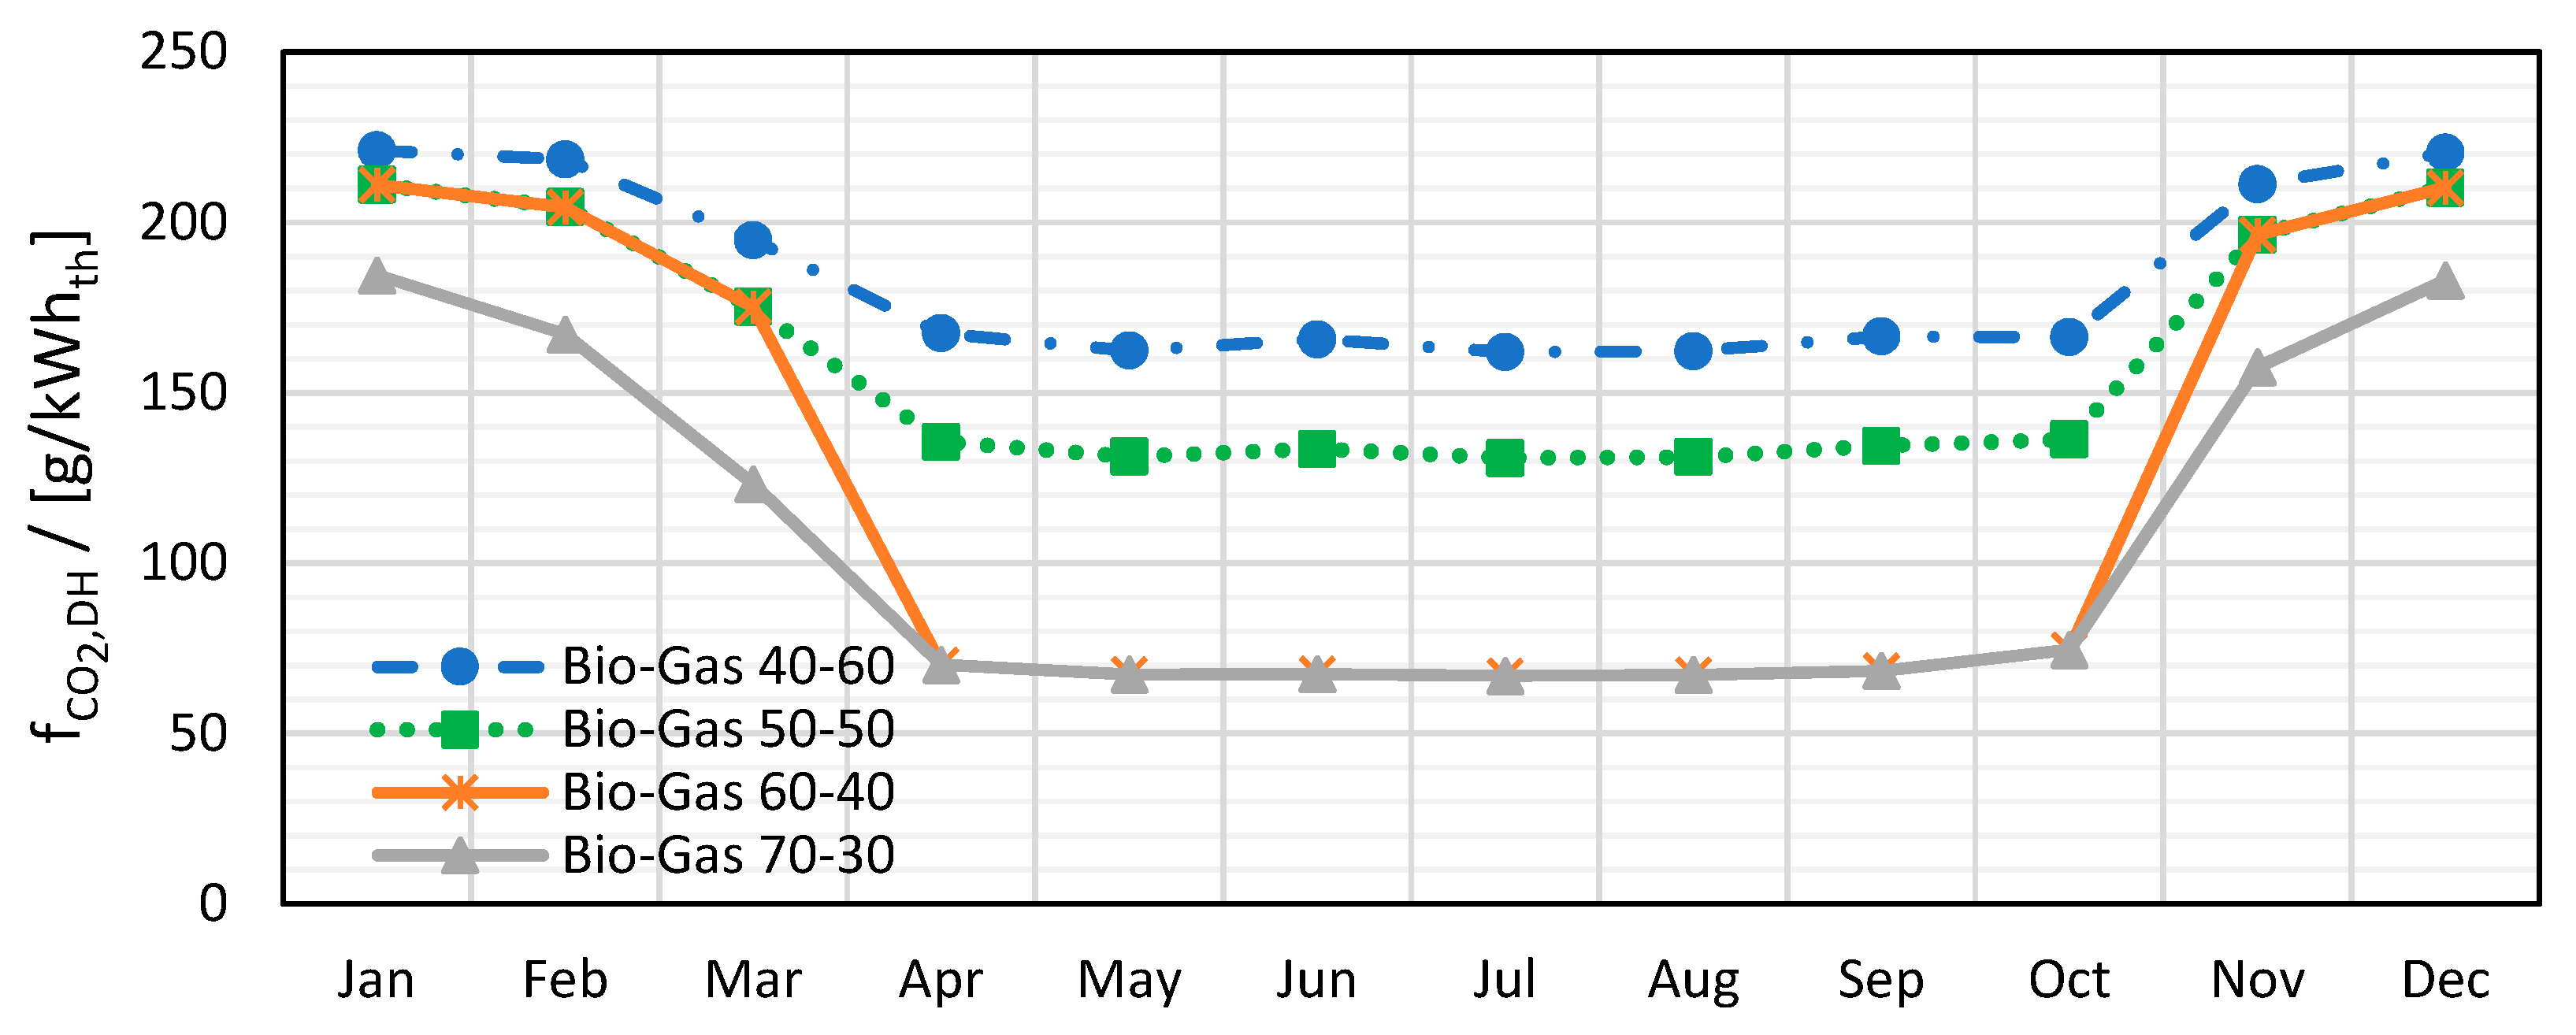
2 conversion factors of four generic DH systems with a different share of biomass/waste heat and natural gas are shown in
Figure 11. As a reference, the DH system with 40% of biomass is used, which features rather high CO
2 emissions compared to those determined for the DH in Vienna and Innsbruck (see
Section 1.7).
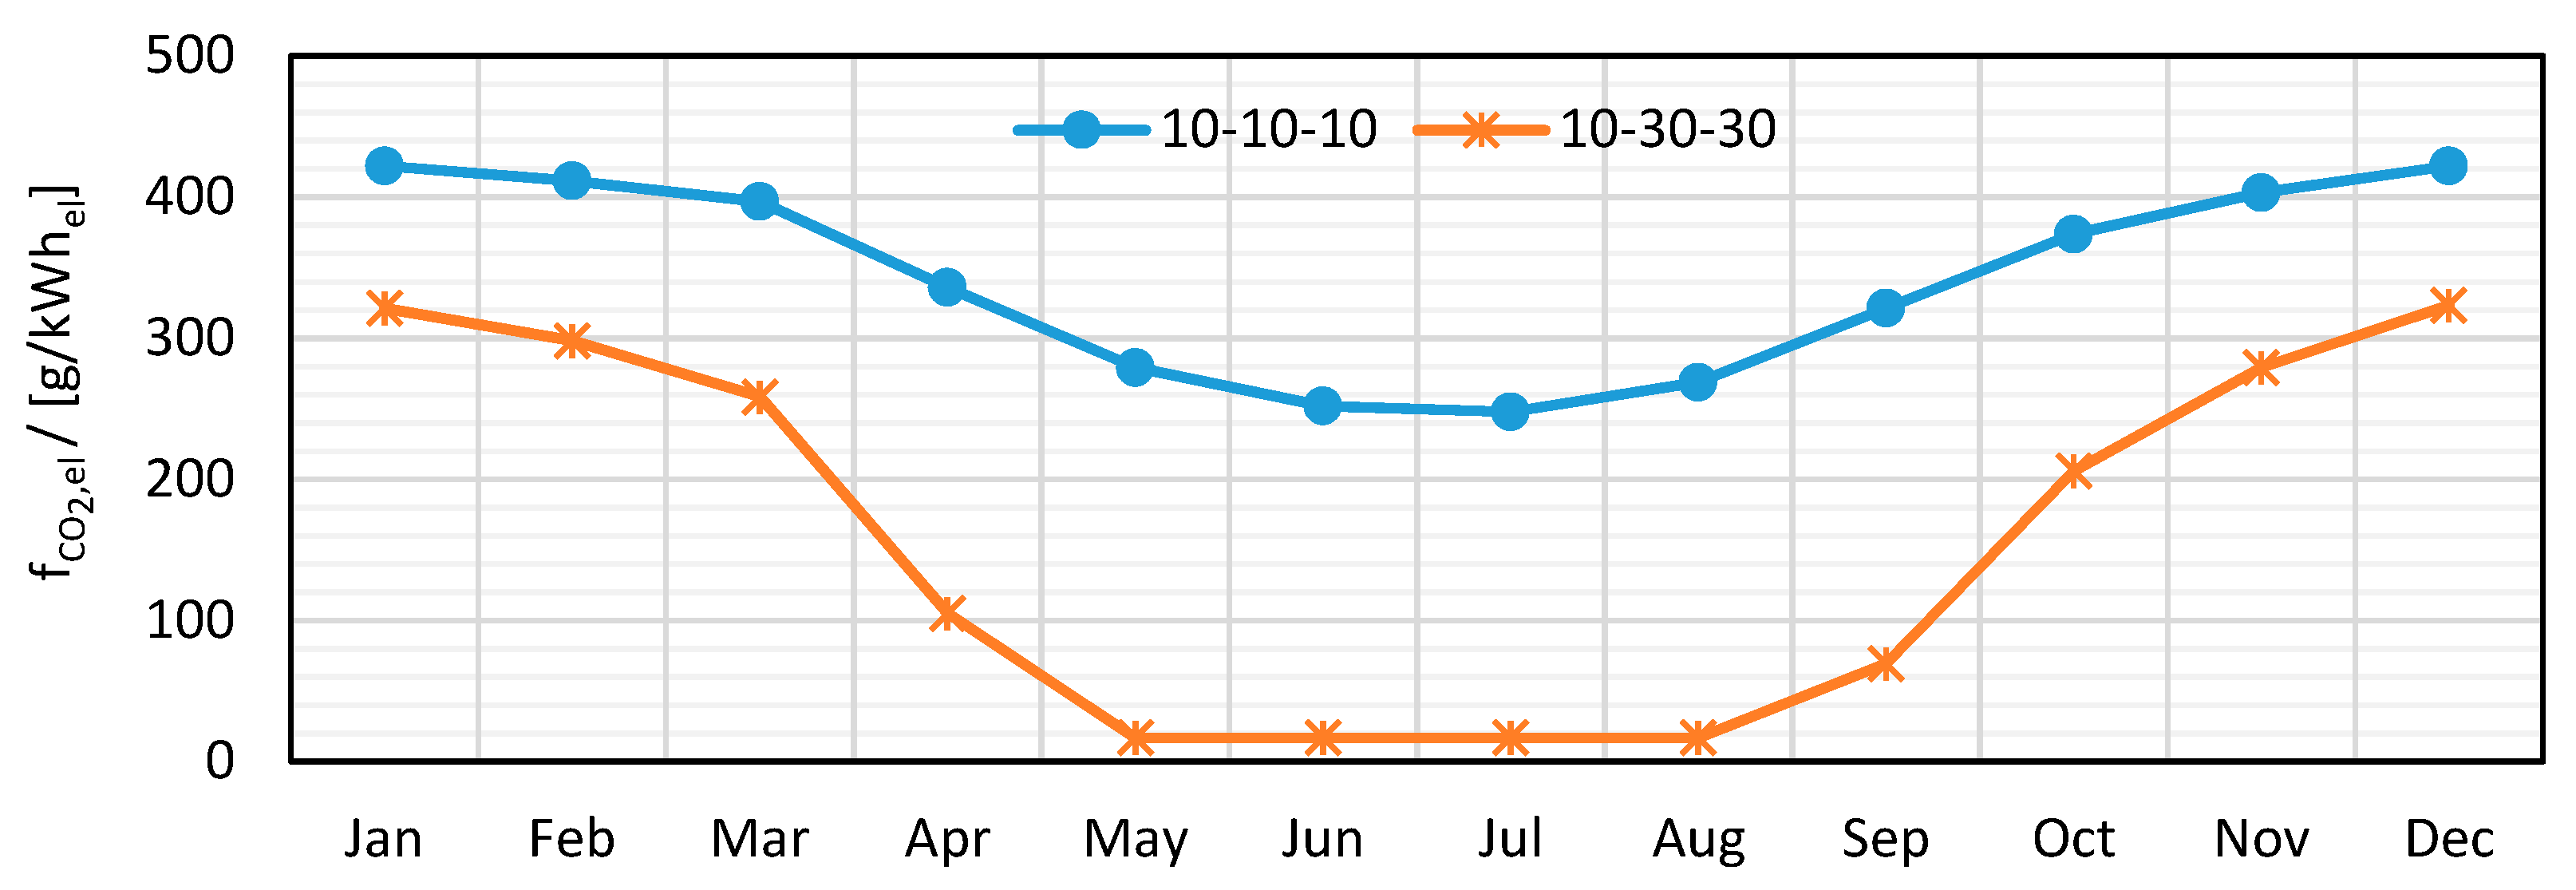
Generalized monthly CO
2 conversion factors of future electricity mixes [
29] are used to obtain results that are not country-specific. In particular, two scenarios of a generic electricity mix with 10% hydro, 10% wind and 10% PV, and 10% hydro, 30% wind and 30% PV, respectively (residual fossil) according to [
29] (see
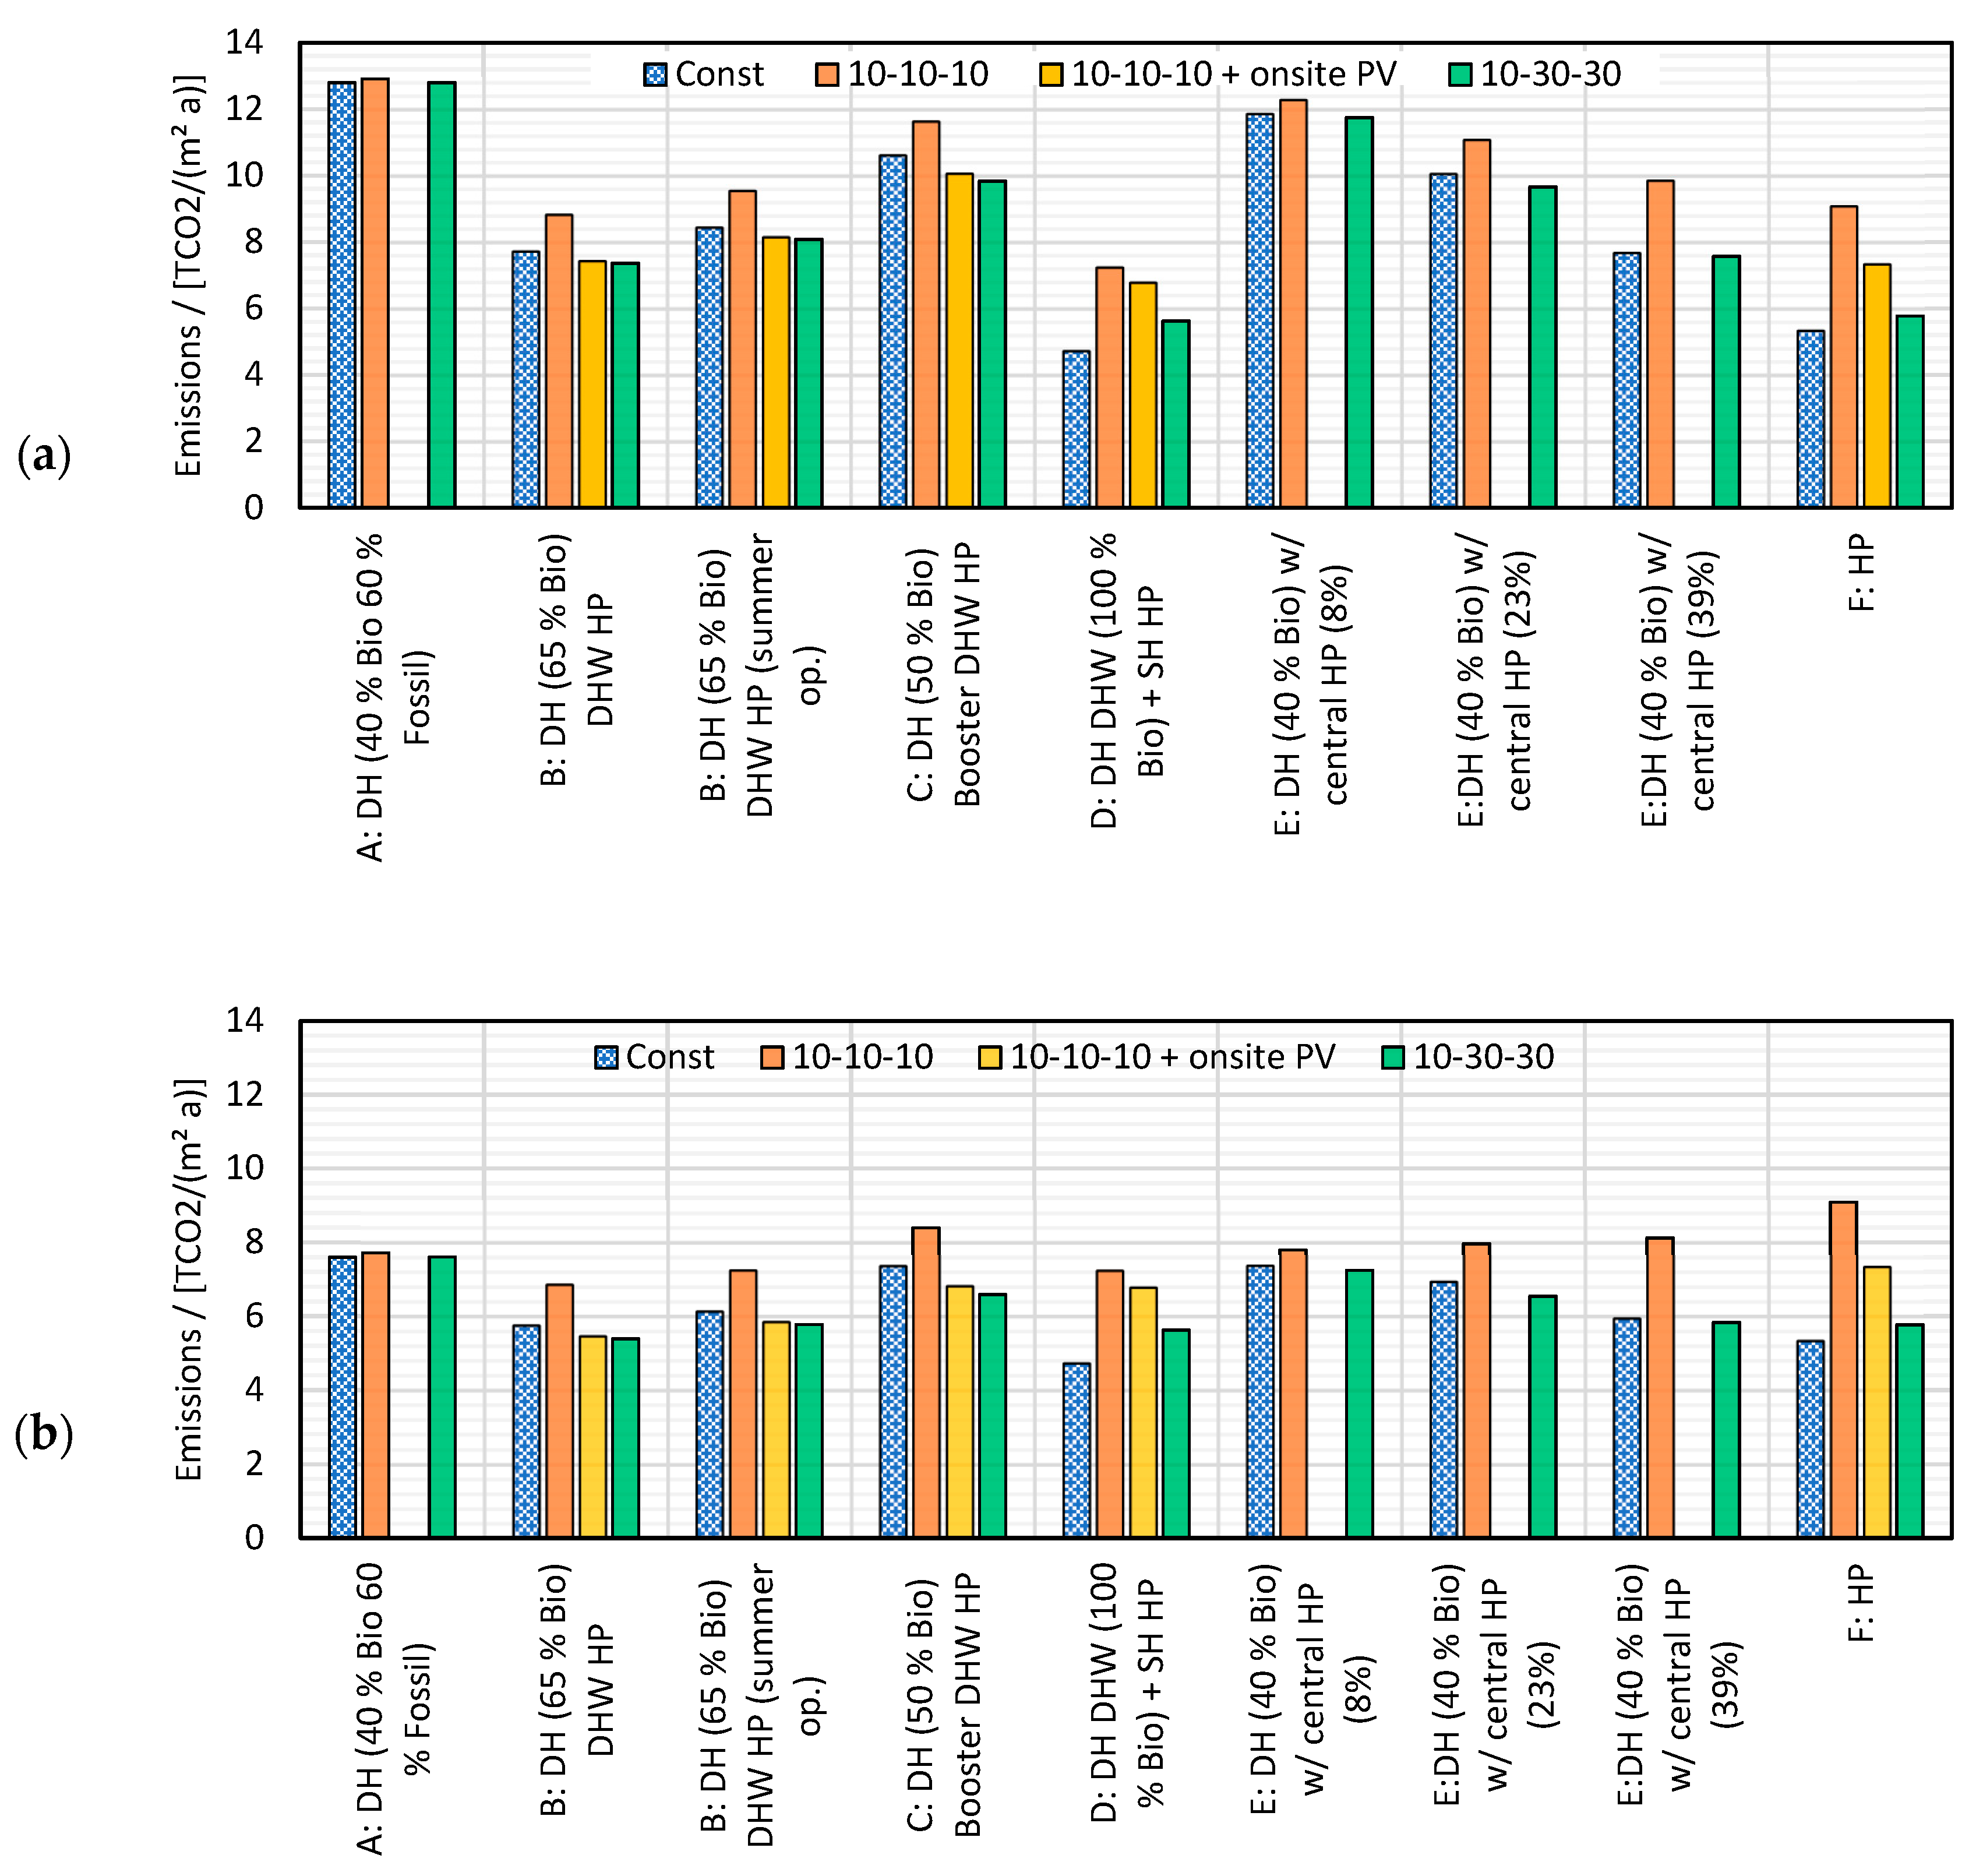
Figure 12). The “10-10-10” representing a possible near-future energy mix for Germany (rather fossil dominated) electricity system and the “10-30-30” a near future renewable dominated one.
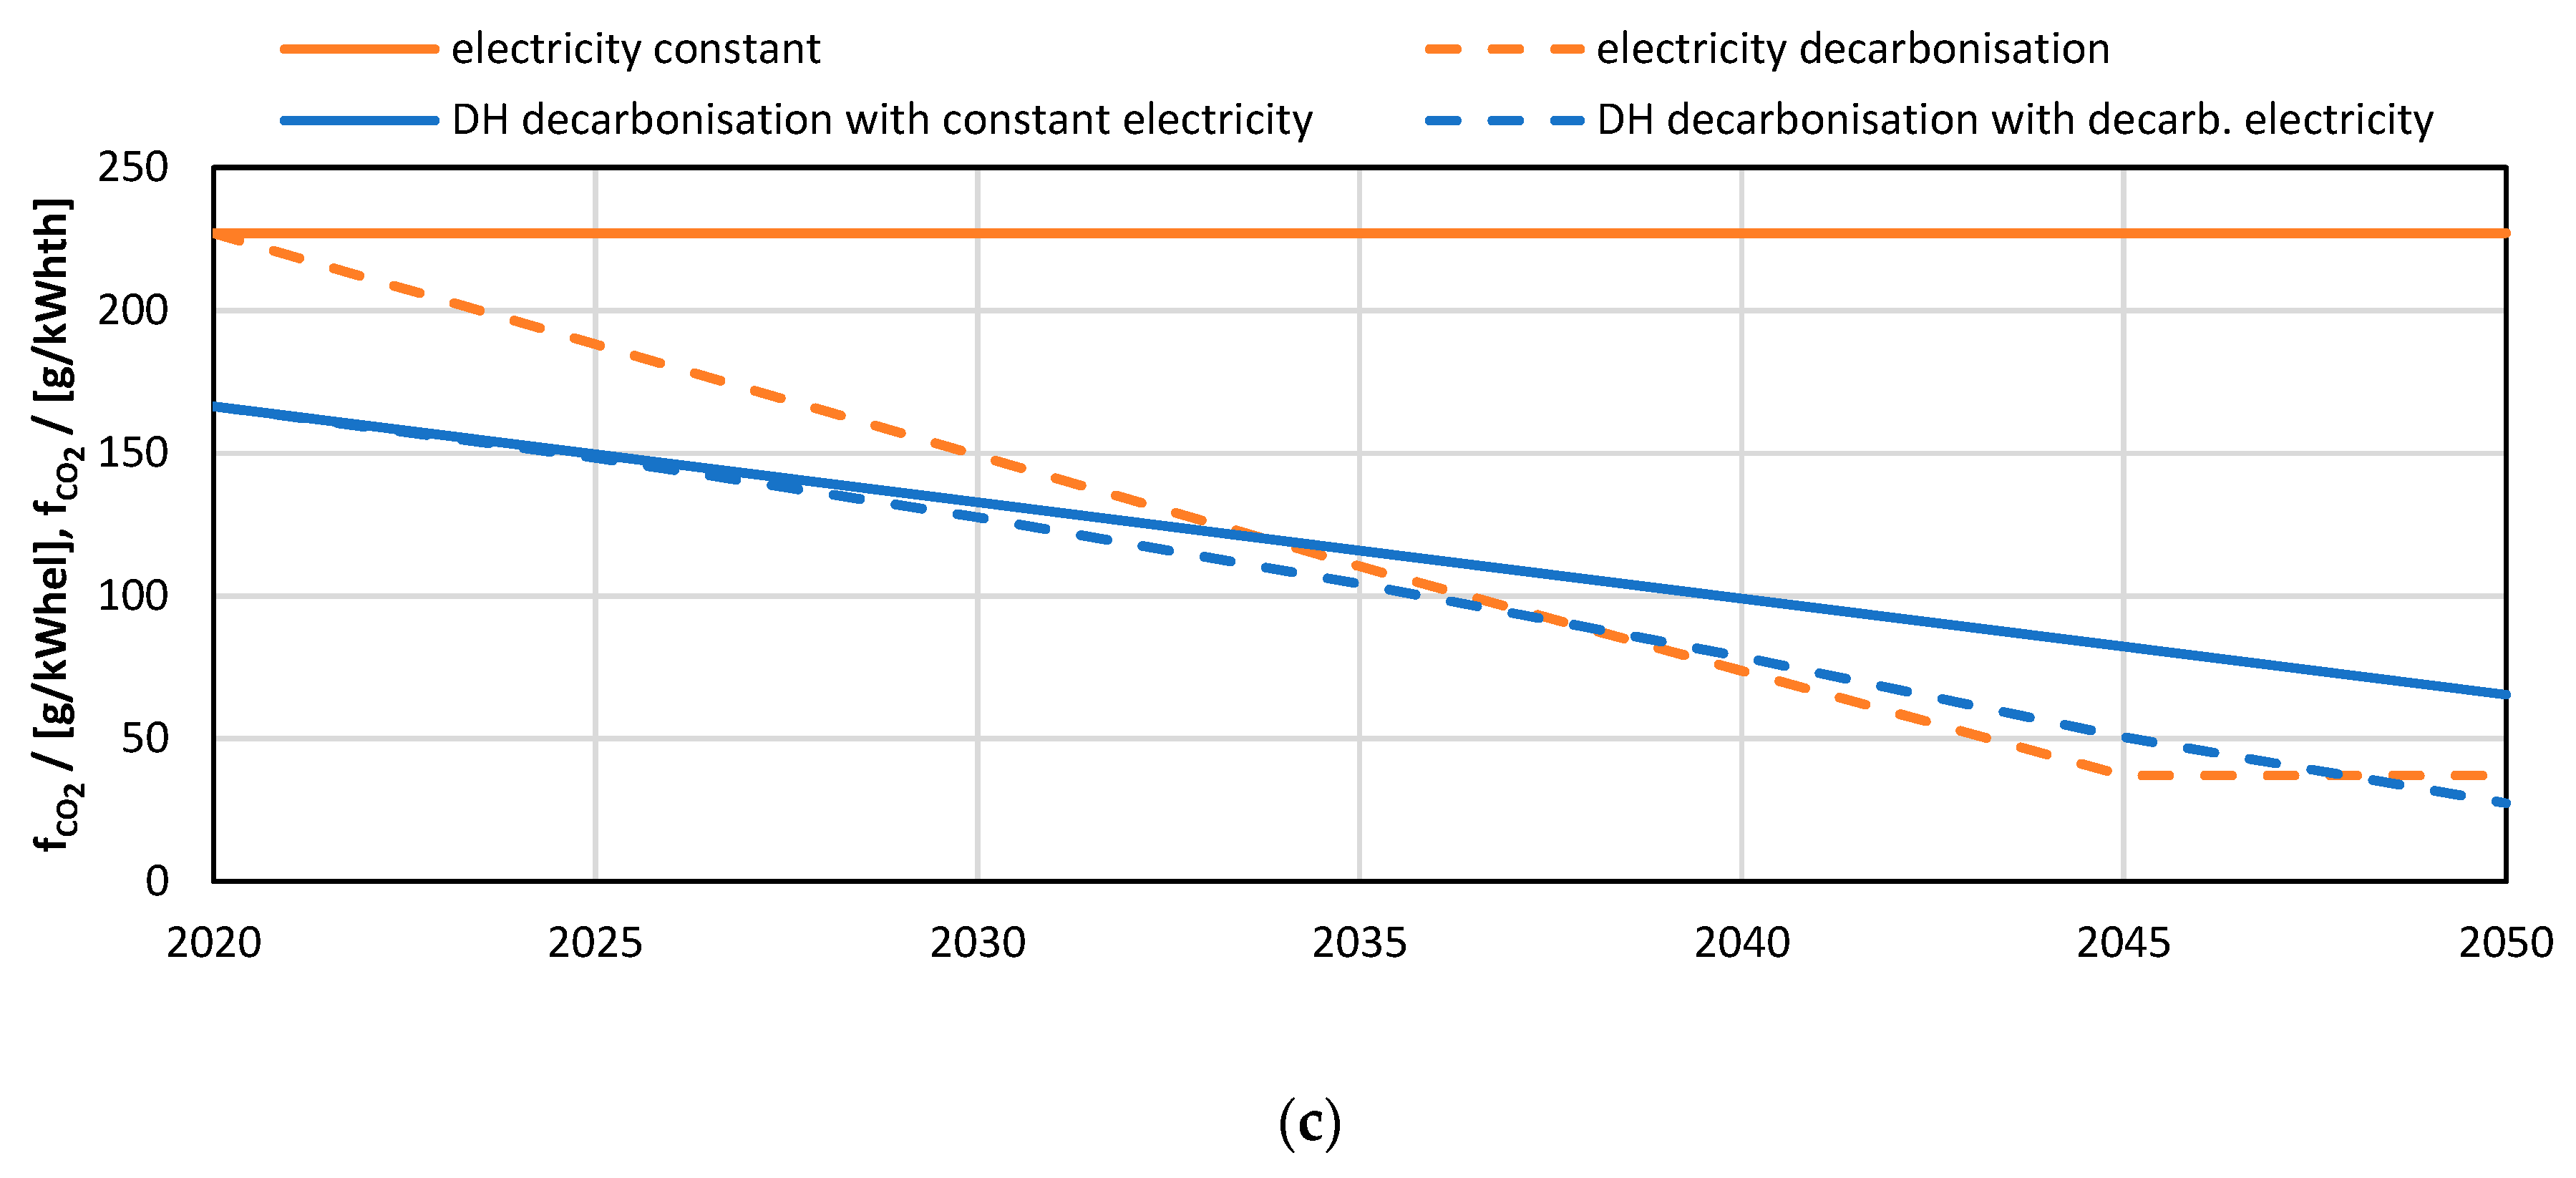
A constant conversion factor of electricity of f
CO2el = 227 g/kWh is used as a reference; additionally, the scenarios shown in
Figure 12 are applied to show the influence of the seasonal variation of the electricity mix.
2.4.3. Model for Combined Heat and Power
Gas and Biomass base load plants are typically operated as CHP plants. The CHP coefficient (power to heat ratio) is defined as the ratio between electricity generation (W
el) and thermal generation (Q
th):
With an electric efficiency of 30% and a thermal efficiency of 50%, a CHP coefficient of 0.6 is obtained (see Equation (11)). A COP coefficient of 1 is obtained instead, if the electric efficiency is equal to the thermal efficiency (here 40%) (see Equation (12)); see also [
37,
38]:
To evaluate the CO
2 emissions allocated to the electric energy and the thermal energy, the Carnot Method is applied. The Carnot-Efficiency
is calculated based on the maximum i.e., the flow temperature of the DH system and the minimum temperature, i.e., the ambient temperature:
With an ambient temperature of e.g., Tmin = 283.15 K and supply temperature of e.g., Tmax = 433.15 K, the Carnot efficiency is 0.346. Using this Carnot efficiency, the so-called fuel fraction of electrical and thermal energy can be calculated:
Fuel fraction of electrical energy A
F,el:
Fuel fraction thermal energy A
F,thFinally, the specific CO
2-emissions are calculated according to Equation (16) for the electricity part and according to Equation (17) for the thermal part:
For the given flow temperature of 160 °C, the following CO2 conversion factors can be calculated:
: fCO2,el = 423 g/kWhel, fCO2,th = 146 g/kWhth
: fCO2,el = 371 g/kWhel, fCO2,th = 129 g/kWhth
Compared to a gas heating plant with f
CO2,gas = 200 g/kWh and a thermal efficiency of η
th = 0.82 (f
CO2,th = 244 g/kWh
th), the CO
2 emissions are significantly reduced to ca. 53%. Reducing further the flow temperature down to 100 °C, the conversion factor could be further reduced to f
CO2,th = 97 g/kWh. However, in the following, an existing DH system with a flow temperature of 160 °C is assumed. The influence on the electric CO
2 conversion factor is rather small with 371 g/kWh
el compared to a power plant with an efficiency of 50% with 400 g/kWh
el, see
Table 8. Given that gas has a relatively small share in the electricity mix 15% in 2018 according to [
39], the influence on the electricity mix is of second-order importance. Hence, for sake of simplicity, two scenarios for gas are assumed. Gas power plant with f
CO2,th = 244 g/kWh
th and gas CHP plant with f
CO2,th = 129 g/kWh
th, while, for biomass, the conversion factor is kept constant with f
CO2,th = 50 g/kWh
th.
In the electricity sector, which is expected to significantly increase due to the electrification, gas is expected to be replaced mainly by wind (on- and off-shore) and PV. The limited use of hydro and biomass does not need further discussion.
4. Conclusions and Outlook
The integration of HPs either centrally on a DH level or directly in buildings is comprehensively investigated considering the mutual interdependencies using a generic DH system in a heating dominated climate (central Europe) based on two examples from Austria focusing on an energetic and environmental evaluation. HPs can significantly contribute to improving the efficiency in buildings for space heating and domestic hot water preparation. The investigation of HP integration options from the building, DH and (electric) energy system perspective by means of a simulation based energetic and ecologic evaluation of central (i.e., DH level), and decentral (i.e., building and flat level) integration options gives new insights and quantifies the mutual dependencies with regard to the thermal and electric grid.
From the energetic point of view, the application of decentral Booster-HPs in combination with DH is not recommended. In the heating season (typically 7 out of 12 months), the DHW is provided by approximately 1/3th of electricity and 2/3th of DH (COP of 3, the source of the HP is the DH). Only in 5 out of 12 months (or less) the source of the HP is ambient heat. Thus, in spite of reduced distribution (and storage) losses in the building, integration of Booster-HPs does not show significant savings. The advantage is instead (if the hydraulic configuration allows for it) the possibility to (partly) provide space cooling. Furthermore, the PV-own-consumption can be slightly increased, which can be an advantage from the building-owner point of view.
Decentral air-to-water HPs for DHW preparation outperform Booster-HPs. However, their integration into the building/flat is more challenging (air-source, visual/design aspects, sound emissions). In addition, the application of decentral DHW-HPs leads to a reduction of the base load of the DHW system. In a theoretic DH system with 100% DHW-HPs, there would be no summer operation. The application of decentral DHW-HPs can be a good solution in the renovation of buildings if DHW distribution in the building is not available and cumbersome to install.
Increasing the PV own-consumption is one of the main motivations for integrating booster HPs in DH systems. Nevertheless, it has been found that a control logic solely oriented towards increasing PV own consumption could result in an increase in electricity from the grid. The PV own-consumption of HP should be analysed including also the appliances in the balance. Particularly in the case of multi-family houses, the energy from PV per flat could be so low that it would be almost completely used to cover the load from appliances. Accordingly, for this case study, the booster HP would contribute to increasing the PV own-consumption only for a PV size bigger than 2 kWp/flat.
Central HPs integrated in the district DH typically have to provide up to 90 °C in winter and 60 °C in summer (or higher) and even though large HPs typically perform better than small HPs, the loss of efficiency due to high sink temperatures cannot be compensated.
Thus, in the sense of better performance, decentral application of HPs seems to be more favourable. However, the load of the DH system reduces by means of integrating decentral HPs and in particular in the case of DHW HPs (both building-wise or flat-wise air-to-water) or decentral apartment-wise booster HPs. The load curve becomes unfavourable for DH: the summer load reduces to close to zero leading to shorter runtimes of the DH system (only during the heating season from September to May). On a wider perspective, DH systems with a significant amount of buildings with decentral DHW HPs will not be operable in an economic way.
Integrating building- or flat-wise HPs for SH could be beneficial and, for the DH system, the remaining DHW load represents a constant and flat load. HPs can be operated with low sink temperatures (55 °C for DHW and 35 °C or lower for SH with underfloor heating) and thus with high performance. A drawback of building- or block-wise SH HPs is the short operation time (only during the winter season) and thus their application might be economically challenging.
Integrating HPs in DH does not generally lead to CO2 savings but would in the case of typical DH systems (with relevant fossil share) and in the case of the current EU electricity mix. In the reference case, CO2 emissions could be reduced from 12.8 TCO2/(m2 a) down to 4.7 TCO2/(m2 a) in the best case. In a future increasing renewable electricity mix, HPs will either outperform DH or enable their transition to renewable DH. Large-scale integration of HP will lead to an increase of the electricity demand, which has to be compensated by large-scale development of renewable electricity sources and by energy storage to compensate for the seasonal mismatch.
Based on the findings, in future work, a micro-economic (building and DH perspective) and macro-economic (society perspective) evaluation would contribute to developing guidelines to the optimal path for the decarbonisation of the building stock.

