1. Introduction
Transportation of liquids or hydromixtures through conduits is an important element of technological solutions in many industries. The advantages of such transport include: low costs, maintaining high purity of the transported medium, the elimination of environmental pollution, as well as easy monitoring and automation of such a process.
The demand to pump hydromixtures consisting of increasingly finer solid particles with their increasing concentration in industrial installations has been growing. Pumping hydromixtures with high solids concentrations in pipelines requires the application of pumps with a high discharge pressure, which results in a significant energy consumption and leads to greater pump wear [
1,
2,
3].
During the transportation process of hydromixture, a substantial reduction of frictional pressure drop in the pipeline may occur. It is therefore often necessary to consider the problems of calculating the power requirements for pumping through a given pipeline system, the selection of the optimum pipe diameter, the measurement and control of the flow rate, etc. The knowledge of these factors facilitates controlling the total plant cost installation operation [
4]. Several studies for pressure drop prediction in slurry flow are available in the literature, for instance [
5,
6,
7].
It is clear that the transportation of utilities through pipelines involves significant energy expenditure. In recent years, with the growing difficulties with obtaining energy and the need to optimize transport costs, it has become necessary to develop new energy-saving technologies and methods of media transport that enable the reduction of energy consumption [
8,
9,
10]. Such methods include: methods using the phenomena of the abnormal reduction of any pressure drop when macromolecular polymers are added to the transported medium (Toms effect), methods using surfactants (surface-active substances) or deflocculants (a chemical or compound that prevents flocculation) as additives to reduce pressure drop during media transport, two-phase liquid-gas transport methods using compressed air (mainly used while concentrated suspensions exhibit complex rheological properties, especially when non-Newtonian shear thinning liquids are transported), and methods of modifying the rheological properties of the transported media. Each of these methods has found a wide application in practice and has been the subject of many research works [
11,
12,
13,
14,
15].
A great deal of works have been published in the literature devoted to explanation of the mechanism of pressure drop reduction [
16,
17,
18,
19,
20,
21,
22]. Despite the fact that many hypotheses of this phenomenon have been put forward, it has not been possible to propose universal model equations for predicting the frictional pressure drop.
The objective of this study is to develop a method of reduction of the electrical power consumption in the transportation of hydromixture in the pipeline. Such studies are part of the issues of industrial process intensification and multiphase fluid mechanics due to their wide applicability.
2. Materials and Methods
The hydromixture used in the study originated from an industrial installation of a Polish limestone mine. The solid fraction contained in the hydromixture consisted of dusty particles of quarried stone containing a high percentage of calcium carbonate. The grain composition of the solid fraction, determined using a laser grain size analyzer, is shown in
Figure 1.
The grain size ranged from 0.5 μm to 163.5 μm, with an average grain size of 45.5 μm. The dust fraction with a mean grain diameter ranging from 2 μm to 50 μm had the largest share in the sample (about 65%). The sand fraction, characterizing particles with an average grain diameter larger than 50 μm, represented almost one third of all particles. The clay particles constituted only 3.38% of all the particles contained in the hydromixture. Chemically, the test hydromixture consisted mainly of calcium oxide CaO (73.6%) and silicon oxide (SiO2—13%). The other chemical compounds in the hydromixture were: magnesium oxide (MgO—0.6%), iron oxide (Fe2O3—0.3%), aluminum oxide (Al2O3—1.1%) and sulfur trioxide (SO3—0.3%). Substances that could not be identified accounted for approximately 11.1% of the total.
Rheological studies of hydromixture were performed using an Anton Paar (Lyon, France) MCR 302 rotational viscometer at T = 20 °C for hydromixtures with a mass concentration of Cm = (21.30−50.00)% and a solid volume concentration of Cv = (10−29)% in a range of hydromixtures density from about 1140 kg/m3 to 1410 kg/m3.
The effect of frictional pressure drop reduction in the pipeline was obtained by introducing to the hydromixture an addition of substances with highly dispersive properties, in the form of fine mineral particles and chemical compounds, called deflocculants (drag reduction agents—DRA). Such an effect is called chemical treatment and, due to its potential practical use, has become the subject of much interest in various branches of industry and scientific works [
23,
24,
25,
26,
27,
28]. This effect should result in frictional pressure drop reduction in the flow of the hydromixture with an increase in the concentration of the solid phase contained in it, and result in a reduction of the energy consumption necessary to overcome the friction occurring in the pipeline. The reduction in the frictional pressure drop entails a reduction in the total cost of the hydrotransport process.
The composition of the proposed deflocculant was developed based on years of experimental research, knowledge derived from the literature, and cooperation with an industrial enterprise.
Sodium water glass and calcareous groats were selected as the deflocculant components based on their easy access in the product market, low manufacturing/acquisition cost and environmental neutrality. In the case of sodium water glass, the unquestionable advantage is its common occurrence and low purchase cost. Sodium water glass is formed by the reaction between silica and sodium hydroxide or silica and sodium carbonate. The addition of sodium water glass was intended to lower the viscosity, leading to a reduction in the shear stress created in the transported hydromixture. Calcareous groats, a residue from the lime slaking process that produces hydrated lime, consist of mineral particles with a grain diameter of less than 1.8 mm and an average grain diameter of 240 μm.
Figure 2b presents an image of the calcareous groats grains surface made by a Phenom Pro X (Thermo Fisher Scientific, Waltham, MA, USA) scanning electron microscope (SEM) after applying a 10 kV electron accelerating voltage.
This substance is inexpensive and easy to obtain, and is stored in large amounts in the production plant area. Chemically, calcareous groats are mostly composed of calcium oxide and magnesium oxide (70.81%), silicon dioxide (1.52%) and aluminum (0.84%). The remaining substances are minor impurities formed in the process of hydration of a mixture of lime and water.
Table 1 presents the results of the chemical composition analysis of calcareous groats performed with a scanning electron microscope integrated with an energy-dispersive X-ray spectrometer (EDS).
These two substances (sodium water glass and calcareous groats) combined together in appropriate proportions, depending on the mass concentration of the hydromixture, were added to tested samples with a high solid phase concentration in order to reduce the viscosity of the hydromixture.
Method of Measurement
The rheological parameters of hydromixtures used in this study were performed by an Anton Paar MCR 302 rotational viscometer. A coaxial double-gap cylinder system was chosen to measure the shear stresses generated in the hydromixture. In this measuring system, the outer cylinder, which is also the vessel into which the sample is applied, is a stationary element that allows for easy temperature control and stabilization. The inner cylinder (rotor) is driven by a motor for which the speed can be determined and the torque measured. The torque is proportional to the power of the current supplying the motor. It is converted to shear stress, and the rotor speed to the shear rate. In the performed measurements, the value of the shear rate was set, while the value of the shear stress was measured by the device. The measurements were carried out at 20 °C in the range of a shear rate from about 8–10 s−1 to 100 s−1.
3. Results
Hydraulic conveying belongs to the most reliable and economically justified modes of hydrotransport. Due to its ecological values, it is also the preferred solution applied in environmental engineering. Transport of hydromixture with significant amounts of solids requires determination of the hydromixture’s rheological properties to adopt an appropriate rheological model of the hydromixture. Such a model, determined on the basis of experimental research, allows the calculation of the frictional pressure drop during the flow of a given mixture through industrial installation. It is also essential to determine a condition at which laminar flow transforms into turbulence.
3.1. Rheological Decsription of Tested Hydromixture
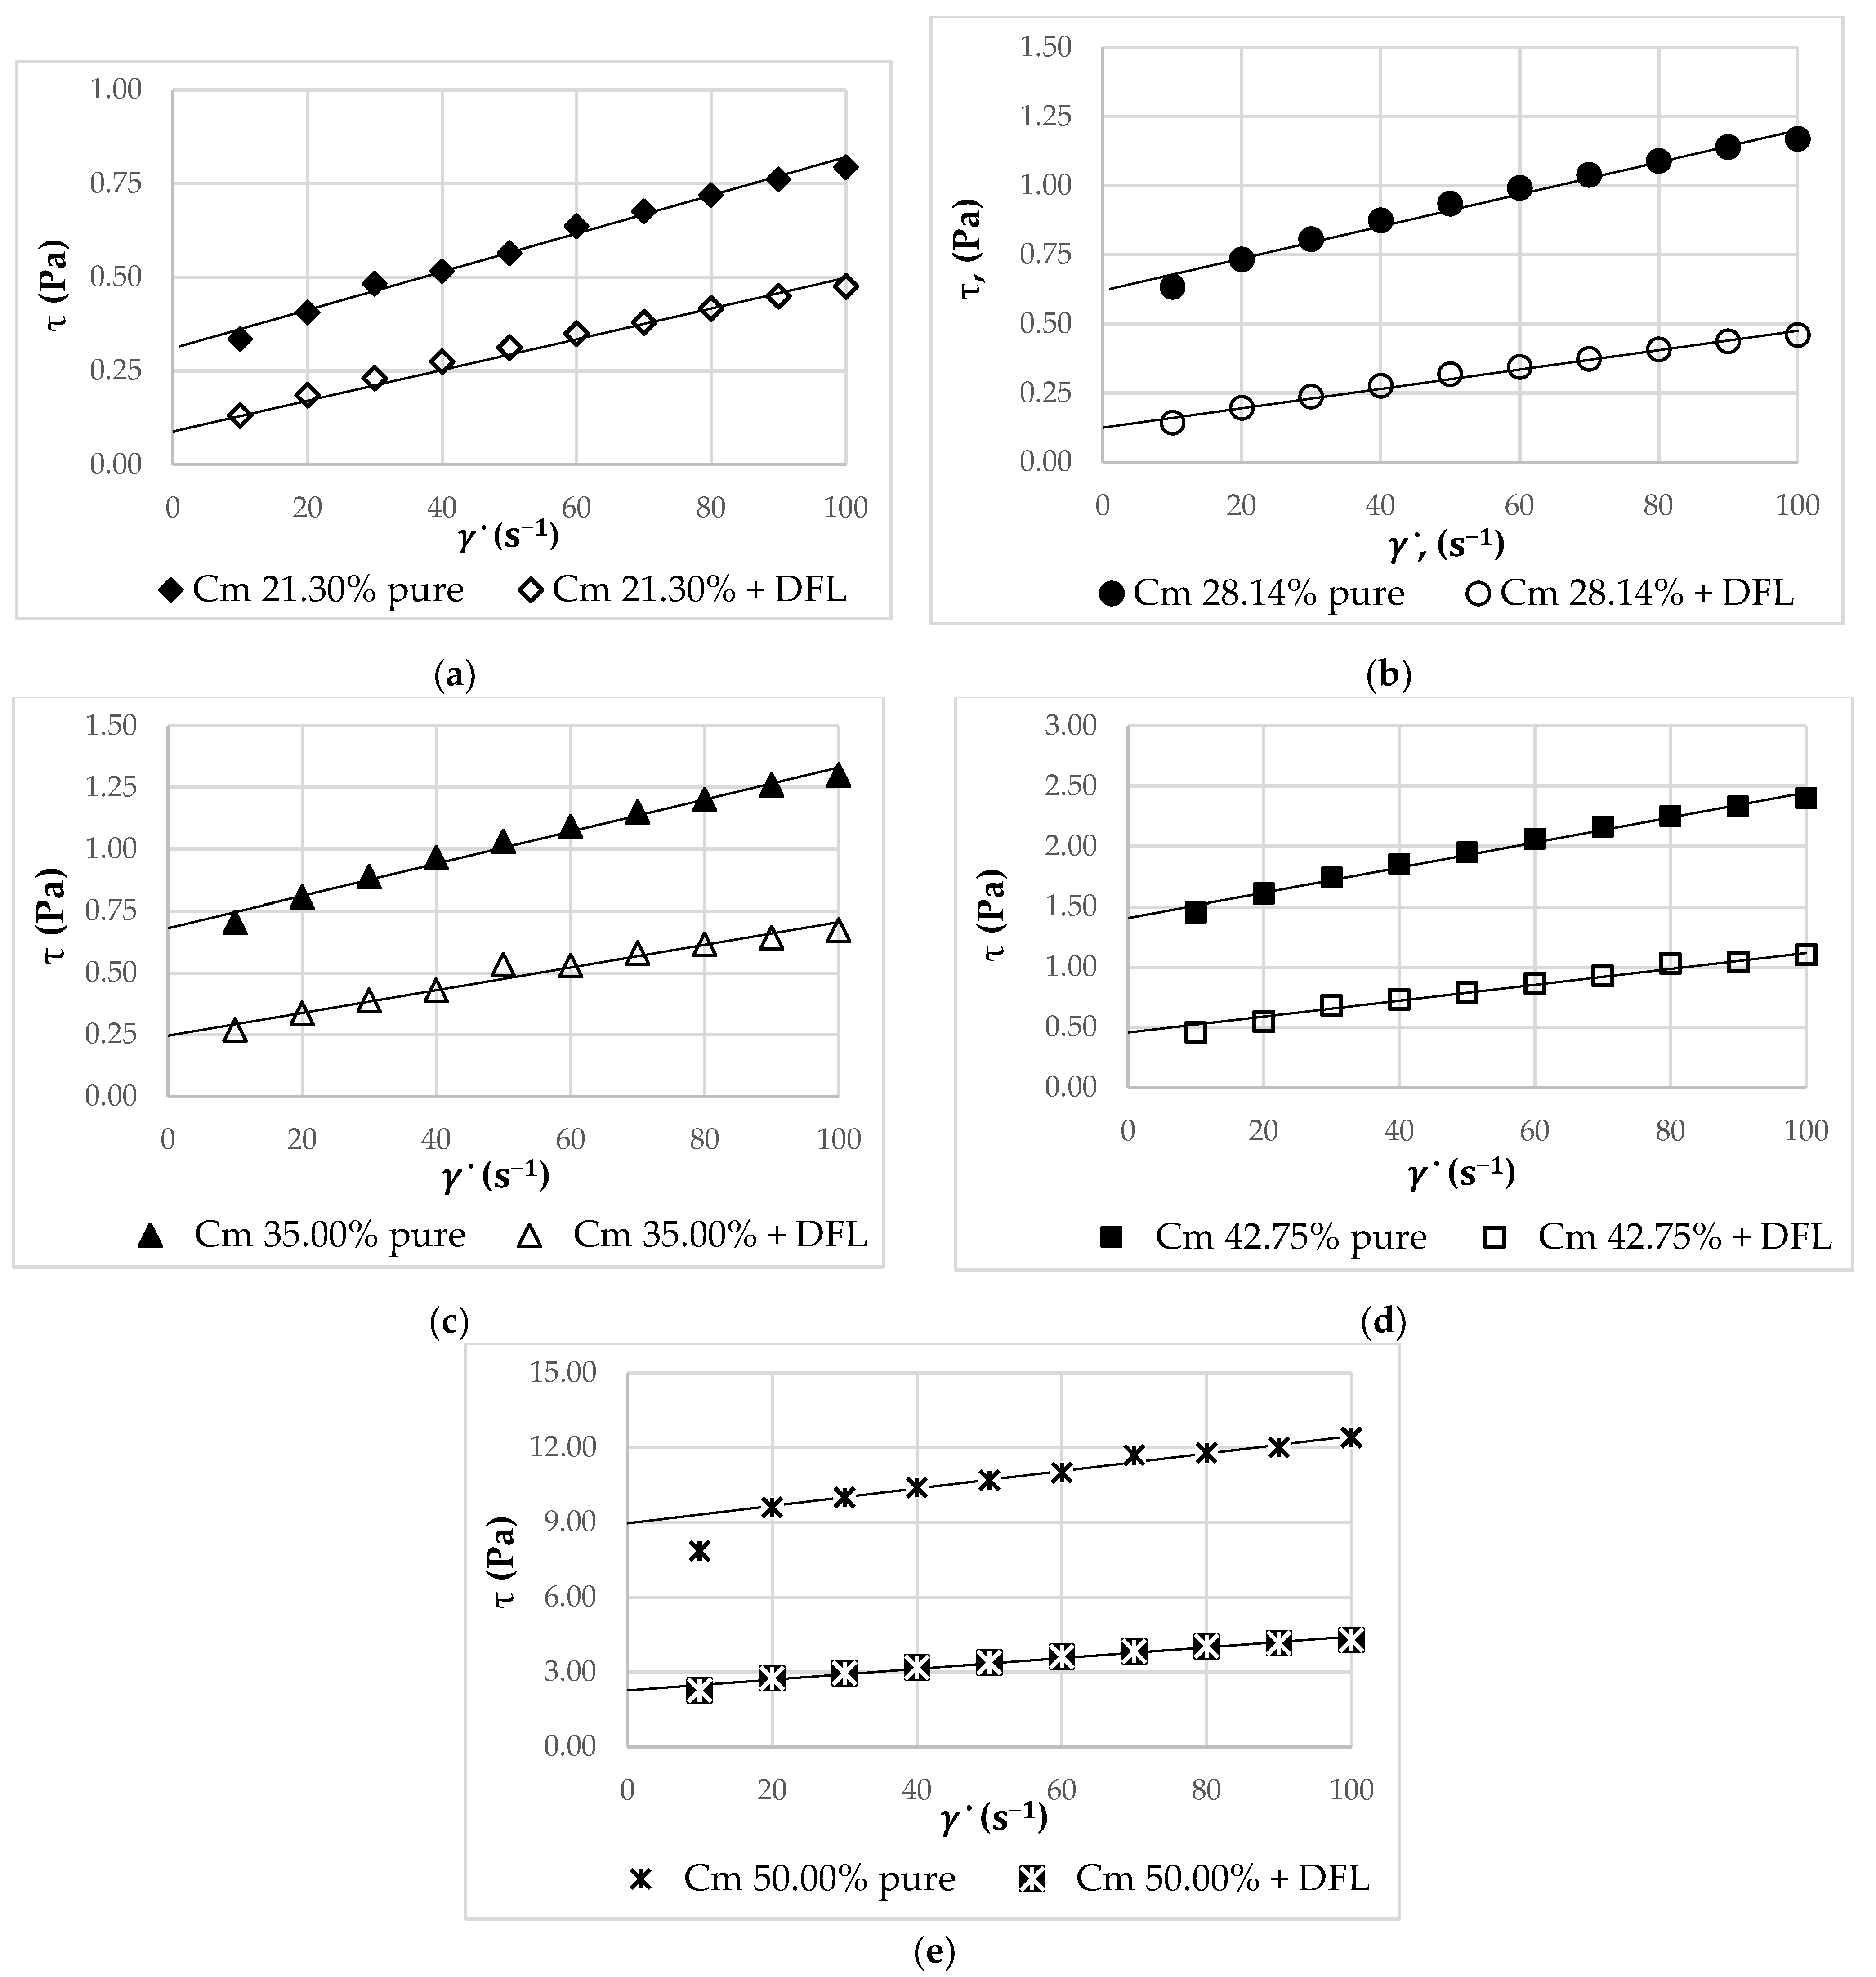
The flow curves of hydromixtures with mass concentrations of 21.30%, 28.14%, 35.00%, 42.75% and 50.00% without addition (denoted as ‘pure’) and with deflocculant addition (denoted as ‘+DFL’) are presented in
Figure 3. The rheometric measurements were compared with the results calculated for the Bingham plastics model where the solid line indicates the fit of the rheological model to the experimental data. The shape of the flow curves indicates that the tested hydromixtures belong to the group of non-Newtonian, pseudo-plastic fluids. Non-Newtonian fluids are generally highly viscous systems throughout the technically important range of the shear rate and are very difficult to transport in a pipeline.
The flow curves of hydromixtures were described by the Bingham model as follows:
where
is plastic viscosity and
y is a yield stress.
The rheological properties of the tested hydromixtures can be described by the rheological Bingham plastics model in the shear rate range from about 8–10 s−1 to 100 s−1. This range of shear rate occurs in the hydromixture flow in the analyzed pipeline.
In
Table 2, the parameters of analyzed hydromixtures with deflocculant (+DFL) and without the addition of deflocculant (pure), such as density (
), yield stress value (τ
y), plastic viscosity (
) and the coefficient value of fitting the mathematical model to the experimental data (R
2) are shown.
3.2. Mathematical Model
Calculation of the pressure drop of the tested hydromixture depends on the character of the flow (laminar or turbulent), determined by the Reynolds number for Bingham fluids. The critical value of the Reynolds number is described by an empirical equation of the form [
4]:
where the parameter
and the Hedström number are calculated as follows:
and
Flow of the Bingham plastics fluid is laminar if the calculated Reynolds number (6) is below the critical value (2), above which the transition to turbulent flow occurs.
The critical value of the Reynolds number for Bingham plastic fluids describing transition from laminar to turbulent flow for tested hydromixtures were calculated from Equation (2), and is presented in
Table 3.
The friction factor for the laminar flow of Bingham plastic fluids (
fL) was calculated from the expression known as the Buckingham–Reiner equation [
4]:
where the Reynolds number is given by:
For the Bingham plastics fluids there is a gradual deviation from purely laminar to fully turbulent flow. For turbulent flow, the friction factor (
fT) can be represented by the empirical expression of Darby and Melson [
21], and modified by Darby [
22]:
where
The friction factor for Bingham plastics fluids can be calculated for any Reynolds number, from laminar through turbulent, from the equation [
22]:
where
fL is calculated from the Equation (5) and
fT is given by the Equation (7).
The
m value is calculated from the expression:
Equation (9) was applied for calculations of pressure drop under turbulent condition for d < 335 mm, NRe ≤ 3.4 ∙ 105, and 1000 ≤ NHe ≤ 6.6 ∙ 107, and were used in further calculations of the friction factor.
3.3. Physical Model of Hydromixture Transport
The subject of the research was the transport of finely dispersed hydromixture from a reservoir to the settling tank in a pipeline of a total length of 632 m and a diameter equaling 200 mm. The total height difference between the inlet and the outlet length of the pipeline was 11 m.
We assumed that the flow of the tested hydromixture is fully developed, axially-symmetrical and isothermal. The flowing medium consisted of a solid phase and water as a carrier liquid.
The calculations of the total pressure drop in the pipeline was carried out for the hydromixture transported under industrial conditions, i.e., with a solid phase concentration of Cm = 21.30% and a volumetric flow rate of Qv = 110 m3/h, which corresponds to a solid phase mass transport of 27 t/h. The results of the calculations performed for the base hydromixture were compared with the flow pressure drop values for hydromixtures with mass concentrations of 28.14%, 35.00%, 42.75% and 50.00%, to which the deflocculant additive was applied.
Based on the assumptions of the physical model, the pressure drop (
) of the hydro-mixture flow in the tested pipeline was calculated from the expression:
where
is the density of the hydromixture,
is the mean flow velocity, and
is the difference in level between the pump inlet and the pipeline outlet.
is the linear losses due to friction in pipeline sections, which were calculated from the Darcy–Weisbach equation as follows:
where
is the friction factor,
is the total length of the pipeline, and
is the pipeline diameter.
The values of the friction factor
were determined from the equation:
3.4. Results of the Pressure Drop Calculation
The results of the pressure drop calculations for the example hydromixtures of mass concentrations of 21.30%, 42.75% and 50.00%, without the addition of deflocculant (pure) and with deflocculant (DFL), are presented in
Figure 4.
The pressure drop values presented in the graphs above
Figure 4 show an increasing trend of increasing volumetric flow rate and mass concentration of the hydromixture. However, the growth is smaller for the hydromixtures with the addition of deflocculant due to the viscosity decrease. This effect allows for the transportation of a constant amount of solid phase mass in hydromixtures of higher mass concentrations and a smaller pressure drop.
3.5. Electricity Consumption in the Hydromixture Transport
As a result of the deflocculant addition, an economic effect was achieved by the reduction of electricity consumption when pumping the hydromixture in a pipeline. In order to determine the obtained economic effect, the power at the pump shaft (
Pw) required to pump the hydromixture was calculated using the equation:
where
is the volumetric flow rate and
is the pump efficiency.
According to data acquired from the manufacturer of the equipment used in the production plant, the pump efficiency is 62%.
Knowing the pump motor efficiency of
ηS = 93.6%, the power consumption of the motor driving the pump (
PS) can be expressed as:
Assuming the constancy of the transported solid particles equal 27 t in the transport of hydromixtures with higher than 21.30% mass concentrations, the volumetric flow rates decrease and equal 80 m3/h for a hydromixture with a mass concentration of 28.14%, 61 m3/h for a hydromixture with a mass concentration of 35.00%, 48 m3/h for a hydromixture with a mass concentration of 42.75%, and 38 m3/h for a hydromixture with a mass concentration of 50.00%, respectively.
A decrease in the viscosity of hydromixture was achieved as the result of deflocculant addition, which can be observed in the flow curves of hydromixtures shown in
Figure 3. Transport of hydromixture with a smaller volumetric flow rate but the same amount of solids is possible. This results in a significant decrease of energy consumption during the transportation of such hydromixtures compared to transportation of base hydromixture, with the mass concentration of 21.30%, which is presented in
Table 4.
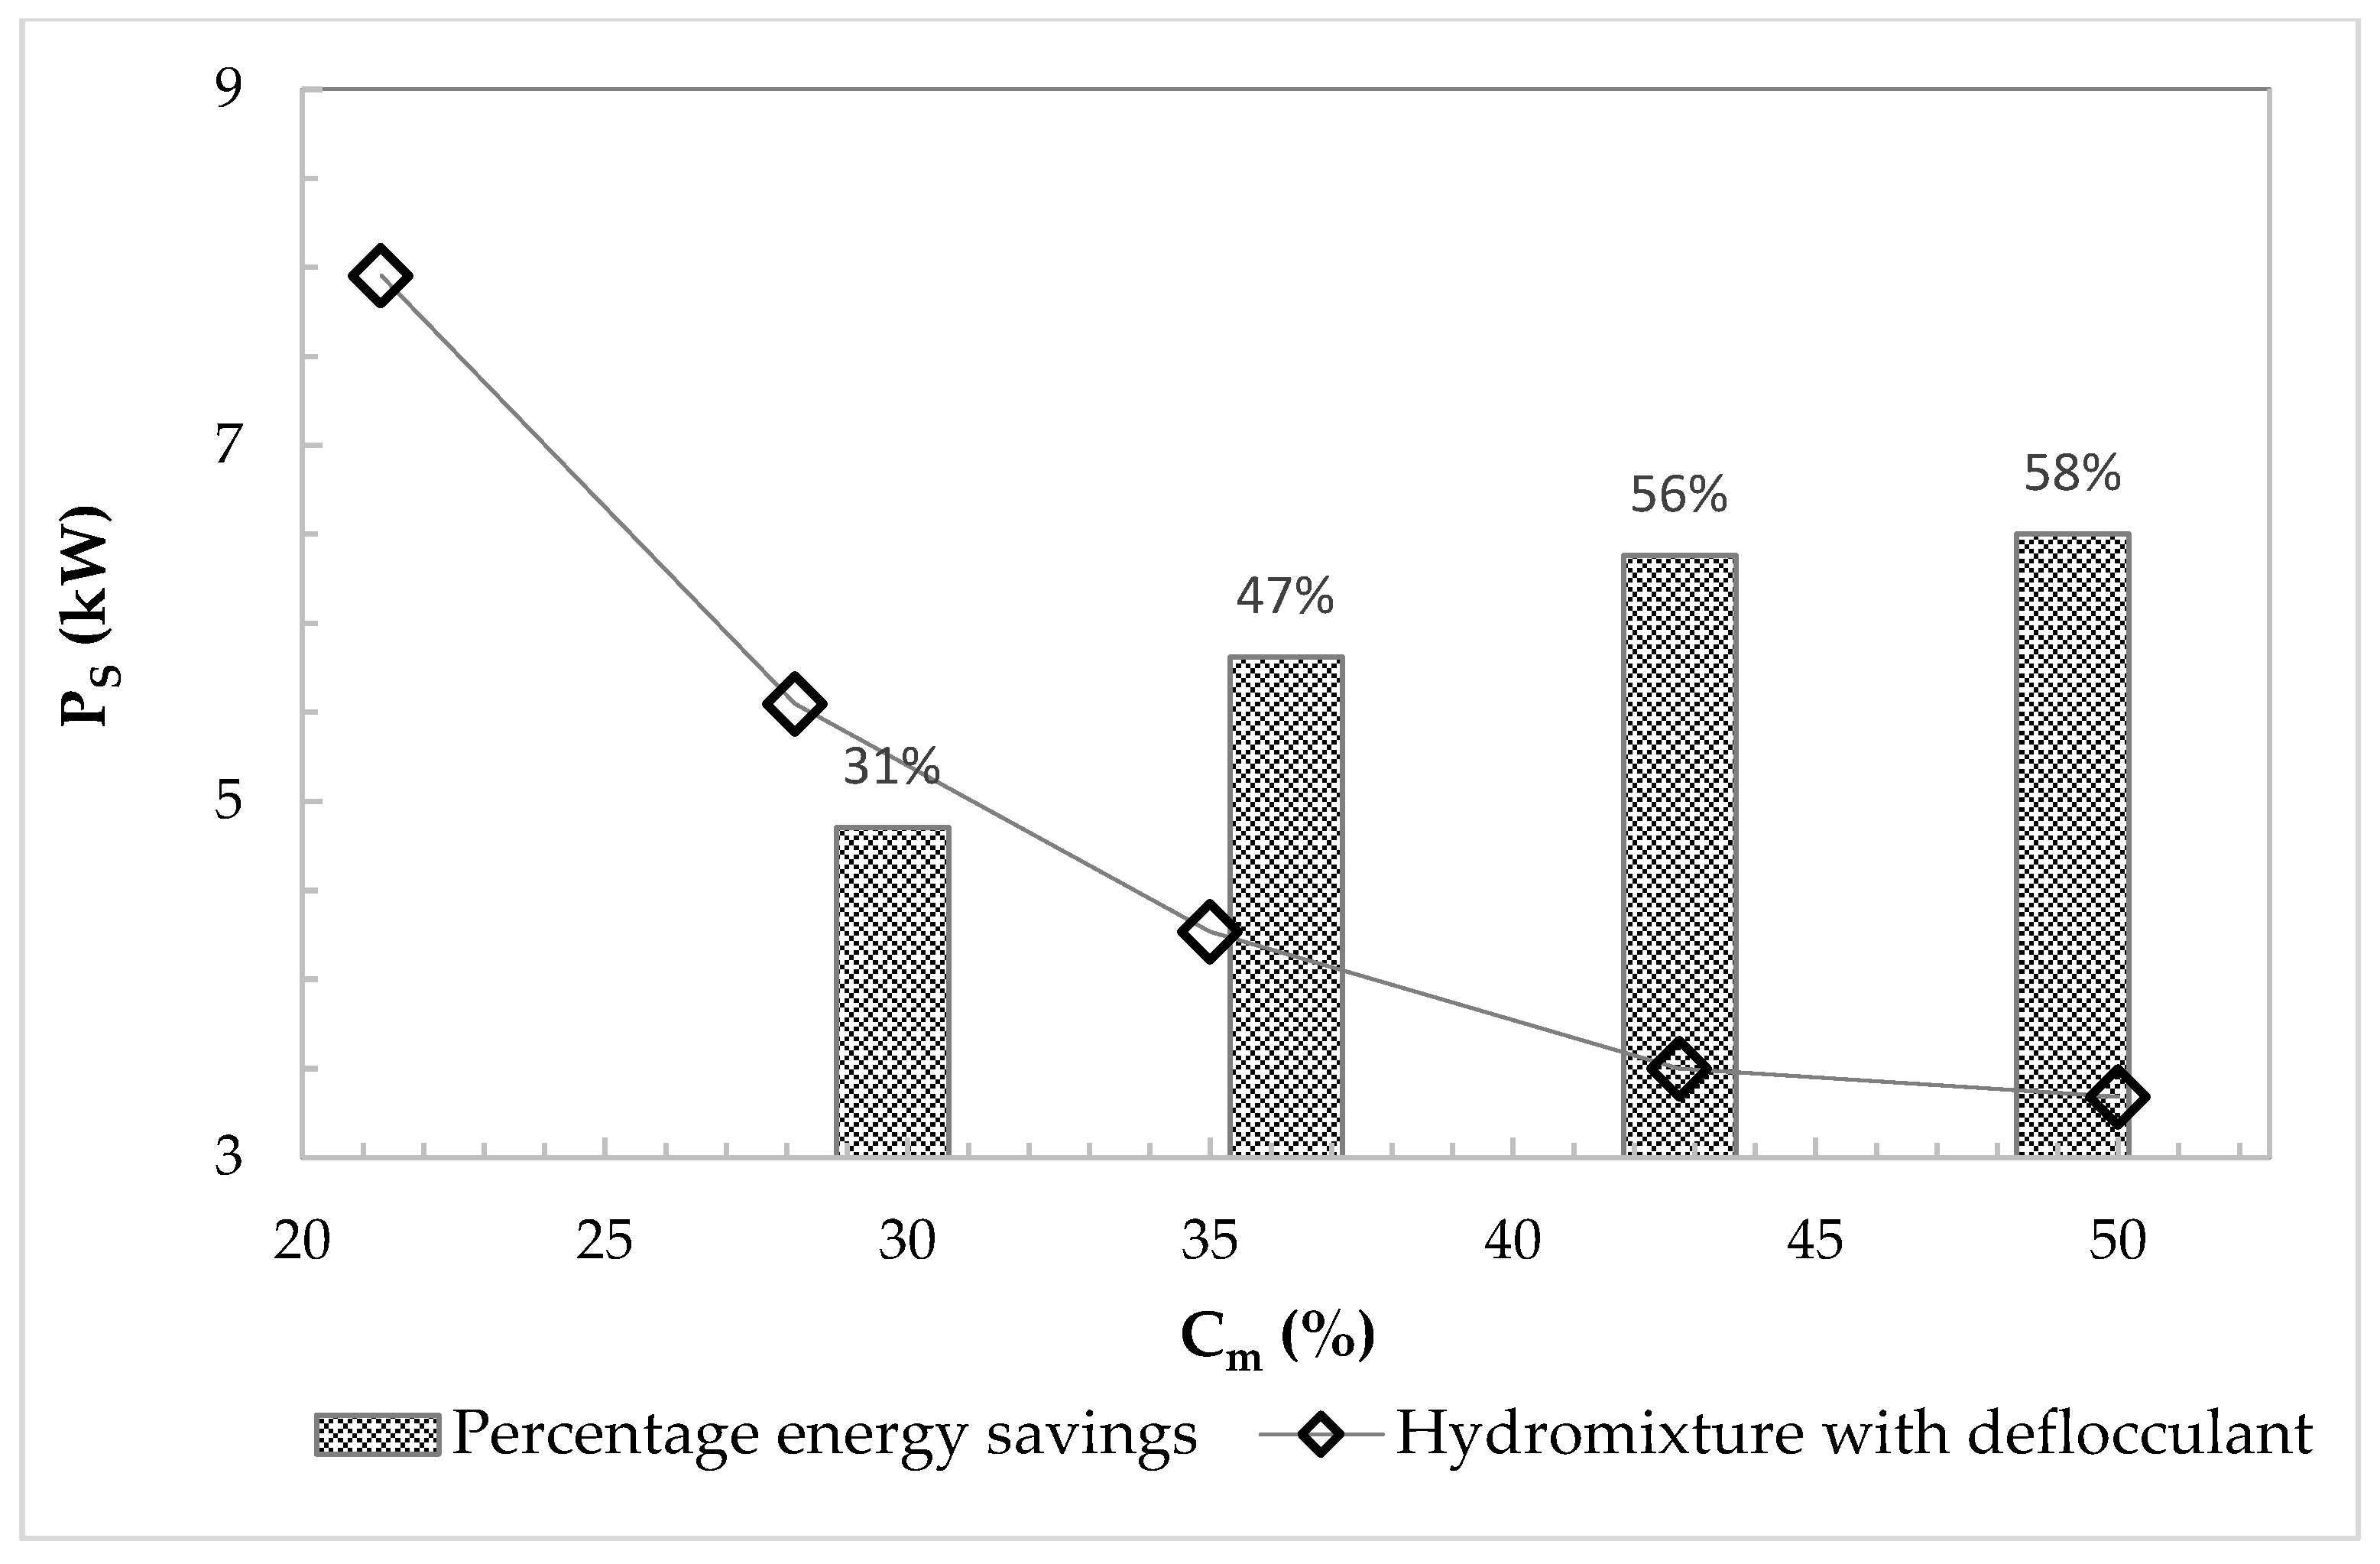
Figure 5 presents the electricity consumption during pumping of the hydromixture with the addition of deflocculant as a function of the mass concentration of the hydromixture. The maximum energy savings is 58% over the transport of basic hydromixture with the concentration of 21.30% by mass.
4. Discussion
The basis for the calculation of the pressure drop during the transportation of hydromixture in a pipeline is a determination of the rheological properties of tested hydromixtures.
The results of rheological behaviour measurements of hydromixture with different mass concentrations were described by the Bingham plastics model in the shear rate range from about 8–10 s−1 to 100 s−1 with high accuracy (98–99%), which confirms that the studied hydromixtures were shear-thinning non-Newtonian fluids with a yield stress. For all the tested hydromixtures, decreases in viscosity with increasing shear rate were observed.
Calculations of the friction factors of the analyzed hydromixtures in a 200 mm diameter pipeline was performed using Equations (5), (7) and (9). The friction factor values in the range of laminar flow calculated from Equations (5) and (9) were almost identical. Similarly, the friction factor values for the turbulent flow of non-Newtonian liquid calculated from Equations (7) and (9) were also very similar. In the paper, the possibility of friction factor calculating for non-Newtonian fluids in large diameter pipelines in turbulent flow using both Equations (7) and (9) is confirmed. The calculated friction factors of the hydromixtures in a pipeline of 200 mm diameter and 632 m length confirmed that the addition of deflocculant affects the reduction of friction factors for all the analyzed hydromixtures. Therefore, it was possible to pump hydromixtures with higher solids concentrations, resulting in significant energy savings in their hydrotransport and reduced water consumption in the limestone hydromixture transport process.
The positive effect of using a deflocculant in the transport of the hydromixture occurring in the analyzed pipeline has an influence on the increase in the efficiency of the whole production process. The additional effect that increases the efficiency of the hydromixture transport process is the reduction of the amount of water used in the pumping process, which improves environmental protection by reducing the amount of burdensome slurry. As a result, the estimated operating cost of the industrial installation of hydromixture transportation in a pipeline is significantly reduced.
5. Conclusions
The paper presents a new possible method of hydromixture transportation in pipelines, enabling significant energy savings in such transportation. This effect was achieved by using an additive of deflocculant, whose composition was self-developed and contains environmentally neutral mineral particles. The proposed method, except for the energy savings, reduces the amount of water used in such transportation, thus reducing the amount of burdensome slurries, which is an additional ecological aspect of the proposed method.
Author Contributions
Conceptualization, B.J.-J. and M.D.; methodology, B.J.-J.; software, B.J.-J.; validation, M.D.; formal analysis, B.J.-J.; investigation, B.J.-J.; resources, B.J.-J.; data curation, B.J.-J.; writing—original draft preparation, B.J.-J.; writing—review and editing, M.D.; visualization, B.J.-J.; supervision, M.D.; project administration, B.J.-J.; funding acquisition, B.J.-J. All authors have read and agreed to the published version of the manuscript.
Funding
This research received no external funding.
Data Availability Statement
Not applicable.
Acknowledgments
The chemical composition of calcareous groats analysis was performed using a scanning electron microscope integrated with an energy-dispersive X-ray spectrometer (EDS) at the Institute of Physics at the Silesian University of Technology.
Conflicts of Interest
The authors declare no conflict of interest.
Nomenclature
| a | parameter given by Equation (8) |
| Cm | mass concentration of hydromixture, (%) |
| Cv | volume concentration of hydromixture, (%) |
| d | pipe diameter, (m) |
| DFL | deflocculant |
| friction factor for Bingham plastic fluids |
| fL | friction factor for laminar flow |
| fT | friction factor for turbulent flow |
| total length of a pipeline, (m) |
| m | parameter given by Equation (10) |
| Hedström number |
| critical value of Reynolds number |
| Pw | power at the pump shaft, (W) |
| PS | power consumption of the motor driving the pump, (W) |
| volumetric flow rate, (m3/h) |
| mean flow velocity, (m/s) |
| Greek letters |
| difference in level between the pump inlet and the pipeline outlet, (m) |
| pressure drop, (Pa) |
| flow pressure drop due to friction, (Pa) |
| pump efficiency, (%) |
| plastic viscosity, (Pa∙s) |
| friction factor |
| density of hydromixture, (kg/m3) |
| τ | shear stress, (Pa) |
| τy | yield stress, (Pa) |
| shear rate, (s−1) |
| φc | parameter calculated from Equation (4) |
References
- Newitt, D.M.; Richardson, J.F.; Abbot, M.; Turtle, R.B. Hydraulic Conveying of Solids in Horizontal Pipes. Trans. Inst. Chem. Eng. 1955, 33, 93–110. [Google Scholar]
- Parzonka, W.; Kenchington, J.M.; Charles, M.E. Hydrotransport of solids in horizontal pipes: Effects of solids concentration and particle size on the deposit velocity. Can. J. Chem. Eng. 1981, 59, 291–296. [Google Scholar] [CrossRef]
- Shrikant Dhodapkar, K.J.; Shenggen, H. Fluid-Solid Transport in Ducts. In Multiphase Flow Handbook; Clayton, T.C., Ed.; Taylor and Francis Group: London, UK, 2006; Chapter 4; pp. 1–101. [Google Scholar]
- Chhabra, R.P.; Richardson, J.F. Non-Newtonian Flow and Applied Rheology, 2nd ed.; Butterworth-Heinemann: Oxford, UK, 2008; pp. 111–123, 142–148. [Google Scholar]
- Abd Al Aziz, A.I.; Mohamed, H.I. A Study of the Factors Affecting Transporting Solid—Liquid Suspension through Pipelines. Open J. Fluid Dyn. 2013, 3, 152–162. [Google Scholar] [CrossRef][Green Version]
- Matousek, V. Pressure drops and flow patterns in sand-mixture pipes. Exp. Therm. Fluid Sci. 2002, 26, 693–702. [Google Scholar] [CrossRef]
- Hashemi, S.A.; Wilson, K.C.; Sanders, R.S. Specific energy consumption and optimum operating condition for coarse-particle slurries. Powder Technol. 2014, 262, 183–187. [Google Scholar] [CrossRef]
- Wu, J.; Graham, L.; Wang, S.; Parthasarathy, R. Energy efficient slurry holding and transport. Miner. Eng. 2010, 23, 705–712. [Google Scholar] [CrossRef]
- Edelin, D.; Czujko, P.C.; Castelain, C.; Josset, C.; Fayolle, F. Experimental determination of the energy optimum for the transport of floating particles in pipes. Exp. Therm. Fluid Sci. 2015, 68, 634–643. [Google Scholar] [CrossRef]
- Ihle, C.F. The least energy and water cost condition for turbulent, homogeneous pipeline slurry transport. Int. J. Miner. Process. 2016, 148, 59–64. [Google Scholar] [CrossRef]
- Shook, C.A.; Roco, M.C. Slurry Flow. Principles and Practice; Butterworth-Heinemann: Oxford, UK, 1991; p. 35. [Google Scholar]
- Jurban, B.A.; Zurigat, Y.H.; Goosen, M.F.A. Drag Reducing Agents in Multiphase Flow Pipelines: Recent Trends and Future Needs. Pet. Sci. Technol. 2005, 23, 1403–1424. [Google Scholar]
- He, M.; Wang, Y.; Forssberg, E. Parameter studies on the rheology of limestone slurries. Int. J. Miner. Process. 2006, 78, 63–77. [Google Scholar] [CrossRef]
- Deckers, J.; Vleugels, J.; Kruth, J. Additive Manufacturing of Ceramics: A Review. J. Ceram. Sci. Technol. 2014, 5, 245–260. [Google Scholar]
- Silva, R.; Garcia, F.A.P.; Faia, P.M.G.M.; Rasteiro, M.G. Settling Suspensions Flow Modelling: A Review. Powder Part. J. 2015, 32, 41–56. [Google Scholar] [CrossRef]
- Dziubiński, M. A general correlation for two-phase pressure drop in intermittent flow of gas and non-Newtonian liquid mixtures in a pipe. Chem. Eng. Res. Des. 1995, 73, 529–534. [Google Scholar] [CrossRef]
- Chhabra, R.; Dziubiński, M. Predicting two phase pressure drop for the flow of gas/non-Newtonian liquid mixtures in horizontal pipes. Int. J. Fluid Mech. 1989, 2, 63–69. [Google Scholar]
- Richardson, J.F.; Dziubiński, M. Two-phase flow of gas and non-Newtonian liquids in horizontal pipes. Superficial gas velocity for maximum power saving. J. Pipelines 1985, 5, 107–111. [Google Scholar]
- Vlasak, P.; Chara, Z.; Konfrst, J.; Krupicka, J. Distribution of concentration of coarse particle-water mixture in horizontal smooth pipe. Can. J. Chem. Eng. 2016, 94, 1040–1047. [Google Scholar] [CrossRef]
- Naveh, R.; Tripathi, N.M.; Kalman, H. Experimental pressure drop analysis for horizontal dilute phase particle-fluid flows. Powder Technol. 2017, 321, 355–368. [Google Scholar] [CrossRef]
- Darby, R.; Melson, J.M. A Friction Factor Equation for Bingham Plastic Slurries and Suspensions for All Flow Regimes. Chem. Eng. 1981, 59–61. [Google Scholar]
- Darby, R. Predict Friction Loss in Slurry Pipes. In Chemical Engineering; ABI/I-NFORM Global: New York, NY, USA, 1992; p. 116. Available online: https://www.researchgate.net/publication/292650993_Predict_friction_loss_in_slurry_pipes (accessed on 29 March 2022).
- Chhabra, R.P.; Farooqi, S.I.; Richardson, J.F. Isothermal two-phase flow of air and aqueous polymer solutions in a smooth horizontal pipe. Chem. Eng. Res. Des. 1983, 62, 22–32. [Google Scholar]
- He, M.; Wang, Y.; Forssberg, E. Slurry rheology in wet ultrafine grinding of industrial minerals: A review. Powder Technol. 2004, 147, 94–112. [Google Scholar] [CrossRef]
- Wang, Y.; Yu, B.; Zakin, J.L.; Shi, H. Review on Drag Reduction and Its Heat Transfer by Additives. Adv. Mech. Eng. 2011, 8749. [Google Scholar] [CrossRef]
- Zhou, Y.B.; Xu, N.; Ma, N.; Li, F.C.; Wei, J.J.; Yu, B. On Relationships among the Aggregation Number, Rheological Property, and Turbulent Drag-Reducing Effect of Surfactant Solutions. Adv. Mech. Eng. 2011, 345328. [Google Scholar] [CrossRef]
- Matras, Z.; Kopiczak, B. Intensification of drag reduction effect by simultaneous addition of surfactants and high molecular polymer into the solvent. Chem. Eng. Res. Des. 2015, 96, 35–42. [Google Scholar] [CrossRef]
- Sikorski, C.F.; Lehman, R.L.; Shepherd, J.A. The effects of viscosity reducing chemical additives on slurry rheology and pipeline transport performance for various mineral slurries. In Proceedings of the Seventh International Technical Conference on Slurry Transportation, Nevada, NV, USA, 23–26 March 1982. [Google Scholar]
| Publisher’s Note: MDPI stays neutral with regard to jurisdictional claims in published maps and institutional affiliations. |
© 2022 by the authors. Licensee MDPI, Basel, Switzerland. This article is an open access article distributed under the terms and conditions of the Creative Commons Attribution (CC BY) license (https://creativecommons.org/licenses/by/4.0/).


