Article

Height Prediction and 3D Visualization of Mining-Induced Water-Conducting Fracture Zone in Western Ordos Basin Based on a Multi-Factor Regression Analysis

1
College of Earth Science and Engineering, Shandong University of Science and Technology, Qingdao 266590, China
2
Shandong Provincial Key Laboratory of Depositional Mineralization & Sedimentary Mineral, Shandong University of Science and Technology, Qingdao 266590, China
3
Shuifa Planning and Designing Co., Ltd., Jinan 250100, China
4
Hebei Coal Research Institute Corporation Co., Ltd., Xingtai 054000, China
5
Ningxia Coal Science and Technology Research Institute Co., Ltd., Ningxia 750004, China
*
Author to whom correspondence should be addressed.
Energies 2022, 15(11), 3850; https://doi.org/10.3390/en15113850
Submission received: 11 April 2022 / Revised: 16 May 2022 / Accepted: 17 May 2022 / Published: 24 May 2022
(This article belongs to the Topic Green Mining)

Abstract

:
The mining-induced water-conducting fracture zone (WCFZ) plays a critical role in roof water damage prevention and ecological protection. The measured heights of the WCFZ were collected from 52 working faces or boreholes in the Ordos Basin mining area. Four factors influencing the mining-induced height of the WCFZ, i.e., mining thickness, proportion coefficient of hard rock, working width, and mining depth, were analyzed. The optimal unitary function model of each factor and the height of the WCFZ were obtained through single-factor analysis. The grey correlation method and fuzzy ordered binary comparison method were used to determine the comprehensive weight, and the weighted improved multiple regression model was obtained by combination and iteration. The relative error of the model was basically controlled within 10%. Finally, taking the Qingshuiying Coalfield as an application case, we predicted the mining-induced height of the WCFZ by using the new prediction model. The spatial distribution characteristics of the WCFZ were analyzed by the geographic information system. In addition, Groundwater Modeling System (GMS) software was used to build a 3D structure model of WCFZ height to visualize the spatial distribution rules of the WCFZ. The results showed that the height of the WCFZ can be predicted quantitatively by this new method, and the visualization of the WCFZ can be realized. The proposed method effectively analyzes and predicts the mining-induced height of the WCFZ so that water gushing risks from overlying aquifers can be prevented or mitigated in mines.

1. Introduction

With the exhaustion of coal resources in eastern China, large coal production bases have gradually been moved to the western regions [1]. The ecological environment in western China is fragile, and the exploitation of coal resources can easily lead to the geological problems of the ecological environment [2,3,4]. Coal measure strata belong to weakly cemented rock with poor mechanical properties. The WCFZ in the roof of coal seam mining has a large mining-induced height, which poses a water inrush risk [5,6,7]. Therefore, accurate prediction of the mining-induced height of the WCFZ and accurate exploration of the hydraulic connection between the WCFZ and the overlying aquifer are among the most urgent problems in the western mining area.
The WCFZ is the failure zone of the overlying strata in coal mining and is one of the critical index factors to judge the water inrush in the roof. A large amount of observational data show that the overburden failure and displacement zoning of coal seam mining are apparent. According to the theory of “three top zones,” the overlying formation can be divided into the fracture zone, caving zone, and curved belt. Because both the caving zone and fracture zone can direct water vertically, they are usually referred to as the WCFZ together. The combination of the two zones is the height of the mining-induced WCFZ [8]. The water inrush condition of the coal roof is determined by the development height of the WCFZ and the water-rich condition of the overlying strata. Only when the WCFZ connects the overlying water-rich aquifer can the conditions of roof water inrush occur [9,10,11].
Field measurement is the most direct and reliable method to obtain the height of the WCFZ. Because of its high cost and long time consumption, field measurements are often used to verify predicted results [12]. The prediction methods include the empirical formula, similar material simulation, numerical simulation, analogy analysis, and critical layer theory [13,14,15,16]. Among them, the empirical formula method based on measured data fitting is the most commonly used method to predict the height of the WCFZ. Xiang et al. (2020) obtained the height prediction formula of the WCFZ in the western mining area of China by multiple linear regression fitting and applied it to the 12511 working faces of Bulianta Coal Mine [17]. Xiaoshen et al. (2021) took 112201 working faces of Xiaobaodang Coal Mine as an example. In situ measurements, including fluid leakage, borehole TV, and similar simulations, were used to analyze the development regularity of the regional WCFZ [18]. Based on the analysis of mine exploration data, Gusev et al. (2018) presented a prediction scheme for determining the height of the WCFZ in salt formations with clay layers [19]. Based on the data processing system (DPS), Xiaobin et al. (2021) analyzed the factors influencing the height development of the WCFZ, introduced the sensitivity coefficient to establish a mathematical model, and proposed a formula for predicting the height of the WCFZ [20]. Yu et al. (2019) proposed the prediction equation of the WCFZ of soil-rock composite overburden [21]. They adopted the running water quantity of boreholes monitoring and distributed optical fiber sensing (DOFS) technology to conduct in situ measurements of the WCFZ height. Based on elastic foundation beam theory, Yun et al. (2018) studied the development mechanism of an overburden WCFZ in short-wall block filling mining in northwest China and established a height prediction model for an overburden WCFZ [22]. Tingen et al. (2020) studied the calculation method of the WCFZ height of Jurassic coal seam mining in northern Shaanxi based on the plate and shell theory and carried out experiments in the Jinjitan Coal Mine [23]. However, in the past, most attention has been paid to the prediction of the development height of the WCFZ, while the spatial distribution of the WCFZ and its spatial position relationship with the overlying water-rich strata have been ignored.
In this paper, we collected the measured heights of the WCFZ from 52 working faces or boreholes in the Ordos Basin mining area. Based on the comprehensive analysis of the coal mining method, mining thickness, proportion coefficient of hard rock, working width, and mining depth, the Statistics Package for Social Science (SPSS) software was used for single factor optimal regression analysis. The grey correlation method and fuzzy ordered binary comparison method were combined to obtain the combined weight values of each main control factor. Finally, the improved multivariate nonlinear regression model of the height of the WCFZ was obtained by using the numerical iteration method. The model was verified with five mining working faces in the study area, and the error analysis was compared with the calculation results of the empirical formula. Finally, the model was applied to Qingshuiying Coalfield. The safety partition of a roof crack in the study area was obtained from borehole data, and the 3D visual structure model of the WCFZ was constructed by GMS software. The aim was to provide a more accurate and reliable method for predicting and evaluating the height of the WCFZ in coal seam mining under similar conditions. It is of great significance to environmental protection, water conservation, and coal mining in an ecological fragile mining area.

2. Height Measurement of WCFZ in Western Ordos Basin

Due to the complexity and uncertainty of the geological structure and in situ stress changes in the rock mass in coal mining, the prediction of the height of the WCFZ is beyond the traditional investigation of hydrogeological conditions and geological structure. The height of the WCFZ in the roof of the coal seam is not influenced by a single factor but many factors. Researchers concluded that the factors affecting the height of the WCFZ are mainly as follows: mining method, mining thickness, coal seam angle, roof strata strength, roof strata combination structure, mining depth, and working width [17,19,24,25].
This paper studies the height prediction of the WCFZ in the western mining area of Ordos Basin. The location of the study area is shown in Figure 1. The measured height of the WCFZ is summarized in Table 1. In the Jurassic coal seam mining of Ordos Basin, most of them are thick and extra-thick coal seams with near-horizontal and gently inclined beddings. “Fully mechanized caving mining” is the main coal mining method in this area, and the influence of coal seam angle on the height of the WCFZ can be ignored in this study.
The stratum in the study area belongs to weakly consolidated rock, the coarse, medium, and fine clastic particles play the role of skeleton, and the clastic particles are mainly quartz, feldspar, and debris. The particles are filled with clay minerals, and the cementation modes are contact cementation and mosaic cementation, with weak cementation. The hardness of sandstones mainly depends on clastic grains in the study area. Because it is difficult to quantify the roof strata strength and strata combination structure, we refer to the proportion coefficient of hard rock (b) as an approximate substitute for roof strata. The proportion coefficient of hard rock (b) refers to the ratio of the accumulated thickness of hard rock in the mining influence range above the roof to the mining influence range. The hard rock refers to fine sandstone, medium sandstone, and coarse sandstone. It is generally considered that 15 to 20 times the coal thickness is the most significant influence range of coal mining. Therefore, we selected 15 to 20 times the coal thickness as the mining influence range [26,27]. The equation is as follows:
b = h ( 15 ~ 20 ) M
where M is the mining thickness; ∑h is the accumulated thickness of hard rock strata within the mining influence range.
Based on this, the influencing factors of the height of the WCFZ in this paper are mining thickness, proportion coefficient of hard rock, mining depth, and working width.

3. Univariate Regression Analysis

Based on the collected data of the WCFZ height and index factors (Table 1), SPSS software was first used for single factor regression analysis.

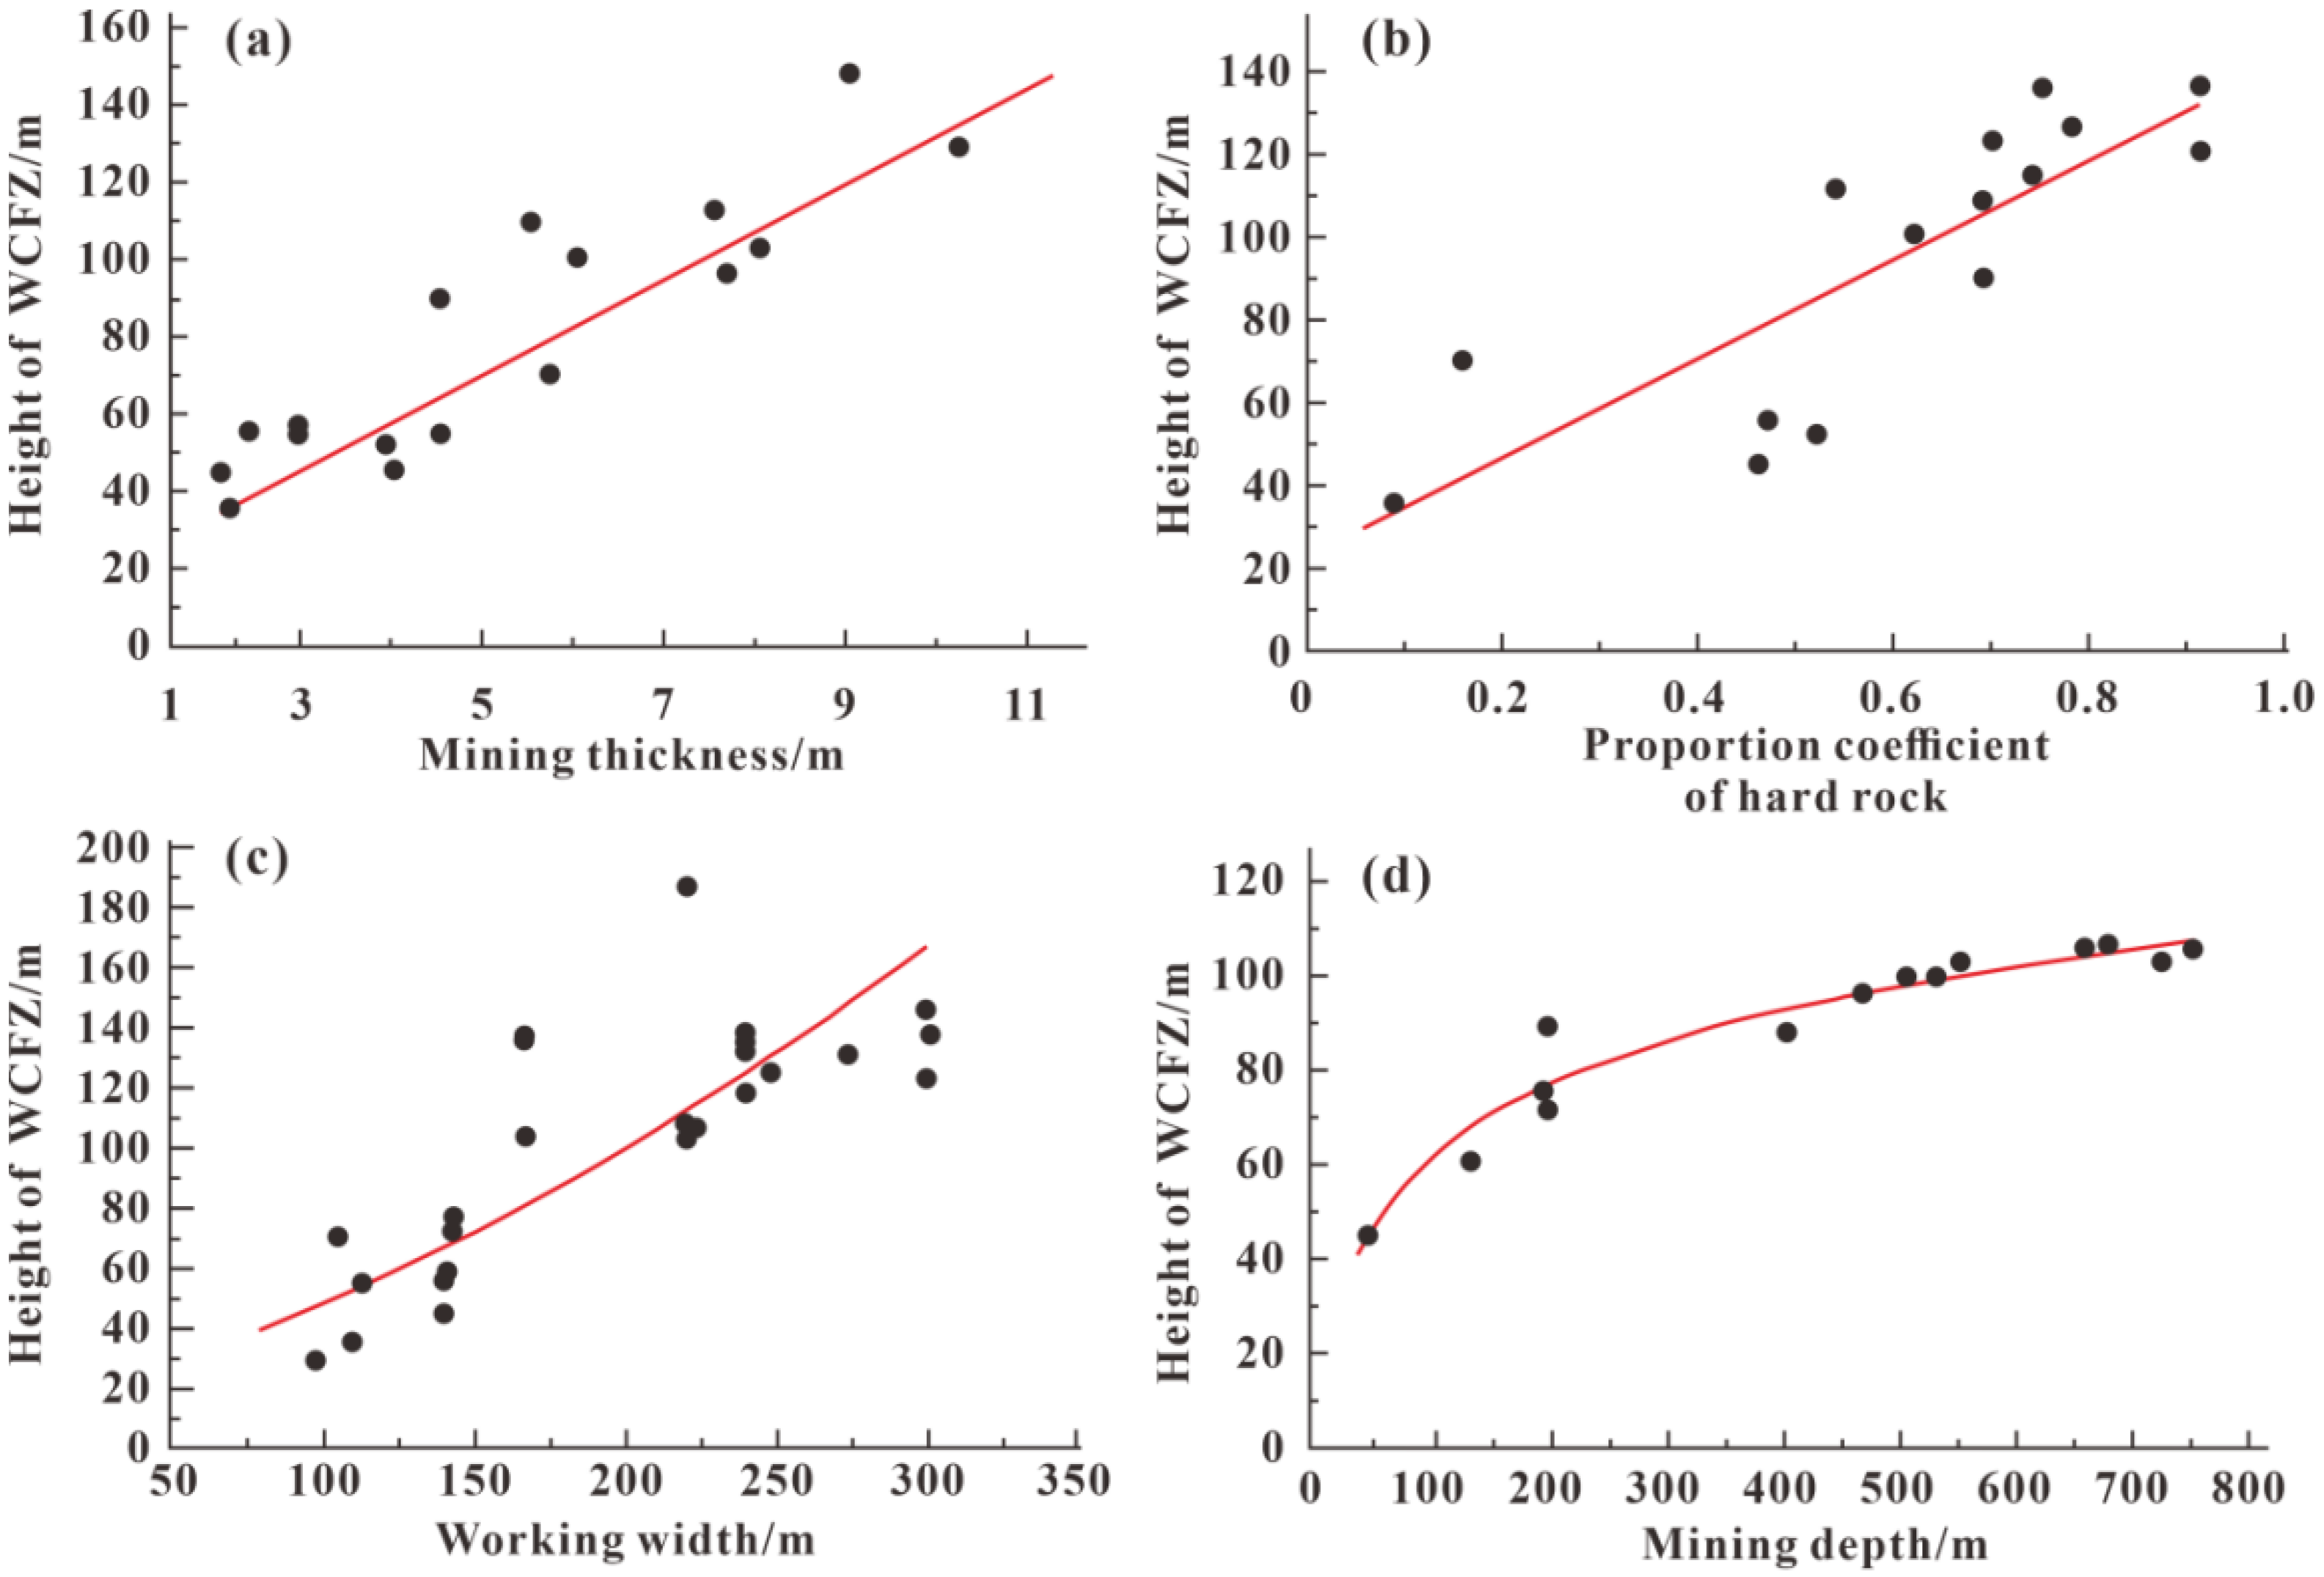
3.1. Mining Thickness (M)

The relationship between the height of the mining-induced WCFZ and the mining thickness is shown in Figure 2a. The correlation coefficients of the optimal unitary function model are compared in Table 2. The linear equation (R2 = 0.863) was taken as the optimal unitary function model.

3.2. Proportion Coefficient of Hard Rock (b)

The western mining area generally has no migmatite and igneous rock strata, so the proportion coefficient of hard rock mainly depends on the cumulative thickness of sandstone. Thicker sandstone indicates a greater proportion coefficient of hard rock. The relationship between the height of the WCFZ and proportion coefficient of hard rock is shown in Figure 2b. The correlation coefficients of the optimal unitary function model are compared in Table 2. The linear equation (R2 = 0.674) was taken as the optimal unitary function model.

3.3. Working Width (L)

The working face with similar mining thickness, the proportion coefficient of hard rock, and the mining depth were selected to study the relationship between the height of the WCFZ and working width, as shown in Figure 2c. The correlation coefficients of the optimal unitary function model are compared in Table 2. The S-shaped curve (R2 = 0.725) was taken as the optimal unitary function model.

3.4. Mining Depth (S)

The working face with similar mining thickness, the proportion coefficient of hard rock, and the working width were selected to study the relationship between the height of the WCFZ and mining depth, as shown in Figure 2d. The correlation coefficients of the optimal unitary function model are compared in Table 2. The logarithmic curve (R2 = 0.939) was taken as the optimal unitary function model.

4. Multiple Regression Analysis to Predict the Height of WCFZ

4.1. Grey Correlation Method

4.1.1. Construction of Comparative Sequence

The comparative sequence of factors affecting the system behavior is constructed [28,29,30,31]:
X i = ( X 1 , X 2 , X n ) = ( X 1 ( 1 ) X 2 ( 1 ) X n ( 1 ) X 1 ( 2 ) X 2 ( 2 ) X n ( 2 ) X 1 ( m ) X 2 ( m ) X n ( m ) )
where m is the number of indicators; X i = ( x i ( 1 ) , x i ( 2 ) ,   ,   x i ( m ) ) T , i = 1 , 2 , , n .

4.1.2. Determination of Optimal Reference Sequence

An ideal optimal reference sequence can be selected from the matrix constructed in Equation (3):
X 0 = ( x 0 ( 1 ) , x 0 ( 2 ) ,   ,   x 0 ( m ) )
In order to eliminate the differences caused by different units of factors, Equation (4) is adopted for the dimensionless processing of variables:
ξ i ( k ) = min i | x 0 ( k ) - x i ( k ) | + ρ max i | x 0 ( k ) - x i ( k ) | | x 0 ( k ) - x i ( k ) | + ρ max i | x 0 ( k ) - x i ( k ) |
where k = 1, 2… m and ρ is the resolution coefficient, which is 0.5.

4.1.3. Calculation of Correlation Degree

The correlation degree is calculated by reference sequence and comparison sequence:
r i = 1 m k = 1 m ξ i ( k )

4.1.4. Calculation of Weight of Each Factor

The weight of each factor is calculated according to formula:
ω i = r i i = 1 n r i
The final weight of each factor (wi) is obtained by combining the collected measured data of the height of the WCFZ and index factors, and it is presented in Table 3.

4.2. Fuzzy Ordered Binary Comparison Method

4.2.1. Consistency Sequencing

First, the factors are compared by the following method, such as bi and bk [32,33,34]:
If bi is more important than bk, then b i k = 0 , b k i = 1.0 ;
If bi is as important as bk, then b i k = 0.5 , b k i = 0.5 ;
If bi is less important than bk, then b i k = 0 , b k i = 1.0 ; where k = 1 , 2 , , m ; i = 1 , 2 , , m .
Thus, the m × m order qualitative sorting decision sequence of the importance of the index set is obtained:
B = [ b 11 b 12 b 1 m b 21 b 22 b 2 m b m 1 b m 2 b m m ]   meet   { b k i   i s   e i t h e r   0 ,   0.5 o r 1.0 b k i + b i k = 1.0 b k k + b i i = 0.5
According to Equation (8):
t i = j = 1 m b i j ,   t i ( i = 1 , 2 , , m )
The consistency qualitative order of each index is obtained, and the new index set is constructed from large to small:
A = ( a 1 , a 2 , , a m ) ,   t 1   >   t 2   > . . .   t m
A consistent qualitative decision table is established for each factor in this study (Table 4) in the order of ordinal importance: U = (U1, U2, U3, U4) = (mining thickness, proportion coefficient of hard rock, working width, mining depth).

4.2.2. Mood Operators and Relative Weights

The index that is ranked first is taken as the standard, and the comparison results with other indexes are described by modal adverbs of different degrees, namely fuzzy modal operators. Fully considering people’s discrimination ability and habits of thinking to distinguish similar things and the need for discrimination accuracy, we consider 11 mood operators, represented by a digital scale from I to XI. All scales and their corresponding weights are as follows: I (1.0), II (0.818), III (0.667), IV (0.538), V (0.429), VI (0.333), VII (0.250), VIII (0.176), IX (0.111), X (0.053), XI (0.0).

4.2.3. Ordered Binary Comparison and Quantization

For the index set A sorted by consistency, the binary comparison of adjacent indexes is made in turn. First, the fuzzy tone operator and relative weight value φ 12 of index a 2 are obtained by comparing index a 1 and a 2 . Then, taking a 2 as the criterion of ranking first, the fuzzy tone operator and relative weight value φ 23 of a 3 can be obtained by comparing index a 2 and a 3 . According to φ i j = φ i , t 1 φ t 1 , j , the weight of a 3 relative to a 1 is φ 13 = φ 12 φ 23 . In this way, the relative weight of each factor is gradually obtained. The relative weight value of the index obtained by binary comparison is normalized, and finally, the index centralization vector is obtained:
w j = ( w 1 , w 1 , , w m ) i = 1 m = 1
Table 3 presents the final weight of each factor (wj) that is obtained by combining the measured data of WCFZ height and index factors.

4.3. Comprehensive Weight Calculation

The weight of each factor wi obtained by the grey correlation method and the weight of each factor wj obtained by the fuzzy ordered binary comparison method are combined and improved to obtain the comprehensive weight wz (Table 3). Using wi and wj to represent wz linearly, the equation as follows:
w z = ( 1 α ) w i + α w j
where α is the proportion of the weight of the fuzzy ordered binary comparison method in the comprehensive weight [35]:
α = n n 1 [ 2 n ( w 1 + 2 w 2 + + n w n ) - n + 1 n ]

4.4. Model Determination

In this paper, the optimal unitary function model between the height of the WCFZ and the four main control factors obtained from the Section 2 analysis is as follows:
Mining thickness model:
H f = a 1 M + a 2
Proportion coefficient of hard rock model:
H f = k 1 b + k 2
Working width model:
H f = exp ( c 1 + c 2 L )
Mining depth model:
H f = t 1 ln S + t 2
where ai, ki, ci, and ti denote the hypothetical unknown number.
By substituting the comprehensive weight of each main control factor, the multivariate nonlinear regression equation is established as follows:
H f = 0.39 ( a 1 M + a 2 ) + 0.31 ( k 1 b + k 2 ) + 0.2 exp ( c 1 + c 2 L ) + 0.1 ( t 1 ln S + t 2 )
The multivariate nonlinear regression analysis is conducted and the coefficients of each main control factor are recalculated in Equation (17). Through combination and iteration, the multivariate nonlinear regression correction model for the height of the WCFZ is finally determined as follows:
H f = 4.0 M + 23.6 b + 0.2 e 5.2 470.7 L + 1.2 ln S + 7.8
The fitting degree of the model is R2 = 0.903.

5. Error Contrast Analysis

This paper selected Qingshuiying Coalfield, Meihuajing Coalfield, Jinfeng Coalfield, Lingxin Coalfield, and Hongliu Coalfield to verify the prediction accuracy of the model. For the purpose of the comparative error analysis, the “three under” rules [36] empirical formula was used to calculate the height of the WCFZ. The strata in the study area are weakly cemented rock, and the mechanical properties belong to the medium-hard rock strata. The height of the WCFZ was calculated by Equations (19) and (20):
H = 100 M 1.6 M + 3.6 ± 5.6
H = 20 M + 10
The calculated results of the prediction model and empirical formula were compared with the measured values for comparative error analysis in Table 5. Obviously, the height of the WCFZ predicted by the model in this paper was closer to the measured value. The relative error was mostly controlled within 10%. It showed that the height of the WCFZ predicted by this model is more consistent with the actual situation and can be applied to the research area.

6. Study Case

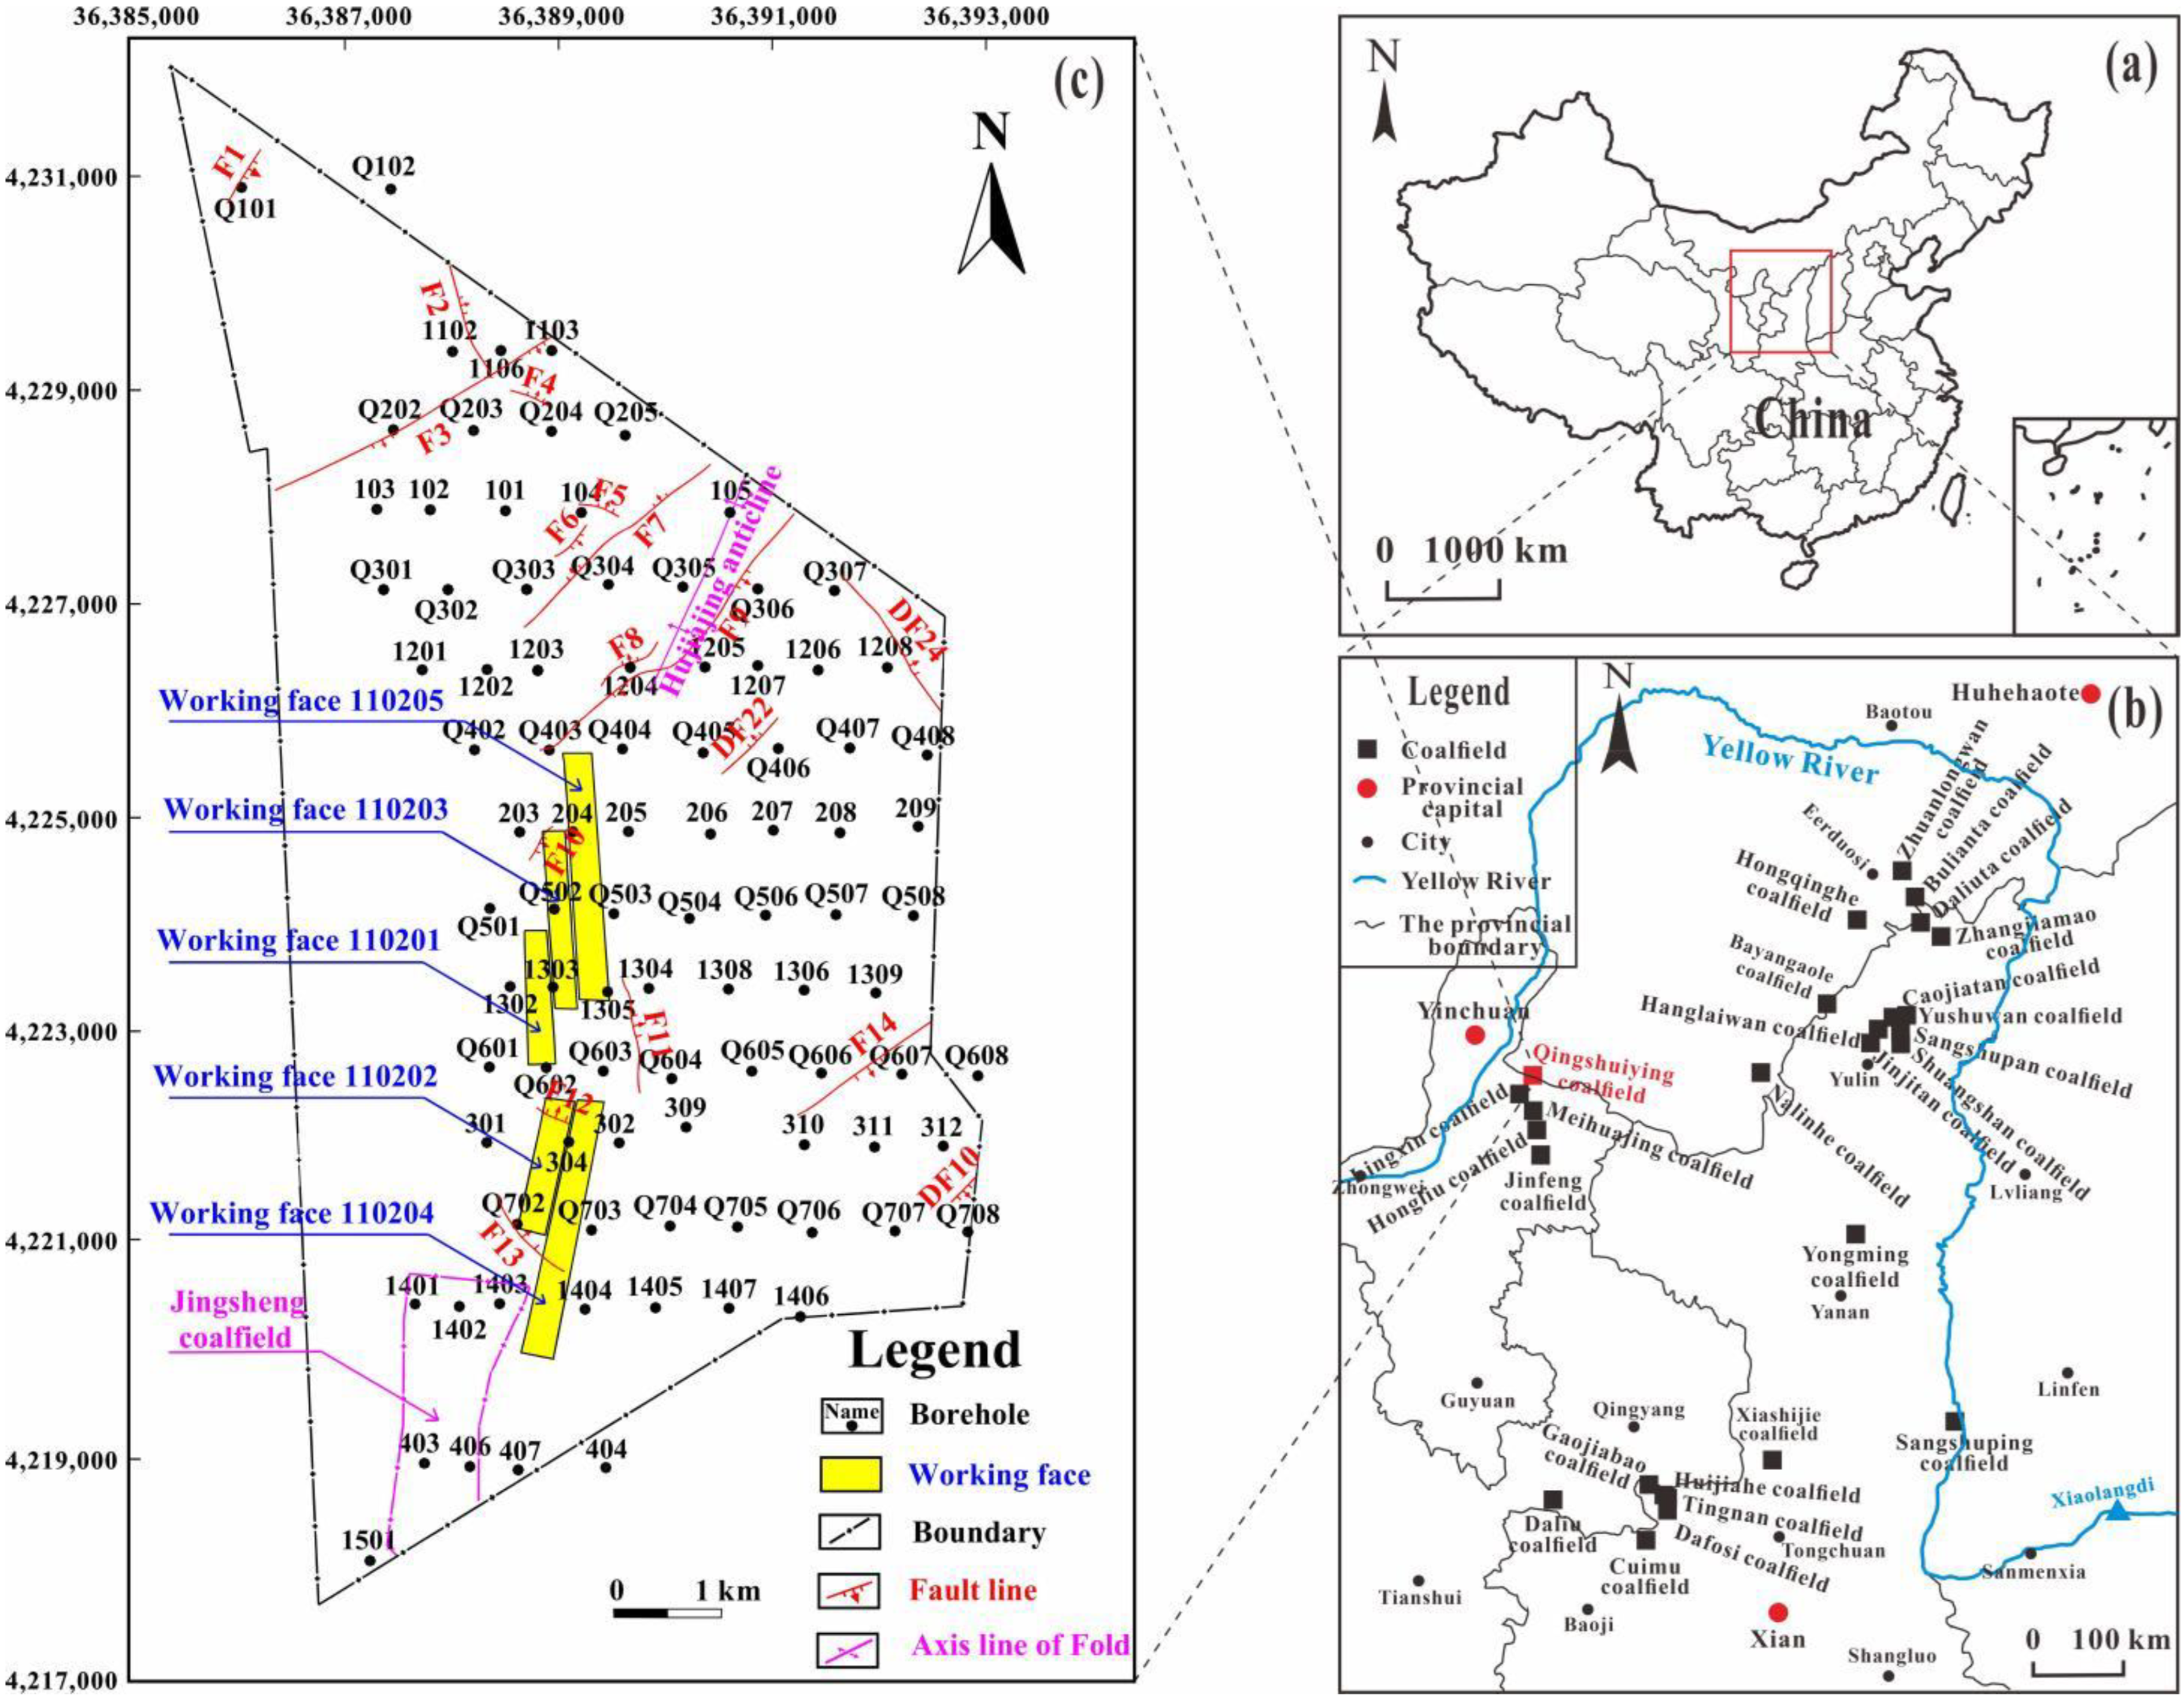
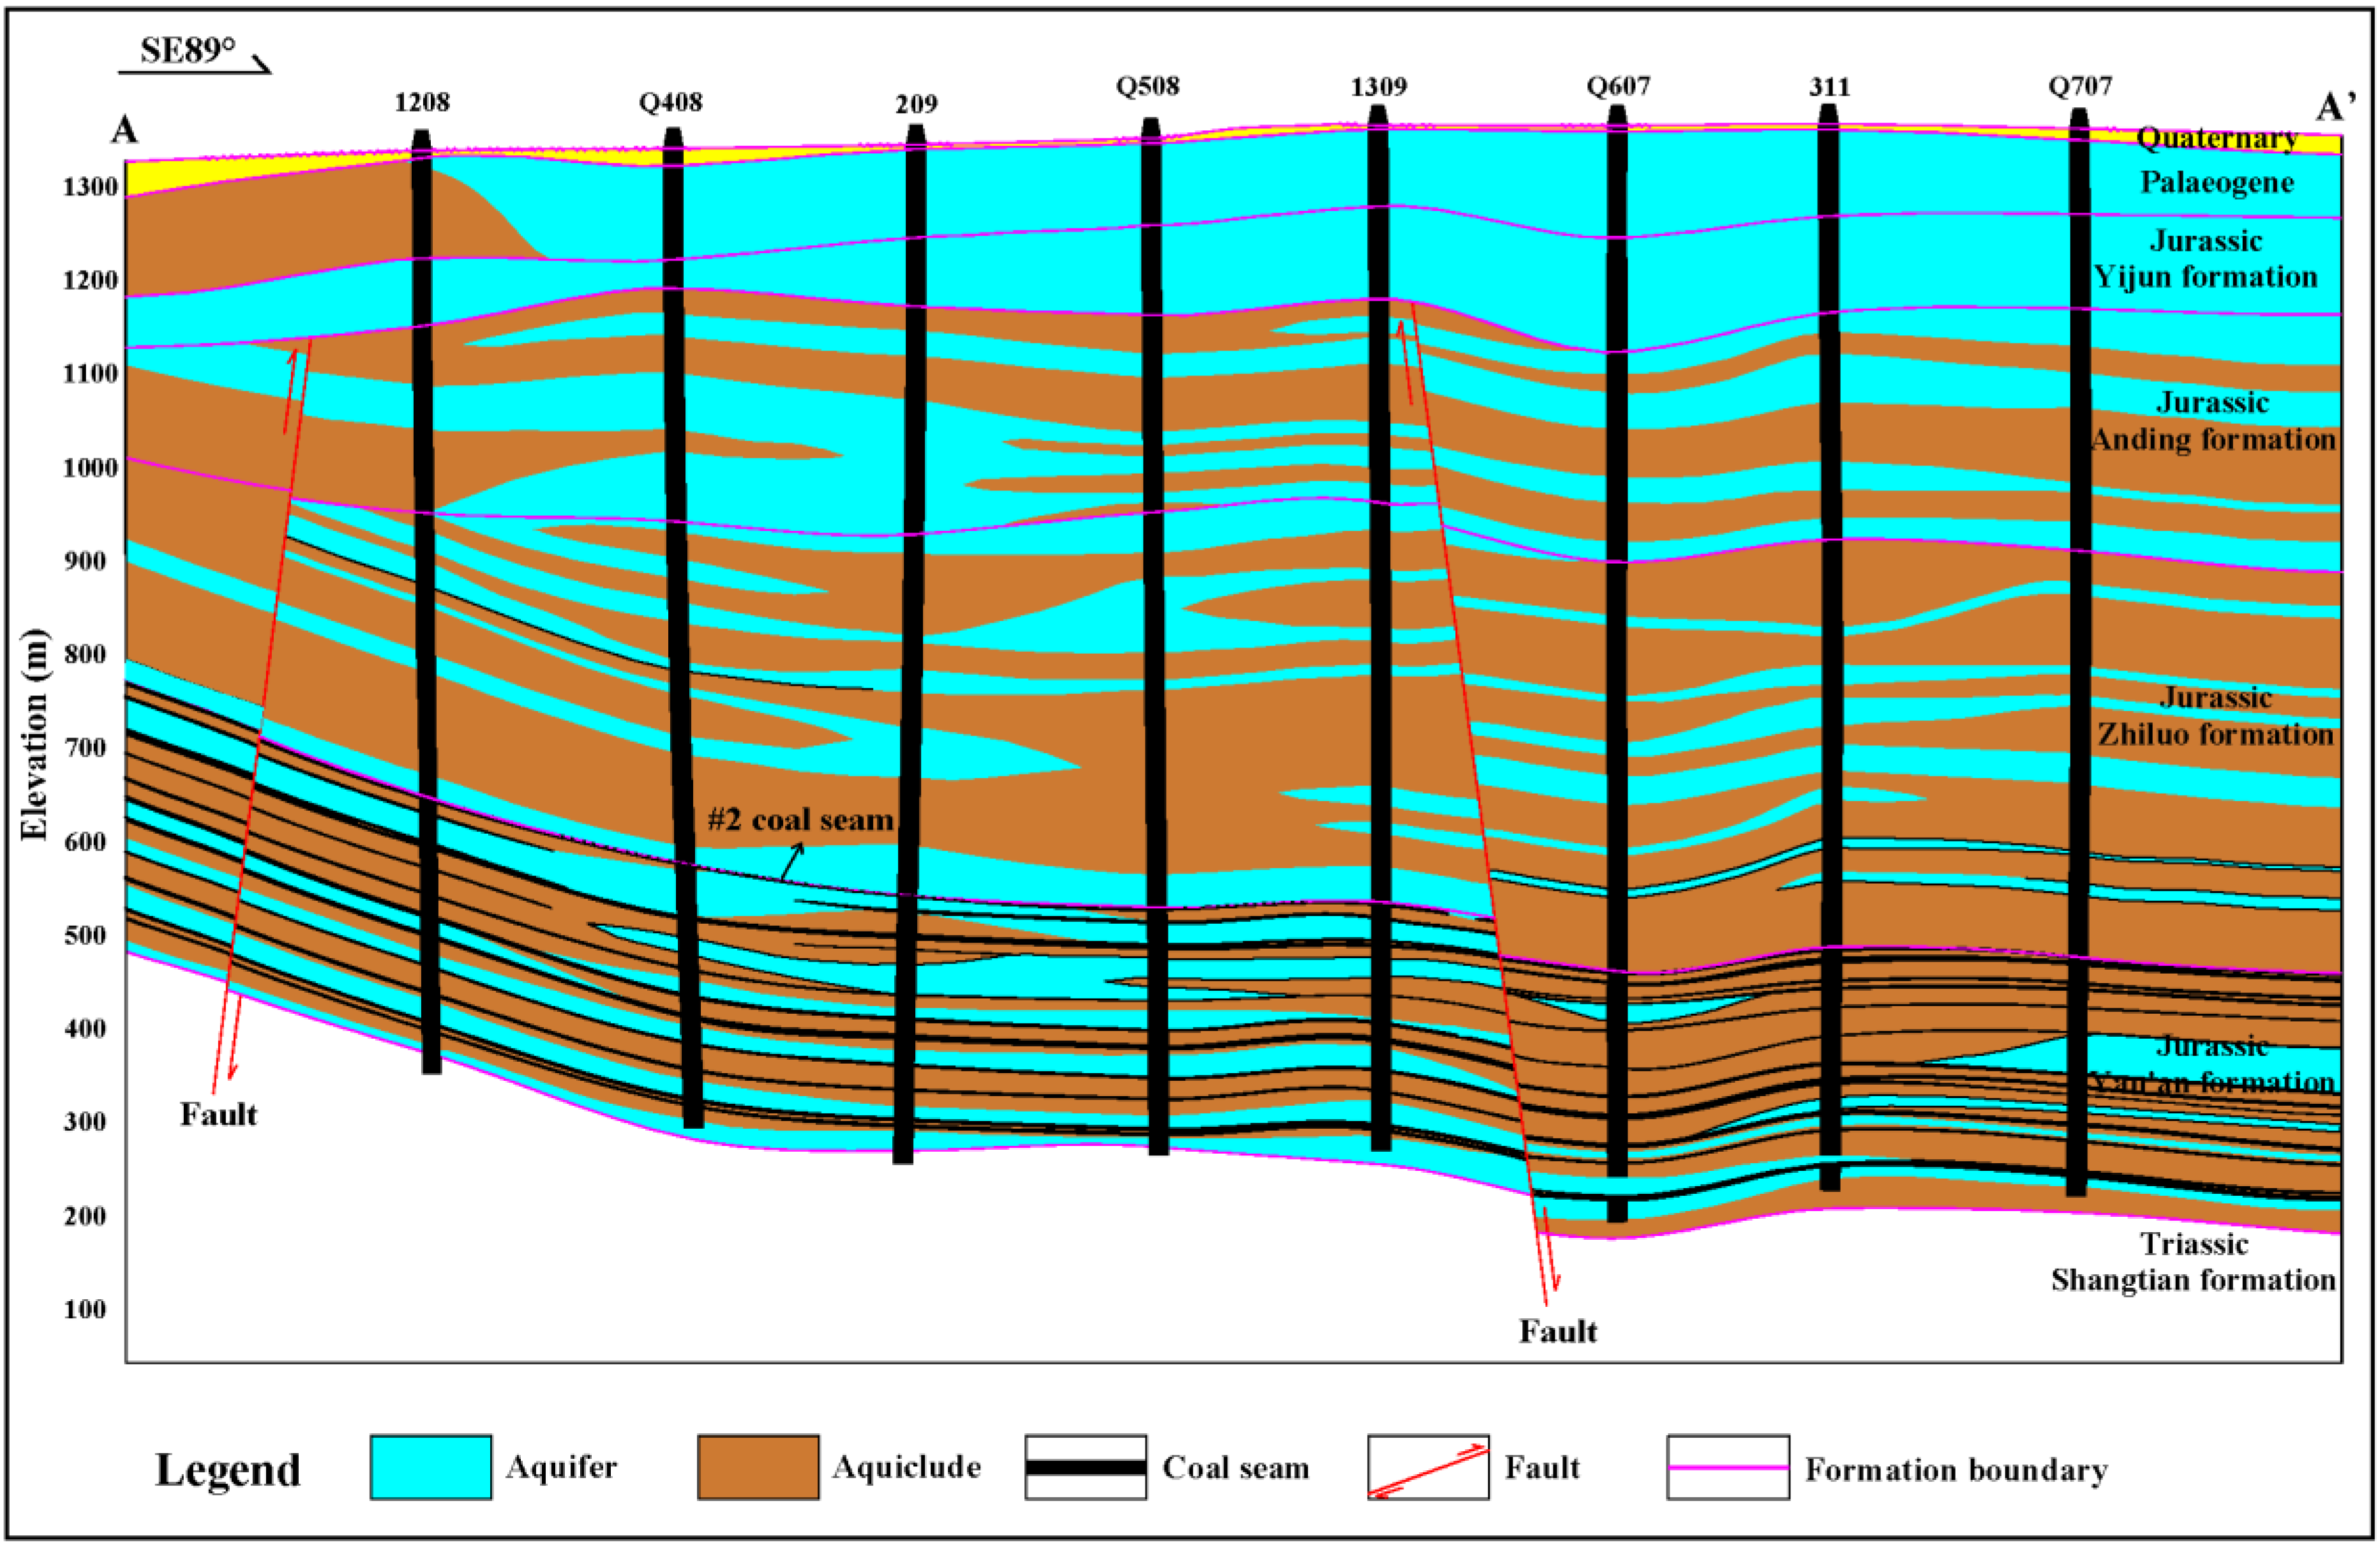
6.1. Overview of the Study Area

The study area is a Coalfield of Qingshuiying, located in the western Ordos Basin (Figure 1c). The study area has mined five working faces: 110201, 110202, 110203, 110204, and 110205. The coal is part of the Jurassic Yan’an Formation, and the main minable coal seam is #2 coal at the present stage. Figure 3 shows the typical hydrogeological profile of Qingshuiying Coalfield. The research objective is to determine the mining-induced height of the WCFZ in the overlying rock.

6.2. Calculation of the Height of WCFZ Based on Borehole

(1)
Index factor acquisition
Mining thickness (M): The coal seam thickness was obtained based on the coal seam thickness identified in boreholes of the research area.
Proportion coefficient of hard rock (b): According to Equation (1), 15 times the coal seam thickness was taken as the statistical height. The total thickness of fine sandstone, medium sandstone, and coarse sandstone was used as the accumulated thickness of hard rock strata within the statistical height range. The ratio coefficient of hard rock at each borehole was calculated.
Working width (L): At present, Qingshuiying Coalfield has mined five working faces with a width of approximately 280 m. According to the Coalfield production continuity plan in the next years, the design width of the working face will basically remain unchanged, so the 280 m was taken as the working width.
Mining depth (S): According to the borehole revealing data of the research area, the buried depth of the coal seam floor at each borehole point was obtained as the mining depth at this point.
(2)
Calculation of the height of WCFZ
According to the prediction formula (16) of WCFZ height, the index factors obtained in the study area were substituted to calculate the WCFZ height of each borehole. The Kriging linear interpolation method was used to draw the height contour map of the WCFZ in the whole study area, as shown in Figure 4. In general, the height of the WCFZ in the study area was larger in the west (>60 m), especially in the northwest, while being smaller in the east.

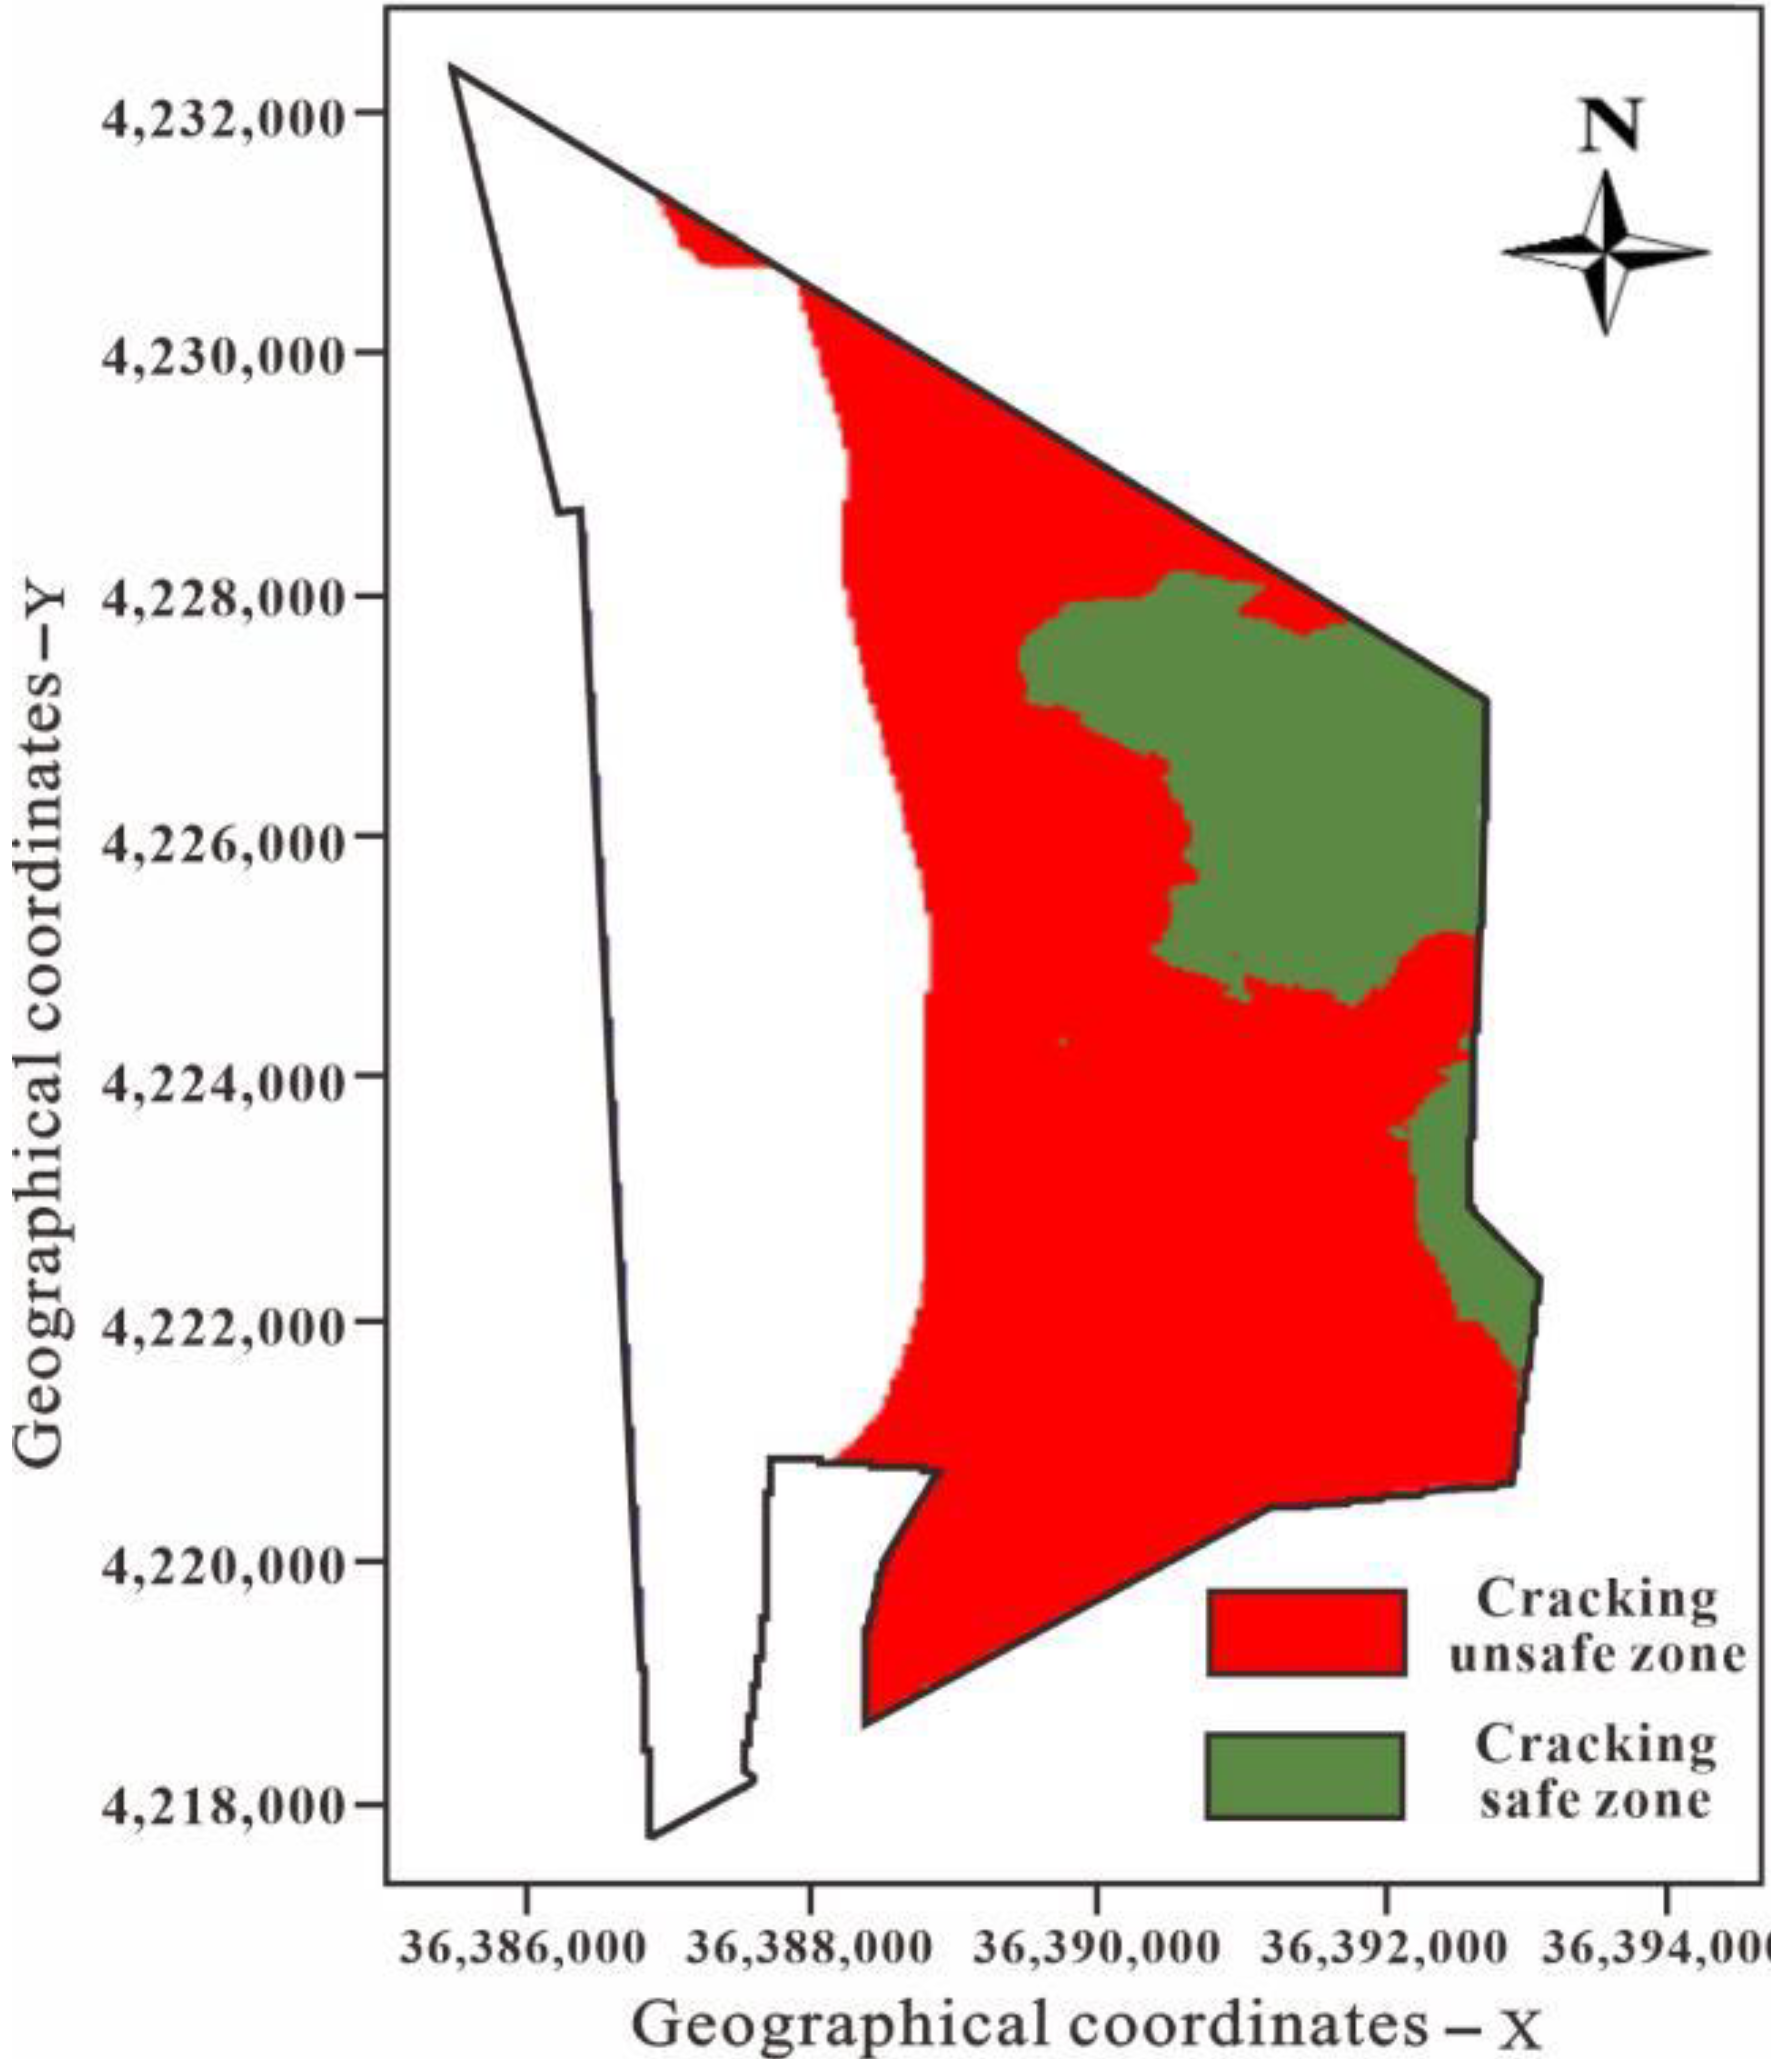
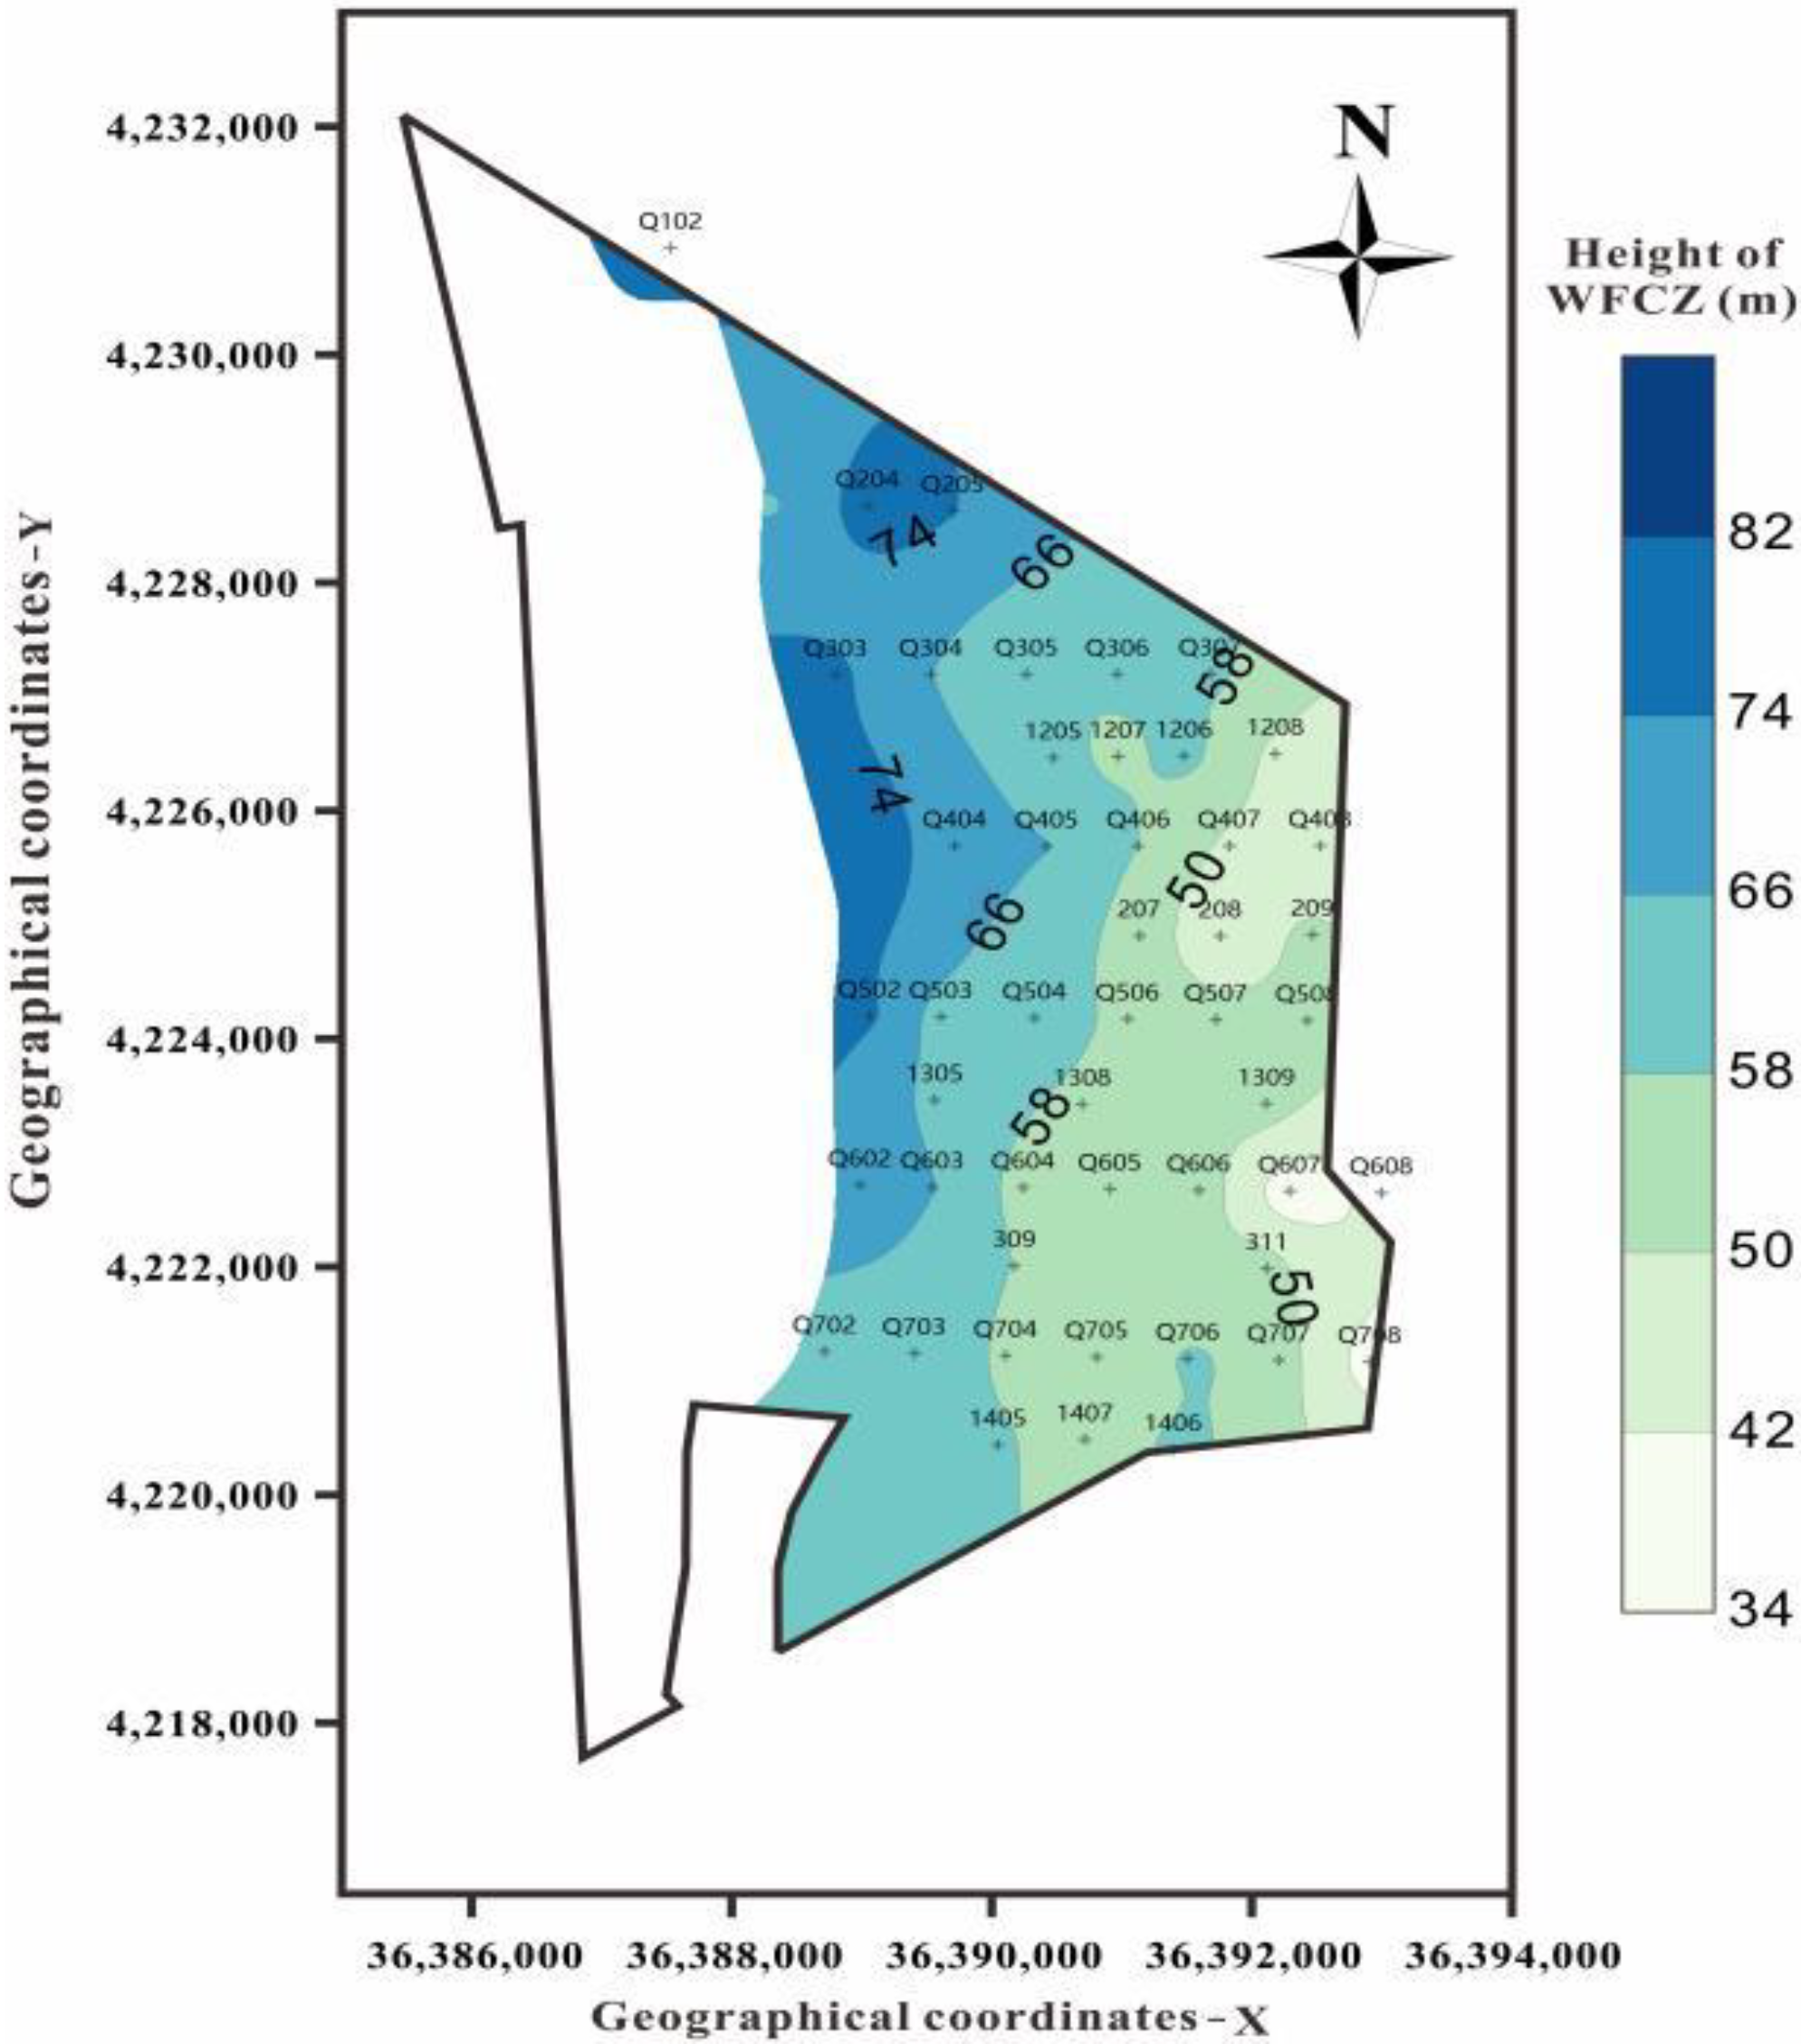
6.3. Safety Zoning of Risk Cracking

The occurrence of roof water inrush depends on the height of the WCFZ and the water-rich condition of the strata. Generally, an aquifer has good water content and has the condition of filling water, whereas an aquiclude is generally poor in water and has water resistance. Connection of the WCFZ to the overlying aquifer is the key to judging the mine water inrushing. According to this judgment method, the whole study area can be divided into a cracking safe zone and cracking unsafe zone. If the WCFZ can connect to the overlying aquifer, it is an unsafe zone; otherwise, it is a safe zone. The partition results are shown in Figure 5. The safety zone is mainly distributed in the northeast of the study area. Surprisingly, the region with a small height of the WCFZ in the southeastern part of the study area is an unsafe zone. This is because the height value of the WCFZ in this region is small, but it is developed into the overlying aquifer. If the aquifer is rich in water, the water will flow into the mining face along the WCFZ, which may cause water inrushing into the working face.

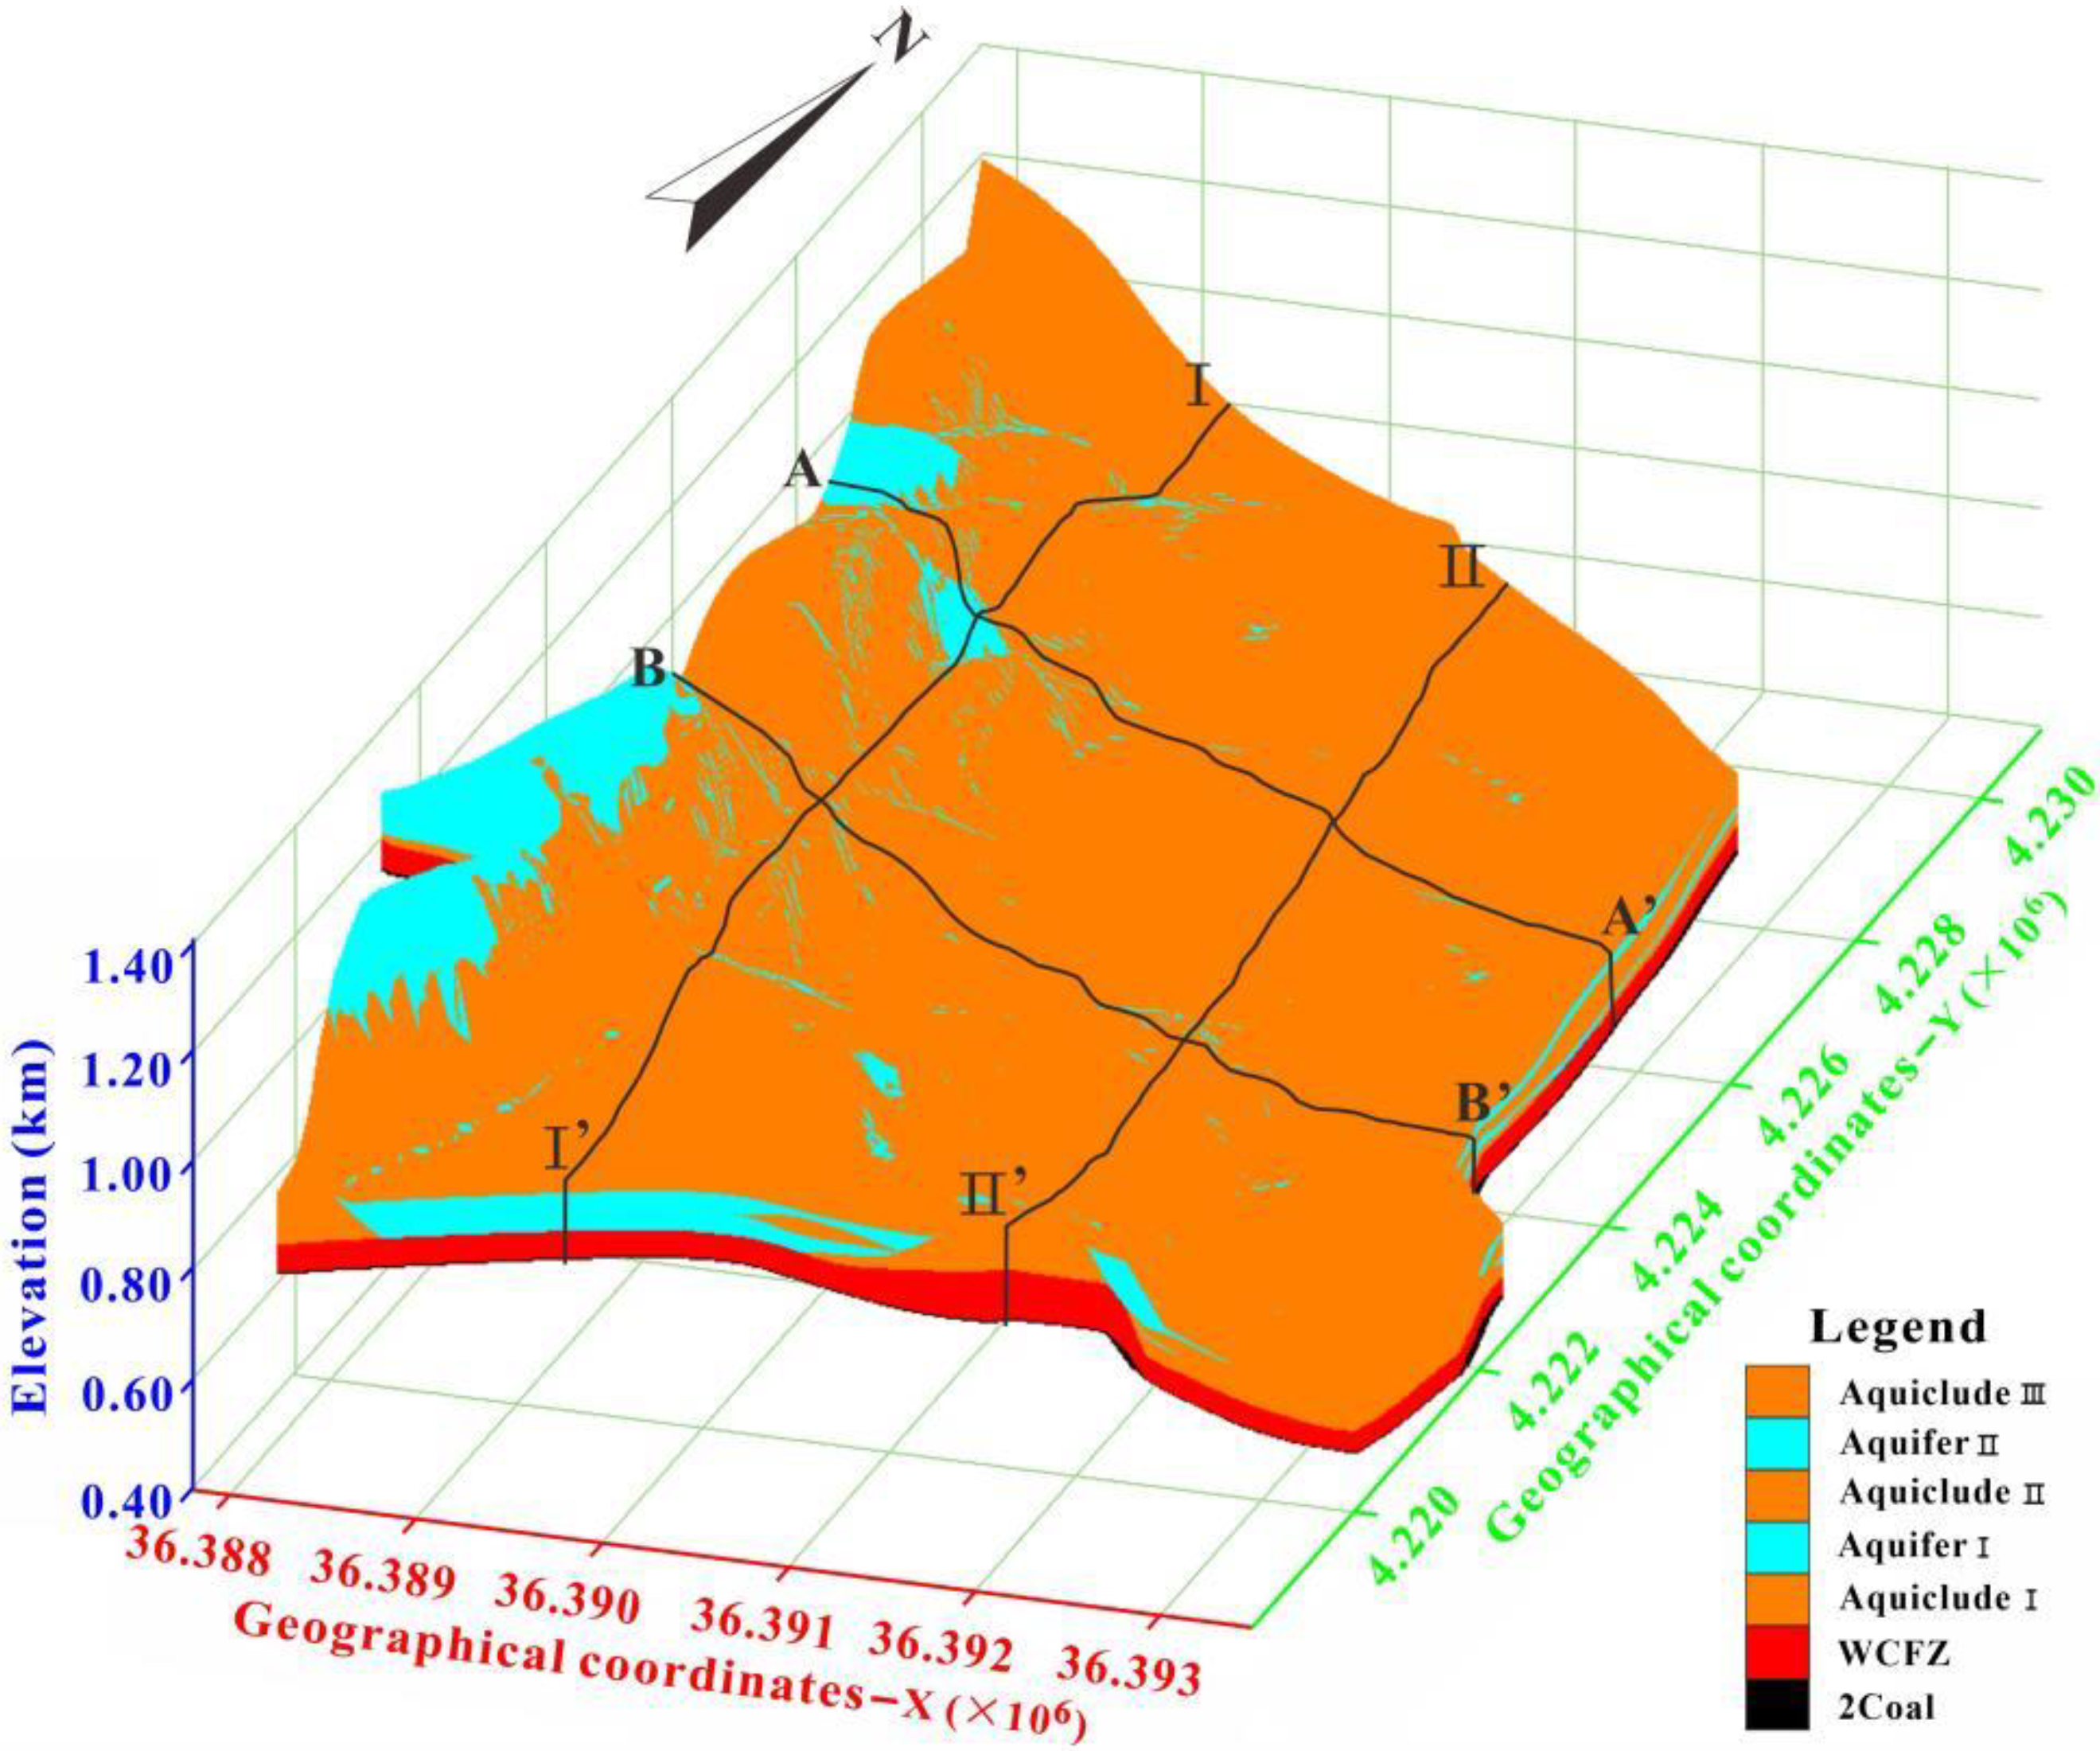
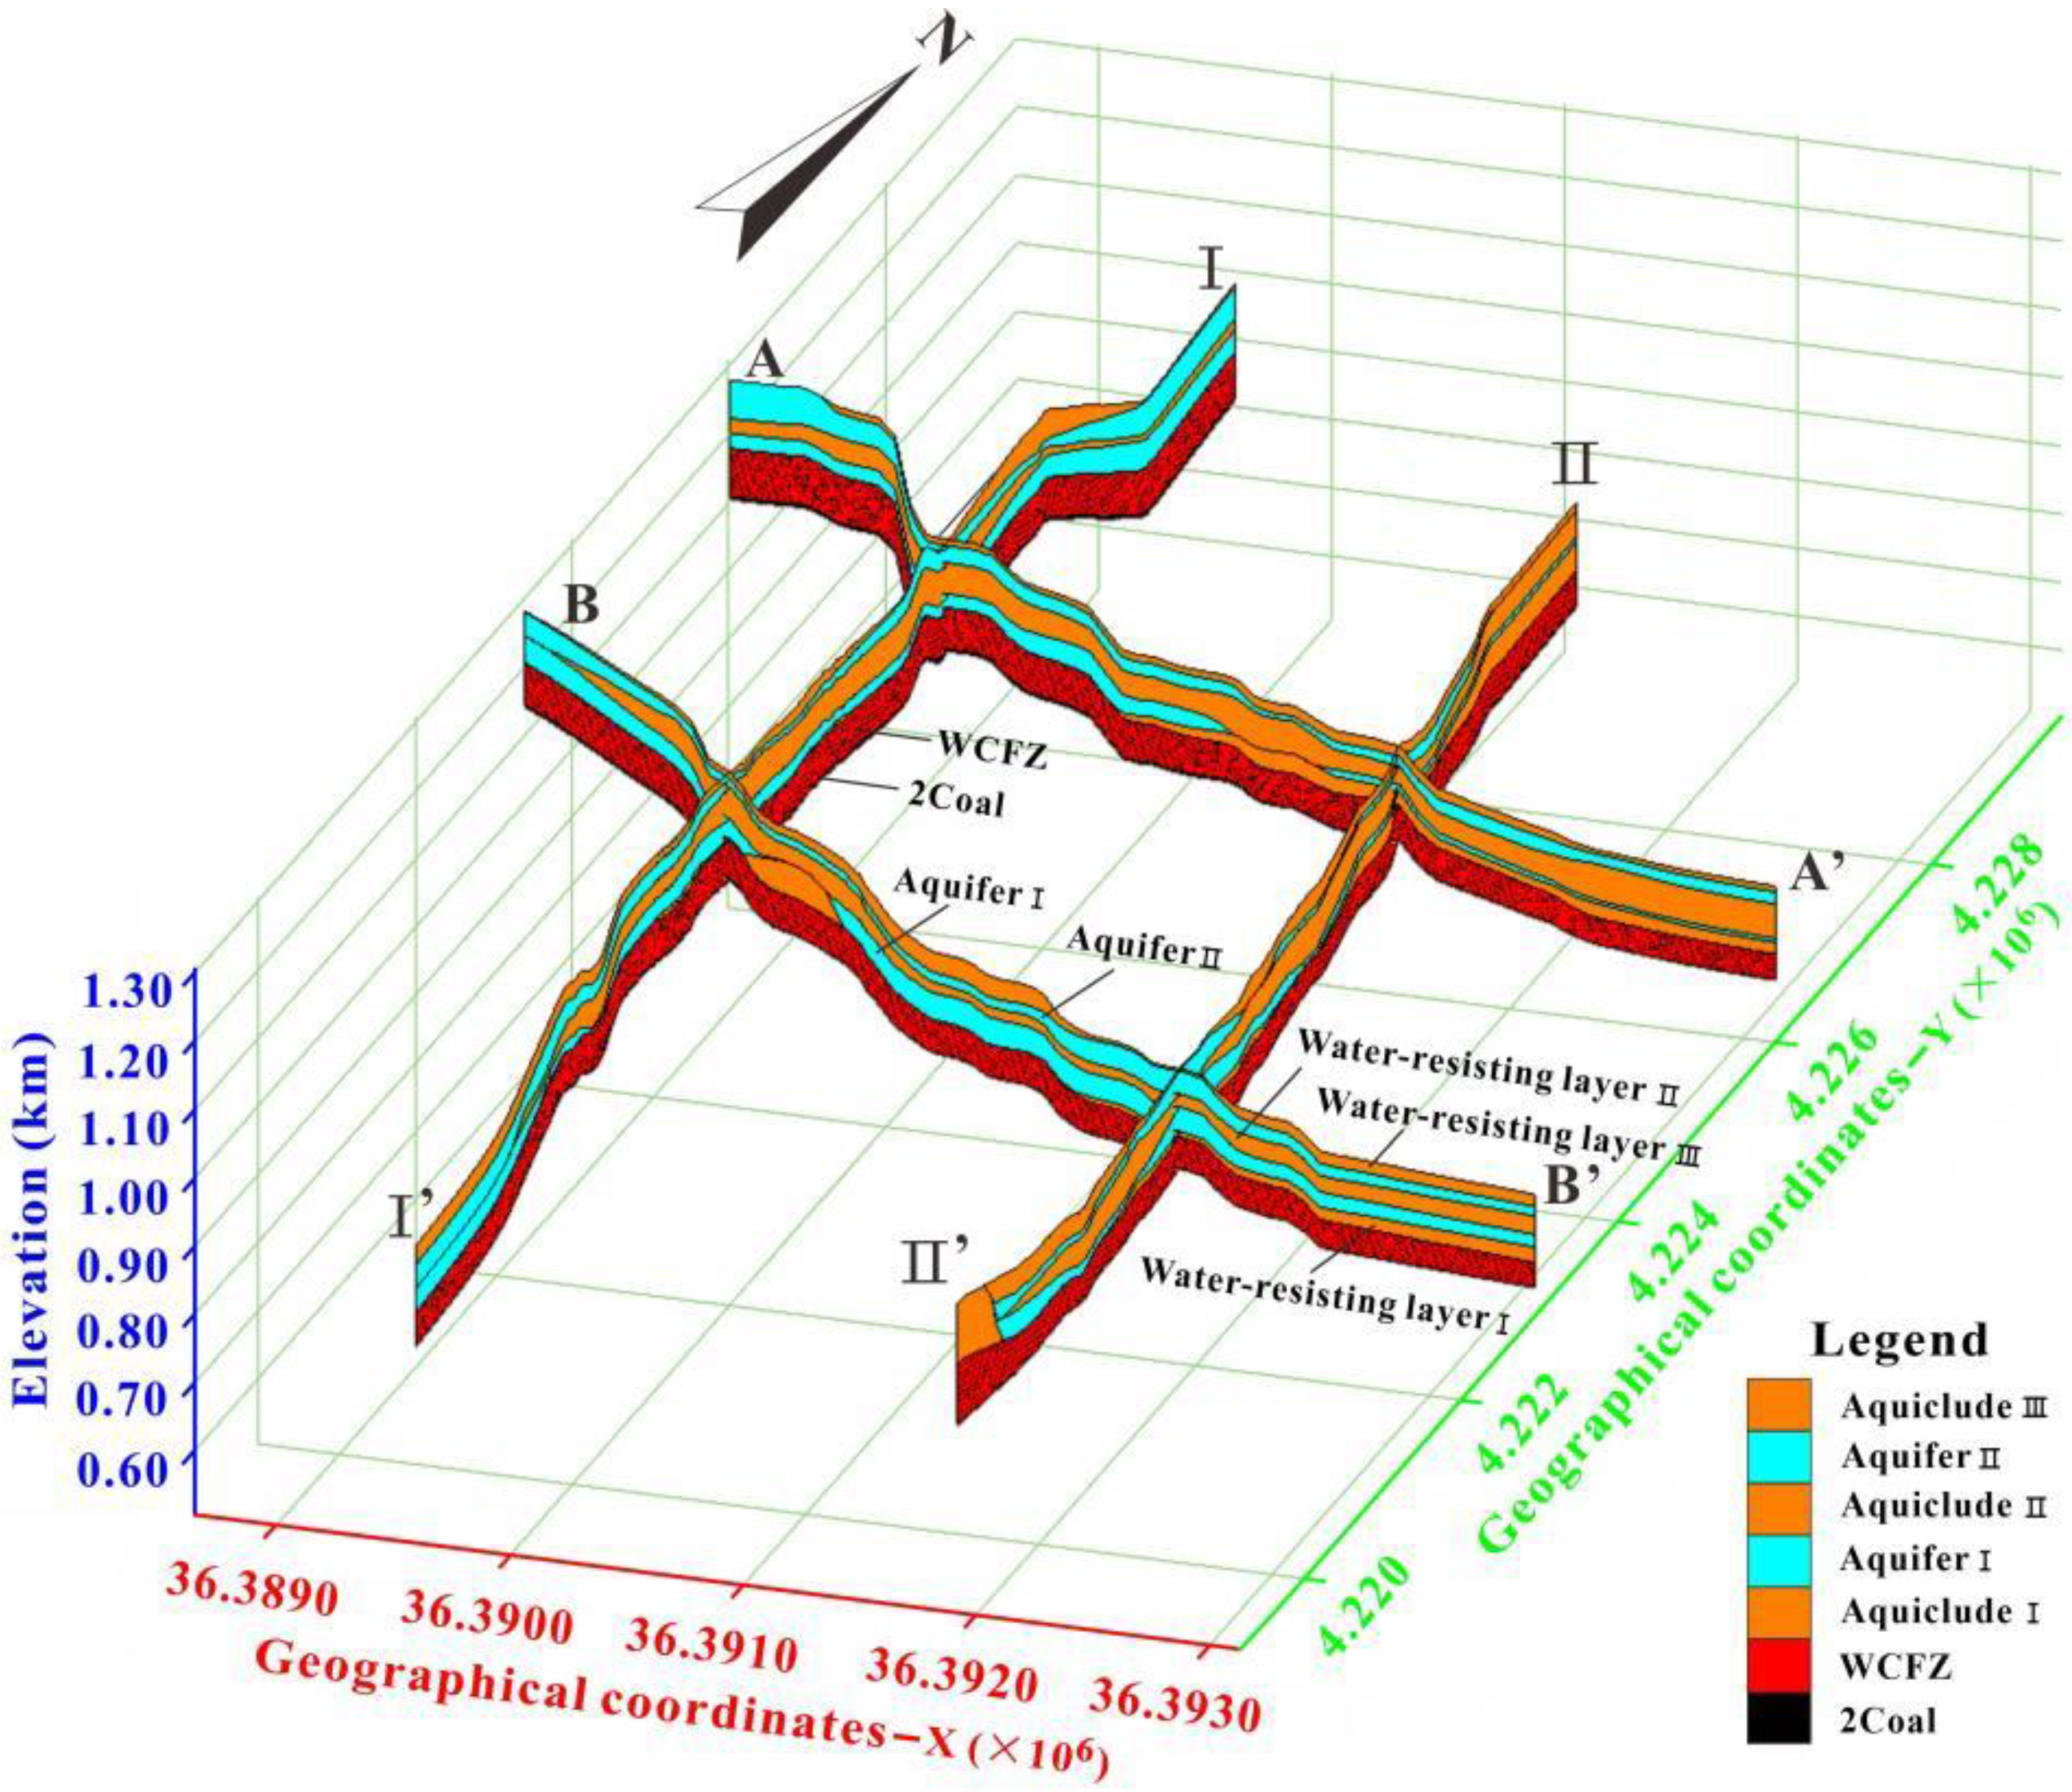
6.4. 3D Structure Model of WCFZ

The Groundwater Modeling System (GMS) is a comprehensive, conceptual model-based Groundwater environment simulation software, with a good interface, and powerful pre-treatment and post-treatment functions. The GMS software can realize the conversion from borehole data to a 3D space model, which is quite prominent in constructing a 3D visualization hydrogeological structure model.
The spatial relationship between the WCFZ and overlying aquifer (aquiclude) is graphically displayed to show the distribution characteristics of the WCFZ in the study area. GMS software was used to construct a 3D hydrogeological structure model of the WCFZ based on the borehole formation data and the height of WCFZ data in the study area. By cutting and rotating models, the spatial distribution and connection with the overlying aquifer (aquiclude) of the WCFZ can be more intuitively understood [37,38,39].
In consideration of the possible influence range of the height of the WCFZ, the #2 coal seam floor was taken as the bottom boundary of the model, and 100 m upward of the maximum height of the WCFZ was taken as the top boundary of the model. From bottom to top, the strata in the study area consisted of #2 coal seam, WCFZ range, Aquiclude Ⅰ, Aquifer Ⅰ, Aquiclude Ⅱ, Aquifer Ⅱ, and Aquiclude Ⅲ. The lithology revealed by each borehole was different, and the distribution of the aquifer or aquiclude was also different. Therefore, not every borehole completely contains the above strata. When the strata are pinched or missing, the thickness of the strata is treated as 0 m, which is represented as missing in the model. The Borehole Module of GMS was used to call the imported borehole hierarchical data file to build a 3D space model. Then, TINS interpolation was carried out to build triangular grids. The Solids Module was called to establish a 3D hydrogeological structure model. In order to make the thickness comparison between different strata more obvious, the model was enlarged 3 times along the Z-axis (Figure 6). The 3D solid model was cut and rotated along different directions to obtain the 3D hydrogeological structure section of WFCZ (Figure 7), including four cross sections: A-A′, B-B′, Ⅰ-Ⅰ′, Ⅱ-Ⅱ′.
Figure 6 shows that the strata burial depth in the western part of the study area is smaller than that in the eastern part. The thickness of each aquifer varies significantly in different positions. Figure 7 shows that the height of the WCFZ decreases from west to east. The height of the WCFZ in the western part of the study area is larger, and the WCFZ directly connects the overlying aquifer Ⅰ and connects aquifer Ⅱ at a few positions. The thickness of the aquiclude in the western part of the study area is relatively thin and discontinuous. Therefore, during the mining process of the #2 coal seam in the western part of the study area, the WCFZ easily connects the overlying aquifer and causes the roof water-inrush or sand collapse accident. The height of the WCFZ in the eastern part of the study area is relatively small, and the direct top of the WCFZ is a continuous aquiclude. Especially, the WCFZ in the northeast does not develop upward until aquiclude Ⅰ. The thickness of aquifer Ⅰ and aquifer Ⅱ is very thin and discontinuous. Therefore, the risk of water inrush of #2 coal mining in the northeast of the study area is smaller. The height of the WCFZ in the southeast of the study area is also smaller, but the upper boundary of the WCFZ in most positions are developed into aquifer Ⅰ, resulting in a higher risk of roof water inrush. In conclusion, the analysis results of the 3D hydrogeological structure model of the WCFZ are consistent with the prediction results of the cracking safety zone obtained above. The model can well show the height of the WCFZ and its relationship with the overlying aquifer (aquiclude), which can provide a theoretical basis for the prevention and control of Coal Mine roof water damage.

7. Conclusions

This study established a new multiple regression prediction model for the height of the WCFZ proposed based on analyzing the measured data and influencing factors of the height of the WFCZ in the western Ordos Basin. It was used to predict the height of the WFCZ in Qingshuiying Coalfield, and the 3D hydrogeological structure model of the WFCZ was carried out. The main conclusions were as follows:
1.
The optimal unitary function models of mining thickness and proportion coefficient of hard rock were unitary linear equations, with R2 of 0.863 and 0.674, respectively. The optimal unitary function models of the working width were S-shaped curves with R2 of 0.725. The optimal unitary function models of mining depth were logarithmic curves with R2 of 0.939. The sensitivity of each factor to the height of the WCFZ was in this order: mining thickness > proportion coefficient of hard rock > working width > mining depth.
2.
Based on the comprehensive consideration of five influencing factors: mining method, mining thickness, proportion coefficient of hard rock, working width, and mining depth, a multiple regression prediction model for the height of the WCFZ under fully mechanized caving in the western Ordos Basin area was established. The error of this model was basically controlled within 10%, which is much smaller than the traditional empirical equations.
3.
The prediction model was applied to Qingshuiying Coalfield, and the height of the WCFZ was predicted based on borehole data. The distribution characteristics of the WCFZ height showed an increased trend from southeast to northwest in the study area, and the prediction zone of cracking safety was obtained by reference to the water-rich condition of the strata.
4.
A 3D visualization model of the WCFZ was established in the study area to clearly show the spatial distribution law of the WCFZ and the spatial relationship between the WCFZ and the overlying aquifer (aquiclude). The visualization model has achieved the desired application effect and provided an advanced technology for the prevention and control of Coal Mine water.

Author Contributions

Resources, Y.Z. (Yiwen Zhang) and Z.L.; investigation, X.L.; writing—original draft, H.Y. and F.D.; supervision, P.Z.; funding acquisition, H.Y.; methodology, W.C.; format analysis, Y.Z. (Yutao Zhai) and X.R.; visualization, F.D. All authors have read and agreed to the published version of the manuscript.

Funding

This research was funded by the National Natural Science Foundation of Shandong Province, grant number [ZR2019MD013].

Institutional Review Board Statement

Not applicable.

Informed Consent Statement

Not applicable.

Data Availability Statement

Not applicable.

Conflicts of Interest

The authors declare no conflict of interest.

References

  1. Wang, T.; Shao, L.Y.; Xia, Y.C.; Fu, X.H.; Sun, Y.Z.; Sun, Y.J.; Ju, Y.W.; Bi, Y.L.; Yu, J.C.; Xie, Z.Q.; et al. Major achievements and future research directions of the coal geology in China. Geol. China 2017, 44, 242–262. [Google Scholar] [CrossRef]
  2. Guo, X.; Hu, Z.; Fu, S.; Dong, Y.; Jiang, G.; Li, Y. Experimental study of the remediation of acid mine drainage by Maifan stones combined with SRB. PLoS ONE 2022, 7, e0261823. [Google Scholar] [CrossRef] [PubMed]
  3. Jiao, Y.Q.; Wang, S.M.; Fan, L.M.; Wu, L.Q.; Rong, H.; Zhang, F. Key elements and framework model of groundwater system in Jurassic coal measures of Ordos Basin. J. China Coal Soc. 2020, 45, 2411–2422. [Google Scholar] [CrossRef]
  4. Gu, J.Y.; Zhang, X.Y. Sedimentary characteristics and sequence framework of intracontinental foreland Basin in the western China. Acta Sedimentol. Sin. 2005, 23, 187–193. [Google Scholar]
  5. Li, P.Y. Mine water problems and solutions in China. Mine Water Environ. 2018, 37, 217–221. [Google Scholar] [CrossRef]
  6. Liu, S.L.; Li, W.P.; Wang, Q.Q. Height of the Water-flowing fractured zone of the Jurassic coal seam in northwestern China. Mine Water Environ. 2018, 37, 312–321. [Google Scholar] [CrossRef]
  7. Zhang, T.; Zhao, Y.X.; Gan, Q.; Nie, X.D.; Zhu, G.P.; Hu, Y. Investigations into mining-induced stress-fracture- seepage field coupling in a complex hydrogeology environment: A case study in the bulianta colliery. Mine Water Environ. 2019, 38, 632–642. [Google Scholar] [CrossRef]
  8. Light, D.D.M.; Donovan, J.J. Mine-water flow between contigu-ous flooded underground coal mines with hydraulically compro-mised barriers. Environ. Eng. Geosci. 2015, 21, 147–164. [Google Scholar] [CrossRef]
  9. Adams, R.; Younger, P.L. A strategy for modeling groundwater rebound in abandoned deep mine systems. Groundwater 2001, 39, 249–261. [Google Scholar] [CrossRef]
  10. Booth, C.J. Strata-movement concepts and the hydrogeological impact of underground coal mining. Groundwater 1986, 24, 507–515. [Google Scholar] [CrossRef]
  11. Miao, X.X.; Cui, X.M.; Wang, J.A.; Xu, J.L. The height of fractured water-conducting zone in undermined rock strata. Eng. Geol. 2011, 120, 32–39. [Google Scholar] [CrossRef]
  12. Wang, H.L.; Jia, C.Y.; Yao, Z.K.; Zhang, G.B. Height measurement of the water-conducting fracture zone based on stress monitoring. Arab. J. Geosci. 2021, 14, 1392. [Google Scholar] [CrossRef]
  13. Zhai, W.; Li, W.; Huang, Y.L.; Ouyang, S.Y.; Ma, K.; Li, J.M.; Gao, H.D.; Zhang, P. A Case Study of the Water Abundance Evaluation of Roof Aquifer Based on the Development Height of Water-Conducting Fracture Zone. Energies 2020, 13, 4095. [Google Scholar] [CrossRef]
  14. Chen, Y.; Zhu, S.Y. Determination of caved and water-conducting fractured zones of “two soft and one hard” unstable coal seam. Acta Geod. Geophys. 2020, 55, 451–475. [Google Scholar] [CrossRef]
  15. Guo, C.F.; Yang, Z.; Li, S.; Lou, J.F. Predicting the water-conducting fracture zone (WCFZ) height using an MPGA-SVR approach. Sustainability 2020, 12, 1809. [Google Scholar] [CrossRef] [Green Version]
  16. Zhao, D.K.; Wu, Q. An approach to predict the height of fractured water-conducting zone of coal roof strata using random forest regression. Sci. Rep. 2018, 8, 10986. [Google Scholar] [CrossRef] [Green Version]
  17. He, X.; Zhao, Y.X.; Zhang, C.; Han, P.H. A model to estimate the height of the water-conducting fracture zone for longwall panels in western China. Mine Water Environ. 2020, 39, 823–838. [Google Scholar] [CrossRef]
  18. Xie, X.S.; Hou, E.K.; Wang, S.M.; Sun, X.Y.; Hou, P.F.; Wang, S.B.; Xie, Y.L.; Huang, Y.A. Formation mechanism and the height of the water-conducting fractured zone induced by middle deep coal seam mining in a sandy region: A case study from the Xiaobaodang coal mine. Adv. Civ. Eng. 2021, 2021, 6684202. [Google Scholar] [CrossRef]
  19. Gusev, V.N.; Ilyukhin, D.A. Determination of water conducting fracture zone for mining and geological conditions of the Verkhnekamsk salt deposit. In Innovation-Based Development of the Mineral Resources Sector: Challenges and Prospects: Proceedings of the 11th Russian-German Raw Materials Conference, Potsdam, Germany, 7–8 November 2018; CRC Press: Boca Raton, FL, USA, 2018; pp. 195–204. [Google Scholar]
  20. Li, X.B.; Li, Q.S.; Xu, X.H.; Zhao, Y.Q.; Li, P. Multiple influence factor sensitivity analysis and height prediction of water-conducting fracture zone. Geofluids 2021, 2021, 8825906. [Google Scholar] [CrossRef]
  21. Liu, Y.; Liu, Q.M.; Li, W.P.; Li, T.; He, J.H. Height of water-conducting fractured zone in coal mining in the soil-rock composite structure overburdens. Environ. Earth Sci. 2019, 78, 242. [Google Scholar] [CrossRef]
  22. Zhang, Y.; Cao, S.G.; Guo, S.; Wan, T.; Wang, J. Mechanisms of the development of water-conducting fracture zone in overlying strata during shortwall block backfill mining: A case study in Northwestern China. Environ. Earth Sci. 2018, 77, 543. [Google Scholar] [CrossRef]
  23. Zhu, T.E.; Li, W.P.; Wang, Q.Q.; Hu, Y.B.; Fan, K.F.; Du, J.F. Study on the height of the mining-induced water-conducting fracture zone under the Q(2l) loess cover of the Jurassic coal seam in Northern Shaanxi, China. Mine Water Environ. 2020, 39, 57–67. [Google Scholar] [CrossRef]
  24. Du, F.; Gao, R. Development patterns of fractured water-conducting zones in Longwall mining of thick coal seams-a case study on safe mining under the Zhuozhang River. Energies 2017, 10, 1856. [Google Scholar] [CrossRef] [Green Version]
  25. Fan, H.; Wang, L.G.; Lu, Y.L.; Li, Z.L.; Li, W.S.; Wang, K. Height of water-conducting fractured zone in a coal seam overlain by thin bedrock and thick clay layer: A case study from the Sanyuan Coal Mine in North China. Environ. Earth Sci. 2020, 79, 125. [Google Scholar] [CrossRef]
  26. Shi, L.Q.; Wu, H.B.; Li, Y.L.; Lv, W.K. Optimization model of PCA-GA-Elman for development height prediction of water-conducting fissure zone. J. Henan Polytech. Univ. 2021, 40, 10–18. [Google Scholar] [CrossRef]
  27. Hu, X.J.; Li, W.P.; Cao, D.T.; Liu, M.C. Index of multiple factors and expected height of fully mechanized water flowing fractured zone. J. China Coal Soc. 2012, 37, 613–620. [Google Scholar] [CrossRef]
  28. Aydin, H.; Bayram, A.; Esme, U.; Kazancoglu, Y.; Guven, O. Application of grey relation analysis (GRA) and taguchi method for the parametric optimization of friction stir welding (FSW) process. Mater. Tehnol. 2010, 44, 205–211. [Google Scholar]
  29. Kim, G.Y.; Jong, Y.; Liu, S.F. Generalized hybrid grey relation method for multiple attribute mixed type decision making. J. Grey Syst. 2014, 26, 142–153. [Google Scholar]
  30. Wakchaure, K.N.; Thakur, A.G.; Gadakh, V.; Kumar, A. Multi-Objective optimization of friction stir welding of aluminium alloy 6082-T6 using hybrid taguchi-grey relation analysis-ANN method. Mater. Today Proc. 2018, 5, 7150–7159. [Google Scholar] [CrossRef]
  31. Xia, X.T.; Meng, F.N.A.; Lv, T.M. Grey relation method for calculation of embedding dimension and delay time in phase space reconstruction. J. Grey Syst. 2010, 22, 105–116. [Google Scholar]
  32. Cui, Z.C.; Yang, Y.Z.; Gao, X.L.; Xiao, H.; Liu, H.C. Research and application of ecological river courses restoration technology. In Proceedings of the International Conference on Water Resource and Environment, Shanghai, China, 23–26 July 2016. [Google Scholar] [CrossRef] [Green Version]
  33. Scannapieco, D.; Naddeo, V.; Zarra, T.; Belgiorno, V. River water quality assessment: A comparison of binary and fuzzy logic-based approaches. Ecol. Eng. 2012, 47, 132–140. [Google Scholar] [CrossRef]
  34. Wang, W.C.; Xu, D.M.; Chau, K.W.; Lei, G.J. Assessment of river water quality based on theory of variable fuzzy sets and fuzzy binary comparison method. Water Resour. Manag. 2014, 28, 4183–4200. [Google Scholar] [CrossRef]
  35. Liu, H. Research on Determination method of Index Weight in Comprehensive Evaluation. J. Hebei Univ. Technol. 1996, 4, 75–80. [Google Scholar]
  36. State Bureau of Coal Industry. Rules for Coal Pillar Reservation and Coal Pressure Mining in Buildings, Water Bodies, Railways and Main Shafts; Coal Industry Press: Beijing, China, 2017. [Google Scholar]
  37. Alessandro, S.; Paola, M.; Giuseppe, P.; Paolo, C.; Francesco, P.; Valentina, C.; Michele, S. The Integration of 3D Modeling and Simulation to Determine the Energy Potential of Low-Temperature Geothermal Systems in the Pisa (Italy) Sedimentary Plain. Energies 2018, 11, 1591. [Google Scholar] [CrossRef] [Green Version]
  38. Zhang, L.Q.; Dong, D.L.; Zhang, F.; Xu, Z.C. A novel three-dimensional mine area hydrogeological model based on groundwater modeling systems. J. Coast. Res. 2020, 105, 141–146. [Google Scholar] [CrossRef]
  39. Du, B. Model investigation for groundwater aquifer structure in a mining area based on groundwater modeling system (GMS). Coal Geol. China 2020, 32, 27–32. [Google Scholar] [CrossRef]
Figure 1. Location of study area: (a) Map of China, (b) Schematic diagram of location of each Coalfield, (c) Qingshuiying Coalfield.
Energies 15 03850 g001
Figure 2. The relationship between the height of WCFZ and main controlling factors: (a) Mining thickness, (b) proportion coefficient of hard rock, (c) working width, (d) mining depth.
Energies 15 03850 g002
Figure 3. Hydrogeological profile of Qingshuiying Coalfield.
Energies 15 03850 g003
Figure 4. Contour map of height prediction of WFCZ.
Energies 15 03850 g004
Figure 5. Partition diagram of cracking safety prediction.
Energies 15 03850 g005
Figure 6. 3D hydrogeological structure model of WFCZ.
Energies 15 03850 g006
Figure 7. 3D hydrogeological structure section of WFCZ.
Energies 15 03850 g007
Table 1. Measured height of WCFZ.
CoalfieldWorking Face/BoreholeMining MethodMining Depth
(S)/m
Working Width
(L)/m
Mining Thickness (M)/mProportion Coefficient of Hard Rock (b)/mMeasured Height of WCFZ (Hf)/m
Bayangaole 311,101ZF620.00260.005.270.78126.00
Bulianta 12,406ZF200.00310.004.500.6989.50
Caojiatan 122,106ZF279.99350.006.000.91136.10
Cuimu 210,303ZF552.19200.006.50 190.51
Dafosi 41,104ZF400.00180.003.90 110.00
Daliu1203ZF49.00135.004.000.5245.00
Daliuta52,306ZF180.00301.007.000.90137.32
Gaojiabao41,101ZF400.00120.004.36 88.03
Hanglaiwan30,101ZF300.00248.007.500.67112.60
H3ZF241.30300.004.500.69108.32
H4ZF244.00300.004.500.74114.38
Hongliulin 25,202ZF135.00350.005.80 60.70
Hongqinghe3−1101ZF669.00240.006.10 107.00
3−1401ZF740.00241.006.00 106.10
Hujiahe401,101ZF525.00180.006.000.62100.00
401,102ZF650.00180.0010.000.62133.00
401,103ZF650.00180.008.000.62106.40
Jinjitan101ZF260.00300.005.50 108.59
102ZF264.98300.005.500.54111.32
12−2101ZF260.00300.005.500.90109.72
JT6ZF270.20300.005.000.912120.25
JKY2ZF260.00300.005.500.70122.64
JSD2ZF247.60300.005.500.44115.00
JSD4ZF232.38300.005.500.79146.18
Longde205ZF195.90 182.00 3.96 75.78
206ZF199.90182.003.96 71.66
Namuhe ZF544.00240.006.00 103.23
Sangshuping 3303ZF370.00153.005.700.1670.00
Shenshupan No. 3ZF673.00200.0010.000.95120.00
Shuangshan No. 3ZF713.00200.008.000.93103.09
Tingnan106ZF463.07116.057.650.6396.45
107ZF453.00116.007.600.6286.40
104ZF550.02200.006.000.60136.20
105ZF575.00200.006.00 135.23
Y3ZF702.00200.009.000.39148.30
Y1-1ZF533.20200.007.500.35140.20
303ZF500.00180.003.50 100.00
Xibu ZF568.40180.402.940.8557.00
ZF550.00180.002.400.8155.32
ZF489.00160.004.500.4754.79
ZF516.00206.102.950.7454.50
ZF420.50209.003.900.5252.01
ZF679.00180.002.100.4644.54
ZF412.00157.002.200.0935.40
Xiashijie223ZF620.00240.007.00 187.40
Yongming 5103ZF275.00148.001.40 29.58
Yushuwan 20,104ZF280.00255.005.000.75135.40
Y3ZF276.00255.005.000.54130.50
Y4ZF279.30255.005.000.62137.30
Y6ZF275.80255.005.000.57117.80
Zhangjiamao 3201ZF500.00104.0011.100.83152.34
Zhuanlongwan 23,103ZF210.00260.004.50 92.10
Note: “ZF” represents fully mechanized caving mining.
Table 2. Comparison of correlation coefficients of optimal function model with one variable.
Linear EquationConicCubic CurveLogistic CurveS-Shape CurveExponential CurvePower Function Curve
Mining thickness0.8630.852\\\0.8250.829
Proportion coefficient of
hard rock
0.674\\0.5390.549\0.587
Working width0.620\0.7120.6600.7250.636\
Mining depth0.8340.923\0.9390.8590.7640.934
Table 3. The comprehensive weight of each main control factor.
Mining ThicknessProportion Coefficient of Hard RockWorking Width Mining Depth
Weight determined by grey correlation analysis (wi)0.29950.29560.23980.1651
Weight determined by fuzzy ordered binary comparison (wj)0.4490.3160.1640.071
Comprehensive weight (wz)0.390.310.20.1
Table 4. Qualitative judgment table of index ranking consistency of fixed weight factor set U.
Mining Thickness Mining Depth Working Width Proportion Coefficient of Hard Rock ti
Mining thickness 0.51113.5
Mining depth 00.5000.5
Working width 010.501.5
Proportion coefficient of hard rock0110.52.5
Table 5. Error analysis of each formula.
NumberWorking
Face Name
Mining Thickness (M)/mProportion Coefficient of Hard Rock (b)/mMining Depth (S)/mWorking Width (L)/mMeasured Height of WCFZ/mEmpirical Formula (19)Empirical Formula (20)Prediction Model
of This Paper
Predictive Value/mRelative Error %Predictive Value/mRelative Error %Predictive Value/mRelative Error %
1Qingshuiying Coalfield 112015.430.7521028062.8449.79 20.77 56.60 9.92 60.39 3.90
2Meihuajing Coalfield 112012.70.6522025646.4539.69 14.55 42.86 7.72 46.18 0.59
3Jinfeng Coalfield 0118024.60.7250028063.1247.57 24.63 52.90 16.20 57.40 9.06
4Lingxin Coalfield 0515033.50.7225028059.2443.64 26.33 47.42 19.96 52.17 11.94
5Hongliu Coalfield 12215.30.733030262.5949.47 20.96 56.04 10.46 60.11 3.97
6Hongliu Coalfield 10102065.280.6828030056.0249.42 11.77 55.96 0.11 59.28 −5.82
Publisher’s Note: MDPI stays neutral with regard to jurisdictional claims in published maps and institutional affiliations.

