Abstract
Widespread adoption of heavy-duty (HD) electric vehicles (EVs) will soon necessitate the use of megawatt (MW)-scale charging stations to charge high-capacity HD EV battery packs. Such a station design needs to anticipate possible station traffic, average and peak power demand, and charging/wait time targets to improve throughput and maximize revenue-generating operations. High-power direct current charging is an attractive candidate for MW-scale charging stations at the time of this study, but there are no precedents for such a station design for HD vehicles. We present a modeling and data analysis framework to elucidate the dependencies of a MW-scale station operation on vehicle traffic data and station design parameters and how that impacts vehicle electrification. This framework integrates an agent-based charging station model with vehicle schedules obtained through real-world vehicle telemetry data analysis to explore the station design and operation space. A case study applies this framework to a Class 8 vehicle telemetry dataset and uses Monte Carlo simulations to explore various design considerations for MW-scale charging stations and EV battery technologies. The results show a direct correlation between optimal charging station placement and major traffic corridors such as cities with ports, e.g., Los Angeles and Oakland. Corresponding parametric sweeps reveal that while good quality of service can be achieved with a mix of 1.2-megawatt and 100-kilowatt chargers, the resultant fast charging time of 35–40 min will need higher charging power to reach parity with refueling times.
1. Introduction
We present a framework to investigate the operational behavior of publicly available, proposed megawatt (MW)-scale direct current charging stations, which will be designed to meet the charging needs of heavy-duty (HD) electrified vehicles. The motivation for this work comes from the need to develop complementary infrastructure for rapid vehicle electrification across different sectors and vocations. For commercial HD, as well as medium-duty (MD) vehicles, such infrastructure requirements would translate to the need for multi-port MW-scale charging stations that would (i) meet/exceed vehicle throughput requirements at charging stations and (ii) operate within constraints imposed by the electric grid. In this work, we analyze hourly vehicle telemetry data of over nine million vehicle miles traveled (VMT) in a five-state exclusive region of the United States. This data analysis identifies prospective charging station locations and generates vehicle arrival schedules at these locations. An agent-based station charging modeling tool then uses these vehicle schedules to analyze station operational behavior and load requirements at the MW scale. The remainder of this section presents a relevant literature review and highlights the unique contribution of this paper.
A decrease in the cost of EV batteries coupled with more stringent emissions regulations have given a significant boost to vehicle electrification in the commercial vehicle sector. By the year 2025, EV penetration in North America is expected to be 8.3% and 12.3% in the MD and HD truck sectors, respectively [1]. California’s zero emission vehicle mandate will significantly boost commercial vehicle electrification as well [2]. Feasibility studies have demonstrated that MD/HD vehicle electrification is economical with reasonable payback periods on the initial investment [3]. The availability of high-power public charging infrastructure is an important factor in facilitating EV adoption.
On-board AC Level-1 and Level-2 chargers following the SAE J1772 or J3072 standards are unlikely to reach the power levels needed for en-route charging of commercial HD vehicles. This makes off-board DC fast charging an attractive candidate for HD electric vehicles [4,5]. Long-range HD vehicles with battery capacity on the order of one megawatt-hour (MWh) will require direct current and charging rates above 500 kW to replace conventional vehicles without disrupting fleet operations. Furthermore, hours of service regulations for commercial vehicles will provide opportunities to complement high-power charging with some amount of slow charging (in the order of several hours instead of minutes) as well, which will offset demands from high-power, fast charging equipment [6]. This will warrant station designs capable of providing multi-MW levels of charging power and, in some cases, using a combination of fast and slow chargers. Some studies have investigated different power electronic architectures for fast charging stations [7,8]. Unfortunately, the literature lacks any precedents toward understanding the operation and utilization of MW-scale charging stations for HD electrification.
On the other hand, the literature on light-duty (LD) electric vehicle operation and charging infrastructure development has been growing steadily. Methods such as mixed-integer non-linear programming, bi-level programming, etc., have been used to investigate optimal charging station placement for EVs [9,10]. Wagner et al. investigated the optimal charging station placement problem for personally owned vehicles by correlating charging utilization with locations of points of interests such as parks, restaurants, and stores [11]. Gnann et al. [12] analyzed real-world fast charging data of cars from Sweden and Norway to predict that the projected ratio of battery EVs to public fast charging stations will approach the current ratio of conventional passenger vehicles to gas stations. By identifying the propensity of EV owners to charge their vehicles at home, Morrissey et al. [13] speculated that only public and not private fast charging infrastructure would be commercially viable for LD EVs in the future. Other studies have optimized the charging behavior of LD EVs at the stations in order to improve the quality of service of the station [14]. In a public charging scenario, the arrival and departure times of vehicles might not be controllable. Therefore, charge scheduling techniques, which are typical of a depot and vehicle fleet charging scenarios, are not applicable in most public charging cases [15].
While a considerable amount of real-world data are accessible for LD EV charging [12], that is not the case for HD EVs. In order to facilitate faster commercial vehicle electrification, this study develops a framework, as shown in Figure 1, to analyze charging station placements and the operational behavior of MW-scale charging stations and to understand the dependency of station operation on vehicle data and station design parameters. Motivating questions behind the development of this framework include: (a) Where should charging stations be located to maximize vehicle driving range? (b) What level of vehicle traffic and charger utilization will a station observe? (c) What level of energy dispatch and power demand will a station experience? (d) Can the grid provide such power? (e) Which station design parameters affect station throughput and utilization and in what way? In an attempt to answer these questions, this study makes the following unique contributions:
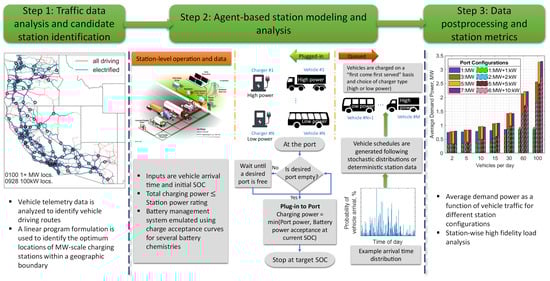
Figure 1.
Schematic of the framework for commercial HD vehicle electrification and station requirements. Vehicle telemetry data analysis enables identification of possible station locations and generates station schedules, which are analyzed using an agent-based station modeling tool to evaluate several key station metrics.
- 1.
- We use extant HD vehicle telemetry data in a maximal covering location problem formulation [16] to identify optimal charging station placement within a geographical boundary.
- 2.
- We use vehicle schedules from these optimally placed stations to generate input data for a high-fidelity agent-based station model that can simulate the charging and queuing behavior of EVs at the station.
- 3.
- We run parametric studies using Monte Carlo simulations to develop valuable insights on station design, station utilization, and station loads.
The remainder of this paper is organized as follows. Section 3 presents the procedures and tools used for the first two steps of the framework, i.e., traffic data analysis and station modeling and analysis. Relevant data and the parametric variations are laid out in Section 2. Section 4 focuses on the simulation results, and finally, Section 5 concludes the article.
2. MW-Scale Charging Station Model
Step 2 in Figure 1 shows the schematic of a state-of-the-art MW-scale charging station model and its operation. The operational behavior was simulated by modeling the arrival of the vehicles at the station, queuing if the desired ports are in use, and the charging mechanism at a port. We used an agent-based modeling paradigm [17] where vehicles arrive at a charging station following either a deterministic station schedule (generated in this work through data analytics in Step 1) or certain distributions of their arrival times and initial state of charge (SOC). Such an agent-based station model was simulated using an in-house software named the Electric Vehicle Infrastructure, Energy Estimation, and Site Optimization (EVI-EnSite) tool [18]. In this tool, each vehicle is defined by its battery capacity, arrival time, initial SOC, final desired SOC (or energy demand), and a charge acceptance curve. A charge acceptance curve is: (i) a map between the maximum charging power () and SOC of a vehicle battery, (ii) chemistry-dependent, and (iii) used to emulate the complex control actions of a battery management system (BMS) in a simplified manner for large-scale system-level simulations. As a vehicle arrives at the station, it is either queued, when there are no empty desired charging ports, or plugged in to the first available ith charging port that the vehicle chooses to charge at. A charging port is defined by its power capacity (), efficiency (, [19]), and a Boolean variable (), which equals 1 if a vehicle is plugged in to the port or 0 otherwise. Therefore, at any time t, the charging power provided by the ith port to the jth vehicle at the battery terminals is given by:
At the station level, the total EV charging power is constrained by the capacity of the station, i.e., , where is the total number of ports. In this article, we assumed that the station capacity (while we assumed the station to implement an uncoordinated charging scheme, if the EV charging demand exceeds the station capacity, the station limits the charging power of the last-served EV such that the total load does not exceed the station capacity) equals the total capacity of all the ports, i.e., . The primary focus of this work is to identify public charging locations for different levels of commercial vehicle electrification and analyze the corresponding EV charging load characteristics for station design considerations. This expected EV charging demand can be supplied either from the grid alone or through a combination of grid power and local distributed energy resources (DERs). While the availability of DER provides important control “knobs” to intelligently meet the charging demand at the station, this work focuses on understanding the demand itself. In turn, insights gained and data generated from this work are expected to provide valuable inputs towards DER needs and charge management in MW-scale stations.
Finally, two sets of simulations were carried out using the station schedules generated using Step 1 of the framework in Figure 1. First, vehicle schedules from proposed MW-scale stations were combined to generate probability distributions of stochastic parameters such as vehicle arrival time, initial SOC, and affinity to charge at a port of a specific power rating. A Monte Carlo simulation technique was then used to run a parametric study and elucidate the impact of factors such as vehicle traffic and charging infrastructure on quality of service (QoS) at the station and charging load. The second set of simulations looked at the spatio-temporal evolution of charging load at the candidate stations. This allowed us to understand the energy and peak power capacity requirements, their geographical concentration, and the change in load with the time of day and week.
3. Framework for Station Design Requirement Analysis
The framework developed to analyze the requirements of a MW-level charging station consists of two steps: (1) a data analysis step that samples conventional vehicle telemetry data to develop a distribution of charge schedules and energy demands for proposed stations assuming similar driving patterns for EVs; (2) a parametric study that uses these distributions and a station model to evaluate station operation metrics.
3.1. Vehicle Traffic Behavior Data Analysis
3.1.1. Telemetry Data
Telemetry data were collected from Class 8 on-road tractors operating in North America. These vehicles reported their locations, speed, and odometer reading once per hour for a two-week collection period. A previous study also used this telemetry dataset and is suggested as a source of further information [20]. Hourly location points for each vehicle in the dataset were passed as way-points to a routing algorithm [21] (see Figure 2a), which returned an approximate reconstruction of the truck’s original route (see Figure 2b). From an initial set of 60,000 vehicles, a subset of 3067 vehicles and 9.3 million miles was used for this work, in order to limit the complexity of the forthcoming optimization. We chose this subset such that it included only those vehicles that remained within the 5-state region of Washington, Oregon, California, Nevada, and Arizona.
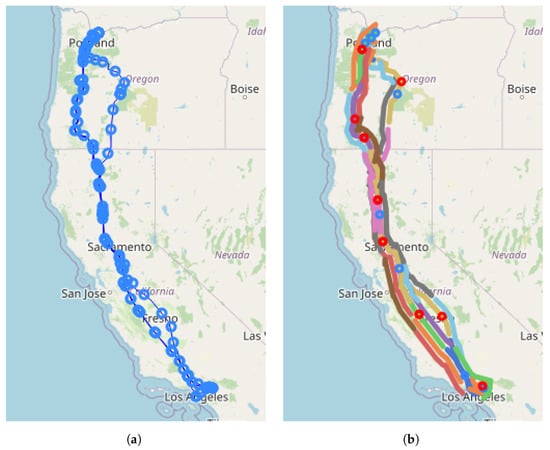
Figure 2.
(a) Locations reported hourly are used as way-points in the Graphhopper routing algorithm. (b) The vehicle route is divided into segments; each segment must encounter at least one opportunity to charge if the vehicle is electrified.
3.1.2. An Optimal Network of En-Route MW-Scale Chargers
The optimal placement of a network of MW-scale charging locations is motivated by the following question: Given a fixed number of multi-MW charging locations, how can we geographically place these locations such that all-electric vehicle operation is maximized? This problem belongs to a class of problems known as maximal covering location problems. In a maximal covering location problem, some fixed number of facilities are established in locations such that they maximize the total number of accommodated customers [16]. This problem begins with a large set of candidate locations. Candidate locations are located at roadway intersections, surrounded by a 1-mile radius, and dispersed over the geographic area of consideration. Figure 3b shows the 3120 locations that are candidates for en-route MW-scale charging. Candidate charging opportunities are intersections of a vehicle’s route, the circle representing a candidate charging location. This is the definition of a candidate charging opportunity and is an example of the demand intercept method often used to estimate loading at fueling stations [22]. Vehicle routes can be represented graphically as candidate charging opportunities (nodes) connected by the driven distance between them (edges). For a vehicle to be electrified, it must never exceed its battery’s electric range, R, without encountering at least one realized charging opportunity. To formulate this requirement as a mathematical constraint, candidate charging opportunities are grouped by driving segment. Each segment collects the candidate charging opportunities encountered by a vehicle while driving a distance of , and adjacent segments overlap by a length of . For example, if a vehicle encounters a candidate charging opportunity every mile and has a range of 300 miles, its first segment will be and its second segment will be .
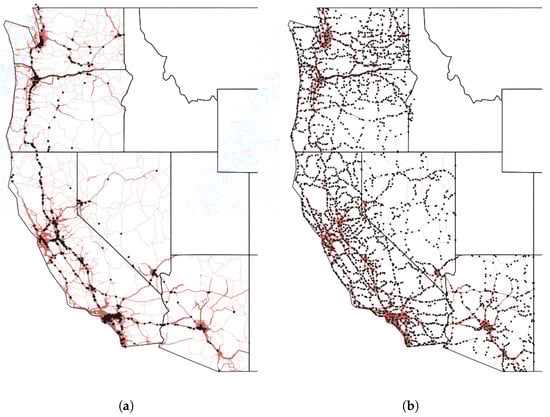
Figure 3.
(a) Locations of extended vehicle stops. (b) Candidate locations for en-route MW-scale charging.
3.1.3. Opportunity Charging
Typically, commercial vehicles, specifically trucks, do not operate 24 h a day. Although professional drivers are commonly paid per mile and strategically avoid delays, some amount of stopping is unavoidable. To avoid fatigue-related accidents, federal law requires drivers to stop for specific hours of rest after a certain duration of consecutive driving [6]. Twenty-five percent of the vehicles in this dataset were identified as having at least one trip that could be classified as slip-seat operation, meaning that the truck was driven for more than 700 miles or 16 h without stopping for a break of 4 h or longer. This means that 75% of these vehicles will have an opportunity to charge while their sole operator is resting. An additional consideration is that the freight that trucks are hauling needs to be loaded and unloaded, which provides more opportunity to charge the truck when it is forced to stop for other reasons. Since high-power battery charging has not reached a level of parity with diesel refueling in terms of time or expense, opportunity charging (i.e., low-power charging whenever available during the operational cycle of the vehicle) is important to increase the convenience and decrease the cost of operating an electric HD vehicle. Examining the telematic data previously described, locations were identified where vehicles were stopped for four or more consecutive hours. These sites, if they host three or more unique vehicles, are considered rest stops with long dwell times where slower kW-level chargers can be used. Figure 3a shows that these locations are numerous in urban areas where trucks may be parked at depots or warehouses and along major shipping corridors, where vehicles park to rest en-route to their destinations. Identifying these locations is, in a way, a method of charger placement. There were 967 kW-level charging locations identified and used to offset MW-scale charging demand in the forthcoming optimization.
3.1.4. Linear Programming Formulation
We pose the problem of finding the optimum placements of MW-scale charging locations for a given vehicle traffic as a linear programming problem. The problem statement is formulated as:
where is the set of vehicles, is a binary variable, which is 1 if vehicle “i” is electrified or 0 otherwise, is the distance driven by vehicle “i”, is the set of driving segments for vehicle i, is the set of candidate MW-scale charging locations encountered by the vehicle “i” in segment “j”, is the set of rest stop locations encountered by the vehicle “i” in segment “j”, is a binary variable, which is 1 if vehicle “i” on segment “j” took a long dwell time stop at location “w”, F is the set of all candidate MW-scale locations available to all vehicles over every segment, is a binary variable, which is 1 if this location “k” hosts MW-scale charging equipment, and is a user-defined limit on the number of MW-scale locations. This problem is solved as a mixed-integer linear program, but is more accurately a binary linear program. In this case, the Gurobi software was used to solve this problem, and the solution times were 1–40 min, depending on the scenario, when solved on a 36-core compute node at the National Renewable Energy Laboratory’s (NREL’s) Eagle high-performance computing system.
Optimal charging networks enable the maximum amount of electrified driving given a fixed number of MW-level charging locations. Figure 4 shows that electrification increases with the number of MW-level locations. When kW-level opportunity charging is available, HD electrification is increased slightly, but the effect is less pronounced than the effects of vehicle range and MW-level charging. It is notable that some vehicles can be electrified by installing only kW-level chargers. Eighty percent of the fleet can be electrified with 125 MW-level stations if vehicles have a 300-mile range and no kW-level chargers. Introducing kW-level chargers reduces the number of MW-scale charging locations to 90. If vehicles have a 600-mile range, the stations required are 50 and 30, respectively.
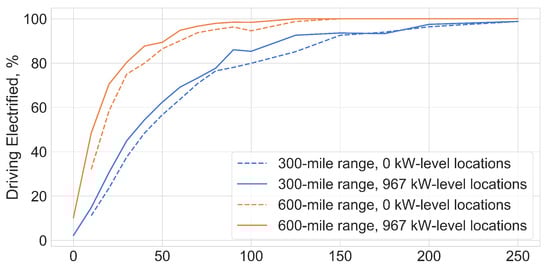
Figure 4.
Electrification achieved as a function of MW-scale charging stations.
Geographically, cities with ports, such as Los Angeles and Oakland, were the first to be electrified (Figure 5a). With 10 MW charging locations, shorter shipping corridors such as Interstate 10 connecting Los Angeles, CA, and Phoenix, AZ, were electrified. Ports generate a significant amount of Class 8 traffic in the form of drayage trucks moving freight from ports to inland warehouses. As the number of charging locations increases, longer corridors are electrified, notably Interstate 5, which runs from Southern California to Seattle, WA (Figure 5b). Once major corridors have been electrified, less trafficked routes are gradually covered by charging locations that see much less demand than those in crowded urban areas and shipping corridors (Figure 5c). Using their radius of operation, vehicles can be classified as local (r < 100 mi), regional (100 mi < r < 300 mi), and long-haul (r > 300 mi). The dataset contains 40% local, 40% regional, and 20% long-haul trucks. In the case where 10 MW-scale charging locations are constructed, 70% of electric trucks are local. As charging opportunities increase, regional and long-haul trucks are electrified.
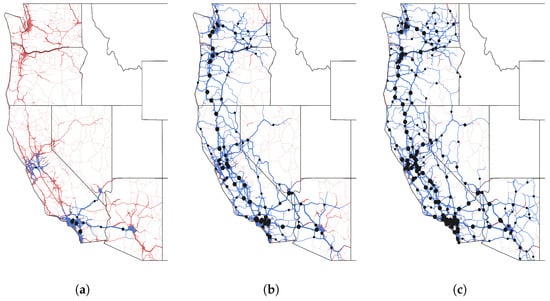
Figure 5.
Vehicle electrification shown geospatially. As the number of charging locations increases, the amount of electrified driving also increases. Red lines show truck traffic over the road network. The traffic lines are colored blue once the driving has been electrified. Dots on the maps show MW-scale en-route charging locations. The number of locations increases from left to right: (a) 10 locations, (b) 100 locations, and (c) 200 locations. Larger dots are locations that dispense more energy.
3.1.5. Simulation of Station Demand
With a fixed set of charging locations established through the optimization routine previously described, the operation of the charging network was simulated using a Monte Carlo approach. Driver recharging behavior is difficult to predict, because the average Class 8 diesel tractor has enough capacity for roughly two days worth of fuel. In practice, these drivers refuel their vehicles daily because of their mandatory rest requirement. As a result of the range assumption (300 and 600 miles) in this study, most drivers of electric vehicles will be required to stop for recharging in the middle of their workday. It is anticipated that drivers will not want to stop frequently to recharge, so they will be increasingly more likely to charge at lower SOCs. Driver behavior was modeled using a Markov chain, where the probability that a vehicle i at point j will stop to charge at point k is proportional to the distance the vehicle traveled from point j to point k, :
The Markov chain for each vehicle is used to generate a random walk. Time of arrival, vehicle SOC at arrival, and the station identifier at location k are added to a list of charge events. The vehicle SOC for the remainder of the route is then updated to reflect the charging event.
For each vehicle, this process of selecting one charge opportunity at a time and updating its SOC is repeated until its calculated SOC along the route is always greater than 0%. This process is repeated for every vehicle. If kW-level opportunity charging is available in the scenario, the charging profiles are corrected retroactively by adding kW-level charging energy at these locations equal to the range of each vehicle less a 15-mile margin of safety. This charging is subtracted from the previous MW-level charging stop so that the total energy dispensed is unchanged. Additionally, kW-level locations within a 5-mile radius of MW-scale locations were assumed to be collocated, meaning that MW-scale locations can have ports for low-power opportunity charging. Grouping the charging events by station, we generated station schedules that included information about vehicle arrival time, arrival SOC, and energy demands. These data were collated to generated probability distributions of vehicle arrival time and initial SOC, which are used to run parametric studies using the EVI-EnSite tool in Section 3.2.
3.2. Parametric Study Using Charging Station Model
We performed a parametric study assessing the operation and dependencies of a charging station that helped us in understanding the design considerations, such as the number of chargers, charging capacity, station capacity, etc., required for the HD EV charging station. The inputs needed for such a study, such as vehicle mix, charging events per day, stochasticity of arrival time, initial SOC, etc., were calculated based on the vehicle traffic behavior analysis in Section 3.1.
3.2.1. Vehicle Mix and Charge Acceptance Curves
In the case studies presented in this article, we investigated two types of HD EVs, defined by their battery capacities, in two different charging station setups. Battery capacities of 600 kWh and 1200 kWh, a mixture of commercially produced and futuristic battery scenarios [23,24], were considered. The first charging station setup consisted only of charging ports of 1.2 MW capacity (i.e., en-route without opportunity charging), while the second setup consisted of two types of ports—with capacities 1.2 MW and 100 kW (i.e., en-route with opportunity charging). Combining the station schedule data generated in Section 3.1 with these two station setups, we obtained the following mix of vehicles:
- Out of all the vehicles charging only at 1.2 MW ports, 68.76% are 600 kWh and 31.24% are 1200 kWh battery pack vehicles.
- Out of all the vehicle charging at combinations of 100 kW and 1.2 MW ports, 10.48% are 600 kWh vehicles charging at 100 kW ports, 10.42% are 1200 kWh vehicles charging at 100 kW ports, 58.28% are 600 kWh vehicles charging at 1.2 MW ports, and 20.82% are 1200 kWh vehicles charging at 1.2 MW ports.
Accordingly, all these vehicle types generate their underlying probability distributions of arrival time and initial SOC, as shown in Figure 6. The arrival time probability distribution, which spans a week, shows a higher probability at the beginning of the week and gradually decreases over the week. Similar distribution trends are seen for the different vehicle sizes. In contrast, the probability distributions of initial SOC show small to large pattern differences between different types of vehicles.
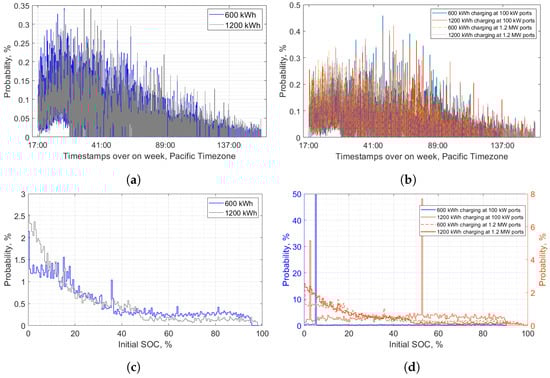
Figure 6.
Underlying probability distributions of (a) vehicle arrival time in stations with only 1.2 MW ports, (b) vehicle arrival time in stations with both 100 kW and 1.2 MW ports, (c) initial SOC for vehicles charging at stations with only 1.2 MW ports, and (d) initial SOC for vehicles charging at stations with both 100 kW and 1.2 MW ports.
Another aspect that differentiates vehicle battery packs with different capacities is the charge acceptance curve. Closed-loop charging control of EVs in system-level analyses is usually simplified using constant power approximations to reduce computational burden. However, such simplifications might fail to capture key load profile characteristics such as resultant charging load in cases where BMS limits the charging power. Therefore, in this work, we emulated the BMS’s closed-loop charge control behavior using charge acceptance curves, which are maps between SOC and maximum allowable power. Since EVI-EnSite simulates the station operation by progressing over time, at each time instant, vehicle SOCs are updated and, accordingly, the maximum charging power is applied using the charge acceptance curves. This allowed us to implement closed-loop BMS control, albeit in a simplified manner, within this system analysis tool. Several charging protocols for Li ion batteries such as constant current constant voltage (CC-CV), constant power constant voltage (CP-CV), multistage constant current (MCC), and variable current profile (VCP) charging have been proposed in the literature [25,26,27,28,29]. However, the focus of this article is on demonstrating that the implementation of these closed-loop charging control actions for system-level analyses is important. The specificity of the charging protocol was not considered in the context of this work, and hence, we adopted the simpler CC-CV protocol to develop the charge acceptance curve. Figure 7 shows representative charge acceptance curves for a 600 kWh and a 1200 kWh battery pack and contrasts them with the port capacity of 1200 kW. To generate these curves, we assumed that the battery packs constitute 26 Ampere-hour (Ah) lithium nickel manganese cobalt oxide (NMC) cells and are rated at a C-rate of 1.5C (temperature effects on the resultant charging protocol were neglected in this work). As seen in Figure 7, charging of a 600 kWh HD truck will be limited by the charge control algorithm, whereas for a 1200 kWh vehicle, charging will be limited by the port’s capacity, except for at a higher SOC, where the charging transitions to the CV regime. Similar curves can be generated for other cell formats/chemistries based on the datasheets supplied by the cell manufacturer.
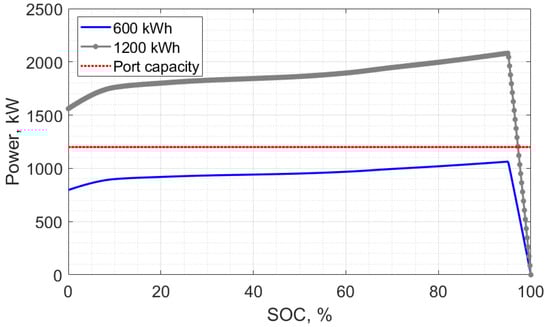
Figure 7.
Charge acceptance curves generated using the CC-CV charging protocol.
3.3. Parametric Variations
While the telemetry data analysis provides valuable insights into vehicle traffic behavior and energy requirements, the scale of such analysis warrants certain simplifications such as assuming a constant vehicle battery size at a time and ignoring the charging intricacies at the generated stations. A practical charging station will see a mix of different vehicle sizes, different traffic patterns, and queuing patterns based on the availability of charging ports at the station. In this article, we analyzed these intricacies by running a parametric sweep of vehicle traffic and infrastructure requirements using the EVI-EnSite tool over a four-week analysis period. Based on the vehicle schedules obtained in Section 3.1, we swept vehicle traffic and port count (which are directly related to station utilization) in the following manner:
- Vehicle traffic over the optimized set of MW-scale stations ranges from 2 to 100 vehicles per day. This range is discretized with a finer step at the lower end than the higher end since stations with very high traffic are relatively lower. Accordingly, the traffic conditions investigated were: 2, 5, 10, 15, 30, 60, and 100 vehicles per day.
- We investigated two station configurations:
- (i)
- Stations with only 1.2 MW charging ports, with port counts of 1, 3, 5, and 7.
- (ii)
- Stations with both 1.2 MW and 100 kW charging ports, with port counts of (“x” number of 1.2 MW + “y” number of 100 kW) 1+1, 2+2, 5+5, and 6+10. The variation in port count is such that the minimum and maximum number of ports can adequately charge the minimum and maximum vehicle traffic, respectively, with the least amount of wait time.
This parametric study was used to assess the limitations under a multitude of station operating scenarios, such as low to high vehicle traffic and port capacities spanning currently available commercial chargers to those at a lower technology readiness level [30,31]. Section 4 discusses the results obtained from this parametric study.
4. Results and Discussions
Using the parametric sweep information provided in Section 3.3, we ran multiple Monte Carlo iteration-based simulation studies to analyze the station operation. During each Monte Carlo iteration, the EVI-EnSite model was simulated for a period of one month and the vehicle arrival was dictated by the distribution in Figure 6. Although a number of outputs per station can be analyzed with this parametric variation, we focused on two primary outputs that dictate station operation, namely: (a) station throughput—a combination of vehicle charging and wait time, which are QoS indicators in the station; (b) station power requirements—average power demand and peak power that will impact the design decisions.
4.1. Impact on Station Throughput
Figure 8 and Figure 9 show the impact of the parametric variations on the charging and wait times of vehicles in the station, which in turn control the station throughput. In Figure 8, the results are presented in the form of box plots of average charging time with respect to vehicle traffic (vehicle traffic, expressed as vehicles per day, can also be interpreted as the number of charging events per day), while in Figure 9, the average wait time is presented as contour maps with respect to vehicle traffic and the number of ports. For a given number of vehicles per day, these boxes show the variation of charging time with the number of ports. The following key characteristics are noticed in Figure 8 and Figure 9:
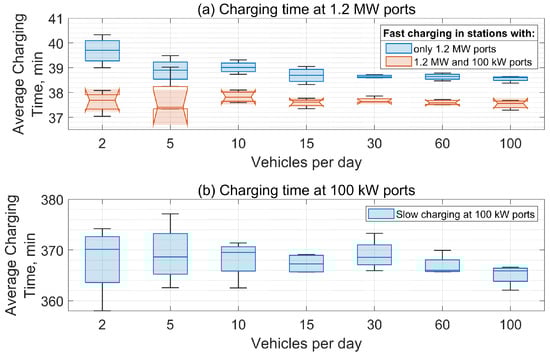
Figure 8.
Trends in average charging time of vehicles. (a) Vehicles charging at 1.2 MW ports; (b) vehicles charging at 100 kW ports.
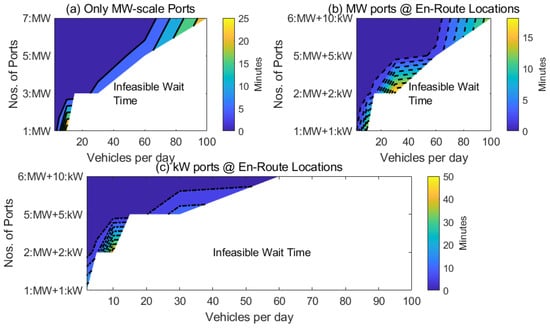
Figure 9.
Trends in average wait time of vehicles. (a) Station with only 1.2 MW ports. (b) Vehicles charging at 1.2 MW ports in station with high- and low-power charging. (c) Vehicles charging at 100 KW ports in a station with high- and low-power charging.
- In general, the average charging time is dependent on the mix of vehicle traffic (i.e., proportion of vehicles with different battery sizes), not the volume of traffic (i.e., total number of vehicles) or the availability of infrastructure such as the number of charging ports.
- The wait time is directly dependent on traffic volume and the availability of charging ports (thus infrastructure capacity).
The time needed to charge a vehicle battery is dictated by the rate of charging or power, which is the minimum of either the port capacity or the battery’s maximum charging power, as seen in Equation (1). Thus, they depend on the mix of vehicles coming to the station and the mix of charging ports. These two quantities do not change with vehicle traffic, number of ports, or even vehicle arrival behavior, and hence are independent of these parameters. The clear demarcation of average charging time in Figure 8 highlights this characteristic. If we account for the fraction of vehicles with different battery sizes and the choice of charging ports, the vehicle mix delineated in Section 3.2.1 is different enough to warrant such a clear difference in average charging time (difference ranging from ∼1–5 min here). The more disparate the vehicle mix is, the higher the difference in charging time between different groups of vehicles will be. We observed a slight decrease in the average charging time when the vehicle traffic increases from 2 to 100 vehicles per day. At such a high vehicle traffic, the charging behavior is dominated by the charging of the smaller batteries (600 kWh), which occupy a larger fraction of the total vehicles. These smaller batteries charge faster for the same port capacity than the larger 1200 kWh batteries. This results in an overall decrease in charging time, but a tremendous increase in wait time. While we arbitrarily defined the infeasible waits time as >25 min and >50 min for vehicles charging at MW-level ports and kW-level ports, respectively, in practice, such a choice would need to consider service hours and the economic impact of the possible loss of driving miles in high wait time events. Since wait time is a result of infrastructure limitation, we can significantly decrease wait time by increasing the number of charging opportunity at a station. This can be equivalently achieved by either increasing the number of ports or the capacity of each port (cf. Figure 9). Our simulations showed that for 100 vehicles/day, an increase in the number of ports from five 1.2 MW ports to seven 1.2 MW ports results in the average wait time decreasing from over 6 h to around 23 min, i.e., from an infeasible region to a feasible value. Figure 9 shows feasible and infeasible wait time regions for the investigated ranges of vehicle traffic and infrastructure considerations. For the feasible station configurations, the median of the average wait times is <1 min, while the 80th percentile of average wait times is 3.8 and 23.5 min for 1.2 MW and 100 kW ports, respectively.
4.2. Impact on Station Power Demand
Figure 10a–c show the variations in average power demand (defined as the power demanded from the station over 15 min intervals), energy demand, and the peak power of the station over the parametric space. These figures point to the following important observations from these results:
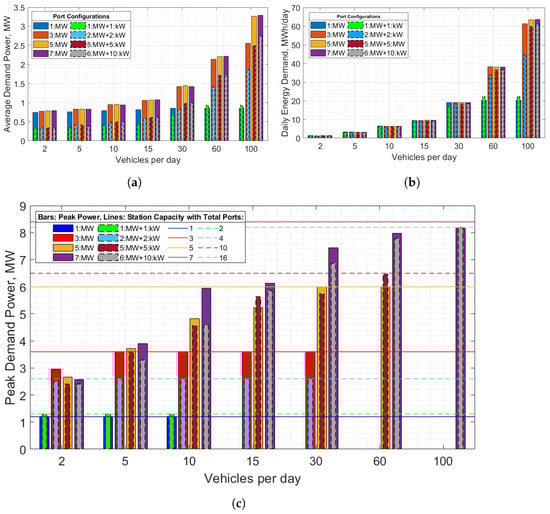
Figure 10.
Variations of average power demand, station energy demand, and peak power dictating station design requirements. (a) Effect of vehicle traffic and charging infrastructure availability on average power demand; (b) effect of vehicle traffic and charging infrastructure availability on station energy demand; (c) effect of vehicle traffic and charging infrastructure availability on peak power.
- The average power demand, station energy demand, and peak power of the station are dependent on the traffic volume and the utilization of the installed ports.
- An increase in average demanded power with an increased number of ports becomes more apparent as vehicle traffic increases.
- Understanding the traffic pattern seen by the station is critical to properly design the station infrastructure.
For clarity, a legend entry of the form: (i) “x:MW” represents a station with x number of 1.2 MW ports only and (ii) “x:MW + y:kW” represents a station with x number of 1.2 MW ports and y number of 100 kW ports. The average power demand and energy demand increase with an increase in vehicle traffic (cf. Figure 10a,b) due to the growing energy demand from this increased traffic volume. Additionally, for fixed vehicle traffic, increasing the number of ports usually increases power and energy demand as well. Such a change is more apparent with higher vehicle traffic. As vehicle traffic increases, an increased number of ports will allow more vehicles to charge concurrently, thereby increasing the power demand at the station. The energy demand of the station is purely a function of charging opportunities at the station, which increases with both the traffic and number of ports. At very low traffic (say two vehicles per day), one or two ports are sufficient to meet the charging demand, and hence, negligible variation is seen with increasing the number of ports.
Figure 10c shows the peak power experienced by the stations at different vehicle traffic and station configurations. The results are shown only for those station configurations and traffic that result in feasible wait times. Peak power usually increases with the number of ports for a given traffic volume. However, at very low traffic (e.g., in the case of two vehicles per day), we noticed a slight decrease in peak power as more ports are installed. This is because with enough installed charging ports, vehicles do not queue to charge and the likelihood that each vehicle will be charging at their peak power simultaneously decreases. The horizontal lines in Figure 10c represent the station capacity for a given number of ports. If the peak power is saturated by the station capacity lines, this indicates that the station is undersized in the number of charging ports (results in more wait time such as a 2:MW + 2:kW station for 10 or more vehicles per day). Alternatively, a large gap between the peak power and the station capacity lines indicates under-utilization of the installed infrastructure (e.g., a 6:MW + 10:kW station for 15 or less vehicles per day). Hence, an optimum balance between the two should be considered for station design.
4.3. Geospatial Station Loads
Figure 11 illustrates a challenge in operating charging stations, especially in rural or sparsely traveled locations. The ratio of the peak to average charging power represents the intermittency of charging demand at each location. If charging demand is sporadic in a location, multiple charging ports and high-capacity infrastructure will be required to minimize the wait time. The cost of this infrastructure will be difficult to justify, however, as the total number of charging transactions may be quite low. In some cases, the peak-to-average ratio was as high as 100. For example, a location that charges 10 trucks for 15 min then no trucks for the rest of the day has a peak-to-average ratio of approximately 100. Such extreme swings in demand from the electric grid are additionally challenging for utilities, who are likely to add “demand charges” when billing the station operators. Figure 11 shows that locations suffering from sporadic demand are generally far from urban areas and busy corridors. Furthermore, locations that suffer from sporadic demand in low-adoption scenarios (Figure 11a) see more consistent demand as electrification increases (Figure 11c). Additionally, the driving data used in this study were estimated to represent less than 2% of trucks registered in the U.S., meaning that the peak-to-average ratios for stations in a real-world case will not be so staggering, provided more than 2% of fleet operators buy electric trucks once a network of high-power chargers is able to support them.
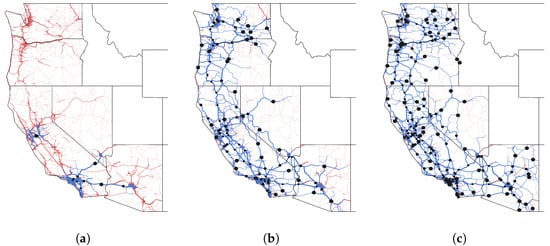
Figure 11.
Vehicle electrification shown geospatially with—(a) 10, (b) 100, and (c) 200 MW-scale stations. As the number of charging locations increases, the amount of electrified driving also increases. Red lines show truck traffic over the road network. The traffic lines are colored blue once the driving has been electrified. Dots on the maps show MW-scale charging locations. Larger dots are locations with greater peak to average power.
5. Conclusions and Future Work
This paper presents a modeling and data analysis framework to gain insights into the geographical and design considerations needed to develop multi-MW scale charging stations for HD vehicles. We show that: (i) vehicle telemetry data can be used to identify charging locations that can host MW-level short dwell time and/or kW-level long dwell time charging infrastructure, (ii) vehicle schedules from these candidate locations can be used to generate stochastic inputs for EVI-EnSite, and (iii) parametric studies regarding station operation develop valuable insights into infrastructure requirements and QoS. Some notable findings are the following:
- 1.
- Vehicle electrification that can be achieved through charging infrastructure deployment depends on driving range and the mix of short/long dwell time charging. Of the investigated vehicle fleet, we calculated the possibility of an 80% electrification with a 125 MW-scale charging station if the electric range was 300 miles and no long dwell time charging was available. If the vehicle range was 600 miles, 50 MW-scale stations would electrify 80% of the fleet. Of course, per-station charging energy demand in the latter case would be higher.
- 2.
- Geographically, the optimal charging station location coincides with higher HD vehicle needs. Within the geographical scope of this study, we found that cities with ports such as Los Angeles and Oakland were identified first as optimal candidates for MW-scale charging stations. Future work can extend this study with a national vehicle telemetry database.
- 3.
- Consideration of grid capacity while identifying the optimal station charging location was out of scope for this study and should be considered in a future extension of this work.
- 4.
- Charging power and, hence, time are limited by either the port capacity or the BMS control algorithm, which factors in SOC ranges and temperature. A combination of the CC-CV-based charging protocol rated at 1.5C and 1.2 MW ports yielded charging times in the range of 35–40 min in this study. To achieve parity between charging time and conventional HD vehicle refueling time, both port capacity and BMS rating need to increase.
- 5.
- Parametric studies such as this can complement economic analysis needed for station design. For example, we found that at 100 vehicles per day, installing seven 1.2 MW ports instead of five will result in feasible wait times as the station. A future economic analysis can then estimate break-even points for capital expenditures involved in designing such a station, knowing very well that a five-port station would provide unacceptable QoS and, hence, should not be a station candidate.
- 6.
- While we examined a public charging setup in this current work–meaning vehicles are charged on a first-come, first-served basis—the implementation of coordinated charging can help reduce demand charges or shift peak power by using available DER. Specifically, long dwell time vehicles charging at low-power ports can be good candidates for controllable loads, and future research is needed in this direction.
Author Contributions
Conceptualization, P.M. and A.M.; methodology, P.M. and E.M.; software, P.M. and E.M.; formal analysis, P.M., E.M. and S.S.; data curation, P.M. and E.M.; writing—original draft preparation, P.M. and E.M.; writing—review and editing, P.M., E.M. and A.M.; visualization, P.M. and E.M.; supervision, S.S., K.B. and A.M.; project administration, S.S., K.B. and A.M.; funding acquisition, A.M. All authors have read and agreed to the published version of the manuscript.
Funding
Funding for this research was provided by the U.S. Department of Energy Office of Energy Efficiency and Renewable Energy Vehicles Technologies Office.
Institutional Review Board Statement
Not applicable.
Informed Consent Statement
Not applicable.
Acknowledgments
This work was authored by the National Renewable Energy Laboratory, operated by Alliance for Sustainable Energy, LLC, for the U.S. Department of Energy (DOE) under Contract No. DE-AC36-08GO28308. Funding provided by the U.S. Department of Energy Office of Energy Efficiency and Renewable Energy Vehicles Technologies Office. The authors acknowledge Lee Slezak, of the Vehicle Technologies Office Grid and Infrastructure, for his role in establishing the project concept, advancing the implementation, and providing ongoing guidance. The views expressed in the article do not necessarily represent the views of the DOE or the U.S. Government. The U.S. Government retains and the publisher, by accepting the article for publication, acknowledges that the U.S. Government retains a nonexclusive, paid-up, irrevocable, worldwide license to publish or reproduce the published form of this work, or allow others to do so, for U.S. Government purposes. A portion of this research was performed using computational resources sponsored by the Department of Energy’s Office of Energy Efficiency and Renewable Energy and located at the National Renewable Energy Laboratory.
Conflicts of Interest
The authors declare no conflict of interest.
Abbreviations
The following abbreviations are used in this manuscript:
| BMS | Battery management system |
| CC-CP | Constant current constant power |
| CC-CV | Constant current constant voltage |
| DER | Distributed energy resources |
| EV | Electric vehicle |
| EVI-EnSite | Electric Vehicle Infrastructure, Energy Estimation, and Site Optimization tool |
| HD | Heavy-duty |
| kW | Kilowatt |
| kWh | Kilowatt hour |
| LD | Light-duty |
| MCC | Multistage constant current |
| MD | Medium-duty |
| MW | Megawatt |
| MWh | Megawatt-hour |
| NMC | Lithium nickel manganese cobalt Oxide |
| NREL | National Renewable Energy Laboratory |
| QoS | Quality of service |
| SOC | State of charge |
| VCP | Variable current profile |
| VMT | Vehicle miles traveled |
References
- Frost & Sullivan. Global Commercial Vehicle Electrification Potential and Trends, Forecast to 2025; Technical Report Report ID 4663547; Research and Markets: Dublin, Ireland, 2018. [Google Scholar]
- California Air Resources Board. California Takes Bold Step to Reduce Truck Pollution. 2020. Available online: ww2.arb.ca.gov/news/california-takes-bold-step-reduce-truck-pollution (accessed on 1 June 2021).
- Gao, Z.; Lin, Z.; Franzese, O. Energy consumption and cost savings of truck electrification for heavy-duty vehicle applications. Transp. Res. Rec. J. Transp. Res. Board 2017, 2628, 99–109. [Google Scholar] [CrossRef]
- Kisacikoglu, M.C.; Bedir, A.; Ozpineci, B.; Tolbert, L.M. PHEV-EV Charger Technology Assessment with an Emphasis on V2G Operation; Technical Report ORNL/TM-2010/221; Oak Ridge National Laboratory: Oak Ridge, TN, USA, 2012. [Google Scholar]
- Alexander, M.; Crisostomo, N.; Krell, W.; Lu, J.; Ramesh, R. Assembly Bill 2127 Electric Vehicle Charging Infrastructure Assessment: Analyzing Charging Needs to Support Zero-Emission Vehicles in 2030—Revised Staff Report; Technical Report Publication Number: CEC-600-2021-001-REV; California Energy Commission: Sacramento, CA, USA, 2021. [Google Scholar]
- Federal Motor Carrier Safety Administration, United States Department of Transportation. Summary of Hours of Service Regulations. Available online: https://www.fmcsa.dot.gov/regulations/hours-service/summary-hours-service-regulations (accessed on 1 November 2020).
- Tan, L.; Wu, B.; Yaramasu, V.; Rivera, S.; Guo, X. Effective Voltage Balance Control for Bipolar-DC-Bus-Fed EV Charging Station With Three-Level DC–DC Fast Charger. IEEE Trans. Ind. Electron. 2016, 63, 4031–4041. [Google Scholar] [CrossRef]
- Nair, A.C.; Fernandes, B.G. A Solid State Transformer based Fast Charging Station for all Categories of Electric Vehicles. In Proceedings of the IECON 2018—44th Annual Conference of the IEEE Industrial Electronics Society, Washington, DC, USA, 21–23 October 2018; pp. 1989–1994. [Google Scholar]
- Sadeghi-Barzani, P.; Rajabi-Ghahnavieh, A.; Kazemi-Karegar, H. Optimal fast charging station placing and sizing. Appl. Energy 2014, 125, 289–299. [Google Scholar] [CrossRef]
- Wu, F.; Sioshansi, R. A stochastic flow-capturing model to optimize the location of fast-charging stations with uncertain electric vehicle flows. Transp. Res. Part D Transp. Environ. 2017, 53, 354–376. [Google Scholar] [CrossRef]
- Wagner, S.; Götzinger, M.; Neumann, D. Optimal Location of Charging Stations in Smart Cities: A Point of Interest Based Approach. In Proceedings of the Thirty Fourth International Conference on Information Systems, Milan, Italy, 15–18 December 2013. [Google Scholar]
- Gnann, T.; Funke, S.; Jakobsson, N.; Plötz, P.; Sprei, F.; Bennehag, A. Fast charging infrastructure for electric vehicles: Today’s situation and future needs. Transp. Res. Part D Transp. Environ. 2018, 62, 314–329. [Google Scholar] [CrossRef]
- Morrissey, P.; Weldon, P.; O’Mahony, M. Future standard and fast charging infrastructure planning: An analysis of electric vehicle charging behaviour. Energy Policy 2016, 89, 257–270. [Google Scholar] [CrossRef]
- Zenginis, I.; Vardakas, J.S.; Zorba, N.; Verikoukis, C.V. Analysis and quality of service evaluation of a fast charging station for electric vehicles. Energy 2016, 112, 669–678. [Google Scholar] [CrossRef]
- Pelletier, S.; Jabali, O.; Laporte, G. Charge scheduling for electric freight vehicles. Transp. Res. Part B Methodol. 2018, 115, 246–269. [Google Scholar] [CrossRef]
- Berman, O.; Krass, D. The generalized maximal covering location problem. Comput. Oper. Res. 2002, 29, 563–581. [Google Scholar] [CrossRef]
- Ucer, E.Y.; Kisacikoglu, M.C.; Erden, F.; Meintz, A.L.; Rames, C.L. Development of a DC Fast Charging Station Model for Use with EV Infrastructure Projection Tool. In Proceedings of the 2018 IEEE Transportation Electrification Conference and Expo (ITEC), Long Beach, CA, USA, 13–15 June 2018. [Google Scholar]
- National Renewable Energy Laboratory. EVI-EnSite: Electric Vehicle Infrastructure—Energy Estimation and Site Optimization Tool. Available online: https://www.nrel.gov/transportation/evi-ensite.html (accessed on 30 April 2021).
- Burnham, A.; Dufek, E.J.; Stephens, T.; Francfort, J.; Michelbacher, C.; Carlson, R.B.; Tanim, T.R. Enabling fast charging—Infrastructure and economic considerations. J. Power Sources 2017, 367, 237–249. [Google Scholar] [CrossRef]
- Lammert, M.P.; Bugbee, B.; Hou, Y.; Mack, A.; Muratori, M.; Holden, J.; Duran, A.; Swaney, E. Exploring Telematics Big Data for Truck Platooning Opportunities. In WCX World Congress Experience; SAE International: Detroit, MI, USA, 2018. [Google Scholar]
- Karich, P.; Schröder, S. Graphhopper. 2014, Volume 4, p. 15. Available online: http://www.graphhopper.com (accessed on 2 April 2021).
- Muratori, M.; Bush, B.; Hunter, C.; Melaina, M.W. Modeling Hydrogen Refueling Infrastructure to Support Passenger Vehicles. Energies 2018, 11, 1171. [Google Scholar] [CrossRef] [Green Version]
- Gao, Z.; Lin, Z.; Davis, S.C.; Birky, A.K. Quantitative Evaluation of MD/HD Vehicle Electrification using Statistical Data. Transp. Res. Rec. 2018, 2672, 109–121. [Google Scholar] [CrossRef]
- Mareev, I.; Becker, J.; Sauer, D.U. Battery dimensioning and life cycle costs analysis for a heavy-duty truck considering the requirements of long-haul transportation. Energies 2018, 11, 3446. [Google Scholar] [CrossRef] [Green Version]
- Tomaszewska, A.; Chu, Z.; Feng, X.; O’Kane, S.; Liu, X.; Chen, J.; Ji, C.; Endler, E.; Li, R.; Liu, L.; et al. Lithium-ion battery fast charging: A review. ETransportation 2019, 1, 100011. [Google Scholar] [CrossRef]
- Anseán, D.; González, M.; Viera, J.; García, V.; Blanco, C.; Valledor, M. Fast charging technique for high power lithium iron phosphate batteries: A cycle life analysis. J. Power Sources 2013, 239, 9–15. [Google Scholar] [CrossRef]
- Zhang, S.; Xu, K.; Jow, T. Study of the charging process of a LiCoO2-based Li-ion battery. J. Power Sources 2006, 160, 1349–1354. [Google Scholar] [CrossRef]
- Chen, L.; Wu, S.; Shieh, D.; Chen, T. Sinusoidal-Ripple-Current Charging Strategy and Optimal Charging Frequency Study for Li-Ion Batteries. IEEE Trans. Ind. Electron. 2013, 60, 88–97. [Google Scholar] [CrossRef]
- Abdel-Monem, M.; Trad, K.; Omar, N.; Hegazy, O.; Van den Bossche, P.; Van Mierlo, J. Influence analysis of static and dynamic fast-charging current profiles on ageing performance of commercial lithium-ion batteries. Energy 2017, 120, 179–191. [Google Scholar] [CrossRef]
- Chargepoint Express Plus Datasheet. Available online: www.chargepoint.com/files/datasheets/ds-expressplus.pdf (accessed on 24 April 2019).
- CharIN High Power Commercial Vehicle Charging Task Force Aggregated Requirements. 18 February 2019. Available online: www.charinev.org/fileadmin/HPCCV/High_Power_Commercial_Vehicle_Charging_Requirements_v2.0.pdf (accessed on 24 April 2019).
Publisher’s Note: MDPI stays neutral with regard to jurisdictional claims in published maps and institutional affiliations. |
© 2022 by the authors. Licensee MDPI, Basel, Switzerland. This article is an open access article distributed under the terms and conditions of the Creative Commons Attribution (CC BY) license (https://creativecommons.org/licenses/by/4.0/).