Abstract
No systematic comparative study has been conducted on the factors controlling organic matter enrichment in the different depositional environments of the Lower Cambrian Qiongzhusi Formation in the western Middle Yangtze Block, leading to a large discrepancy in our understanding. Based on organic geochemical and elemental analyses of core, outcrop, rock, and mineral samples from the slope, deep-water shelf, and shallow-water shelf, in this study, comparative analysis of the organic matter content, sedimentological characteristics, and depositional paleoenvironments of the Lower Cambrian Qiongzhusi Formation in the western Middle Yangtze Block was conducted, and the main controlling factors and models of the organic matter enrichment were investigated. The results revealed that the organic matter enrichment in the Qiongzhusi Formation was jointly controlled by redox conditions, water restriction, upwelling currents, terrigenous inputs, and paleo-productivity, but the main factors controlling the enrichment during the different periods were significantly different. (1) During the deposition of the Qiong 1 Member, the extensional rifting was strong, and the sea level was always high. The low degree of terrigenous dilution and anoxic conditions favored organic matter preservation. In this period, the upwelling currents were the main factor controlling organic matter enrichment. The paleo-productivity decreased as the intensity of the upwelling currents gradually weakened from the slope to the shelf, leading to a decrease in the total organic carbon (TOC) content and thereby a gradual decrease in the biogenic silica content of the shale. (2) During the deposition of the Qiong 2 Member, the extensional rifting weakened, and the sea level continued to drop. The upwelling currents, terrigenous input, and redox conditions were all important factors controlling the organic matter enrichment in the region. From the slope to the shelves, the conditions favorable for organic matter enrichment gradually worsened, and the TOC content gradually decreased, with the lithofacies gradually transitioning from biogenic siliceous shale to clayey shale or clayey-calcareous shale. (3) During the deposition of the Qiong 3 Member, the Yangzi Platform underwent a filling and leveling-up process, and the redox conditions played a major role in controlling the organic matter enrichment. The entire region was dominated by an oxygen-rich environment, and the conditions were no longer favorable for organic matter preservation, leading to a low average TOC content. Overall, the spatial variability of the TOC content was closely associated with changes in the depositional paleoenvironment caused by sea-level changes.
1. Introduction
The Early Cambrian marked the beginning of the Phanerozoic and was one of the important turning points in geological history, covering the transition from the Neoproterozoic glacial event to the Neoproterozoic snowball Earth events [1], with dramatic changes in the global paleoclimate, paleo-ocean environment, and paleo-community [2,3,4,5]. During the Early Cambrian period, large-scale global transgression events and regional extensional rifting occurred [6,7], leading to extensive deposition of a black shale sequence in the Yangzi region, which is given different names in different areas. For example, it is known as the Niuqitang Formation in Huan, Chongqing, and Guizhou; the Shuijingtuo Formation in western Hubei; the Qiongzhusi Formation in Western Sichuan; and the Guojiaba Formation in southern Shaanxi. In this study, this shale sequence is collectively referred to as the Qiongzhusi Formation. The shale sequence has significant characteristics, such as a large thickness, high organic matter content, and abundant biogenic fossils [8], and it is another essential shale gas exploration sequence in the Yangzi region after the Wufeng Formation-Longmaxi Formation [9,10,11].
The dark mud shale of the Lower Cambrian Qiongzhusi Formation is a hydrocarbon source rock that was deposited during the important Ediacaran–Cambrian transition. It was deposited continuously and is well preserved in the western Middle Yangtze Block, providing an excellent opportunity to study the relationship between changes in the marine environment and organic matter enrichment during this critical period in Earth’s history [5]. Previous studies of the main factors controlling the organic matter enrichment in this set of hydrocarbon source rocks are limited, and they mainly focused on areas where the Lower Cambrian outcrops are well developed and drilling wells are present, such as northern Guizhou and western Hunan. These studies reported five organic matter enrichment-controlling factors. First, the high sea level and low terrigenous inputs caused by the rapid transgression in the Early Cambrian favored organic matter enrichment [9,12]. Second, the high paleo-productivity and anoxic bottom-water conditions jointly controlled the organic matter enrichment [13,14,15]. Third, the organic matter enrichment model is mainly a preservation model, with anoxic bottom water conditions serving as the main controlling factor [5,16,17,18]. Fourth, the upwelling currents on the slope were the main cause of organic matter enrichment [19,20,21]. Lastly, local seafloor hydrothermal activity provided the necessary materials and preservation conditions for organic matter enrichment [22,23,24,25]. In summary, the organic matter enrichment of the Lower Cambrian shale in the western Middle Yangzi Block was controlled by a variety of geological processes. However, because its depositional environment spans the slope-shelf region (Figure 1a) and varies greatly in the different depositional environments, no systematic comparative analysis was conducted in previous studies to determine the factors controlling organic matter enrichment in the different environments, thereby leading to a large discrepancy in our understanding.
2. Regional Geologic Setting
The study region geographically covers northern Guizhou Province, western Hunan Province, and western Hubei Province (Figure 1a), and it is tectonically located in the trough-like fold belt in western Hunan and Hubei and in the western margin of the Jianghan Basin [26]. After the breakup of the Neoproterozoic Rodinia supercontinent, the Yangzi Block gradually evolved from a rift basin to a craton basin during the Ediacaran–Cambrian transition [8,15,19], during which the internal rift troughs experienced five stages. The first stage is pre-extension at the end of the deposition of the Dengying Formation. The second stage is the initial extension during the deposition of the Yanjiahe/Maidiping FormationThe third stage is the maximum extension during the early stage of the deposition of the Qiongzhusi Formation, i.e., when a large-scale transgression occurred in the Yangzi region, forming a large area of anoxic bottom-water conditions, and the subsequent upwelling currents supplied large amounts of nutrients, leading to extensive deposition of black shale. The fourth stage is the weakening of the extension during the late stage of the deposition of the Qiongzhusi Formation-Shippai/Canglangpu Formation, which was accompanied by a large-scale marine regression in the Yangtze region and increased the supply of detrital materials from the surrounding ancient land, leading to rapid filling of the rift troughs and the gradual disappearance of the uplift and depression pattern in the Yangtze region. The last stage is the cessation of extension during the deposition of the Tianheban/Longwangmiao Formation, i.e., when the rift troughs were completely filled and leveled up, leading to the complete disappearance of the uplift and depression pattern and the start of carbonatite platform development [27,28,29,30,31].
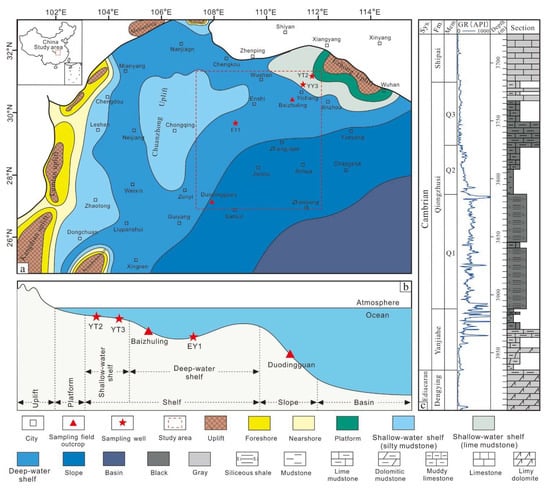
Figure 1.
(a) Map showing the location of the study area and the lithofacies of the Early Cambrian Qiongzhusi Formation in the middle and upper Yangzi region in southern China (adapted from [31]); (b) NE-SW cross-section of the Qiongzhusi Formation in the study area from the ancient land to the deep-water basin; and (c) stratigraphic histogram of the Qiongzhusi Formation in the study area (in well EY1).
From bottom to top, the Lower Cambrian strata in the region include the Yanjiahe Formation, Qiongzhusi Formation, Shipai Formation, and Tianhepan Formation (Figure 1c). The Yanjiahe Formation is primarily composed of siliceous-phosphorus dolomite and siliceous rocks intercalated with lime mudstone, which conformably overlies the algal dolomite of the underlying Sinian Dengying Formation. However, its distribution is quite limited, and it mainly occurs at the center of the intra-land rift. The Qiongzhusi Formation unconformably overlies the Dengying Formation or conformably overlies the Yanjiahe Formation (Figure 2) [8,32], which can be divided into three members from the bottom to the top according to the lithology, electrical properties, and geochemical characteristics. (1) The Qiong 1 Member (Q1) is mainly composed of gray-black organic-rich carbonaceous-siliceous shale with high Gamma Ray (GR) values. (2) The Qiong 2 Member (Q2) is mainly composed of dark gray carbonaceous shale and gray shale with intermediate organic matter content and GR values. (3) The Qiong 3 Member (Q3) is mainly composed of gray to gray-white siltstone and gray shale with low organic matter contents and low GR values. The Shipai Formation is mainly composed of clayey/sandy shale and marl deposits and conformably overlies the Qiongzhusi Formation (Figure 2). The Tianhepan Formation is mainly composed of marl and conformably overlies the Shipai Formation [7,17]. The depositional sequence of the Qiongzhusi Formation is well developed in the study area, i.e., from shallow-water shelf facies to deep-water shelf facies to slope facies from northeast to southwest (Figure 1a) [9,30].
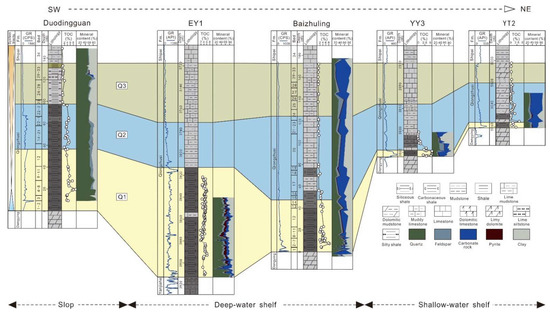
Figure 2.
The stratigraphy of the Lower Cambrian Qiongzhusi Formation in the western Middle Yangtze Block and the depositional filling characteristics during the different periods. The locations of the wells and outcrops are shown in Figure 1a. Natural gamma data (in counts per second or cps) for the Duodingguan and Baizhuling outcrops, which were measured using an HD-2000 handheld radiometer produced by the Instrument Research and Development Institute of the Beijing Research Institute of Uranium Geology, with a testing range of 0.2–0.5 m.
In this study, the Qiongzhusi Formation in the western Middle Yangtze Block was taken as the study area, and samples were collected from the slope (Duodingguan, Weng’an), the deep-water shelf (Baizhuling, Changyang), and from wells YY3 and YT2 in the shallow-water shelf. The samples were subjected to sedimentological, mineralogical-petrological, and geochemical analysis (Figure 1a,b) to systematically explore the changes in the lithofacies and depositional paleoenvironment of the Qiongzhusi Formation along the slope → deep-water shelf → shallow-water shelf continuum in the western Middle Yangzi Block in order to clarify the main factors controlling the shale organic matter enrichment during the different periods of the deposition of the Qiongzhusi Formation and to develop an organic matter enrichment models.
3. Materials and Methods
3.1. Samples
In this study, a total of 163 samples were collected from the black shale of the Qiongzhusi Formation, including 34 from well YT2, 23 from well YY3, 52 from Baizhuling, and 54 from Duodingguan. The samples were analyzed to determine their organic carbon contents, mineral compositions, and lithological characteristics, and micropaleontological identification was conducted. Based on the analysis results, 13, 17, and 13 of the samples from wells YY3, Baizhuling, and Duodingguan, respectively, were selected for elemental analysis.
3.2. Analytical Methods
All analyses conducted in this study were performed in the Geological Laboratory of the PetroChina Southwest Oil and Gas Field Company. The organic carbon content was measured using a CS-344 carbon and sulfur analyzer with an analytical accuracy of ±0.5%. The thin sections of the samples were stained with a mixture of alizarin red and potassium ferricyanide. X-ray diffraction analysis was performed using a Phillips Xpert-MPD X-ray diffractometer. The major elements were analyzed using the fusion method. First, aliquots (approximately 1 g) of the sample were calcined in a muffle furnace at 920 °C for 3–4 h to remove the organic matter and carbonate, and then they were weighed to record the weight loss. Aliquots (approximately 0.5 g) of the calcined sample powder were uniformly mixed with Li2B4O7 (approximately 4.0 g), and the mixture was melted into a glass disk, which was subjected to X-ray fluorescence measurements using a Rigaku 100e wavelength dispersive X-ray fluorescence spectrometer (XRF). The trace and rare earth elements were measured using a Thermo Scientific Element XR inductively coupled plasma mass spectrometer (ICP-MS). Specifically, accurately weighed aliquots (50 mg) of the powdered rock samples were placed in a 25 mL polytetrafluoroethylene sample container and dissolved in a mixture of 2 mL of HNO3, 1 mL of HCl, and 3 mL of HF. The resulting solution was evaporated on a 150 °C hot plate until dry, followed by the addition of 1 mL of HNO3 and 3 mL of HF to the container. The container was sealed and heated at 180 °C for 48 h until the residue was completely dissolved. Finally, the concentrated solution was transferred to a polyethylene bottle and diluted to 100 mL with 2% HNO3, followed by ICP-MS measurements.
3.3. Data Presentation
The degree of enrichment of element X in sediment was described by its enrichment factor (XEF) [15,17]:
XEF = (X/Al)sample/(X/Al)PAAS
Here, X and Al represent the contents of element X and Al in the sediment sample, respectively. The X/Al content ratio of the sample was normalized to the Post Archean Australian Shale (PAAS).
The content of a biogenic element can be calculated using the following formula:
where X and Al denote the contents of a given element X and Al in the sample, and the ratio of X/Al is normalized to PAAS.
Xxs = Xsample − A1sample (X/A1)PAAS
4. Results and Discussion
4.1. Organic Carbon Content and Basic Geological Characteristics of the Shale
The total organic carbon (TOC) contents, sedimentological characteristics, and mineralogical-petrological characteristics of the dark mud shale of the Lower Cambrian Qiongzhusi Formation in the study area were determined and compared along the slope → deep-water shelf → shallow-water shelf continuum based on core and outcrop observations, thin-section observations, and whole-rock X-ray diffraction analysis (Figure 2, Figure 3 and Figure 4).
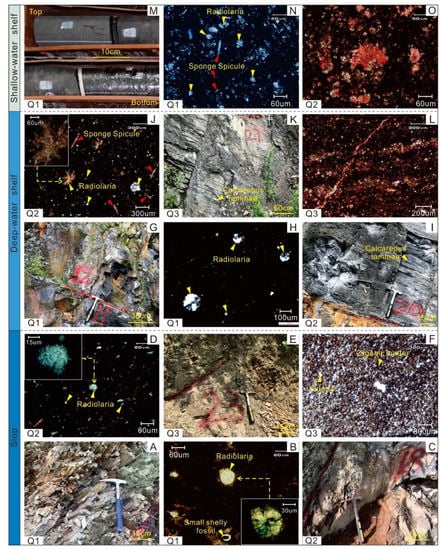
Figure 3.
Sedimentological and mineralogical-petrological characteristics of the Qiongzhusi Formation in the western Middle Yangtze Block along the slope → deep-water shelf →shallow-water shelf continuum. Slope (A–F): (A) gray-black siliceous shale in bed 3 of the Qiong 1 Member (Q1) in Duodingguan; (B) siliceous shale rich in siliceous radiolarians and small shell fossils (with a shell wall composed of a single siliceous layer) collected from the bottom of bed 3 of Q1 in Duodingguan and observed under plane polarized light, with a magnified image of radiolarians under cross-polarized light in the lower right inset; (C) gray-black siliceous shale from bed 18 of the Qiong 2 Member (Q2) in Duodingguan; (D) siliceous shale rich in siliceous radiolarians and siliceous bioclasts collected from Q2 in Duodingguan and observed under cross-polarized light; (E) gray silty shale with a bamboo leaf-like shape after weathering, from the boundary of beds 23 and 24 of the Qiong 3 Member (Q3) in Duodingguan; (F) silty shale from the middle of bed 23 of Q3 in Duodingguan and observed under plane polarized light, containing fine-powder crystal grains of quartz dispersed in a clay-rich matrix with a small amount of bioclasts. The deep-water shelf (G–L): (G) gray-black siliceous shale from the boundary between beds 11 and 12 of Q1 in Baizhuling; (H) siliceous shale containing massive radiolarians, from the bottom of bed 12 of Q1 in Baizhuling, observed under plane polarized light; (I) gray-black calcareous-siliceous shale with calcareous laminae, from bed 20 of Q2 in Baizhuling; (J) calcareous-siliceous shale incompletely metasomatized by calcite, from the bottom of bed 18 of Q2 in Baizhuling, containing visible radiolarians (yellow arrows) and spicules (red arrows) under cross-polarized light, with a magnified image of the tangential section of a radiolarian in the upper left inset; (K) gray calcareous shale with interbedded dark gray clayey laminae and gray-white calcareous laminae of unequal thickness, from bed 27 of Q3 in Baizhuling; (L) calcareous shale with interbedded calcareous laminae and clay-rich laminae of unequal thickness in the longitudinal direction, from the bottom of bed 27 of Q3 in Baizhuling and observed under plane polarized light. The shallow-water shelf (M–O): (M) gray-black siliceous shale, 3050–3051 m, well YY3, Q1; (N) siliceous shale rich in radiolarians (yellow arrows) and sponge spicules (red arrows), 3049.7 m, well YY3, Q1, observed under cross-polarized light; (O) clayey-calcareous shale, 3046 m, well YY3, Q2, observed under plane-polarized light.
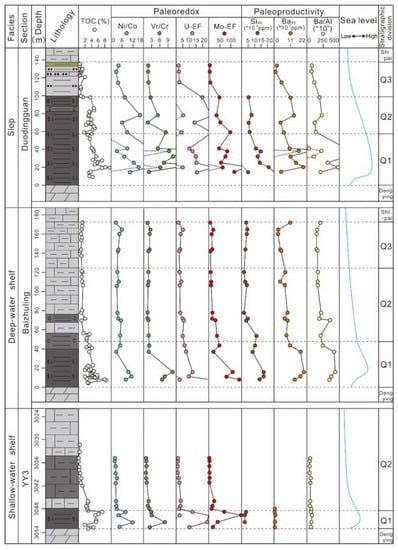
Figure 4.
Variations in the TOC content, paleo-redox conditions, paleo-productivity, and sea level in the different zones during the deposition of the Qiongzhusi Formation in the study area (see Figure 2 for lithology legend).
4.1.1. Organic Carbon Content
The TOC content varies significantly in the different zones and within the different periods. The TOC is highest in the slope zone, ranging from 0.2% to 9.5%, with a mean of 3.2%. The average values for Q1, Q2, and Q3 are 5.1%, 3.6%, and 0.8%, respectively. The TOC content is second highest in the deep-water shelf, ranging from 0.4% to 8.5%, with a mean of 2.8%. The average values for Q1, Q2, and Q3 are 4.1%, 1.8%, and 0.9%, respectively. The TOC content is the lowest in the shallow-water shelf, ranging from 0.1% to 7.3%, with a mean of 1.5%. The average values for Q1, Q2, and Q3 are 3.7%, 1.1%, and 0.7%, respectively (Figure 2).
In general, the TOC contents of the different zones gradually decrease vertically in the order of Q1 → Q2 → Q3. Horizontally, the TOC contents of Q1 and Q2 gradually decrease in the order of slope → deep-water shelf → shallow-water shelf. The TOC contents of the different zones are relatively low in Q3 and do not vary significantly.
4.1.2. Sedimentological and Mineralogical-Petrological Characteristics
Q1: Both the slope and shelf are dominated by gray–black biogenic siliceous shale deposits (Figure 2) without internal laminae (Figure 3A,G,M). In these zones, the skeletal grains are mainly radiolarians and sponge spicules, and abundant small, yet visible, shell fossils are present and are generally filled with siliceous minerals in the slope zone (Figure 3B,H,N). The content of the siliceous minerals (quartz + feldspar) is the highest among the three members, averaging 66.1%, and it is dominated by quartz (mean of 51.8%), which is mostly in the form of biogenic microcrystalline-powder crystalline grains with a rounded-subrounded shape [15]. The quartz contents of the different zones decrease in the following order: slope (mean 75.3%) > deep-water shelf (mean 48.8%) > shallow-water shelf (mean 31.8%). The contents of both the carbonatite and clay minerals are low and gradually increase in the order of slope (means of 0.1% and 18.4%, respectively) → deep-water shelf (means of 19.6% and 16.4%, respectively) → shallow-water shelf (means of 24.0% and 22.5%, respectively) (Figure 2), reflecting a gradual increase in the terrigenous input from Central Hubei ancient land.
Q2: The petrographic types and characteristics of the different zones vary greatly. (1) The slope is still dominated by gray–black biogenic siliceous shale deposits with a high quartz content (mean 62.7%). Abundant siliceous bioclasts and radiolarian skeletal grains are visible under the microscope (Figure 2 and Figure 3C,D). The clay mineral content is low (average of 24.8%), and the carbonatite content is extremely low (average of only 0.1%). (2) The petrographic types in the deep-water shelf zone are dominated by clayey-siliceous shale interbedded with calcareous-siliceous shale. The quartz content is low (mean of 28.2%) and is dominated by biogenic sub-rounded grains and spicules, most of which are metasomatized by calcite. The average clay mineral content is 30.4%, and the average carbonatite content is 31.0%. The profile contains apparent calcareous laminae intercalated in the black shale, while the laminae are not clearly visible under the microscope, and the calcareous materials are mainly in the form of speckles along the laminae in an organic matter-rich clay matrix (Figure 2 and Figure 3I,J). (3) The lithology of the shallow-water shelf is dominated by clayey shale (average clay mineral content of 58.2%) interbedded with clayey-calcareous shale (average carbonatite content of 40.0%), and it has a low quartz content (mean of 26.1%) (Figure 2 and Figure 3O). From the slope to the shallow-water shelf, both the carbonatite and clay mineral contents tend to gradually increase, while the quartz content decreases, reflecting a gradual increase in the terrigenous input from the Central Hubei ancient land.
Q3: (1) The slope is dominated by dark gray silty shale, which has a bamboo leaf-like shape after field weathering (Figure 2 and Figure 3E). The quartz content is high (mean of 56.8%) and is dominated by sub-angular fine-powder crystal grains, which mainly came from terrigenous recharge [15] and are often granularly dispersed in the clay-rich matrix. Biogenic quartz grains are rare (Figure 3F). The mean clay mineral content is 34.7%, and the carbonatite content is still low (average of 1.5%). (2) The deep-water shelf is dominated by calcareous shale (Figure 2), which has low contents of both quartz (mean of 16.8%) and clay minerals (mean of 17.9%) but high content of carbonatite (mean of 57.2%). The outcrop contains a large number of ~5 cm thick calcareous beds (Figure 3K), and calcareous laminae were observed under the microscope (Figure 3L). (3) The shallow-water shelf is dominated by continuous tuff and gray dolomite deposits (Figure 2). The carbonatite content significantly increases from the slope to the shallow-water shelf, while the quartz and clay mineral contents decrease, reflecting a gradual increase in the terrigenous input from the Central Hubei ancient land.
4.2. Evolutionary Features of the Depositional Paleoenvironment
4.2.1. Paleo-Redox Conditions
Trace elements such as U and Mo are considered redox-sensitive elements and are readily soluble under oxidizing conditions but not under reducing conditions [33]. Their enrichment in sediments is generally described using their Enrichment Factors (EFS), which are free of interferences from the terrigenous input and other factors and thus are considered to be a reliable indicator of the redox environment of the water column.
In addition, trace element indicators, such as Ni/Co and V/Cr, are also commonly used to determine the redox environment of water bodies. Ni/Co > 7 and V/Cr > 4.25 indicate an anoxic environment, Ni/Co ratios of 5–7 and V/Cr ratios of 2–4.25 indicate an oxygen-poor environment, and Ni/Co < 5 and V/Cr < 2 indicate an oxygen-rich environment [34].
Based on the Ni/Co, V/Cr, U-EF, and Mo-EF values in the study area during the deposition of Q1, the slope (mean values of 24.9, 11.0, 17.8, and 98.5, respectively) and the deep-water shelf (mean values of 7.5, 5.9, 12.7, and 80.1, respectively) were both predominantly anoxic, and the bottom water of the slope had the strongest reducing conditions, while the shallow-water shelf (mean values of 7.3, 4.0, 18.6, and 71.0, respectively) was predominantly an anoxic to oxygen-poor environment. During the deposition of Q2, the values of all indicators decreased significantly in the different zones. The slope was still predominantly by an anoxic environment (mean values of 9.7, 4.4, 23.3, and 58.5, respectively), but the reducing conditions of the bottom water weakened significantly. The deep-water shelf (mean values of 4.2, 1.7, 3.9, and 18.1, respectively) was predominantly an oxygen-poor environment in the early stage (samples BZL16-1 and BZL17-2) and an oxygen-rich environment in the middle to late stages, while the shallow-water shelf (mean values of 2.9, 1.3, 2.2, and 7.7, respectively) was an oxygen-rich environment. During the deposition of Q3, the values of the various indicators in the different zones decreased further, indicating that the study region as a whole was an oxygen-rich environment (Figure 4, Table 1).

Table 1.
Calculated major and trace element compositions of the slope, deep-water shelf, and shallow-water shelf zones in the Qiongzhsi Formation in the western Middle Yangtze Block.
During the deposition period of Q1, the bottom water in the study region was generally strongly reducing, which was favorable for the preservation of organic matter. Due to the influence of the deposition environment, the strength of the reducing conditions of the bottom water gradually weakened in the order of slope → deep-water shelf → shallow-water shelf. During the deposition of Q2, the sea level continuously fell [9,17], which led to the gradual destruction and eventual disappearance of early-stage oxygen-poor conditions that were favorable for the preservation of organic matter.
4.2.2. Degree of Water Restriction
The ratio of the redox-sensitive element Mo to the TOC is often used as an indicator of the degree of seawater restriction, with lower Mo/TOC values indicating stronger water restriction (Figure 5). However, this method is only applicable to anoxic environments with a certain degree of water mass restriction [35]. During the deposition of Q1, the water column was predominantly an anoxic environment with Mo/TOC values of mostly around 9 in both the slope (7.6–12.5 with a mean of 9.6) and the deep-water shelf (8.3–13.4 with a mean of 9.8) zones (Figure 5, Table 1). This indicates that the water environment was semi-restricted in both zones, and the degree of water restriction did not differ significantly, which is obviously inconsistent with the actual geologic setting, i.e., the slope is located in the passive continental margin, and thus the degree of water restriction should be weaker. Studies have shown that open-ocean environments at passive continental margins provide conditions favorable for the simultaneous enrichment of both organic matter and Mo, but simultaneous enrichment of Mo and TOC leads to low Mo/TOC values, and thereby, this ratio cannot be used to effectively evaluate the degree of water restriction under these conditions. Thus, the plot of Co−EF×Mn−EF versus Al may be a more effective discriminatory tool in this case [36,37] (discussed in detail in Section 4.2.3). In the shallow-water shelf zone, the Mo/TOC values are mostly around 4.5 (3.2–6.3, mean of 4.8), indicating a moderately to strongly restricted water environment (Figure 5, Table 1), with a much higher degree of water restriction compared to the slope and deep-water shelf. During the deposition of Q2, the water column on the slope was still predominantly anoxic, with Mo/TOC values ranging from 8.9 to 44.3 (average of 19.7), indicating relatively weak water restrictions. The deep-water shelf was dominated by an oxygen-poor environment in the early stage, with a mean Mo/TOC value of 8.6, indicating a much higher degree of water restriction compared to the slope. The higher degree of water restriction in the deep-water shelf zone was presumably due to the drop in sea level, which ended the conditions that were favorable for the simultaneous enrichment of organic matter and Mo. Thereafter, the water column was enriched in oxygen, and the Mo enrichment was mainly controlled by the redox conditions; thus, the Mo/TOC ratio was no longer a valid indicator of the degree of water restriction (Figure 5, Table 1).
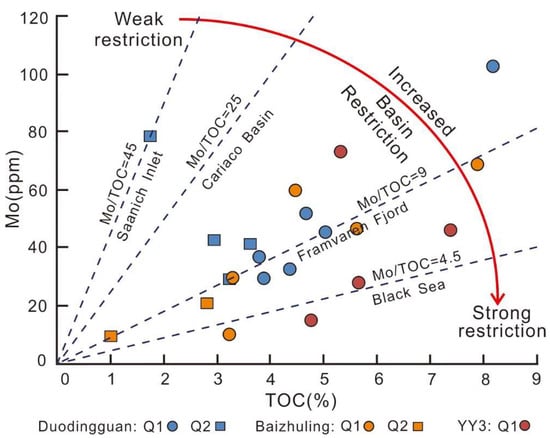
Figure 5.
The relationship between Mo and TOC in the different zones during the deposition of the Qiongzhusi Formation in the study area after exclusion of data from the oxygen-rich environment. The Mo/TOC data for the four modern basins are from [35].
The tectonic movement and sea level rise/fall significantly affected the degree of water restriction and, in turn, the degree of nutrient exchange in the water column, which is important for organic matter enrichment. As was found in this study, the degree of water restriction was significantly higher in the shallow-water shelf zone (moderate to strong restriction) than in the deep-water shelf zone (moderate restriction) and the slope zone, suggesting that the shallow-water shelf had the weakest connectivity to the ocean. However, the Mo/TOC ratio has limitations as an indicator of the degree of water restriction in the slope.
4.2.3. Upwelling Currents
The upwelling environments at continental margins (such as the Peruvian Margin and Namibian Margin in the modern oceans) are characterized by high primary productivity. This is mainly due to the massive upwelling of deep water driven by upwelling currents, which supply large amounts of nutrients. However, this deep water is often deficient in Co and Mn, so the Co and Mn enrichment of sediments in upwelling environments is limited by their resupply [38]. In restricted basins, the supply of Co and Mn is dominated by fluvial inflow, which makes it unlikely that Co and Mn enrichment will be limited by their supply [38]. Given the above-mentioned differences in the water column properties of the two types of water environments, Sweere et al. reported that the Co-EF × Mn-EF value is greater than 2 in restricted water environments, less than 0.5 in open/upwelling environments, and 0.5–2 in seasonally upwelling environments (Figure 6) [38].
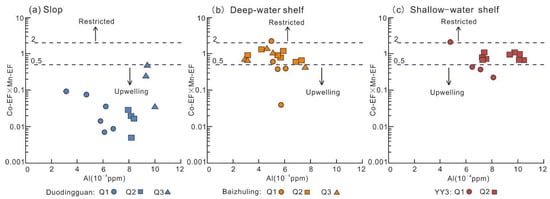
Figure 6.
The relationship between Co−EF×Mn−EF and Al in the different zones of the Qiongzhusi Formation in the study area [38]). Co−EF and Mn−EF are the enrichment coefficients of Co and Mn, respectively, which were calculated using Equation (1).
The upwelling currents during the deposition of the Qiongzhusi Formation on the Yangtze Platform mainly affected the slope depositional environment on the southeastern margin (in northern Guizhou), where the high contents of phosphorus, silicon, and iron group elements, bacteria, and other biologically beneficial nutrients supplied by the upwelling currents promoted organic matter enrichment [9,10,11,18,19,20,21,22,23]. However, previous studies have not systematically analyzed the influence of ocean currents, resulting in a poor understanding of organic matter enrichment models. Under the above context, in this study, the characteristics and effects of ocean currents in the different depositional periods and different zones in the western Middle Yangtze Block were compared. For the ocean currents during the deposition of Q1, the following results were obtained: (1) The Co−EF×Mn−EF values in the slope zone ranged from 0.007 to 0.09, with a mean of 0.04. The slope was in an open/upwelling current environment with a strong current (Figure 6a, Table 1). (2) The Co−EF×Mn−EF values in the deep-water shelf zone range from 0.04 to 2.29, with a mean of 0.75. The deep-water shelf was in the transition zone from an open/upwelling environment to a seasonal current environment, where the current was significantly weakened and the water restriction was significantly enhanced compared with the slope zone (Figure 6b, Table 1). (3) The Co−EF×Mn−EF values ranged from 0.24 to 2.15, with a mean of 0.81 in the shallow-water shelf, where the current was even weaker (Figure 6c, Table 1) and water restriction was greater than in the deep-water shelf zone. During the deposition of Q2, the Co−EF×Mn−EF values in the slope ranged from 0.005 to 0.03, with a mean of 0.02, and the ocean current remained strong. In contrast, the deep-water shelf and shallow-water shelf were in a seasonally upwelling environment, where the ocean current was significantly weaker (Figure 6, Table 1), and the water restriction was significantly greater. During the deposition of Q3, the Co−EF×Mn−EF values in the slope zone ranged from 0.04 to 0.52, with a mean of 0.27, and the ocean current was significantly weaker than during the deposition of Q1 and Q2. During this period, the ocean current decreased from the slope to the deep-water shelf (Figure 6a,b, Table 1).
As discussed above, the plot of Co−EF×Mn−EF versus Al provides an effective means of identifying oxygen-rich waters and open ocean waters at passive continental margins, and it overcomes the limitations of the Mo/TOC ratio as an indicator in this regard [36,37]. On the slope, the upwelling currents were always active, and the water restriction was weak. This allowed a large amount of nutrients to be introduced from the deep ocean waters, which promoted organic matter production. As the sea water gradually shallowed from the deep-water shelf to the shallow-water shelf, the intensity of the ocean currents gradually weakened and the water restriction gradually increased, leading to a gradual decrease in the promotion effect on organic matter production.
4.2.4. Paleo-Productivity
Elements such as Ba and Si in marine sediments are the most commonly used paleo-productivity indicators, with higher contents reflecting higher primary paleo-productivity. It should be noted that in an oxidizing water environment, barium sulfate is in a saturated state, and Ba can be well preserved. In a reducing water environment, Ba is lost since barium sulfate is reduced and decomposed by sulfur-reducing bacteria, and thus, the Ba content cannot truly represent the paleo-productivity [39,40]. Since elements of biogenic and terrestrial origin coexist in most sedimentary rocks, paleo-productivity is often evaluated in terms of the content of a biogenic element or the Ba content after normalization to Al to remove the interference of the terrigenous input [14,17,39].
The study area was a reducing environment during the deposition of Q1. The Sixs (×10−4), Baxs (×10−2), and Ba/Al (×104) values indicate that the slope (means values of 17.1 ppm, 24.1 ppm, and 478.9, respectively) had the highest paleo-productivity, followed by the deep-water shelf (mean values of 13.3 ppm, 16.0 ppm, and 362.0, respectively) and the shallow-water shelf (mean values of 2.7 ppm, 0.3 ppm, and 66.0 ppm, respectively) (Figure 4). During the deposition of Q2, the sea level began to drop gradually [9], and the values of all indicators decreased significantly in the different zones. The Sixs (×10−4) and Baxs (×10−2) values were higher in the anoxic slope zone (mean values of 6.3 ppm and 8.8 ppm, respectively) than in the oxygen-rich deep-water shelf zone (mean values of 4.4 ppm and 7.4 ppm, respectively), while the Ba/Al (×104) values were lower in the slope zone (mean of 171.7) than in the deep-water shelf zone (mean of 210.4). The lower Ba/Al (×104) values of the slope zone were mainly due to the loss of Ba caused by sulfate reduction [9]. The paleo-productivity was higher in the slope zone than in the deep-water shelf. The shallow-water shelf, which was an oxygen-rich environment, had the lowest Ba/Al (×104) values (mean of 53.6), and accordingly, it had the lowest paleo-productivity (Figure 4). During the deposition of Q3, the terrigenous input increased as the sea level dropped further [9], and the entire study area was an oxygen-rich depositional environment. The shallow-water shelf was dominated by marl deposits, which had the weakest ability to exchange nutrients with the ocean, leading to the lowest paleo-productivity. Compared with the deep-water shelf, the slope was closer to the passive continental margin and was thus affected by the more active ocean currents (Figure 6), implying that its paleo-productivity should have been higher than that of the deep-water shelf. However, this implication contradicts the fact that the Baxs (×10−2) and Ba/Al (×104) values of the deep-water shelf (mean values of 5.0 ppm and 164.8 ppm, respectively) were higher than those of the slope (mean values of 2.4 ppm and 90.4 ppm, respectively) (Figure 4). This contradiction may be due to the failure to eliminate the interference of the Ba contained in the source carbonatite imported from the Central Hubei ancient land. As shown in Figure 2 and Figure 3 and Table 1, in Baizhuling, the Al2O3 content of Q3 is lower than those of Q1 and Q2, while the carbonatite content of Q3 is higher than those of Q1 and Q2.
As discussed above, the slope was close to the passive continental margin, where the upwelling currents were active and the water restriction was weak, leading to the strongest exchange of nutrients with the ocean and thereby the highest paleo-productivity during the deposition periods of all three members. In contrast, the upwelling currents gradually weakened, and the degree of water restriction gradually increased from the slope to the shelf, leading to a gradual decrease in the nutrient exchange with the ocean and thereby a gradual decrease in the paleo-productivity.
4.3. Main Controlling Factors and Models of Organic Matter Enrichment
Previous studies reported that the production and preservation conditions of organic matter in the marine environment are the fundamental controlling factors of organic matter enrichment [13,14,15,39,40,41]. As shown in Figure 7, the TOC content is positively correlated with the Ni/Co, V/Cr, U-EF, Mo-EF, Sixs (×10−4), Baxs (×10−2), and Ba/Al (×104) values, suggesting that both the redox conditions and the paleo-productivity affected the enrichment of the organic matter in the study area.
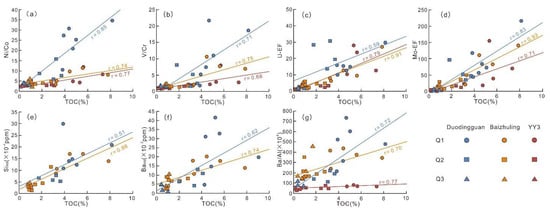
Figure 7.
(a–d) The relationships between the redox indicators (Ni/Co, V/Cr, U-EF, and Mo-EF) and the TOC content; and (e–g) the relationships between the paleo-productivity indicators (Sixs×10−4, Baxs×10−2, and Ba/Al×104) and the TOC content.
4.3.1. Deposition of Q1
During the early stage of the deposition of Q1 (Figure 8A), the extensional rifting in the study area was at its strongest [27,28,29]). The sea level in the Yangzi region is rising rapidly due to climate warming [37], and the accommodation space is rapidly increasing [7,8,9,31]. The shallow-water carbonate terraces developed on the Yangze Platform were extensively flooded and had low terrigenous inputs [9,12,42]. The entire study area was an under-compensated, anoxic water environment dominated by biogenic silica-rich shale deposits. The slope was close to the passive continental margin, where the water restriction was intermediate, and the upwelling currents transported a large amount of nutrients from the deep ocean waters, allowing vital elements such as Ba and Si to enter the water column rapidly. This provided the basis for the growth of algae, small shell organisms, radiolarians, and sponges [7]. The proper preservation conditions and high paleo-productivity in the slope zone were conducive to large-scale organic matter enrichment, thereby leading to the high TOC contents of the black shale deposited in this zone. The deep-water shelf was far from the passive continental margin, and its distribution was significantly controlled by the intra-platform rift trough (Western Hubei Trough). Compared with the slope, the deep-water shelf had a shallower water depth, stronger water restriction, and weaker upwelling currents, which led to lower paleo-productivity and thus lower TOC contents. The shallow-water shelf was close to the Central Hubei ancient land, where the upwelling currents were even weaker than on the deep-water shelf, leading to a further decrease in the paleo-productivity and thus the TOC content. During this period, the upwelling currents were the main factor controlling organic matter enrichment. The intensity of the upwelling currents affected the paleo-productivity and thus the organic matter enrichment, while the terrigenous input (low) and preservation conditions (anoxic) had little effect on the organic matter enrichment.
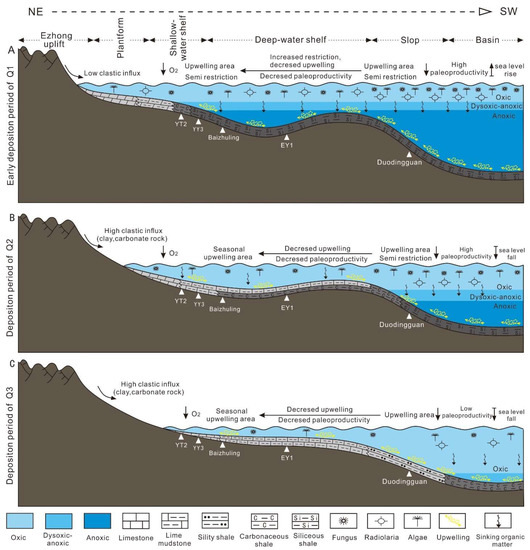
Figure 8.
Organic matter enrichment models for the different deposition periods of the Lower Cambrian Qiongzhusi Formation in the western Middle Yangtze Block.
During the middle to late stages of the deposition of Q1, the Yangzi region was in the early stage of a slow marine regression, and the sea level was still high in the study area. The organic matter enrichment conditions in the different zones, as well as the zone-to-zone variations, remained consistent during the early deposition stage of Q1.
4.3.2. Deposition of Q2
During the deposition of Q2 (Figure 8B), the sea level in the Yangzi region slowly fell [42,43], and the extensional rifting weakened. The rift basins transitioned from the expansion stage to the filling stage, while the depositional pattern basically remained the same as during the deposition of Q1 [27,28,29]. However, the accommodation space was somewhat reduced. The slope still remained deep below sea level, the water column was mainly anoxic, and the upwelling currents were still active, allowing for good connectivity with the ocean. The decrease in sea level led to an increase in the dissolved oxygen content of the seawater and weakened the reducing conditions of the bottom water, thereby worsening the conditions required for organic matter preservation. The sea level rise led to an increase in the terrigenous input from the central Sichuan uplift [42], which manifested as a decrease in the biogenic silica content and an increase in the clay mineral content (described in Section 4.1.2). The increased terrigenous input not only diluted the organic matter but also decreased the nutrient content of the water column, which led to a lower paleo-productivity and thus significantly lowered the TOC content in the slope zone compared to during the deposition of Q1. Compared with the slope, the water depth on the deep-water shelf was shallower. In this zone, the water column mainly transitioned from an oxygen-poor environment to an oxygen-rich environment, worsening the conditions required for organic matter preservation. In addition, the terrigenous input and the degree of depositional filling increased, and the intensity of the upwelling currents weakened, leading to a decrease in the paleo-productivity and thus a decrease in the TOC content of the shale being deposited. In the shallow-water shelf zone, the organic matter preservation conditions further worsened, leading to a further decrease in the TOC content. As the sea level continued to drop during this period, the upwelling currents, terrigenous input, and redox conditions all played significant roles in controlling organic matter enrichment in the study area.
4.3.3. Deposition of Q3
During the deposition of Q3 (Figure 8C), the sea level in the Yangzi region continued to drop, the extensional rifting weakened further, and the terrigenous input continued to increase [42]. The Yangtze Platform underwent a filling and leveling-up process. As a result, the uplift and depression patterns in the study area gradually disappeared [27,28,29], and the accommodation space continued to decrease. The entire region was an over-compensated, oxygen-rich environment in which the paleo-productivity was low and the organic matter preservation conditions worsened, leading to the lowest TOC contents. As the sea level dropped further during this period, the redox conditions were dominantly controlling the organic matter enrichment, followed by the terrigenous input, and the upwelling currents had little effect on the organic matter enrichment.
In summary, the organic matter enrichment in the study area was generally controlled by the redox conditions of the water column, water restriction, upwelling currents, terrigenous input, and paleo-productivity, among which the main controlling factors varied greatly throughout the deposition period. This variation was mainly due to the variations in the sea level during the different deposition periods, which ultimately led to heterogeneity in the spatial and temporal distributions of the organic matter content in the Qiongzhusi Formation.
5. Conclusions
The TOC content of the mud shale of the Qiongzhusi Formation in the study area varied greatly spatially. (1) The TOC content in the different zones gradually decreases from bottom to top. The organic-rich shale (TOC > 2%) is mainly distributed in Q1 and Q2 in the slope zone, as well as in Q1 in the deep-water and shallow-water shelf zones. (2) Horizontally, the TOC contents of Q1 and Q2 gradually decrease along the slope → deep-water shelf → shallow-water shelf continuum, while the TOC content of Q3 is low in all zones (<1%), with no significant variation between zones.
The petrographic characteristics of shale vary greatly among the different periods and zones. (1) During the deposition of Q1, both the slope and shelf zones were dominated by biogenic siliceous shale. From the slope to the shelves, terrigenous input gradually increased, leading to a gradual increase in carbonatite and clay mineral contents and a gradual decrease in biogenic silica content. (2) During the deposition of Q2, the terrigenous input increased significantly, and the slope was still dominated by biogenic siliceous shale, but the silica content decreased significantly. The lithofacies gradually transitioned to clayey shale and clayey-calcareous shale on the shallow-water shelf. (3) During the deposition of Q3, the Yangtze Platform underwent a filling and leveling-up process, and the slope was dominated by silty shale, while the shelves were dominated by lime mudstone and marl.
The main factors controlling organic matter enrichment varied greatly among the different periods. (1) During the deposition of Q1, the extensional rifting was strong, and the sea level was high. The entire study area received a low terrigenous input and had anoxic bottom-water conditions. The upwelling currents were the main factor controlling the organic matter enrichment, and their intensity gradually weakened from the slope to the shelves, leading to a decrease in paleo-productivity and thus a decrease in the TOC content. (2) During the deposition of Q2, the extensional rifting weakened, and the sea level continued to drop. The upwelling currents, terrigenous input, and redox conditions are the key factors in controlling the organic matter enrichment in the region, with the conditions favoring organic matter enrichment worsening and the TOC content gradually decreasing from the slope to the shelves. (3) During the deposition of Q3, the extensional rifting weakened further, and the sea level continued to drop. The redox conditions played a major role in controlling organic matter enrichment. The entire study area was mainly an oxygen-rich environment, and conditions favoring organic matter enrichment no longer existed, leading to a low TOC content in general.
Author Contributions
This paper is a collaborative work of all authors. Writing—original draft preparation, Z.L. Conceptualization and methodology, J.S. All authors have read and agreed to the published version of the manuscript.
Funding
This work was supported in part by the National Science and Technology Major Project of China [grant no. 2017ZX050,35001-002 to Junjun Shen].
Institutional Review Board Statement
Not applicable.
Informed Consent Statement
Not applicable.
Data Availability Statement
Not applicable.
Conflicts of Interest
The authors declare no conflict of interest.
References
- Hoffman, P.F.; Kaufman, A.J.; Halverson, G.P.; Schrag, P.D. A neoproterozoic snowball earth. Science 1998, 281, 1342–1346. [Google Scholar] [CrossRef] [PubMed] [Green Version]
- Marshall, C.R. Explaining the Cambrian “explosion” of animals. Annu. Rev. Earth Planet. Sci. 2006, 34, 355–384. [Google Scholar] [CrossRef] [Green Version]
- Wang, D.; Ling, H.F.; Struck, U.; Zhu, X.K.; Shields, G.A. Publisher correction: Coupling of ocean redox and animal evolution during the Ediacaran-Cambrian transition. Nat. Commun. 2018, 9, 3395–3403. [Google Scholar] [CrossRef] [PubMed]
- Hoffman, P.F.; Abbot, D.S.; Ashkenazy, Y.; Benn, D.I.; Brocks, J.J.; Cohen, P.A.; Cox, G.M.; Creveling, J.R.; Donnadieu, Y.; Erwin, D.H. Snowball earth climate dynamics and cryogenian geology-geobiology. Sci. Adv. 2017, 3, 1–43. [Google Scholar] [CrossRef] [PubMed] [Green Version]
- Zhu, G.Y.; Zhao, K.; Li, T.T.; Fu, X.D.; Zhang, Z.Y.; Chen, Z.Y.; Wang, P.J. Sedimentary environment, development model and distribution prediction of Lower Cambrian source rocks in South China. Acta Pet. Sin. 2020, 41, 1567–1586, (In Chinese with English Abstract). [Google Scholar]
- Wang, J.G.; Chen, D.Z.; Wang, Q.C.; Yan, D.T.; Wang, Z.Z. Platform evolution and marine source rock deposition during the terminal sinian to early Cambrian in the middle Yangtze region. Acta Geol. Sin. 2007, 818, 1102–1109, (In Chinese with English Abstract). [Google Scholar]
- Wu, S.Q.; Guo, J.H.; Wang, X.K.; Li, Z.Y.; Liu, Z.S.; Jiao, P.; Chen, G. Geochemical characteristics and organic matter enrichment mechanism of the Lower Cambrian Niutitang formation black rock series in central Hunan. J. Cent. South Univ. 2020, 51, 2049–2060, (In Chinese with English Abstract). [Google Scholar]
- Wang, S.F.; Zou, C.N.; Dong, D.Z.; Wang, Y.M.; Li, X.J.; Huang, J.L.; Guan, Q.Z. Multiple controls on the paleoenvironment of the Early Cambrian marine black shales in the Sichuan Basin, SW China: Geochemical and organic carbon isotopic evidence. Mar. Pet. Geol. 2015, 66, 660–672. [Google Scholar] [CrossRef]
- Liu, Z.B.; Gao, B.; Zhang, Y.Y.; Du, W.; Feng, D.J.; Nie, H.K. Types and distribution of the shale sedimentary facies of the Lower Cambrian in Upper Yangtze area, South China. Pet. Explor. Dev. 2017, 44, 21–31, (In Chinese with English abstract). [Google Scholar] [CrossRef]
- Wu, Y.; Fan, T.L.; Ding, H.Y. Lithofacies and Sedimentary Model of the Lower Cambrian Marine Shale in the Upper Yangtze Platform. Geoscience 2017, 31, 1222–1232, (In Chinese with English Abstract). [Google Scholar]
- Wu, Y.W.; Tian, H.; Gong, D.J.; Li, T.F.; Zhou, Q. Paleo-environmental variation and its control on organic matter enrichment of black shales from shallow shelf to slope regions on the Upper Yangtze Platform during Cambrian Stage 3. Palaeogeogr. Palaeoclimatol. Palaeoecol. 2020, 545, 1–20. [Google Scholar] [CrossRef]
- Wang, L.B.; Jiu, K.; Zeng, W.T.; Fu, J.L.; Zhao, S. Characteristics of Lower Cambrian marine black shales and evaluation of shale gas prospective area in Qianbei area, Upper Yangtze region. Acta Petrol. Sin. 2013, 29, 3263–3278, (In Chinese with English Abstract). [Google Scholar]
- Zhang, C. Study on Hydrocardon Pontential and Reservoir Features of Shales from Lower Cambrian Shuijingtuo Formation in Yichang Region, Western Hubei Province. Ph.D. Thesis, China University of Geoscience, Wuhan, China, 2020. (In Chinese with English Abstract). [Google Scholar]
- Zhao, K.; Li, T.T.; Zhu, G.Y.; Zhang, Z.Y.; Li, J.F.; Wang, P.J.; Yuan, H.H.; Chen, Y.J. Development Environment and Formation Mechanism of Lower Cambrian Source Rocks in the Chengkou Area, Northeast Chongqing, South China. Acta Sedimentol. Sin. 2020, 38, 1111–1122, (In Chinese with English Abstract). [Google Scholar]
- Ma, Y.Q.; Lu, Y.C.; Liu, X.F.; Zhai, G.Y.; Wang, Y.F.; Zhang, C. Depositional environment and organic matter enrichment of the lower Cambrian Niutitang shale in western Hubei Province, South China. Mar. Pet. Geol. 2019, 109, 381–393. [Google Scholar] [CrossRef]
- Li, J. Study on Paleo-Environmental Reconstruction and Organic Matter Accumulation of the Lower Cambrian Niutitang Formation in northern Guizhou. Ph.D. Thesis, China University of Geoscience, Wuhan, China, 2018. (In Chinese with English Abstract). [Google Scholar]
- He, Q.; Gao, J.; Dong, T.; He, S.; Zhai, G.Y.; Zou, G.F. Elemental Geochemistry and Paleo-environmental Conditions of the Lower Cambrian Niutitang Shale in Western Hubei Province. Acta Sedimentol. Sin. 2021, 39, 686–703, (In Chinese with English Abstract). [Google Scholar]
- Xia, P.; Fu, Y.; Yang, Z.; Guo, C.; Huang, J.Q.; Huang, M.Y. The relationship between sedimentary environment and organic matter accumulation in the Niutitang black shale in Zhenyuan, Northern Guizhou. Acta Geol. Sin. 2020, 94, 947–956, (In Chinese with English Abstract). [Google Scholar]
- Chen, L.; Zhong, H.; Hu, R.Z.; Xiao, J.F. Composition of organic carbon isotope of early Cambrian black shale in the Xiang-Qian area and its significances. J. Mineral. Petrol. 2006, 26, 81–85, (In Chinese with English Abstract). [Google Scholar]
- Xia, W.; Yu, B.S.; Wang, Y.H.; Sun, M.D. Study on the depositional environment and organic accumulation mechanism in the Niutitang and Longmaxi Formation, North Guizhou Province: A case study of Well Renye1 and Well Xiye1. J. Mineral. Petrol. 2017, 37, 77–89, (In Chinese with English Abstract). [Google Scholar]
- Yeasmin, R.; Chen, D.Z.; Fu, Y.; Wang, J.; Guo, Z.; Guo, C. Climatic-oceanic forcing on the organic accumulation across the shelf during the Early Cambrian (Age 2 through 3) in the mid-upper Yangtze Block, NE Guizhou, South China. J. Asian Earth Sci. 2017, 134, 365–386. [Google Scholar] [CrossRef]
- Zhang, K.; Jiang, Z.X.; Yin, L.S.; Gao, Z.; Wang, P.; Song, Y.; Jia, C.; Liu, W.; Liu, T.; Xie, X. Controlling functions of hydrothermal activity to shale gas content-taking lower Cambrian in Xiuwu Basin as an example. Mar. Pet. Geol. 2017, 85, 177–193. [Google Scholar] [CrossRef]
- Awan, R.S.; Liu, C.L.; Gong, H.W.; Dun, C.; Tong, C.; Chamssidini, L.G. Paleo-sedimentary environment in relation to enrichment of organic matter of Early Cambrian black rocks of Niutitang Formation from Xiangxi area China. Mar. Pet. Geol. 2020, 112, 1–20. [Google Scholar] [CrossRef]
- Jia, Z.B.; Hou, D.J.; Sun, D.Q.; Jiang, Y.H.; Zhao, J.; Zhang, Z.M.; Hong, M.; Chang, Z.; Dong, L.C. Characteristics and geological implications of rare earth elements in black shale in hydrothermal sedimentation areas: A case study from the Lower Cambrian Niutitang Fm shale in central and eastern Guizhou. Nat. Gas Ind. 2018, 38, 44–51, (In Chinese with English Abstract). [Google Scholar]
- Han, S.; Zhang, Y.; Huang, J.; Rui, Y.; Tang, Z. Elemental Geochemical Characterization of Sedimentary Conditions and Organic Matter Enrichment for Lower Cambrian Shale Formations in Northern Guizhou, South China. Minerals 2020, 10, 793. [Google Scholar] [CrossRef]
- Shi, H.C.; Shi, X.B. Exhumation process of Middle-Upper Yangtze since Cretaceous and its tectonic significance: Low temperature thermochronology constraints. Chin. J. Geophys. 2014, 57, 2608–2619, (In Chinese with English Abstract). [Google Scholar]
- Liu, S.G.; Sun, W.; Song, J.M.; Deng, B.; Zhong, Y.; Luo, C.; Ran, B.; Tian, H.Y.; Li, Z.B.; Peng, H.L.; et al. Tectonics-controlled distribution of marine petroleum accumulations in the Sichuan Basin, China. Earth Sci. Front. 2015, 22, 146–160, (In Chinese with English Abstract). [Google Scholar]
- Liu, S.G.; Wang, Y.G.; Sun, W.; Zhong, Y.; Hong, H.T.; Deng, B.; Xia, M.L.; Song, J.M.; Wen, Y.C.; Wu, J. Control of intracratonic sags on the hydrocarbon accumulations in the marine strata across the Sichuan Basin, China. J. Chengdou Univ. Technol. 2016, 43, 1–23, (In Chinese with English Abstract). [Google Scholar]
- Xie, H.G. Characteristics and research progress of geological structure of Western Hubei trough. J. Jianghan Pet. Univ. Staff. Work. 2021, 34, 10–13, (In Chinese with English Abstract). [Google Scholar]
- Ma, Y.S.; Chen, H.D.; Wang, G.L. Tectonic sequence stratigraphy and lithofacies paleogeography of Sinian-Neogene in Southern China; Chinese Science Publishing Company: Beijing, China, 2009; pp. 60–65. [Google Scholar]
- Zhao, J.H.; Jin, Z.J.; Lin, C.S.; Liu, G.X.; Liu, K.Y.; Liu, Z.B.; Zhang, Y.Y. Sedimentary environment of the Lower Cambrian Qiongzhusi Formation shale in the Upper Yangtze region. Oil Gas Geol. 2019, 40, 701–715, (In Chinese with English Abstract). [Google Scholar]
- Guo, Q.J.; Shields, G.A.; Liu, C.Q.; Strauss, H.; Zhu, M.Y.; Pi, D.H.; Goldberg, T.; Yang, X.L. Trace element chemostratigraphy of two Ediacarane-Cambrian successions in South China: Implications for organosedimentary metal enrichment and silicification in the early Cambrian. Palaeogeogr. Palaeoclimatol. Palaeoecol. 2007, 254, 194–216. [Google Scholar] [CrossRef]
- Algeo, T.J.; Maynard, J.B. Trace-element behavior and redox facies in core shales of Upper Pennsylvanian Kansas-type cyclothems. Chem. Geol. 2004, 206, 289–318. [Google Scholar] [CrossRef]
- Jones, B.; Manning, D.A.C. Comparison of geochemical indices used for the interpretation of palaeoredox conditions in ancient mudstone. Chem. Geol. 1994, 111, 111–129. [Google Scholar] [CrossRef]
- Algeo, T.J.; Lyons, T.W. Mo–total organic carbon covariation in modern anoxic marine environments: Implications for analysis of paleoredox and paleohydrographic conditions. Paleoceanography 2006, 21, 1–23. [Google Scholar] [CrossRef]
- Xiao, B.; Liu, S.G.; Ran, B.; Yang, D.; Han, Y.Y. Identification of organic matter enrichment factors in marine sedimentary rocks based on elements Mn, Co, Cd and Mo: Application in the northern margin of Sichuan Basin, South China. Geol. Rev. 2019, 65, 1316–1330, (In Chinese with English Abstract). [Google Scholar]
- Xiao, B.; Liu, S.G.; Ran, B.; Li, Z.B.; Ye, Y.H.; Han, Y.Y. Study on Sedimentary Tectonic Pattern of Wufeng Formation and Longmaxi Formation in the Northern Margin of Sichuan Basin, South China. Earth Sci. 2021, 46, 2449–2465, (In Chinese with English Abstract). [Google Scholar]
- Sweere, T.; Boorn, S.V.D.; Dickson, A.J. Definition of new tracemetal proxies for the controls on organic matter enrichment in marine sediments based on Mn, Co, Mo and Cd concentrations. Chem. Geol. 2016, 441, 235–245. [Google Scholar] [CrossRef]
- Tribovillard, N.; Algeo, T.J.; Lyons, T.; Riboulleaua, A. Trace metals as paleoredox and paleoproductivity proxies: An update. Chem. Geol. 2006, 232, 12–32. [Google Scholar] [CrossRef]
- Qiu, Z.; Zou, C.N. Unconventional Petroleum Sedimentology: Connotation and prospect. Acta Sedimentol. Sin. 2020, 38, 1–29, (In Chinese with English Abstract). [Google Scholar]
- Qiu, Z.; Zou, C.N. Controlling factors on the formation and distribution of “sweet-spot areas” of marine gas shales in South China and a preliminary discussion on unconventional petroleum sedimentology. J. Asian Earth Sci. 2020, 194, 103–989. [Google Scholar] [CrossRef]
- Jin, C.S.; Li, C.; Algeo, T.J.; Wu, S.Y.; Cheng, M.; Zhang, Z.H.; Shi, W. Controls on organic matter accumulation on the early-Cambrian western Yangtze Platform, South China. Mar. Pet. Geol. 2020, 111, 75–87. [Google Scholar] [CrossRef]
- Zhang, Y.Y.; He, Z.L.; Gao, B.; Liu, Z.B. Sedimentary environment of the Lower Cambrian organic-rich shale and its influence on organic content in the Upper Yangtze. Pet. Geol. Exp. 2017, 39, 154–161, (In Chinese with English Abstract). [Google Scholar]
Publisher’s Note: MDPI stays neutral with regard to jurisdictional claims in published maps and institutional affiliations. |
© 2022 by the authors. Licensee MDPI, Basel, Switzerland. This article is an open access article distributed under the terms and conditions of the Creative Commons Attribution (CC BY) license (https://creativecommons.org/licenses/by/4.0/).