Article

Numerical Simulation of Fluid Flow in Carbonate Rocks Based on Digital Rock Technology

1
PetroChina Southwest Oil and Gasfield Company, Chengdu 610041, China
2
Department of Engineering Mechanics, Tsinghua University, Beijing 100084, China
*
Author to whom correspondence should be addressed.
Energies 2022, 15(10), 3748; https://doi.org/10.3390/en15103748
Submission received: 24 April 2022 / Revised: 13 May 2022 / Accepted: 18 May 2022 / Published: 19 May 2022

Abstract

:
Strong heterogeneity, low matrix permeability, and complex oil–water interaction make the fluid flow in carbonate rocks extremely complicated. In this study, we quantitatively characterize and simulate single-phase and multiphase flows with multiscale pore–vug–fracture structures involved in the carbonate reservoir developments. The main studies and conclusions include: (i) The CT technology is utilized to characterize the pores, fractures, and vugs of carbonate cores at multiple scales. It is found that even if the CT resolution reaches 0.5 μm, the pores of the core are still unconnected as a network, indicating that the carbonate matrix is particularly tight. The existence of fractures can increase the effective permeability, and even poorly connected fractures can significantly increase the permeability because it reduces the flow distance through the less permeable matrix. (ii) A numerical model of low-porosity strongly heterogeneous carbonate rocks was constructed based on digital image processing. Simulations of single-phase fluid flow under reservoir conditions were conducted, and the effects of surrounding pressure, pore pressure, and core size on the single-phase flow were investigated. Due to the strong heterogeneity of carbonate rocks, the pores, vugs, and fractures cause local preferential flow and disturbance within the core, which significantly affects the fluid flow path and the pressure distribution in the core. The overall permeability is a composite representation of the permeability of numerous microelements in the specimen. Permeability increases with an increasing pore pressure, and it decreases with increasing circumferential pressure. (iii) The gas–water two-phase flow model of a low-porosity strongly heterogeneous carbonate rock was established based on digital image processing. The variation law of the two-phase outlet flow velocity with the inlet gas pressure and the movement law of the two-phase interface of carbonate rock samples were obtained. Under certain surrounding pressure, the outlet gas velocity is larger than the outlet water velocity; with the increase of the inlet gas pressure, the pore space occupied by the gas phase in the rock becomes larger. With the increase of the surrounding pressure, the velocities of both outlet gas and water decrease. As the sample size decreases, the velocities of both outlet gas and water increase.

1. Introduction

Carbonate reservoirs occupy a significant position in global hydrocarbon resources. According to the U.S. Information Processing Service, LLC, carbonate oil and gas resources account for about 70% of the global oil and gas resources, with recoverable reserves accounting for about 50% and production accounting for about 60% [1,2]. China is also rich in carbonate oil and gas resources, and according to the results of the dynamic national evaluation of oil and gas resources in 2015, the geological resources of oil were 340 × 108 tons, and the geological resources of natural gas were 24.3 × 10¹² m3, accounting for 27.0% and 26.9% of the total oil and gas resources, respectively [3].
Carbonate reservoirs in China are mainly distributed in Sichuan, Bohai Bay, Ordos, Tarim, Pearl River Estuary, Northern Jiangsu, Qaidam, and other basins. According to the latest round of resource assessment in China, the amount of natural gas in marine carbonate rocks discovered in Sichuan is nearly 10 trillion cubic meters, indicating great development potential. The Dengsi gas reservoir in Sichuan Basin is an ancient weathered carbonate reservoir with complex pore–vug–fracture configurations and strong heterogeneity. The production capacity was 6 billion cubic meters in 2020, but the production in different gas wells varies greatly, and the stable production is hardly maintained. To maintain its long-term stable production, it is necessary to deepen the understanding of the mechanism behind the gas production and evaluate the permeability of complex carbonate reservoirs with low porosity and strong heterogeneity.
Carbonate reservoirs usually undergo multiple tectonic movements, karst superposition and reconstruction, and hydrocarbon formation processes, where pores, vugs, and fractures of different scales are formed. The reservoir is generally characterized by the mature pore–vug–fracture configuration, strong heterogeneity, low porosity, and permeability in the matrix. Pores are the main storage space for hydrocarbons, and fractures are the main flow channels. Therefore, the development of carbonate reservoirs is, to a certain extent, limited by the relationship among the pores, vugs, and fractures, and it is essential to study this relationship at different scales for production enhancement. Due to the diversity and nonuniformity of carbonate reservoir space and the limitations of various research methods, it is difficult to characterize the multiscale pore–vug–fracture structure of carbonate rocks accurately. At present, the research on reservoir space is mainly divided into two categories: (i) the direct observation method, where the main observation means are the optical microscope, scanning electron microscope, etc., and the observation results are two-dimensional images and semiquantitative; (ii) the indirect observation method, where the main observation means are piezometric mercury, nuclear magnetic resonance, etc., and the test results are mainly the distribution curve of pore diameter, which cannot portray the three-dimensional spreading of pore space and interconnection relationship [4,5,6,7,8,9,10].
With the increasing accuracy of CT (computed tomography) scanning and the improvement of computer operation capability, the use of digital cores in the analysis of pore structure in oil and gas reservoir cores has gradually become popular. After years of development, CT scanning can accurately analyze the development scale and distribution characteristics of pores in conventional oil and gas reservoirs. In terms of fracture identification, the main method is based on the binarization of a single two-dimensional image, taking the target with narrow shapes and treating them as fractures. In 2000, Ioannidis et al. [11] introduced the concept of the dual-porosity model to describe the structural characteristics of caves and secondary pores in cavernous reservoirs. The pore distribution characteristics of secondary pores were obtained by scanning with CT equipment. In 2004, Bekri et al. [12] introduced the wettability characteristics of cavernous carbonate reservoirs based on this model and analyzed the influence law of wettability on petrophysical parameters in such reservoirs.
Xia et al. [13] identified fractures based on the pore shape, which should be smaller than 0.08. Yan et al. [14] distinguished pores, vugs, and fractures based on industry standards and combined the pore shape factors and external sphere radius, and the shape factor of fractures was less than 0.05. Therefore, there are significant differences in the standard to identify fractures. Gao et al. [15] used CT scan and NMR (nuclear magnetic resonance) to analyze the cores of dolomite reservoirs of the Lower Cambrian Longwangmiao Formation in the Sichuan Basin. The results showed matrix pores, cavities, and microfractures of different sizes in the reservoir space. The CT scan identified that the reservoir space is dominated by vugs with diameters varying between 2 and 8 mm, while NMR identified that pores dominate the reservoir space. Wei et al. [16] compared CT scans of core samples and plunger core samples and found that core samples were more heterogeneous and showed significant anisotropy in permeability, while small core samples showed relatively homogeneous characteristics.
The flow mechanism of carbonate reservoirs, especially the pore–fracture type and pore–vug–fracture type reservoirs, has been a hot research topic worldwide. In the 1950s, Bruce et al. [17] established a single-media mathematical model to solve the problem of characterizing the flow mechanism of continuous porous media. In 1963, Warren and Root [18] established a dual-media mathematical model to solve the problem of characterizing the fluid flow mechanism of pore–fracture type reservoirs. The dual-media model assumes that the bedrock is separated into regular blocks by the fractures. The reservoir should have large matrix porosity and small permeability, while the fractures have small porosity and large permeability. The matrix and fracture form two relatively independent hydrodynamic systems with a fluid exchange between them. In 1985, Long et al. [19] established a discrete fracture network model, which constructs an explicit fracture model by spreading discrete fractures in 3D space, describing the fracture geometries and flow behavior in realistic detail. The dual-media mathematical model and discrete fracture network provide a theoretical basis for numerical simulation and well-testing techniques.
In carbonate reservoirs, there is a composite flow composed of free flow in large pores and fractures, and seepage flow in small-scale pores. Kang et al. [20] established a mathematical model of the pore–vug–fracture medium. In the model, caves and large cracks are treated separately as discrete media, obeying the Navier–Stokes equation, and small-scale pore–fracture–pore structures as continuous media, obeying Darcy equations. The coupling between the free and seepage flow is realized through the interface equation. Murad et al. [21] extended the BJS condition to fluid–solid coupling, considering the impact of rock deformation under the basis of the Beavers–Joseph–Saffman condition. Zhang et al. [22] proposed a flow–solid coupling calculation format for pore–fracture media and applied FLAC3D software to perform numerical simulation studies. Huang et al. [23] established a discrete fracture–vug flow–solid coupling mathematical model, where the Biot equation is used in the seepage region of porous media and the fracture is dimensionally reduced and solved by Galerkin finite element method. The N-S equation is used in the vugs and solved by Taylor–Hood mixed element method. Two regions are coupled by extending the BJS condition. Wang et al. [24] proposed a generalized multiscale finite element and triple continuous media model combined with discrete fracture networks to simulate the regional effect around fractures. Yan et al. [25] proposed an effective numerical model to simulate the flow–solid coupling of porous media containing multiscale fractures. A modified equivalent continuous medium model is used to model microcracks and pores, while macroscopic cracks are modeled using an embedded discrete fracture model and an unmatched grid. Yan et al. [14] established a digital 3D core model based on the CT scan results of real cores from carbonate gas reservoirs in the Sichuan Basin. They used the finite element method to simulate flow in the core, analyze the fluid flow under subsurface conditions, and derive their flow laws.
In carbonate reservoirs, gas–water two-phase flow is widespread and complex. Describing how two-phase fluids pass through porous media is key to the oil and gas recovery problem. Unfortunately, the multiphase analysis is complicated because it needs to solve for multiple dependent variables and various unknown quantities, including hydraulic properties that depend on the pressure and saturation levels of each fluid phase. Jiang et al. [26] proposed a multiscale pore network modeling method for complex carbonate reservoirs. They used the results of CT scans with different accuracies and a stochastic method to build a small-size, high-precision micropore network. Then, they built large-size, low-precision macropore networks by the numerical core reconstruction method and proposed a superposition technique to couple the two methods. Finally, they used the superimposed pore network model to simulate the oil–water flow and get the relative permeability curves of small pores, large voids, and micropores. Liu et al. [27] established a fluid–solid coupling model for studying two-phase porous free flow and geo-mechanics in fractured karst systems, where Darcy’s law describes the fluid flow in the porous matrix and fracture network, and free flow in the cavity is calculated using phase transient gravity separation.
In general, the solution strategies for flow problems in porous media can be grouped into three categories (Figure 1), which depend on the resolution of the pore structure. The first category is the pore–scale simulation based on the N-S equation, which requires an accurate description of each pore structure to form a connected pore network. The second type is the continuous-scale simulation based on Darcy’s law, which represents the fluid flow in a porous medium as a continuous process using the overall average properties of the porous medium. Each pixel represents a REV property, and the grayscale of the image distinguishes different properties without describing the pore structure in detail. The third one is a hybrid simulation method combining both. Due to the extremely heterogeneous carbonate rocks and the development of pores and vugs, the first solution strategy is unsuitable because geometric modeling is extremely difficult with many singular points, triangular pieces, and pegs. Even if the modeling is successful with great efforts, hundreds of millions of degrees of freedom are required for calculation. The second method is rough with significant model simplifications and cannot yield detailed information on the flow mechanism.
Therefore, we adopted the third strategy. Using the CT scan images of full-diameter cores from the Sichuan basin and the results of conventional physical experiments of cores, a 3D visualization model of the digital core was established. The flow patterns in three different media of pores, vugs, and fractures were coupled by the finite element method, which achieves a quantitative dynamic simulation of fluid flow in the subsurface. The main research content consists of three parts: (1) Using carbonate reservoirs in the Sichuan Basin as the research object, we use dual-energy CT to scan the pore–vug–fracture structure of carbonate samples at different scales and quantify the reconstructed pore space. With the help of 3D visualization software, we can characterize pore–vug–fracture structures at different scales and classify reservoir types. (2) Using the CT scan images of full-diameter cores from the Sichuan basin and the results of conventional physical experiments of cores, a digital core 3D model is established. The finite element method is adopted to couple the flow characteristics of fluids in three different media of pore, vugs, and fractures. A quantitative dynamic simulation of fluid flow is thus achieved, which is applied to a comprehensive analysis of flow patterns in four types of reservoirs, including pore type, pore–fracture type, pore–vug type, and pore–fracture–vug type. (3) A strongly heterogeneous multimedia gas–water two-phase flow simulation method was developed. The density information in CT tomography images is assigned to the numerical calculation model. Based on the constructed multimedia model, gas–water two-phase flow simulation is carried out under different conditions of surrounding pressure, inlet water pressure, and gas pressure, and the variation of the outlet two-phase flow velocity with inlet gas pressure and the motion of the two-phase interface are studied in carbonate rock samples.

2. Multiscale Pore–Vug–Fracture Characterization of Carbonate Rocks

2.1. Reservoir Characteristics in the Study Area

The study area is located in the northwestern part of the Sichuan basin, on the northern margin of the Longmenshan prefold zone. In 2014, the ST1 well was deployed for the Permian dolomite reservoir in northwestern Sichuan, and a dolomite gas reservoir was discovered. Several high-production industrial gas wells have been drilled, in which the main gas-production formation is buried at a depth of more than 7000 m. The formation temperature is 158 °C, and the original formation pressure is 96 MPa, an ultra-deep, high-temperature, high-pressure gas reservoir [28].
According to the analysis of the statistical results of the coring well data, the main reservoir rock type is dolomite, which is brownish gray and light gray. The dolomite grains are mainly medium and coarse crystals, semiautomorphic, partly other-shaped, or automorphic. The main mineral composition is calcite, dolomite, and magnesite (Figure 2). The basic physical properties (density, porosity, permeability, and saturation) of 1000 full-diameter cores were counted in the study (Figure 3). The results showed that the density of core specimens ranged from 2.4 to 2.9 g/cm3, with an average value of 2.7 g/cm3 and Weibull distribution shape parameter m = 59. The porosity ranged from 0.90% to 8.88%, with an average value of 2.48% and Weibull distribution shape parameter m = 1.64. The permeability ranged from 0.002 to 10 mD, with an average value of 2.78 mD. The saturation ranged from 8.2% to 83.4%, with a mean value of 32% and Weibull distribution shape parameter m = 2.
Due to the tectonic fracture, rock formation, dissolution, and its later effects, the carbonate medium differs significantly from the conventional clastic reservoir, and the general fractured medium is different in terms of the morphology, distribution, and shapes. According to the national standard “Classification of Natural Gas Reservoirs: GB/T26979-2011”, the Lamp Four Group reservoir in Moxi 126 well belongs to low-porosity and low-permeability reservoirs. Due to the wide variation of late modification effects of carbonate reservoirs, the pore structure of the reservoir is quite complex. In terms of pore size, small pores can only be observed with an electron microscope and measured in microns; large vugs can reach a diameter of 100 m level, which causes the empty drilling during the drilling process. The Lamp Four Group Moxi 126 well dolomite reservoirs have multiple scales of pores and fractures developed. Each research tool can only characterize a single type of structure in a specific scale range. Therefore, to recognize and evaluate the carbonate reservoir types and pore–vug–fracture structures, it is necessary to investigate the pore–vug–fracture characteristics and collocation relationships within multiple scales.

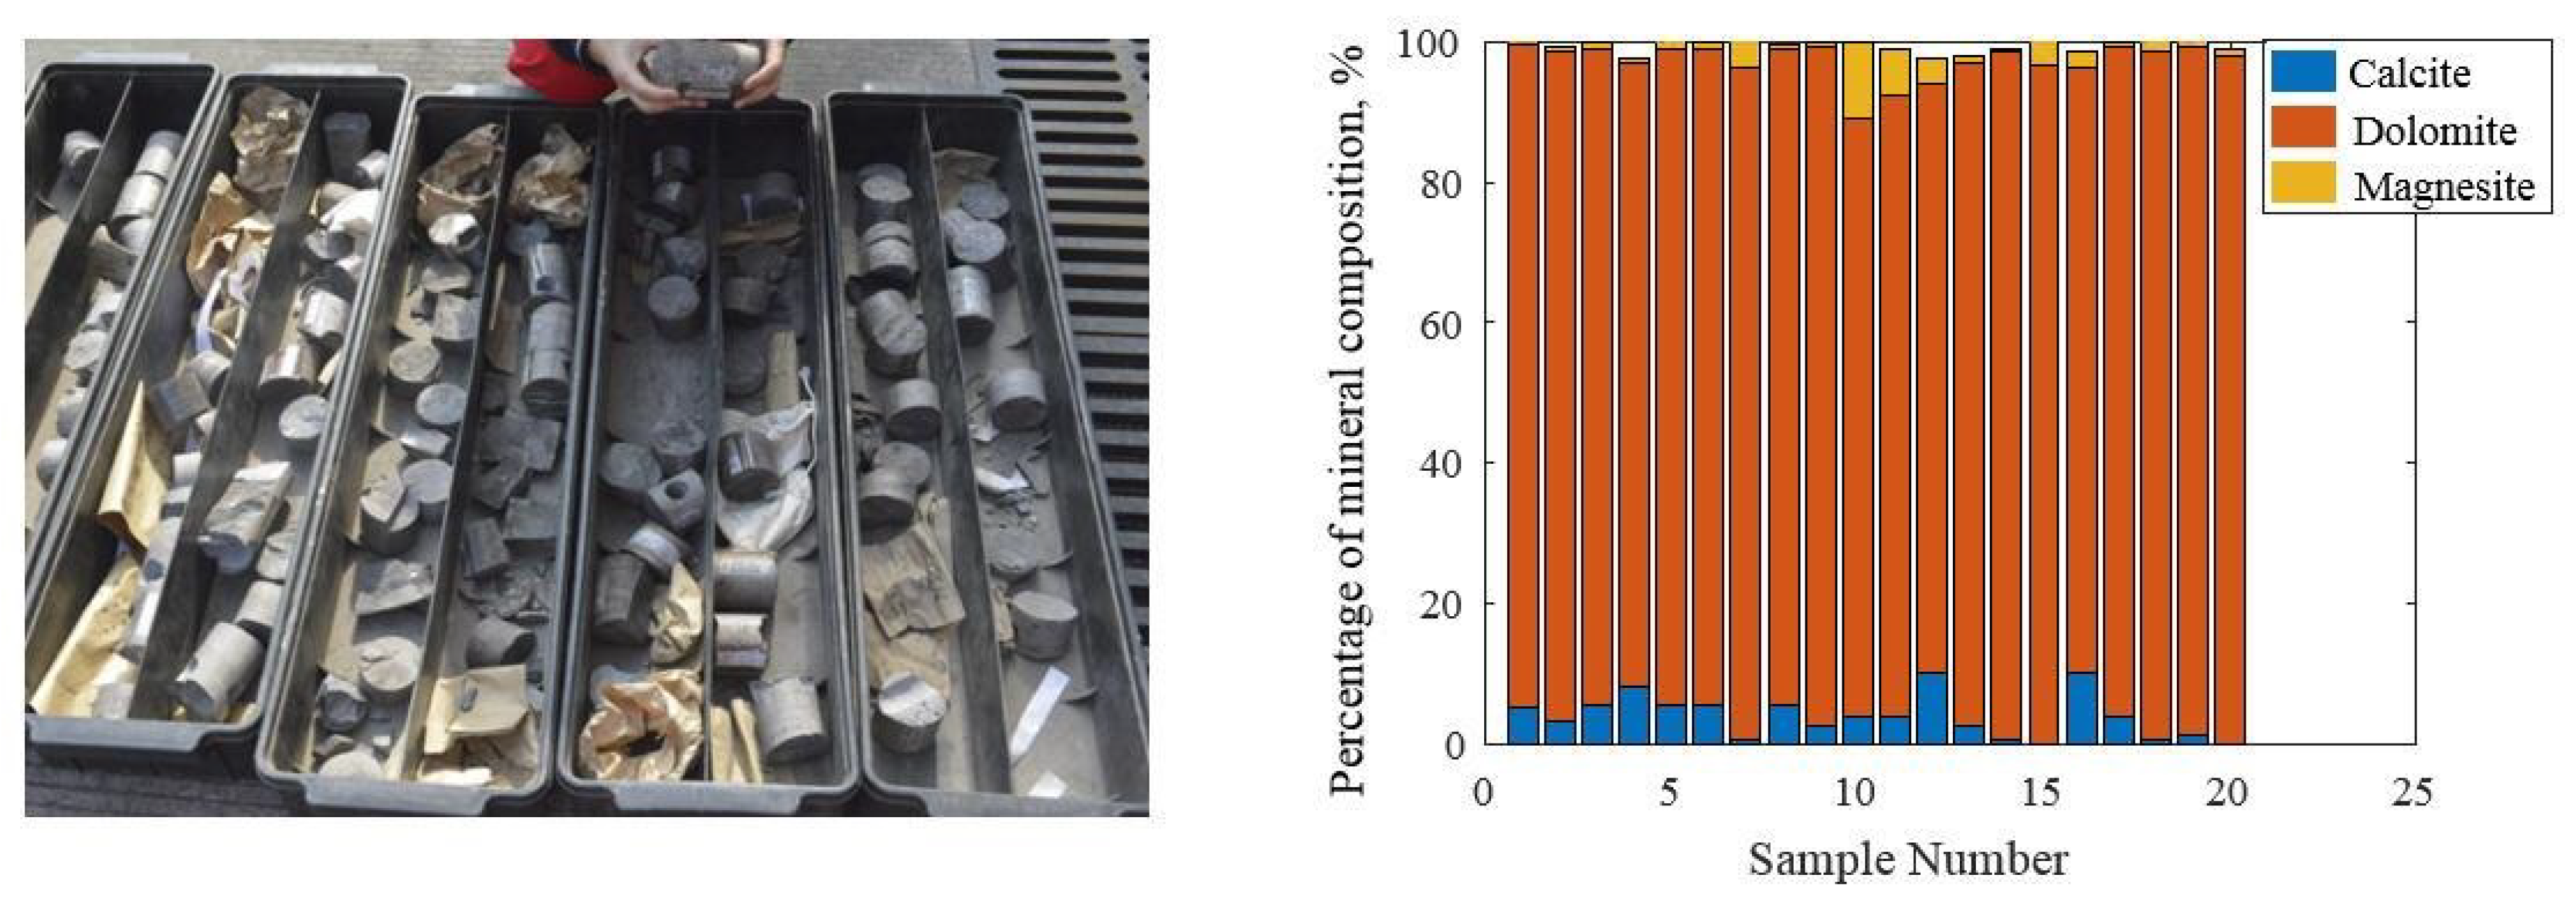
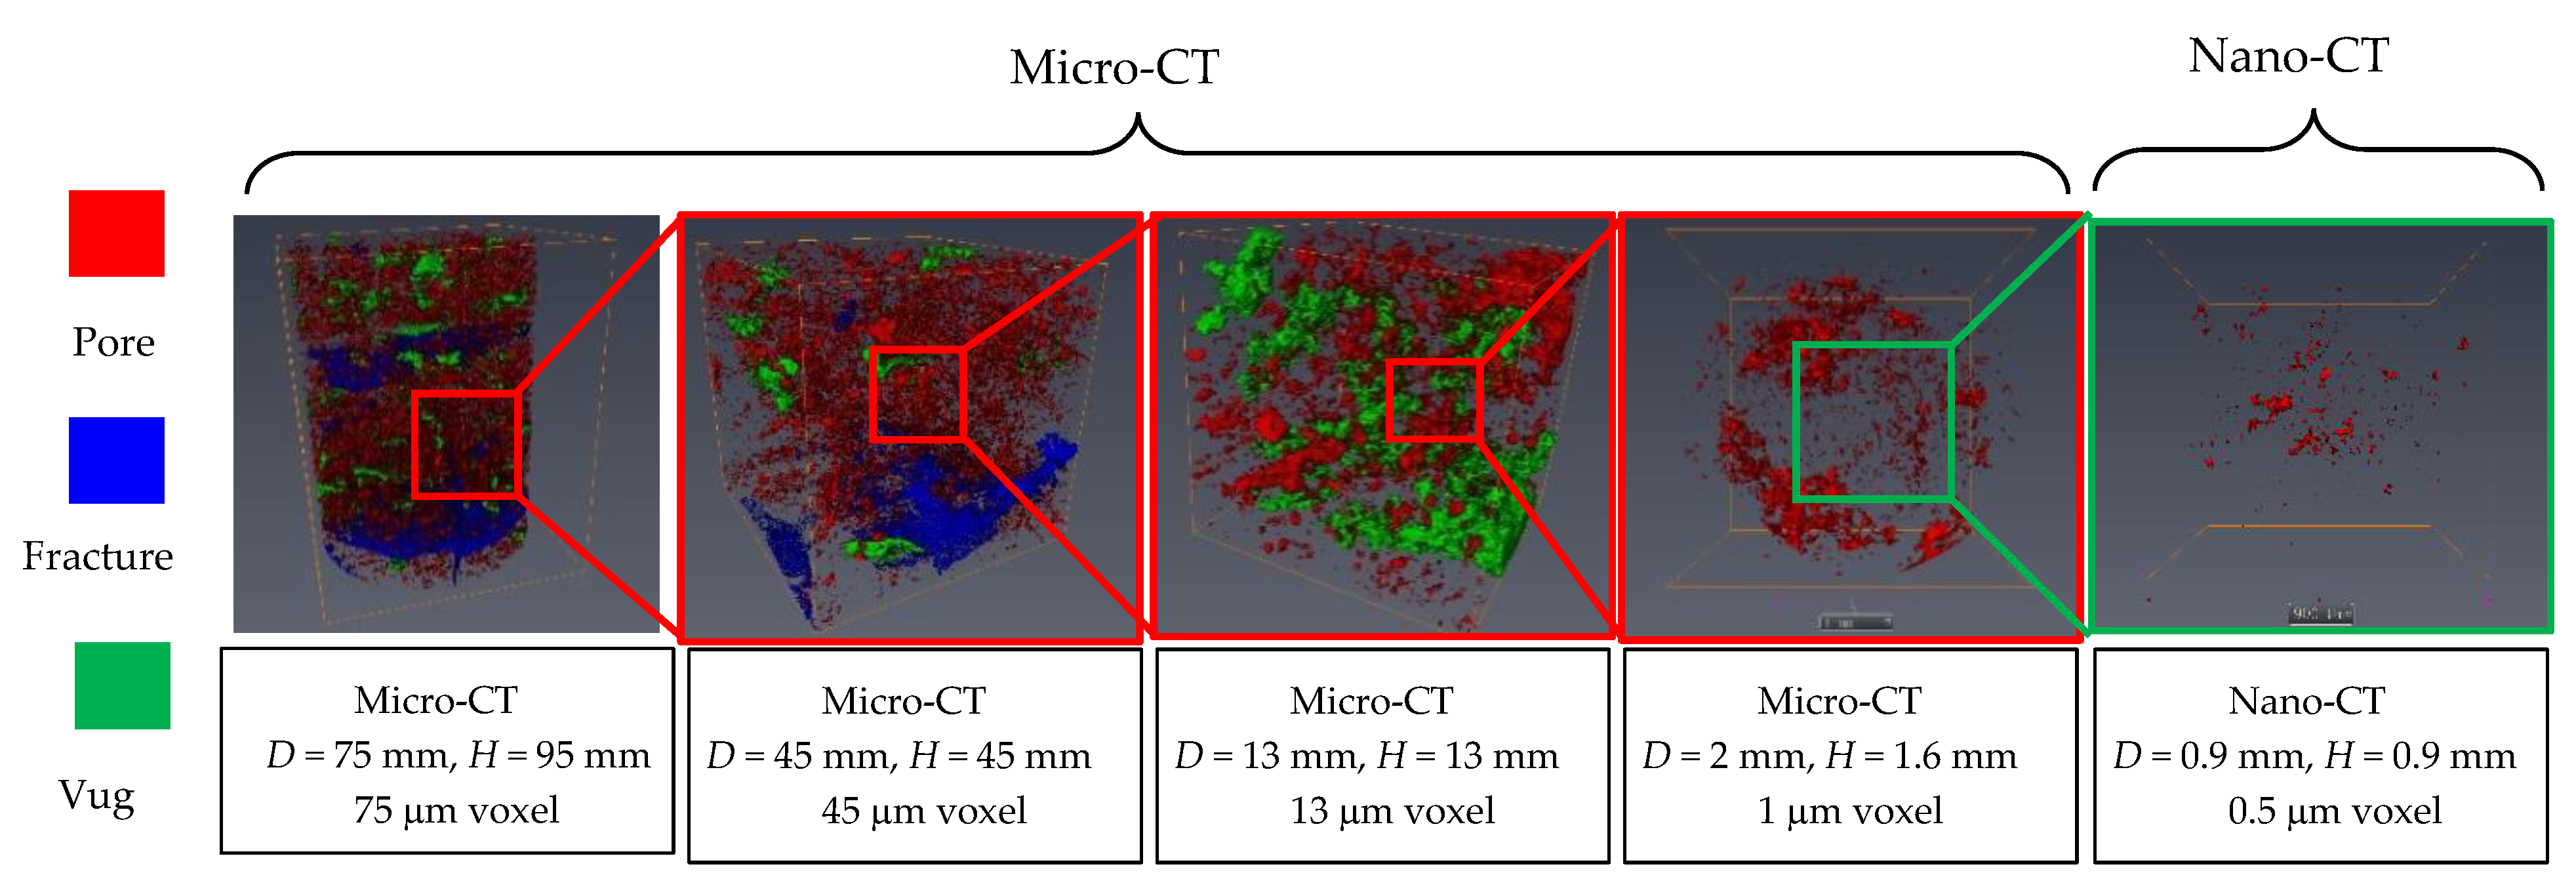
2.2. Test Methods and Samples

A core image high-resolution acquisition instrument and Phoenix v 3D computed tomography system was used to study the development characteristics of pore–vug–fracture structures in carbonate rocks. The system is manufactured by Phoenix, a subsidiary of General Electric, equipped with two types of probes, Micro-CT and Nano-CT. Micro-CT probes have high penetration capability and are used to scan full diameter cores to identify fractures, cavities, and large pores within cores. Nano-CT probes are used to scan plunger core samples or small cylindrical core samples to identify matrix pores and microfractures within the sample. The scanning lamp voltage is 300 kV and the maximum power is 500 W. The maximum voxel resolution is 0.3 μm.
For the characterization of cores at different scales, a total of 68 full-diameter core samples (75 and 45 mm in diameter), 9 plunger core samples (13 mm in diameter), and 4 small cylindrical core samples (0.9 and 2 mm in diameter) were subjected to CT scanning in the study. The selected samples cover four reservoir types: pore type, pore–fracture type, pore–vug type, and pore–vug–fracture type, with porosity ranging from 0.06% to 10.1% and a permeability ranging from 0.002 to 9.3 mD. The selected samples are consistent with the reservoir physical properties of the Lamp Four Group in the Moxi 126 well. The relationship between permeability and porosity of the carbonate samples is given in Figure 4. Unlike granite and sandstone, there is no significant positive correlation between permeability and porosity for the carbonate samples. The core permeability varies from 10−3 mD to 101 mD, spanning four orders of magnitude. The cores can be classified into three categories based on the core permeability.

2.3. Principle of the Pore, Vug, and Fracture Classification

CT scanning technology can measure and describe the petrophysical parameters without destroying the core, effectively analyzing the microstructure inside the reservoir and studying the development and connectivity of pores, vugs, and fractures. It is very effective for understanding the internal characteristics of the reservoir. However, the raw images obtained from CT scans only show grayscale images of different fault surfaces of the samples, and a series of image processing is required to perform pore structure analysis [29,30]. The characterization and analysis of pores, vugs, and fractures mainly involve 3D pore reconstruction and segmentation, geometric parameter calculation, and fracture–pore identification, which form a delicate reconstruction and identification technique of pore–vug–fracture structures for carbonate rocks. The 3D pore reconstruction and segmentation mainly involves image filtering enhancement, image binarization, 3D reconstruction, and pore segmentation based on the permeability comparison method for the raw CT acquisition data.
According to the petroleum industry standard “Oil and Gas Reservoir Evaluation Method: SY/T6285-2011”, the carbonate reservoir space can be divided into pores, fractures, and cavities. Pore space refers to the void space with a similar spatial scale in three directions and less than 2 mm. Similar to pores, cavities are voids with similar spatial scales in three directions and larger than 2 mm. In contrast, a fracture is a void with a small scale in one direction and a large scale in the other two directions, and the ratio is generally less than 1/10. For the differentiation of pores, vugs, and fractures in the 3D reconstructed model, the sphericity and the volume equivalent spherical radius are mainly selected, as shown in Figure 5. Sphericity is a measure of how closely the shape of an object resembles that of a perfect sphere. The sphericity of a pore is defined as the ratio of the surface area of a sphere with the same volume as the given pore to the surface area of the pore, which varies between 0 and 1. The sphericity of the standard sphere is 1. The narrower the pore, the smaller the sphericity, characterizing fractures. The sphericity calculation formula is as follows.
ψ = A s A p = 36 π V p 2 3 A p
where ψ denotes the sphericity, As denotes the outer surface area of the sphere with the same volume as the given pore, Ap denotes the outer surface area of the pore, and Vp denotes the volume of the pore. The expression for the diameter of a volume equivalent sphere can be written as
d eq = 6 V p π 3

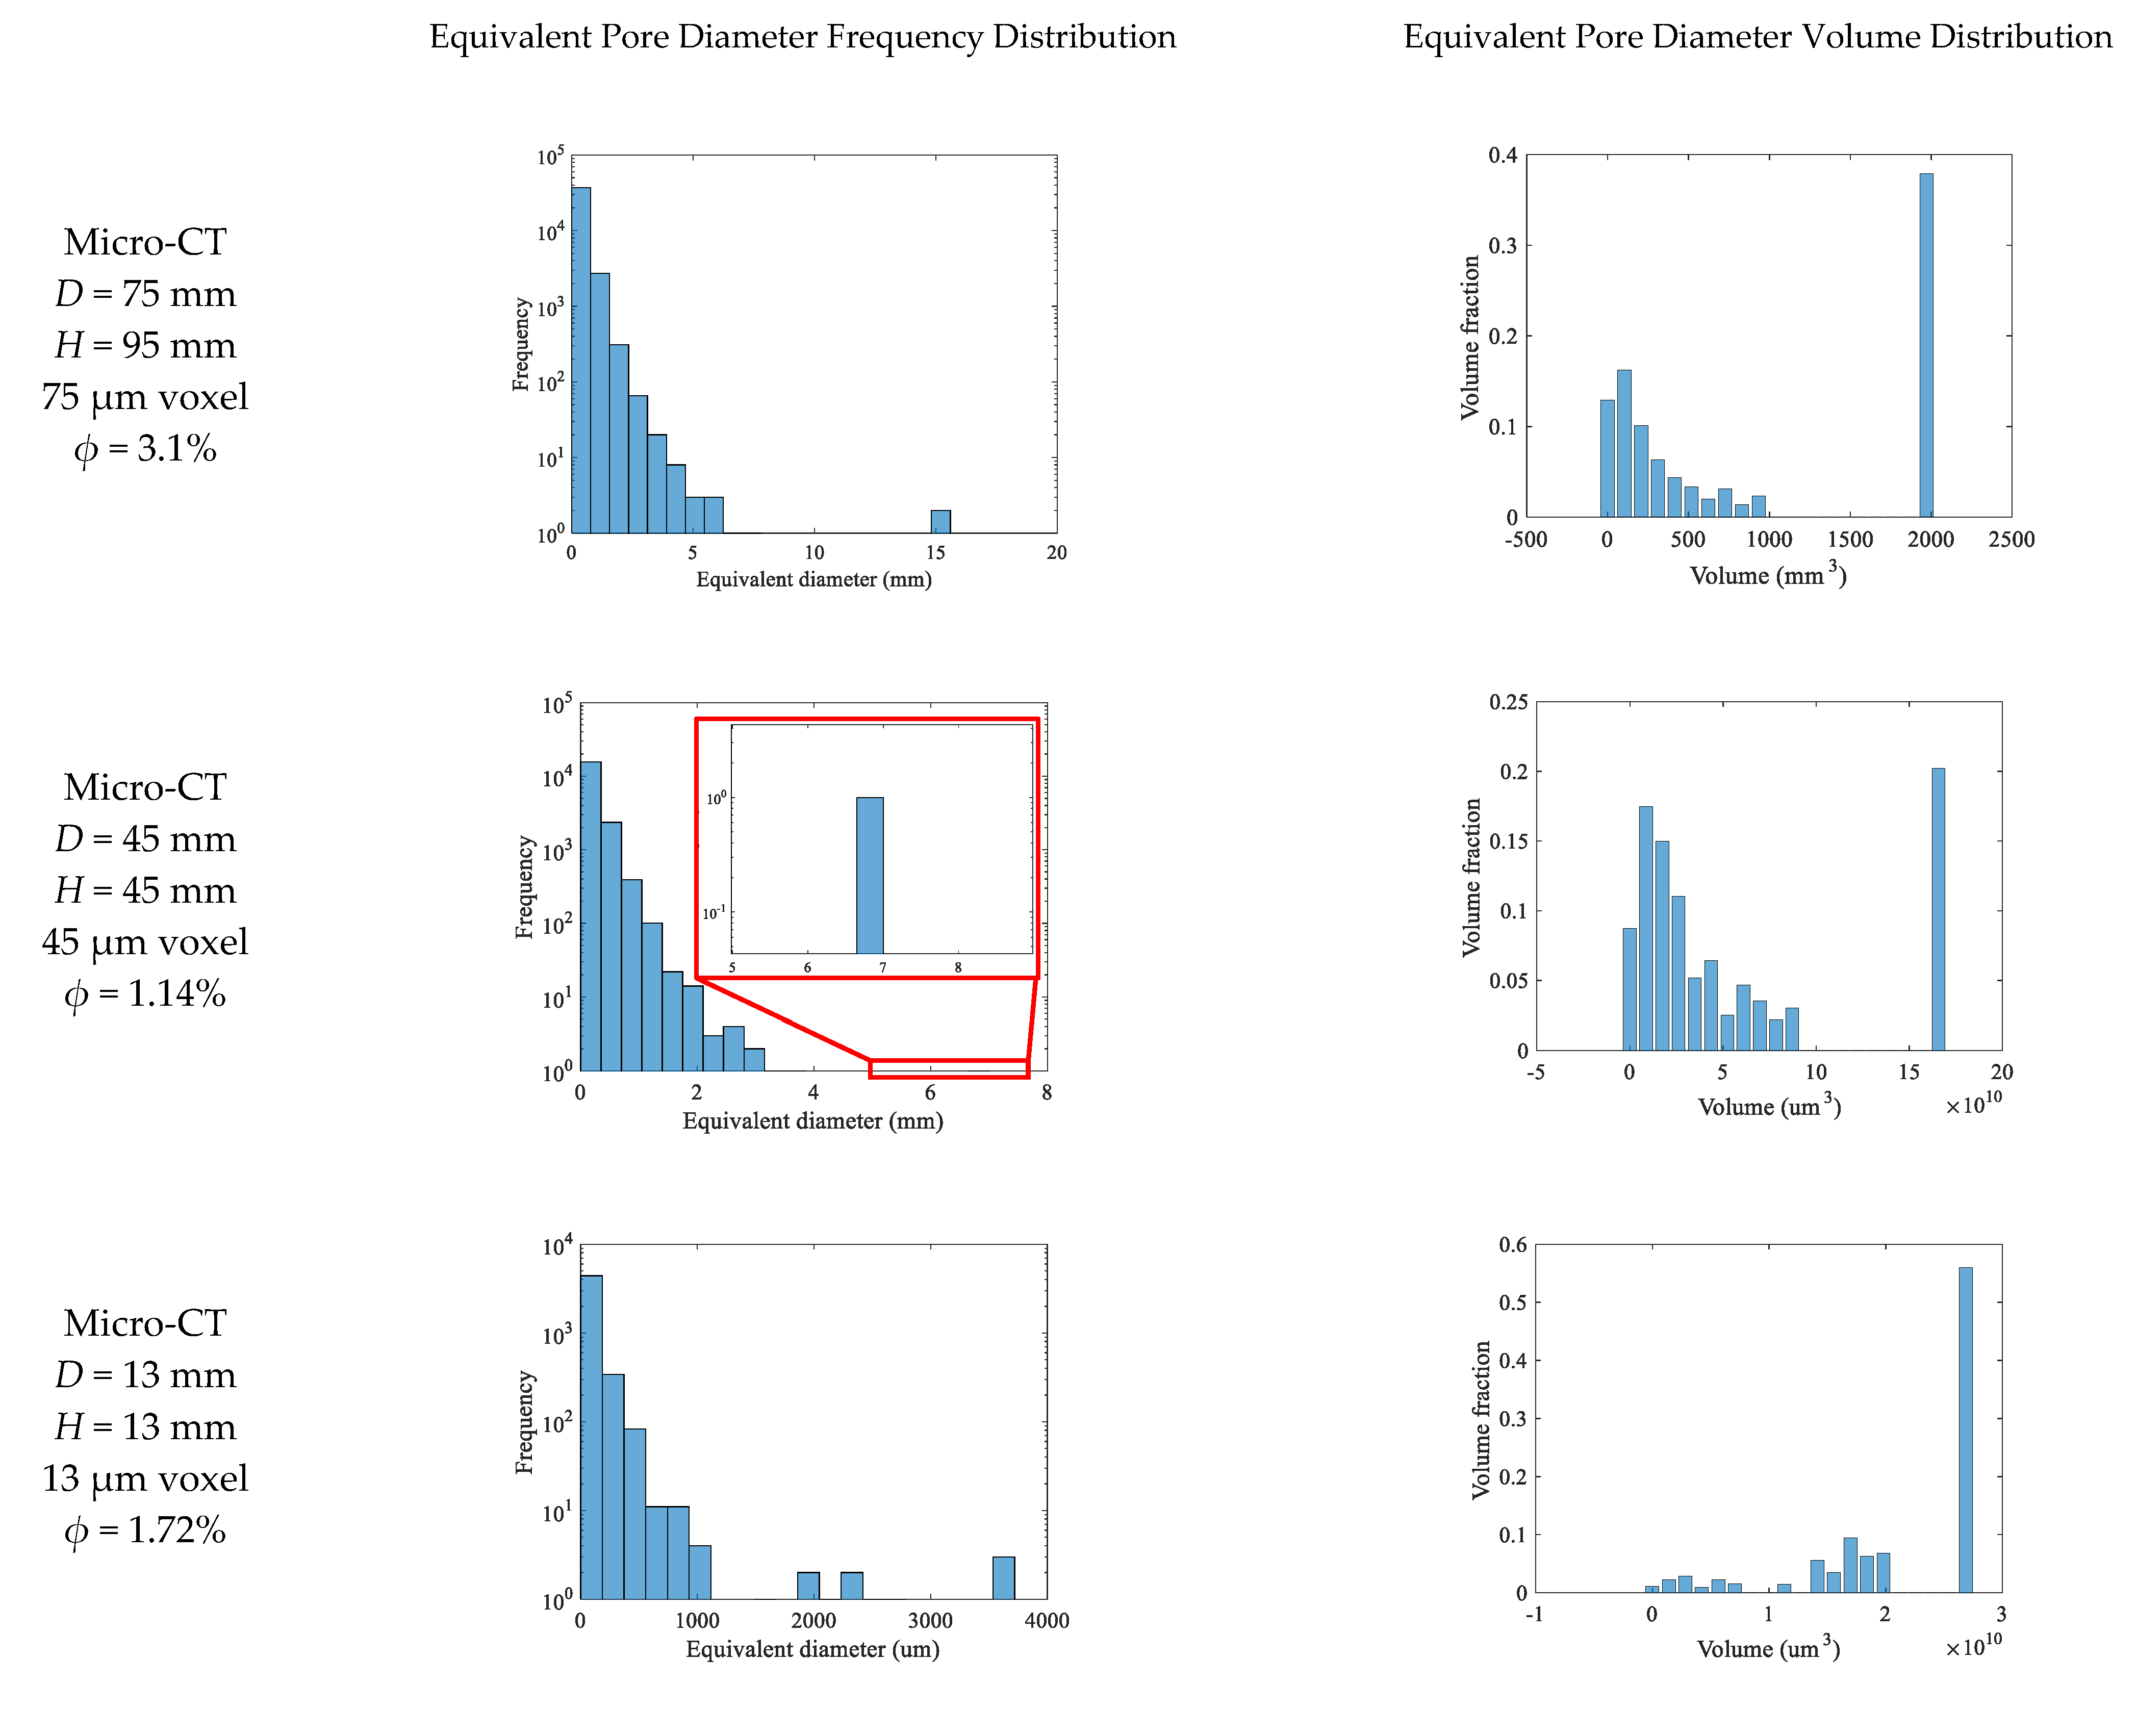
2.4. Quantitative Evaluation of Multiscale Pore–Vug–Fracture Structures Based on CT Data

The heterogeneity of carbonate reservoirs is mainly reflected in the distribution of pores, vugs, and fractures, which are essential reservoir spaces and flow channels in carbonate reservoirs. Characterizing and understanding the permeability characteristics of carbonate reservoirs is the primary task of reservoir development. At present, various technical means have been developed to characterize and understand the permeability characteristics of carbonate reservoirs. However, only the distribution characteristics within a specific scale can be portrayed at the characterization scale, ignoring the characteristics of pore, vugs, and fractures in other scales. We characterized the heterogeneity of pores, vugs, and fractures development in cores at different scales.
Figure 6 gives the distribution characteristics of pores, vugs, and fractures in cores of different scales. For the sample with a core diameter of 75 mm, the CT test resolution is 75 μm, which can identify the collocation relationship between vugs, fractures, and large pores. Most pores of this sample have equivalent pore diameters less than 2 mm, and a small number of pores with equivalent diameters between 2 mm and 20 mm. The maximum pore equivalent diameter is 15.55 mm. The volume of large vugs with the maximum equivalent diameter of 15.55 mm and 15.32 mm accounts for the largest proportion, although the number of vugs is small. For the sample with a core diameter of 45 mm, the CT test resolution is 45 μm. Most pores of this sample have an equivalent pore diameter of less than 1.2 mm, and a small number of pores with an equivalent diameter between 1.2 mm and 8 mm. The maximum equivalent diameter is 6.81mm, and the volume share is also the largest. For the sample with a core diameter of 13mm, the CT test resolution is 13 μm. Most pores have equivalent pore diameters less than 500 μm, and a small number of pores with equivalent diameters between 500 μm and 4000 μm. The maximum equivalent diameter is 3.72 mm. The volume share of pores with equivalent diameters of 3.68 mm and 3.72 mm is the largest, although the number of corresponding pores is small. For the sample with a core diameter of 2 mm, the CT test resolution is 1 μm. All pores have equivalent pore diameters less than 2 mm. There are only pores, no fractures, and cavities. Most of the equivalent diameters are less than 50 μm, and a small number of pores with equivalent diameters between 50~300 m. The maximum equivalent diameter is 256 μm. The largest proportion of pore volume has 202 μm and 256 μm equivalent diameters. For the sample with a core diameter of 0.9 mm, the resolution of the CT test is 0.5 μm. All pores have equivalent diameters less than 2 mm. There are only pores and no fracture and cavity. Most pores have an equivalent diameter of less than 20 μm, and a small number of pores with equivalent diameters between 20 μm~120 μm. The maximum equivalent diameter is 110 μm, and the volume share is also the largest. The number of small pores is the majority, much more than the number of large pores in terms of quantity. In terms of volume, the volume share of large-diameter pores is much larger than that of small pores. With the decrease in core size, the diameter and porosity of pores, vugs, and fractures are decreasing.
Carbonate reservoirs develop different degrees of pores, vugs, and fractures, which can be categorized as triple media in a broad sense. However, the storage and seepage characteristics vary widely depending on the scale and collocation relationships of pores, vugs, and fractures. Therefore, it is of strong practical value to quantify and visualize the collocation relationships of pores, vugs, and fractures on different scales. Figure 7 shows the pore–vug–fracture relationships of representative cores at different scales, with red indicating pores, blue indicating fractures, and green indicating cavities. The selected representative cores cover three reservoir types: pore, pore–vug, and pore–vug–fracture.
Regardless of the resolution, the pore network of all cores is not connected, even if the CT resolution has reached 0.5 μm. This indicates that the carbonate matrix is particularly dense, and the pores identified by CT are not intergranular voids produced during rock crystallization, but rather intergranular solution pores produced by dissolution. Otherwise, the pore distribution would not be so sparse and disconnected. The 45 mm and 75 mm cores belong to the pore–vug–fracture type, where the distribution of pores and cavities is relatively scattered, and the fractures are distributed in a network between pores and cavities. Pores are the main storage space, and fractures are the main flow channels. The 13 mm cores belong to the pore–vug type, and the 1 mm and 0.9 mm cores belong to the pore type. As the observed core scale increases, the proportion of fracture volume increases, and the proportion of pore volume decreases. Affected by the lower limit of CT resolution, some unidentified microfractures and fine throat channels should also exist in the core samples, and the actual connectivity of cores should be better than the results of conventional analysis.
Conventional reservoir type classification is mainly based on conventional logs, imaging logs, and well-test curves. However, these tools mainly use distribution curves to indirectly reflect the development of pores, vugs, and fractures in the reservoir and fail to quantitatively portray the degree of their development and collocation relationship among those structures. Therefore, the classification results are somewhat subjective. We use the vug–fracture identification technology to classify the reservoir types of carbonate gas reservoirs and use the CT data as the basis for the development of vug-fracture in reservoir cores. Referring to the national standard “Classification of Natural Gas Reservoirs: GB/T26979-2011”, the reservoir is classified into four types: pore type, pore–fracture type, pore–vug type, and pore–vug–fracture type. The physical parameters of the cores obtained from Lamp Four Group Moxi 126 well were counted according to the four reservoir type classification criteria (Table 1). Figure 8 gives the statistics of the number of core structure types at different scales. When the core diameter is 0.9 and 2 mm, all core structure types are pore types; when the core diameter is 13 mm, 55% of the core structure types are pore–vug types; when the core diameter is 45 mm, 78% of the core structure types are pore–vug–fracture type; when the core diameter is 75 mm, 93% of the core structure types are pore–vug–fracture type.
How can natural gas be produced consistently and steadily when the carbonate matrix is dense and the poorly connected pore–vug–fracture network? Matthäi and Belayneh [31] investigated the impact of the geometric arrangement of constant-opening fractures on the effective permeability. We built a numerical model based on it, with a model size of 100 × 500 mm2, as shown in Figure 9. The matrix permeability is 0.1 mD, and the fracture opening is 0.1 mm, satisfying the cubic law. The efficient permeability for the three working conditions is 0.51 mD, 0.25 mD, and 0.35 mD, respectively. The cracks in Figure 9c are not interconnected, but the efficient permeability is only 31% less than the fully penetrated case (a). This result indicates that (1) poorly connected fractures can significantly increase the permeability, and (2) fracture aggregation can increase the efficient permeability because it reduces flow distance through the less permeable matrix.

3. Simulation of Single-Phase Flow in Strongly Heterogeneous Carbonate Rocks

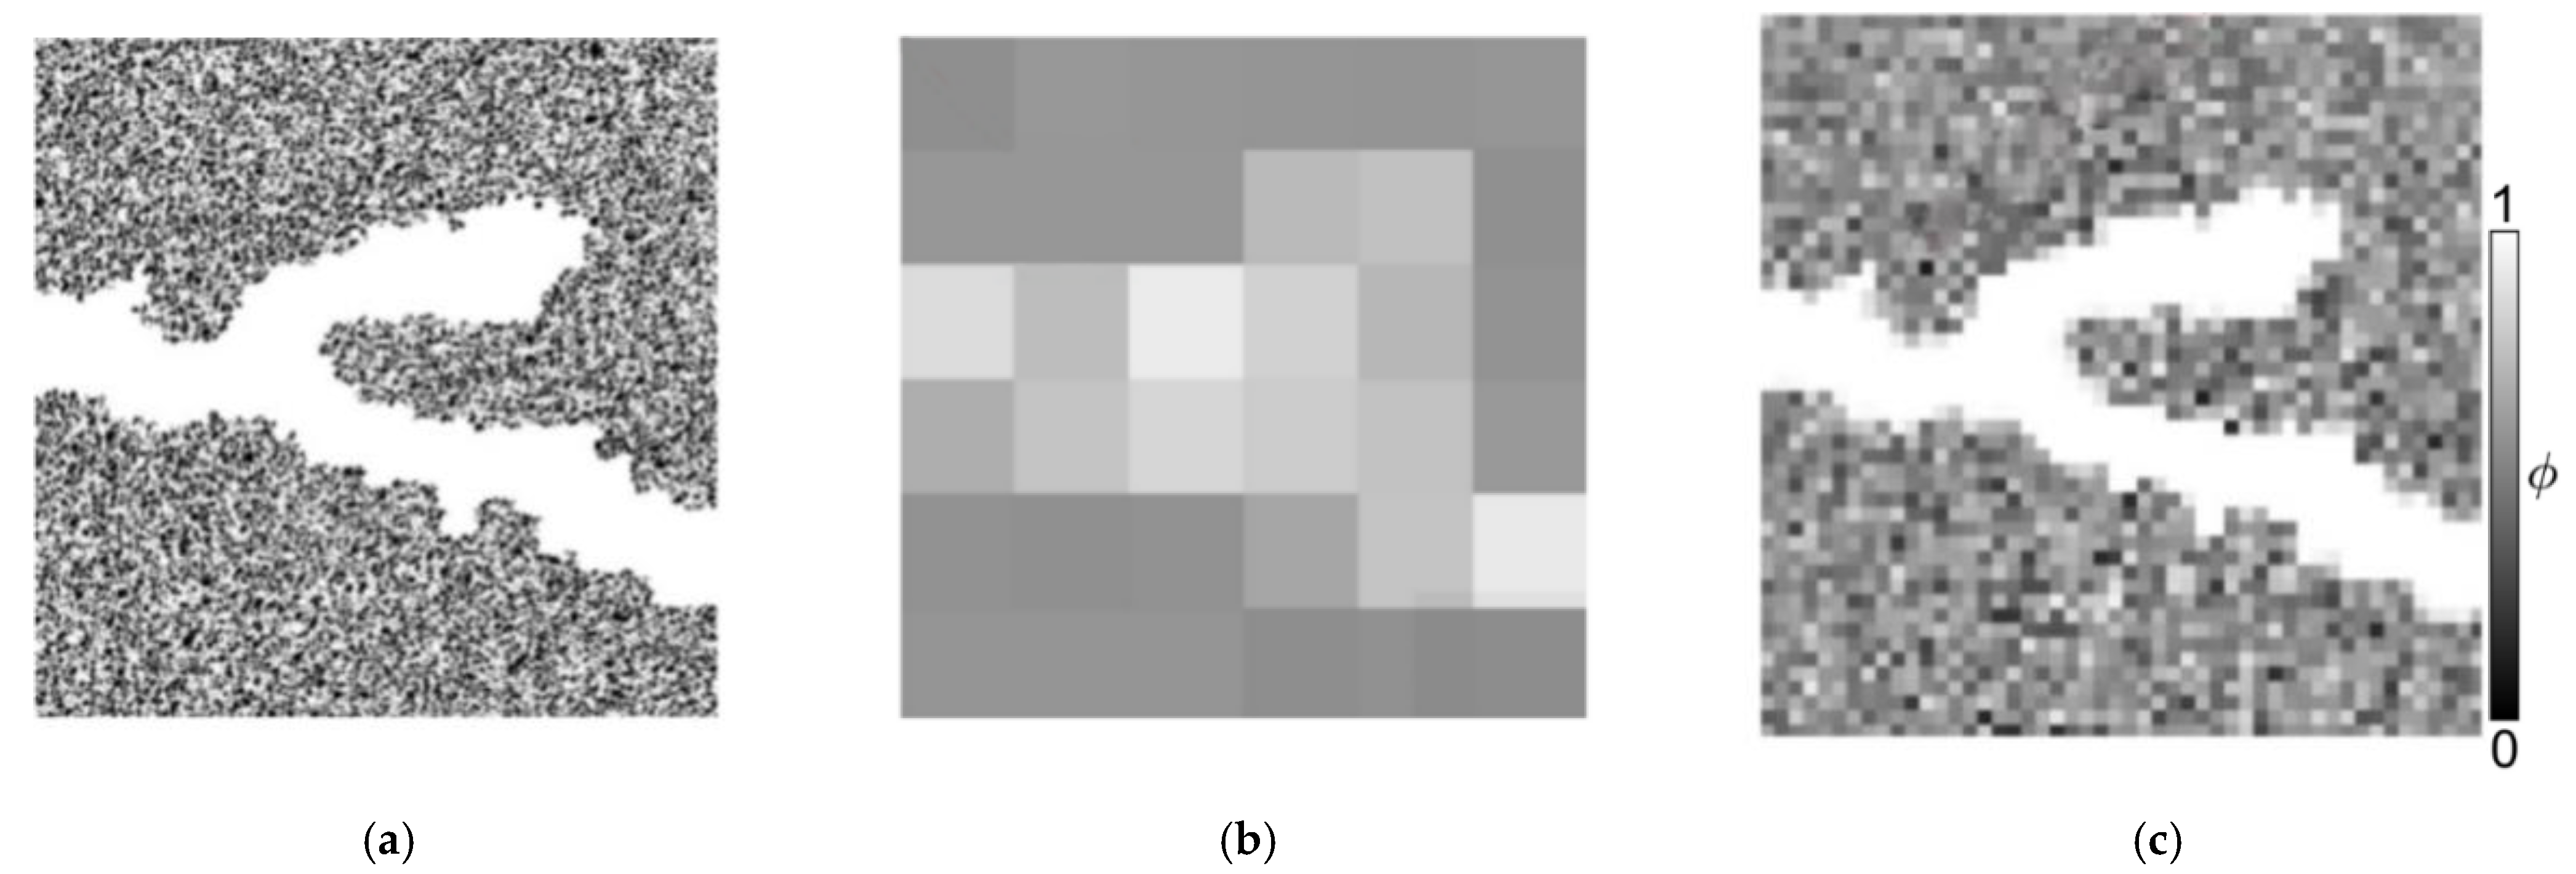
3.1. Characterization of Rock Nonuniformity Based on Digital Image Processing

In this section, the MATLAB program is used to process and reconstruct the images to obtain the 3D images of the carbonate samples. Then, the images are imported into the numerical model to obtain the variation patterns of permeability and porosity. A numerical cylinder model with the same scale as the specimen is constructed. The porosity is the same based on the CT images of each layer, which means the numerical model and the specimen have a one-to-one spatial mapping in porosity.
As one of the essential properties of rocks, porosity influences the permeability of specimens and carbonate formations. The CT images contain pore features of the specimen slice, so the pore information in the tomographic images needs to be extracted. The larger the gray value of the pixel, the smaller the pore size of the sample cubes. The porosity within the slice can be obtained by selecting the appropriate grayscale threshold. There are various methods for determining the threshold value, most of which are based on a combination of empirical and visual recognition. Those methods are lack wide applicability and highly susceptible to human influence. Drawing on the results of Taud et al. [32] and Zhu et al. [33], we define the initial porosity of the specimen as a function of the grayscale as follows.
ϕ 0 = 1 0.99 r i r max
where ri is the grayscale value of each pixel point, varying between 0 and 1. rmax is the maximum grayscale value. When the gray value ri = 0, ϕ = 1, and the small voxel represents void; when the gray value ri = rmax, the small voxel refers to rock skeletons without any pores; when the gray value is between the minimum and maximum, the voxel contains both pores and rock skeletons. The porosity corresponds linearly to the gray value. Therefore, the porosity magnitude of each pixel point in the tomographic image can be obtained, as shown in Figure 10. The porosity is nonuniformly distributed in the numerical specimen, and the porosity at the pore–vug–fracture structure is larger than in other locations. The technique based on digital image processing can realize the characterization and quantification of the strong heterogeneity of carbonate rocks. The generated data are imported into numerical simulation software and provide the conditions for studying the simulation of single-phase flow in strongly heterogeneous multiple media. The permeability of the specimen unit is positively correlated with the porosity, and the larger the unit porosity, the larger the corresponding permeability, with the initial permeability defined as [34,35]
k 0 = a ϕ 0 b
where a and b are empirical parameters, which are taken as 1.46 × 10³ and 4.5, respectively, in this paper. Similarly, the relationship between porosity and rock modulus of elasticity and density is
E = E 0 ϕ 0 3
ρ = ρ 0 ϕ 0 3
where E and E0 denote the modulus of elasticity of the rock and matrix, respectively, ρ and ρ0 denotes the density of the rock and matrix, respectively.

3.2. Numerical Simulation Results

The model couples the deformation and flow equations. The detailed derivation of the mathematical model is listed in the Appendix A. The commercial software Comsol is adopted for the numerical simulation in the single-phase and two-phase flow. We first check the benchmark case with simple geometries to ensure the correctness of our settings. Then, for more complex geometries, we have refined the mesh to reach convergence, especially for contacting area between the fracture and matrix.
For a cylindrical specimen, a circumferential pressure is applied to the side of the specimen and set to no fluid inflow or outflow, a particular pressure difference is applied at both ends of the specimen, and prescribed pore pressure is applied in the solution domain. The model is solved by the steady-state method. One of the numerical model parameters is shown in Table 2.
A 1.5 MPa pore pressure is applied at the bottom boundary, 1 atm pore pressure is applied at the upper boundary, and the side surface is impermeable. The pore–vug–fracture structure distribution in the numerical model is given in Figure 11. The Darcy velocity distribution of the specimen is obtained by simulation. Figure 12 gives the distribution of Darcy velocity along with the multiple internal slices of the carbonate rock sample. The influence of the pore–vug–fracture structure causes local preferential and disturbed flow in the core, which significantly affects the path distribution of fluid flow in the core, and the flow velocity exhibits nonuniformity. The flow lines converge toward the pore, vugs, and fractures with high flow velocity and can increase the core permeability by several orders of magnitude. The pore–vug–fracture structure constitutes a dominant flow channel, which is the key to effectively improving the permeability of the core. Under the same experimental conditions, the flow velocity decreases with the reduction of specimen size. The pore pressure distribution is given in Figure 13. Unlike the homogeneous model, the pore pressure contours are significantly nonlinear. Since the heterogeneity of specimen porosity and permeability is considered by digital image processing, the unit permeability and porosity are the same. The larger the porosity, the larger the permeability. Therefore, the overall permeability of the specimen is a comprehensive reflection of the permeability of many microelements in the specimen. The specimen permeability can be back-calculated by the area integral for the flow rate at the top of the specimen. Table 3 compares the core permeability calculation results and the experimental results, which are in good agreement.
Next, we investigate the effect of pore pressure and surrounding pressure on permeability. Pore pressure varies from 10 to 40 MPa, and the surrounding pressure is 40 MPa, 50 MPa, and 60 MPa. Figure 14 shows the permeability variation curves with pore pressure and surrounding pressure. In the pressure interval of this paper, the permeability increases with the increase of pore pressure, which is because the pore pressure makes the volume of the pores, vugs, and fractures in the specimen increase, i.e., the size of the flow channels in the specimen increases, and the permeability of the specimen increases. The permeability decreases with the increase of the surrounding pressure because the volume of the specimen decreases with the increase of the surrounding pressure, and the volume of the pores, vugs, and fractures in the specimen also decreases with the increase of the surrounding pressure, which makes the permeability of the specimen decrease.

4. Simulation of Gas–Water Two-Phase Seepage in Heterogeneous Carbonate Rocks

In carbonate gas reservoirs, gas–water two-phase flow is widely present. For single-phase flow problems, the flow patterns in the two regions are relatively simple and can be written as uniform flow patterns. The establishment of their mathematical models mainly depends on the determination of the interface conditions. However, for unmixed two-phase flow and multiphase flow, the determination of the flow pattern in the two regions directly affects the establishment of the mathematical model. It directly impacts the determination of the boundary conditions at the intersection. The flow pattern is more complicated when considering the pore–vug–fracture structure. This section aims to establish a set of numerical models to study the two-phase flow characteristics of the pore–vug–fracture medium based on the strong heterogeneous multiple media flow model so that the two-phase fluid flow and its flow state in the pore–vug–fracture medium can be correctly described and predicted.

4.1. Simulation of Gas–Water Two-Phase Seepage

The detailed derivation of the mathematical model is listed in the Appendix A. The setup of the numerical model is introduced in this section. The surrounding pressure is fixed at the model boundary, and axial stresses are set 10 MPa, 20 MPa, and 30 MPa, the initial water saturation is 1, and the residual water saturation is 0.05. The outlet fluid pressure is 0, and the two sides are zero flux boundaries. The gas phase is forced through the specimen. Two types of tests were performed depending on the magnitude of the inlet fluid pressure: (a) inlet gas pressure = inlet water pressure (pg = pw) and (b) pgpw. The parameters required for the numerical model are given in Table 4.

4.2. Simulation Results

Because the outlet gas velocity is significantly higher than the outlet water velocity, the logarithmic axis is chosen as the outlet water velocity to improve the clarity. First, we fix the inlet water pressure pw and gradually increase the inlet gas pressure pg. For the results shown in the Figure 15, the specimen is first saturated with water, and the inlet water pressure pw is kept at a constant value of 200 kPa, and then the natural gas injection is started and gradually increased (i.e., the inlet gas pressure pg = 200 kPa, 225 kPa, 250 kPa, 275 kPa, 300 kPa, and 325 kPa). The outlet gas and water flow rates are measured when each operating condition reaches a steady state. Figure 15 plots the outlet water and gas velocities with inlet gas pressure based on the steady-state two-phase flow rates. The bottom horizontal axis of the figure shows the inlet gas pressure, and the corresponding outlet gas velocity is given on the top horizontal axis. The corresponding outlet water velocity is given on the left vertical axis. It can be seen that the outlet gas velocity is very high compared to the outlet water velocity because of the effect of the relative permeability and the low viscosity of the natural gas. For a given surrounding pressure, the outlet gas velocity increases, and the outlet water velocity decreases as the inlet gas pressure increases. The gas phase occupies more and more pore space in the rock. We also discuss the effects of the surrounding pressure and multiscale specimens on the two-phase flow. The surrounding pressure leads to the closure of the pore, vugs, and fractures, leading to a decrease in the two-phase flow velocity. As the surrounding pressure increases, the velocities of both the outlet gas and water decrease. As the sample size decreases, the velocities of both outlet gas and water increase.
Next, we consider the case of equal inlet water and gas pressure, i.e., pw = pg. Figure 16 shows the variation in water and gas outlet velocity with inlet gas pressure. The specimen is first saturated with water at a given inlet water pressure. Then start injecting gas and make the inlet gas pressure equal to the inlet water pressure. Measure the gas and water flow rate after a steady state. Under a prescribed surrounding pressure, the two-phase outlet velocity is small with lower inlet gas and water pressure. As the inlet gas and water pressure increase, the two-phase outlet velocity increases. The outlet gas velocity is always greater than the outlet water velocity regardless of the inlet pressure. With the increase of the surrounding pressure, the two-phase outlet velocity decreases.
Figure 17 provides the process of the gas phase displacing the aqueous phase for different size specimens (blue for the aqueous phase, red for the natural gas phase, pc = 10 MPa, pg = 325 kP, pw = 200 kPa). It can be seen that with the increase of gas injection volume, the nonwetting phase expels the wetting phase from the porous medium with a stable displacement front. The injected gas can flow faster toward the outlet due to the influence of the pore–vug–fracture structure, causing the nonlinearity of the displacement front velocity.

5. Conclusions

In this paper, characterizations of multiscale pore–vug–fracture structures of carbonate reservoirs were carried out for low-porosity, strongly heterogeneous carbonate reservoirs. The single-phase and gas–water two-phase flow models in strongly heterogeneous multiple media were established based on digital image processing. The permeability characteristics and single-phase and multiphase fluid flow behaviors of carbonate rocks at different scales are systematically studied. The following main conclusions were obtained.
(1)
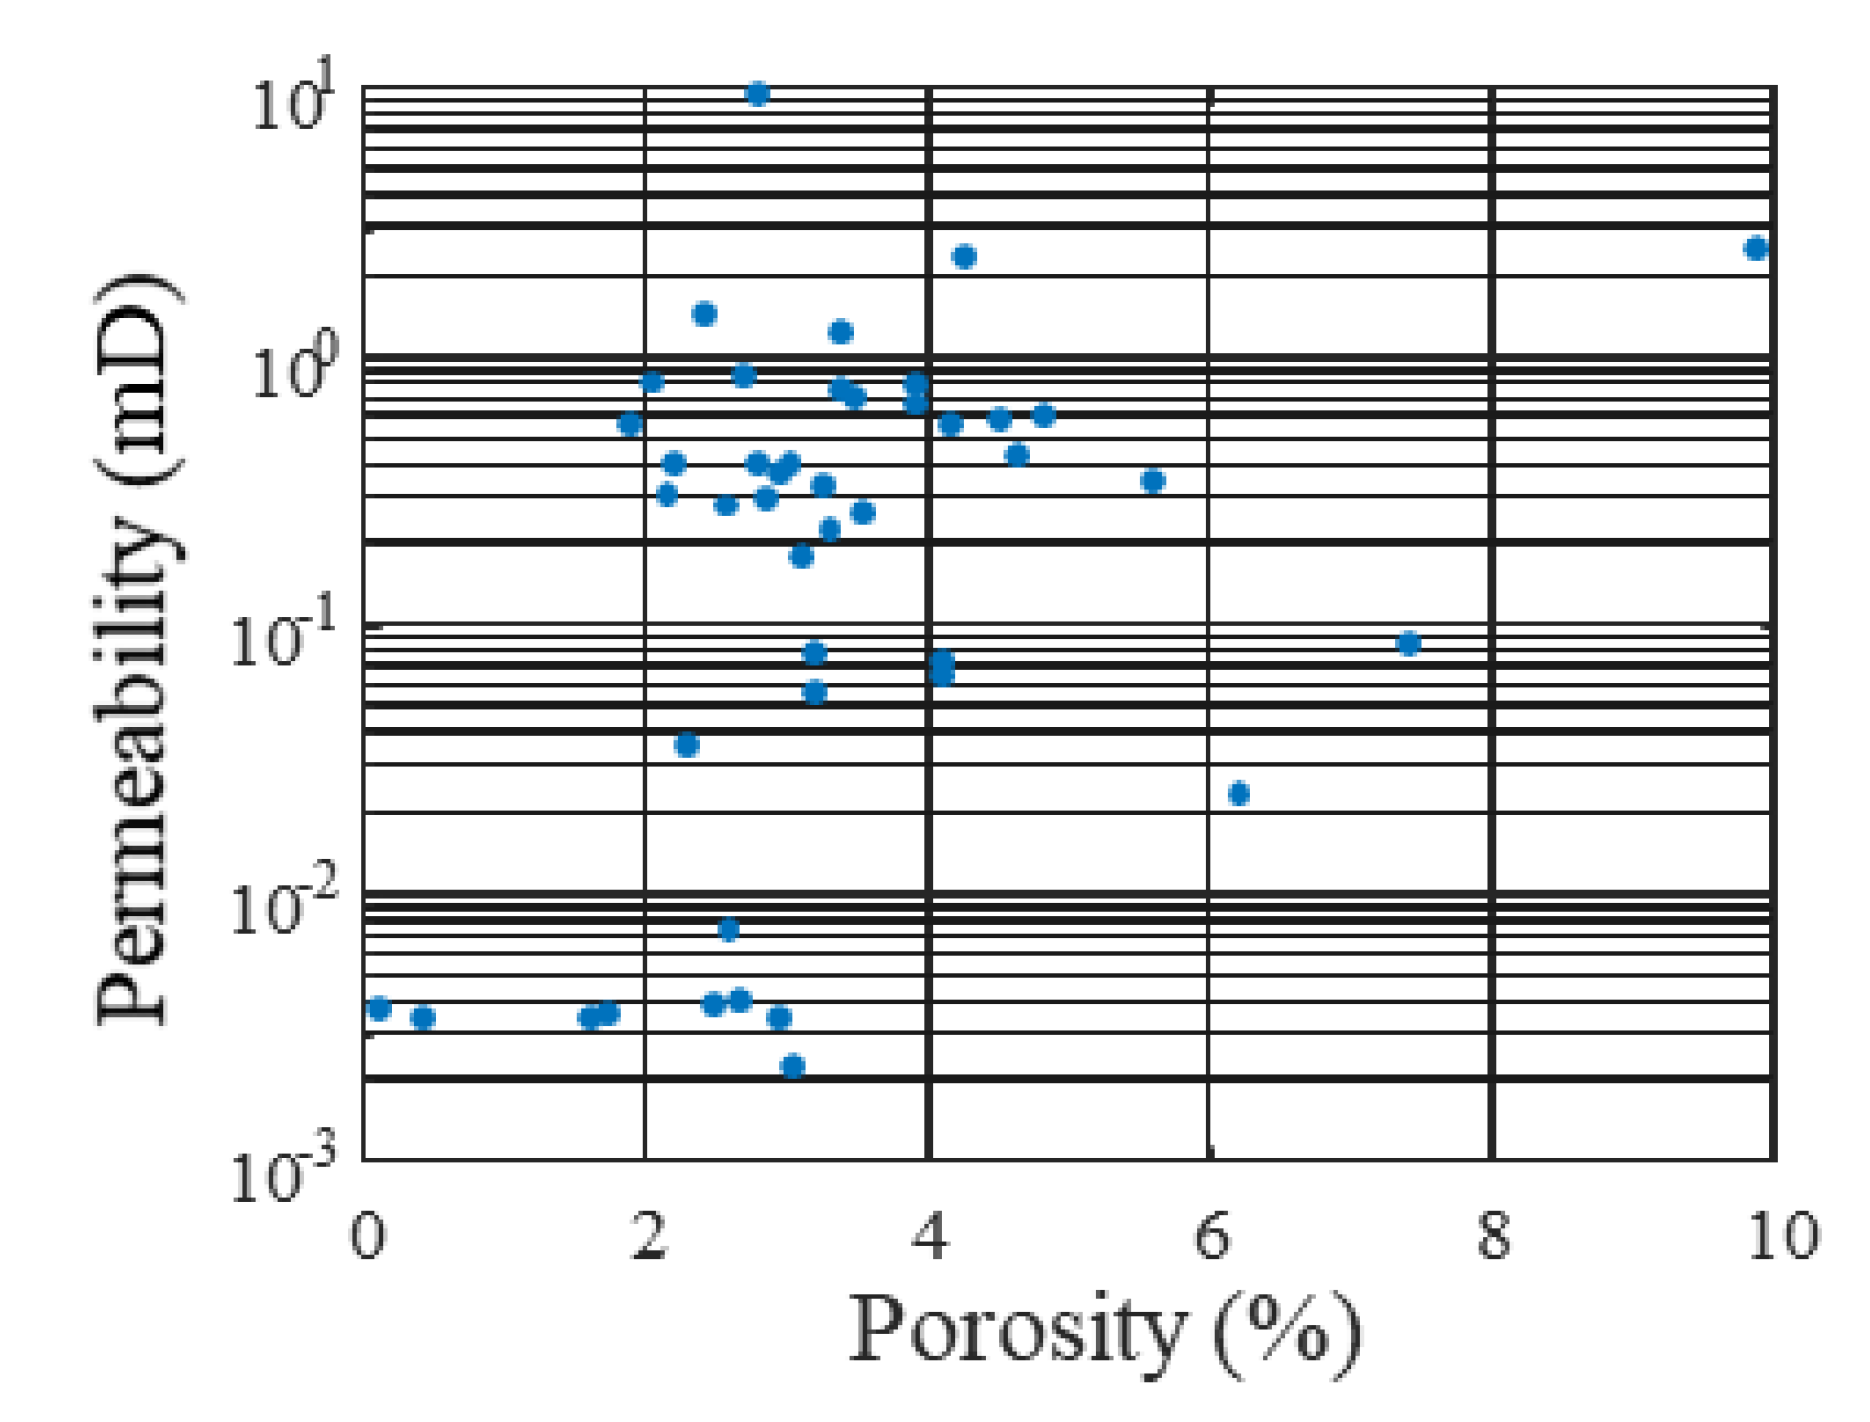
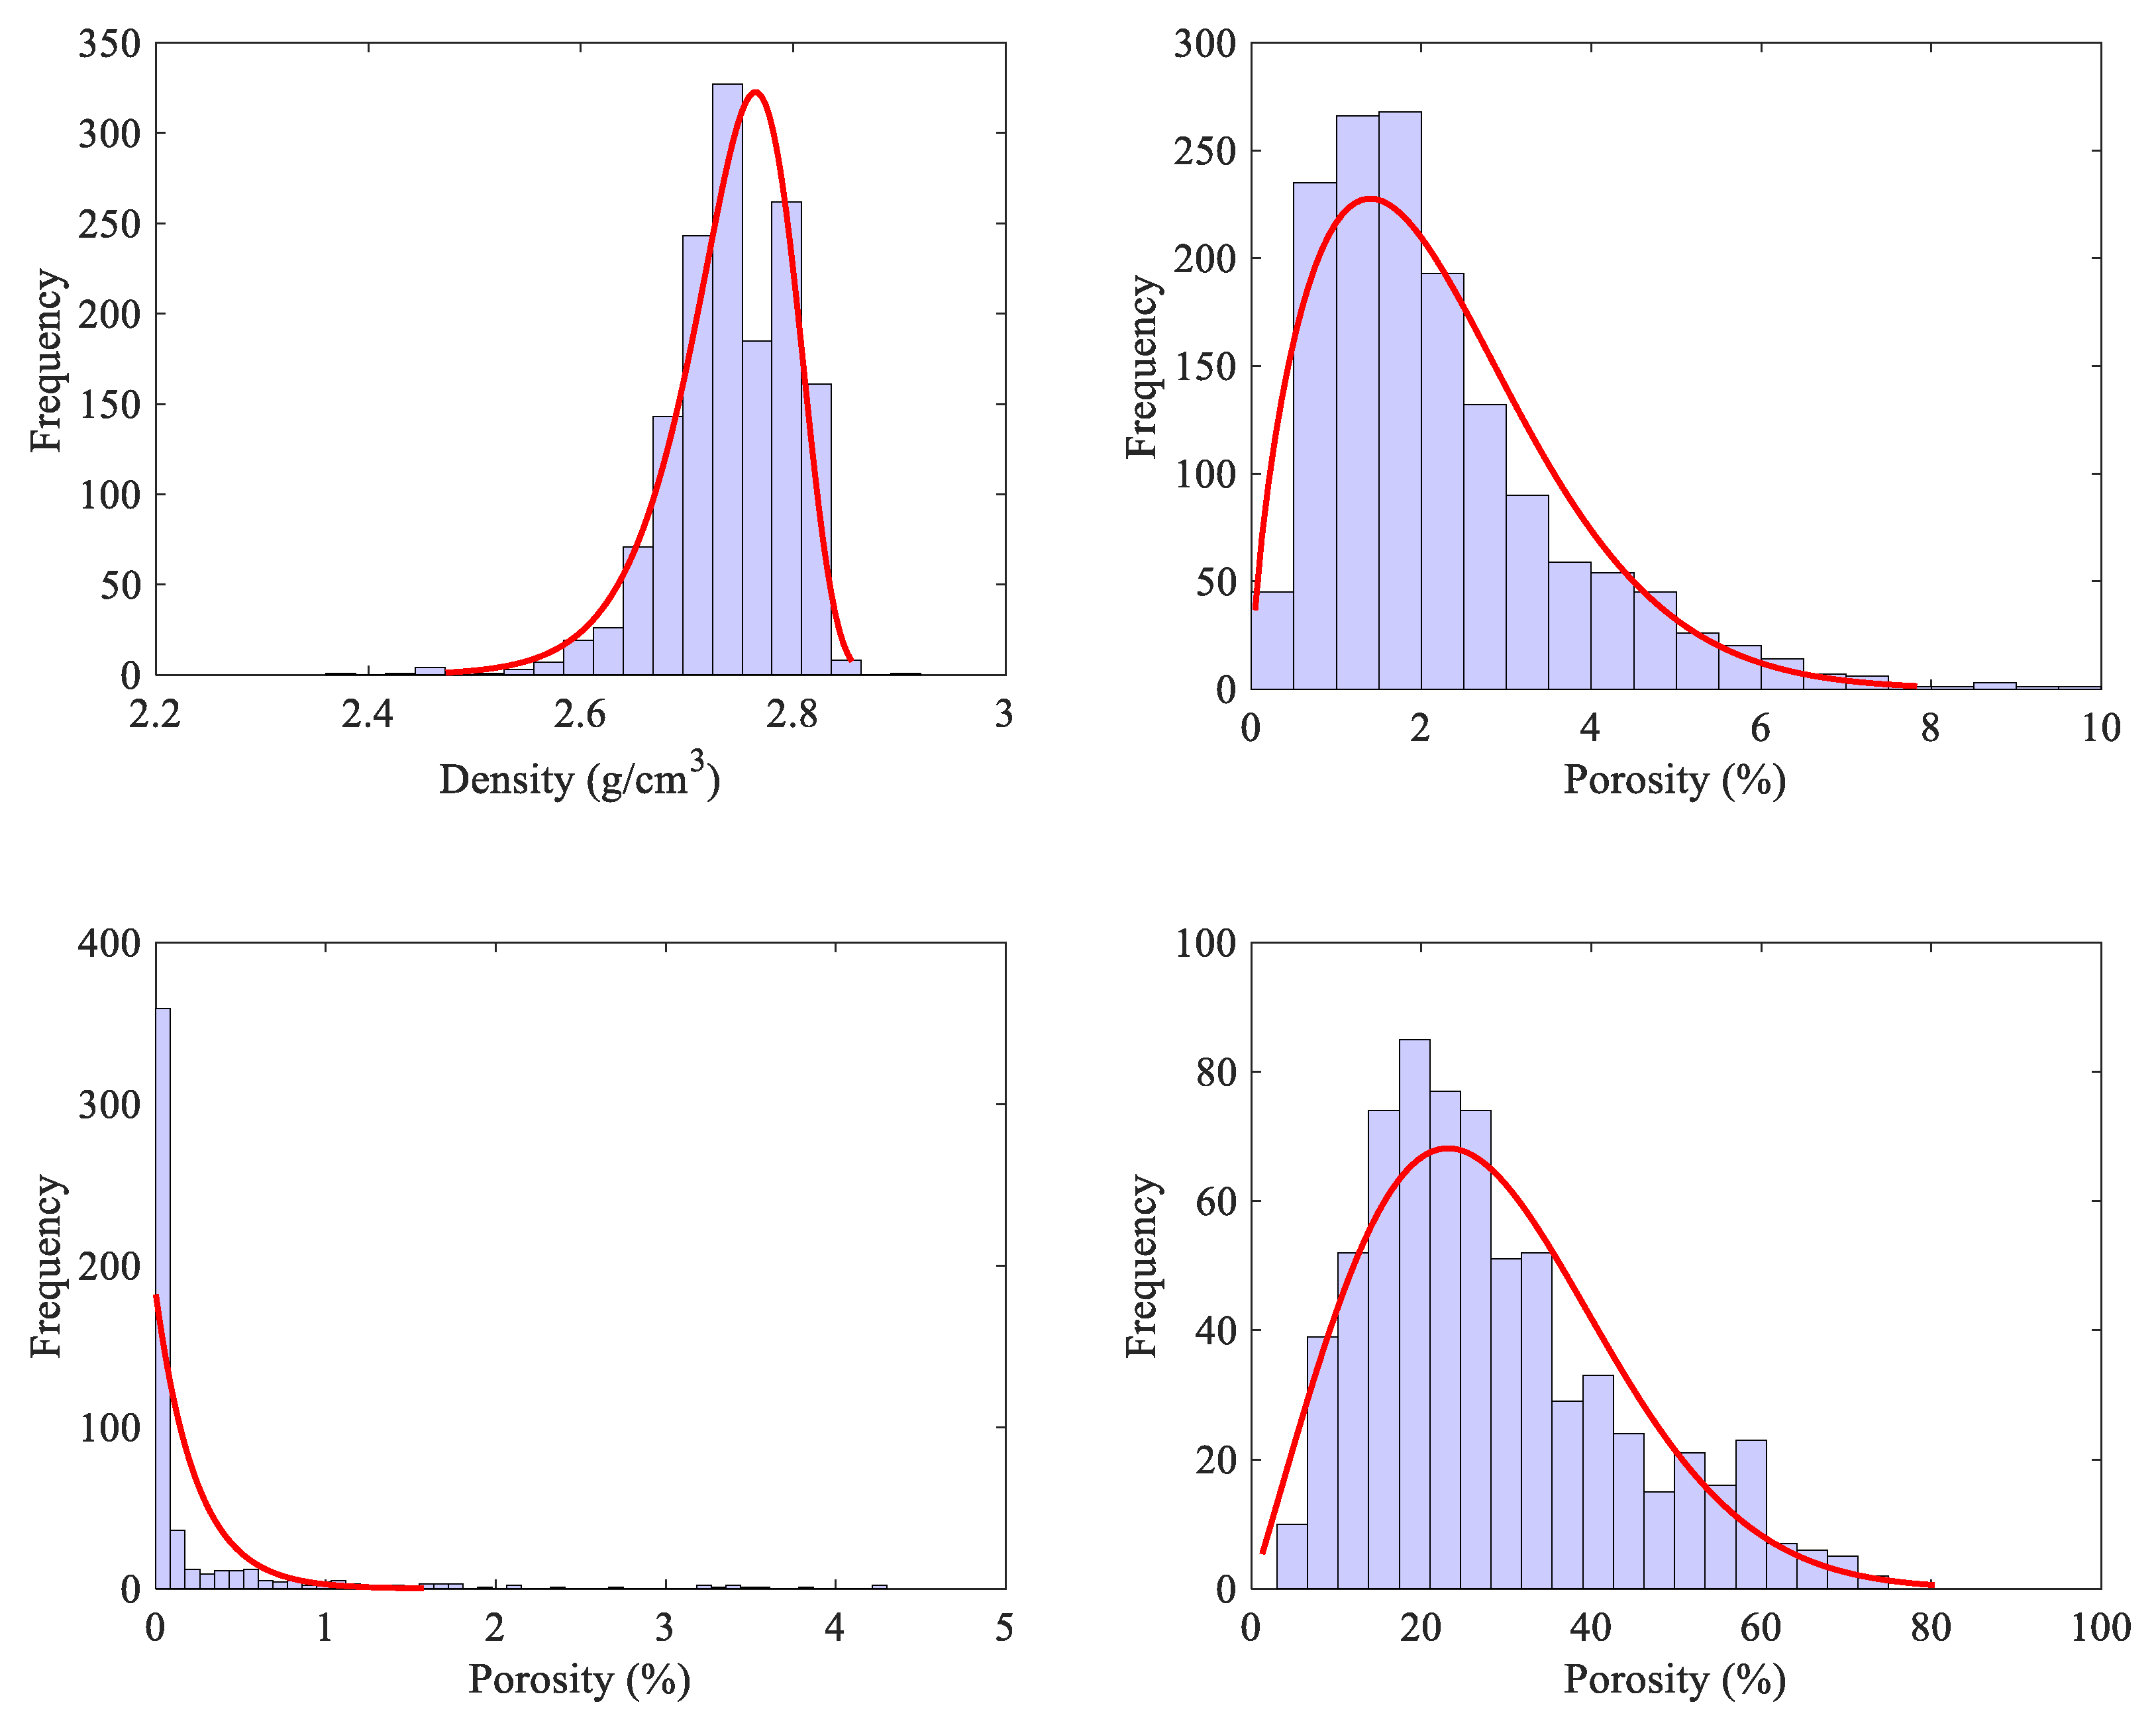
The carbonate rocks are highly heterogeneous and have developed pores, vugs, and fractures, resulting in no significant correlation between permeability and porosity. The maximum equivalent diameter of pores has an approximate positive correlation with porosity. Multiscale CT scans show that the pore network of the cores is not connected even when the resolution reaches 0.5 μm, which indicates that the carbonate matrix is particularly dense. However, even poorly connected fractures can increase permeability. Fracture aggregation can increase efficient permeability by reducing flow distance through the less permeable matrix.
(2)
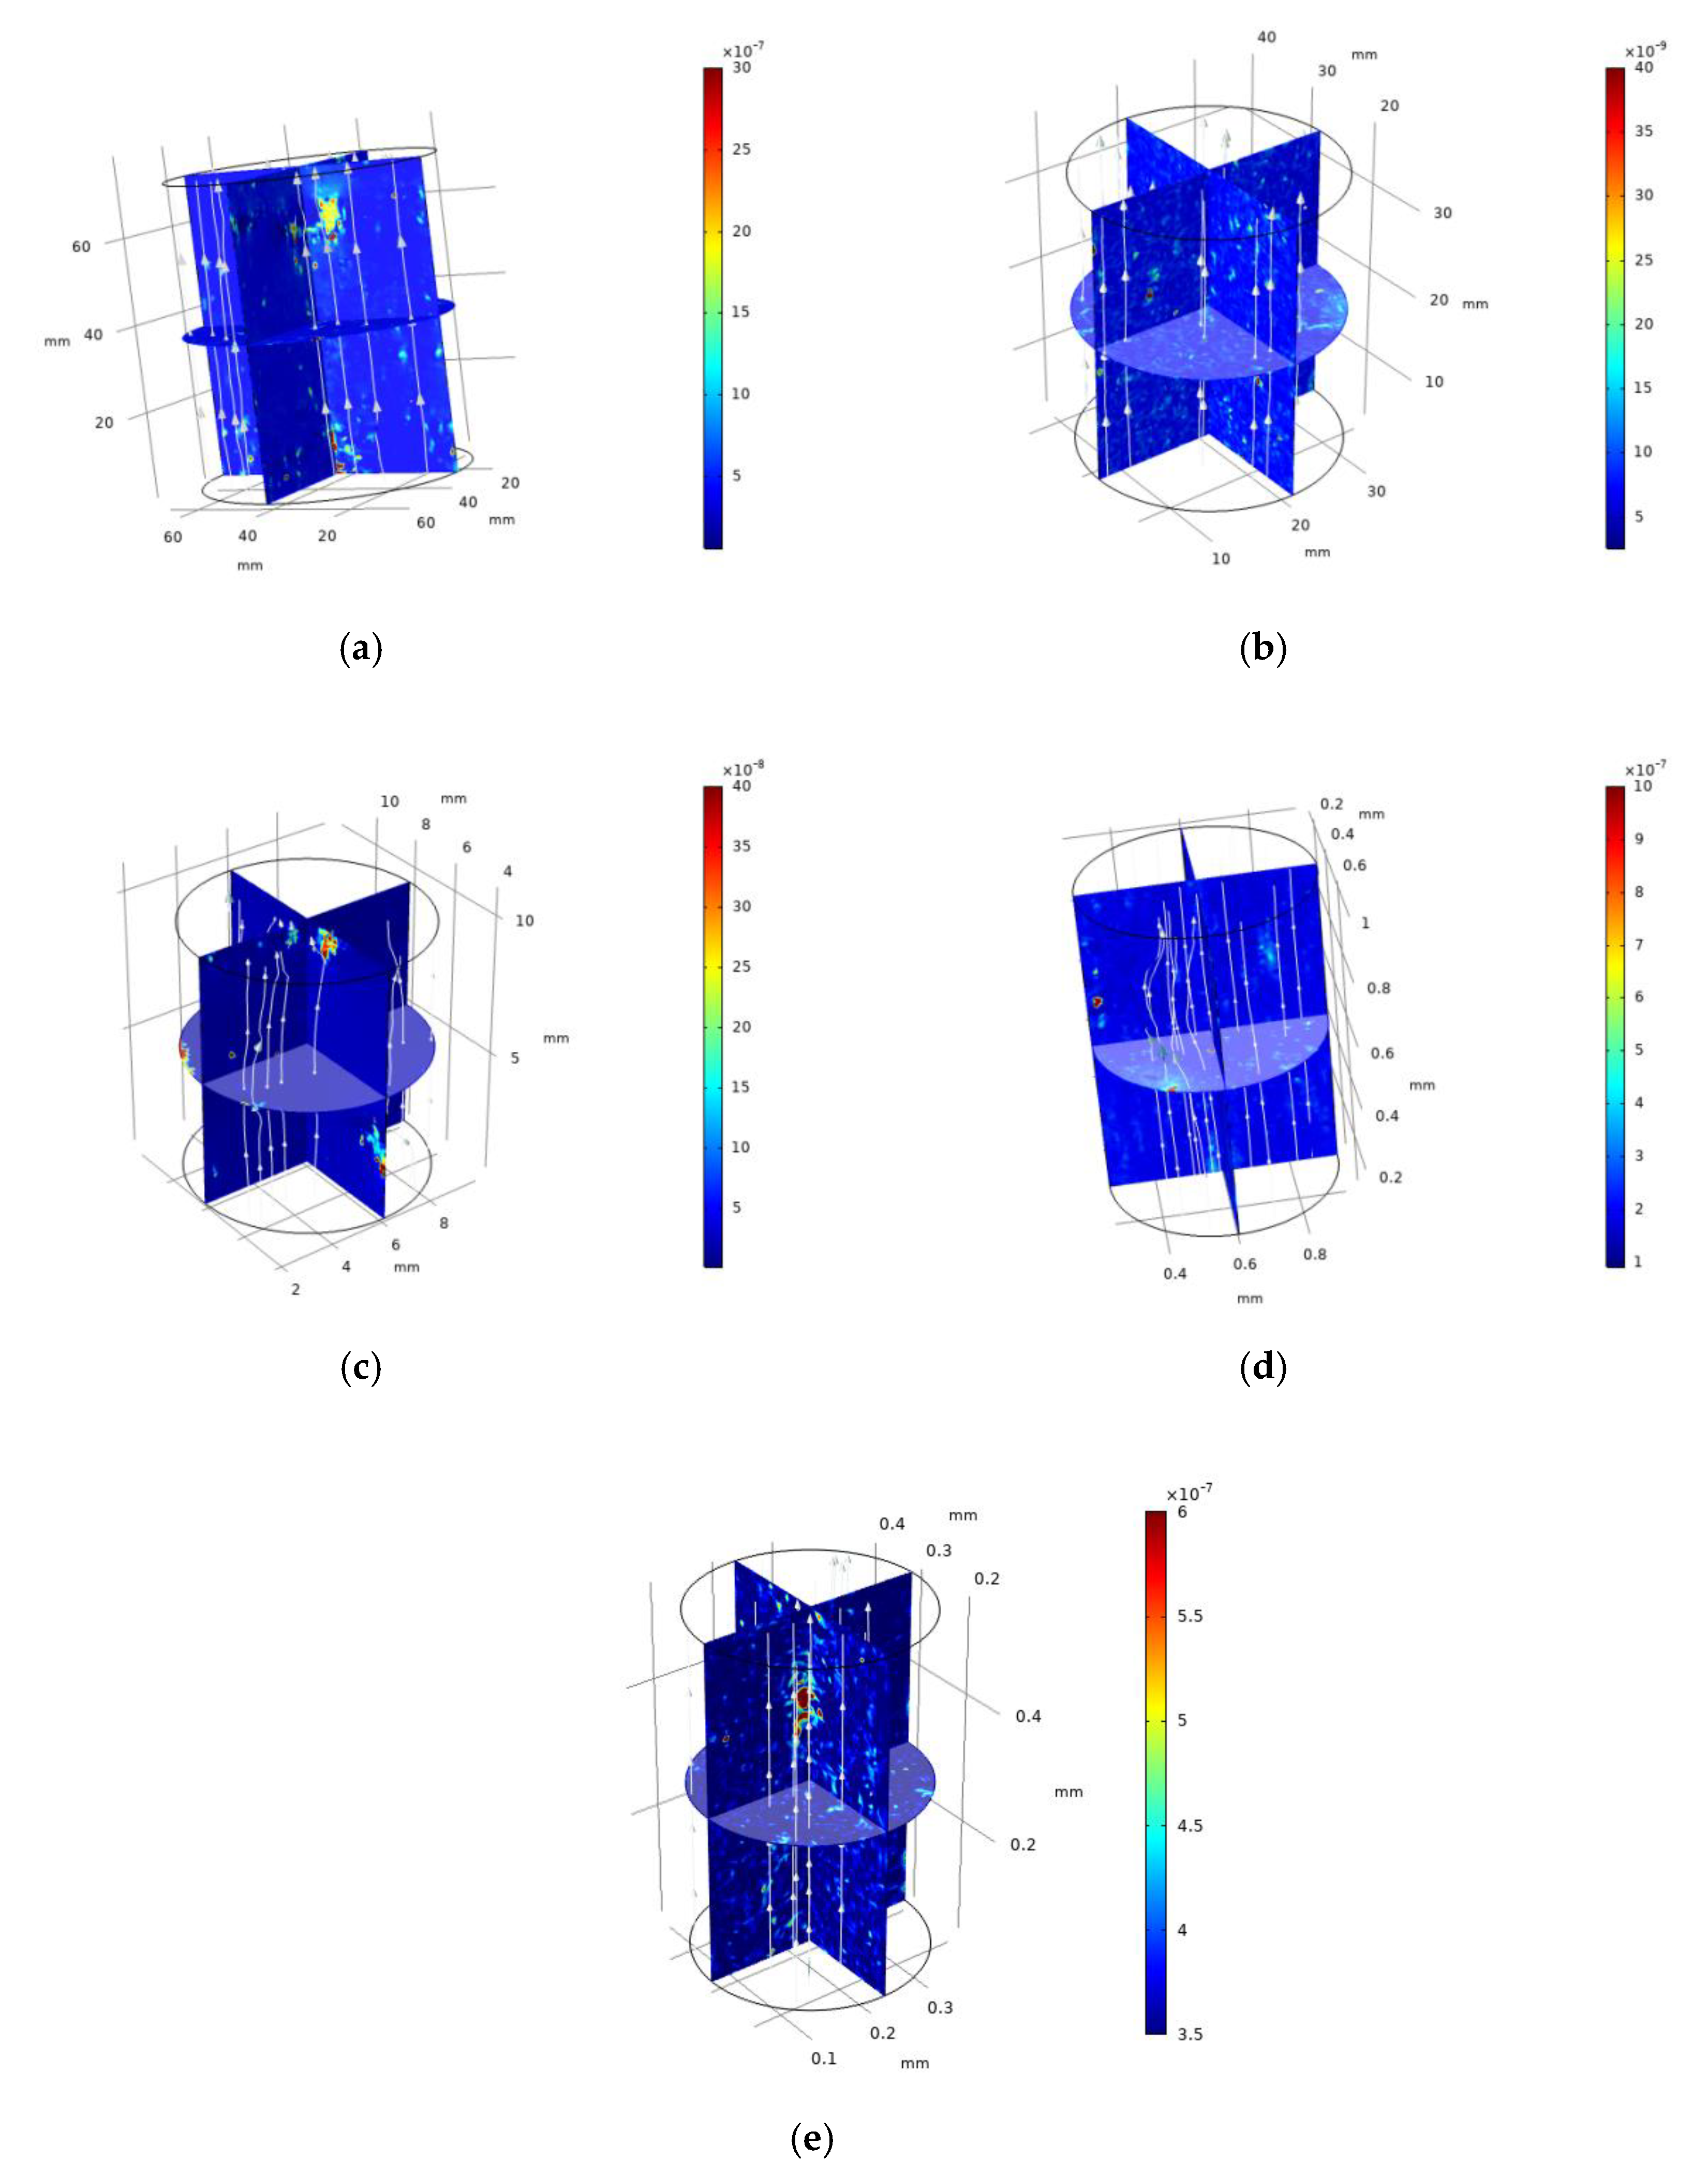
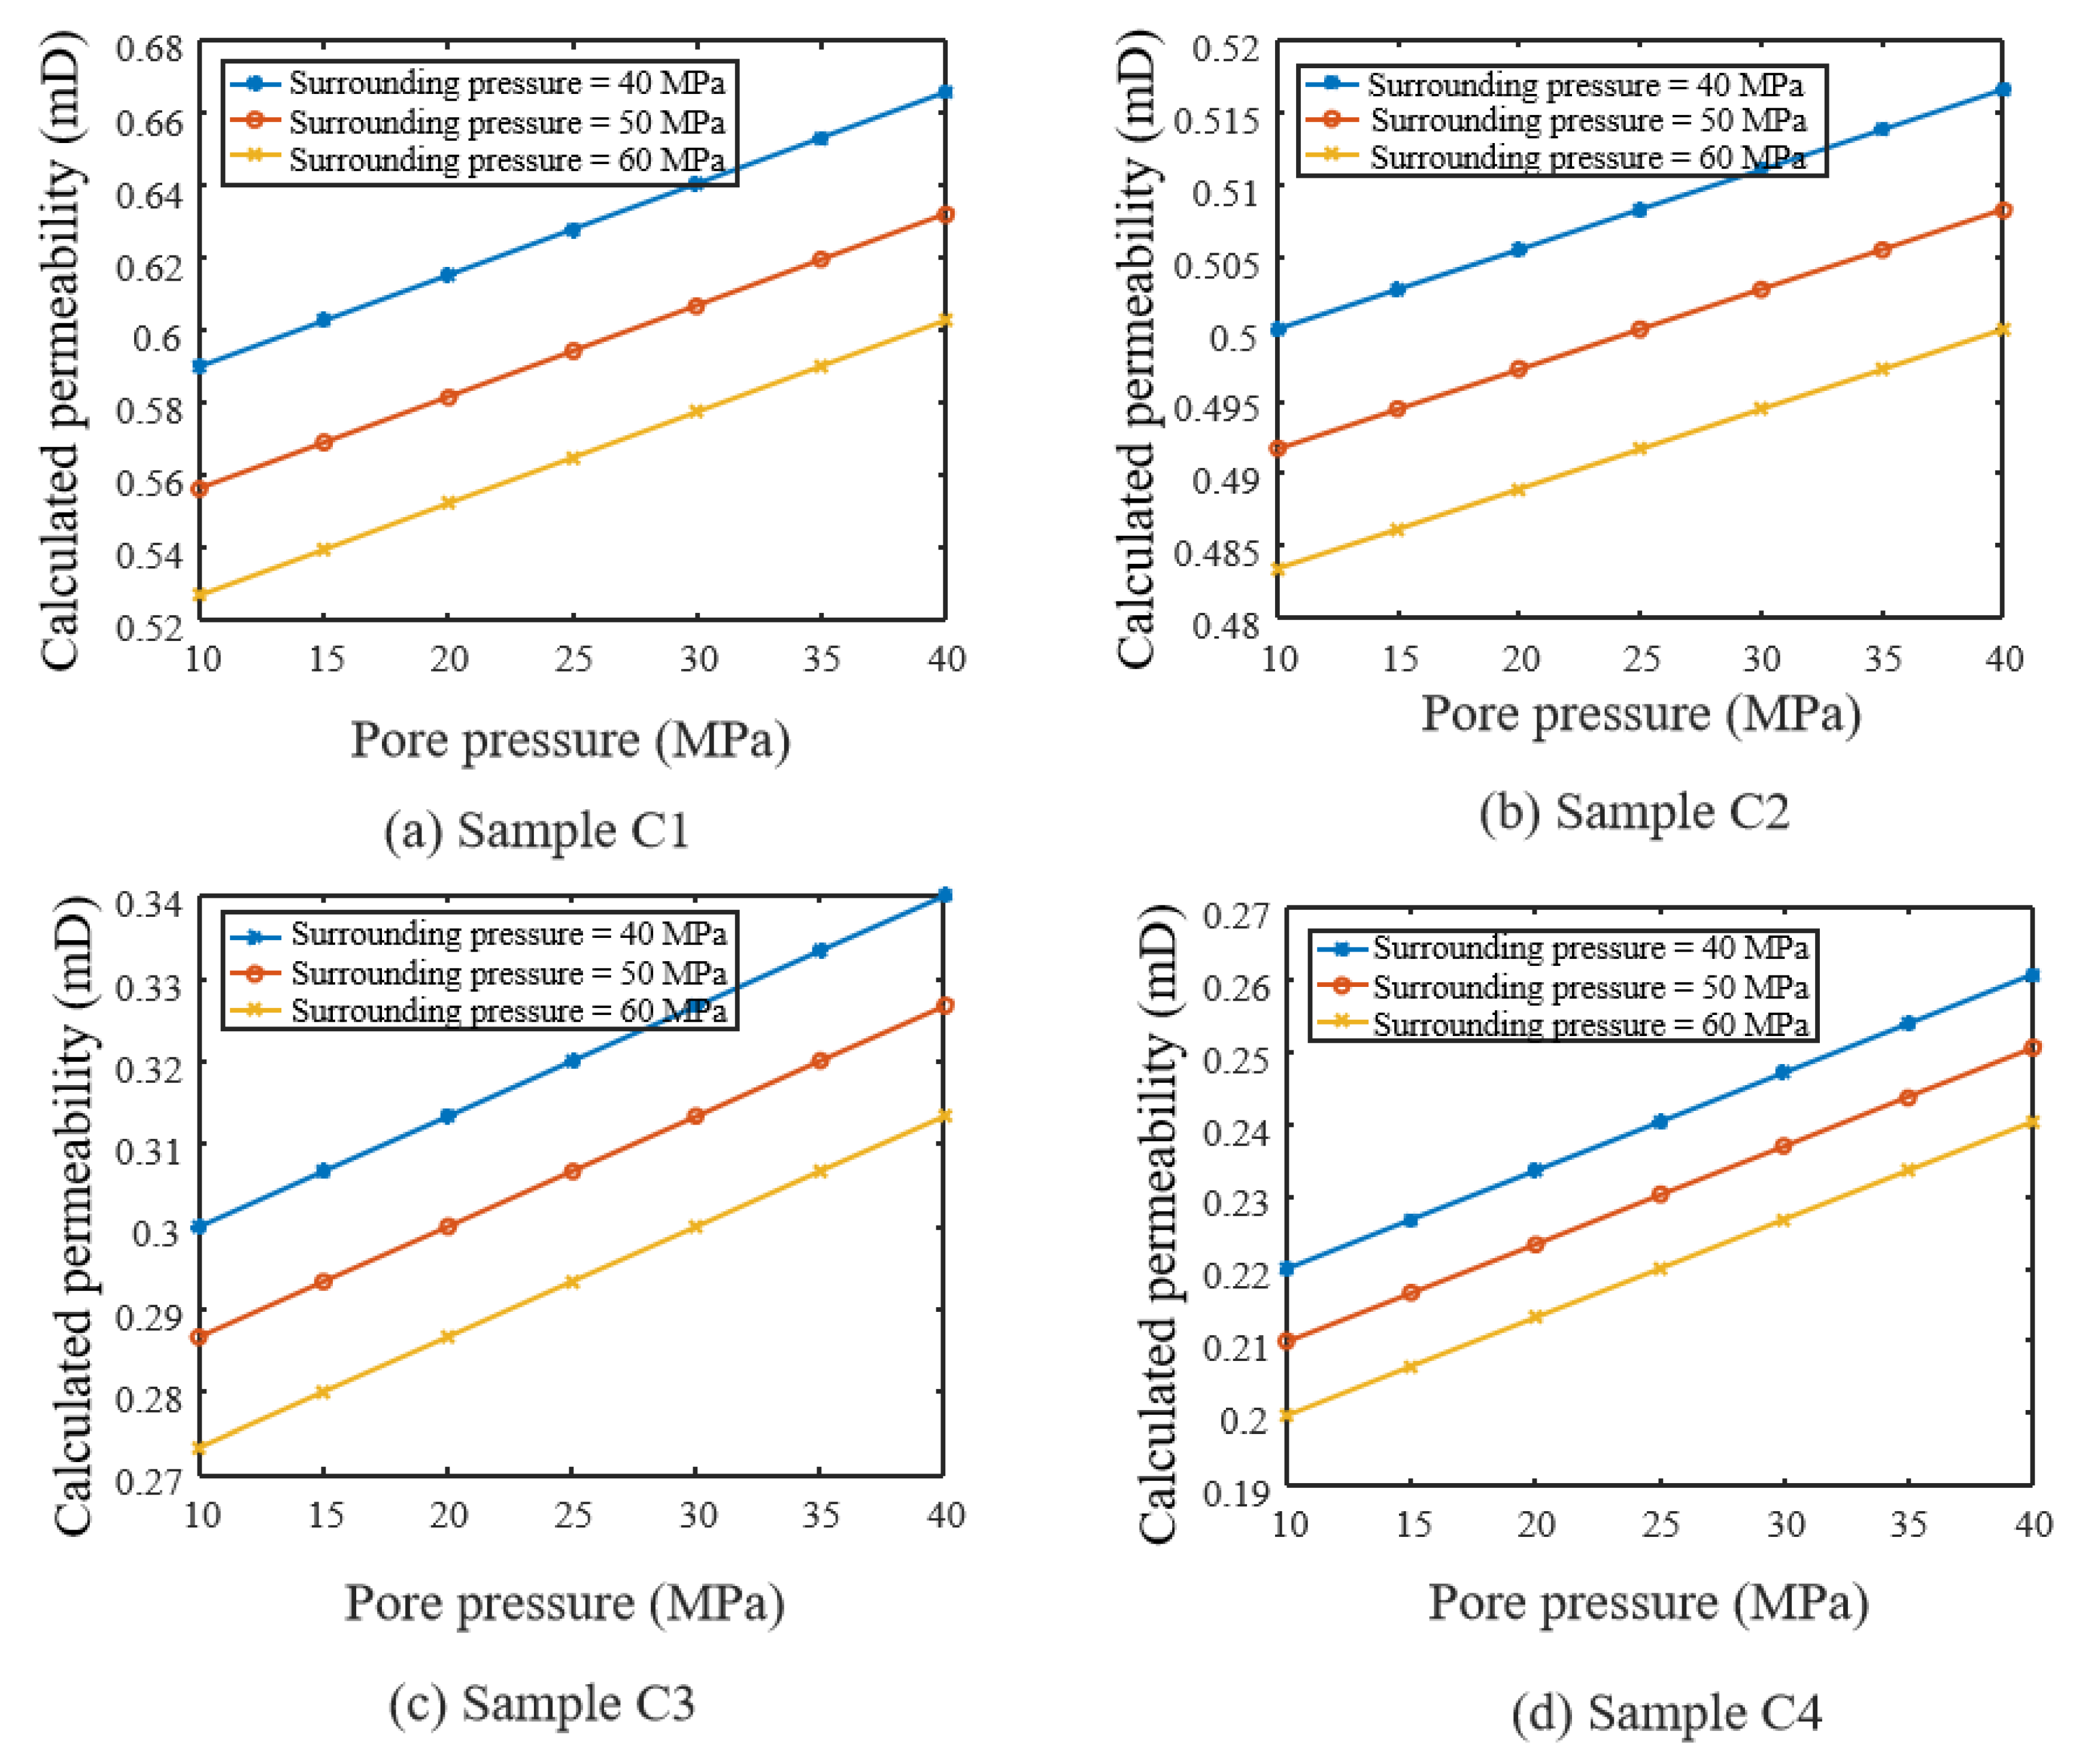
The simulation of single-phase flow in strongly heterogeneous multiple media is carried out based on the digital image model. Results show that the pore–vug–fracture structure causes local preferential and disturbed flow in the core, which significantly affects the fluid flow path and pressure distribution in the core. The overall permeability of the specimen is a comprehensive representation of the permeability of many microelements in the specimen, and the core permeability calculation results are in good agreement with the experimental results. In the pressure interval of this paper, the permeability increases with the increase of pore pressure and decreases with the increase of surrounding pressure.
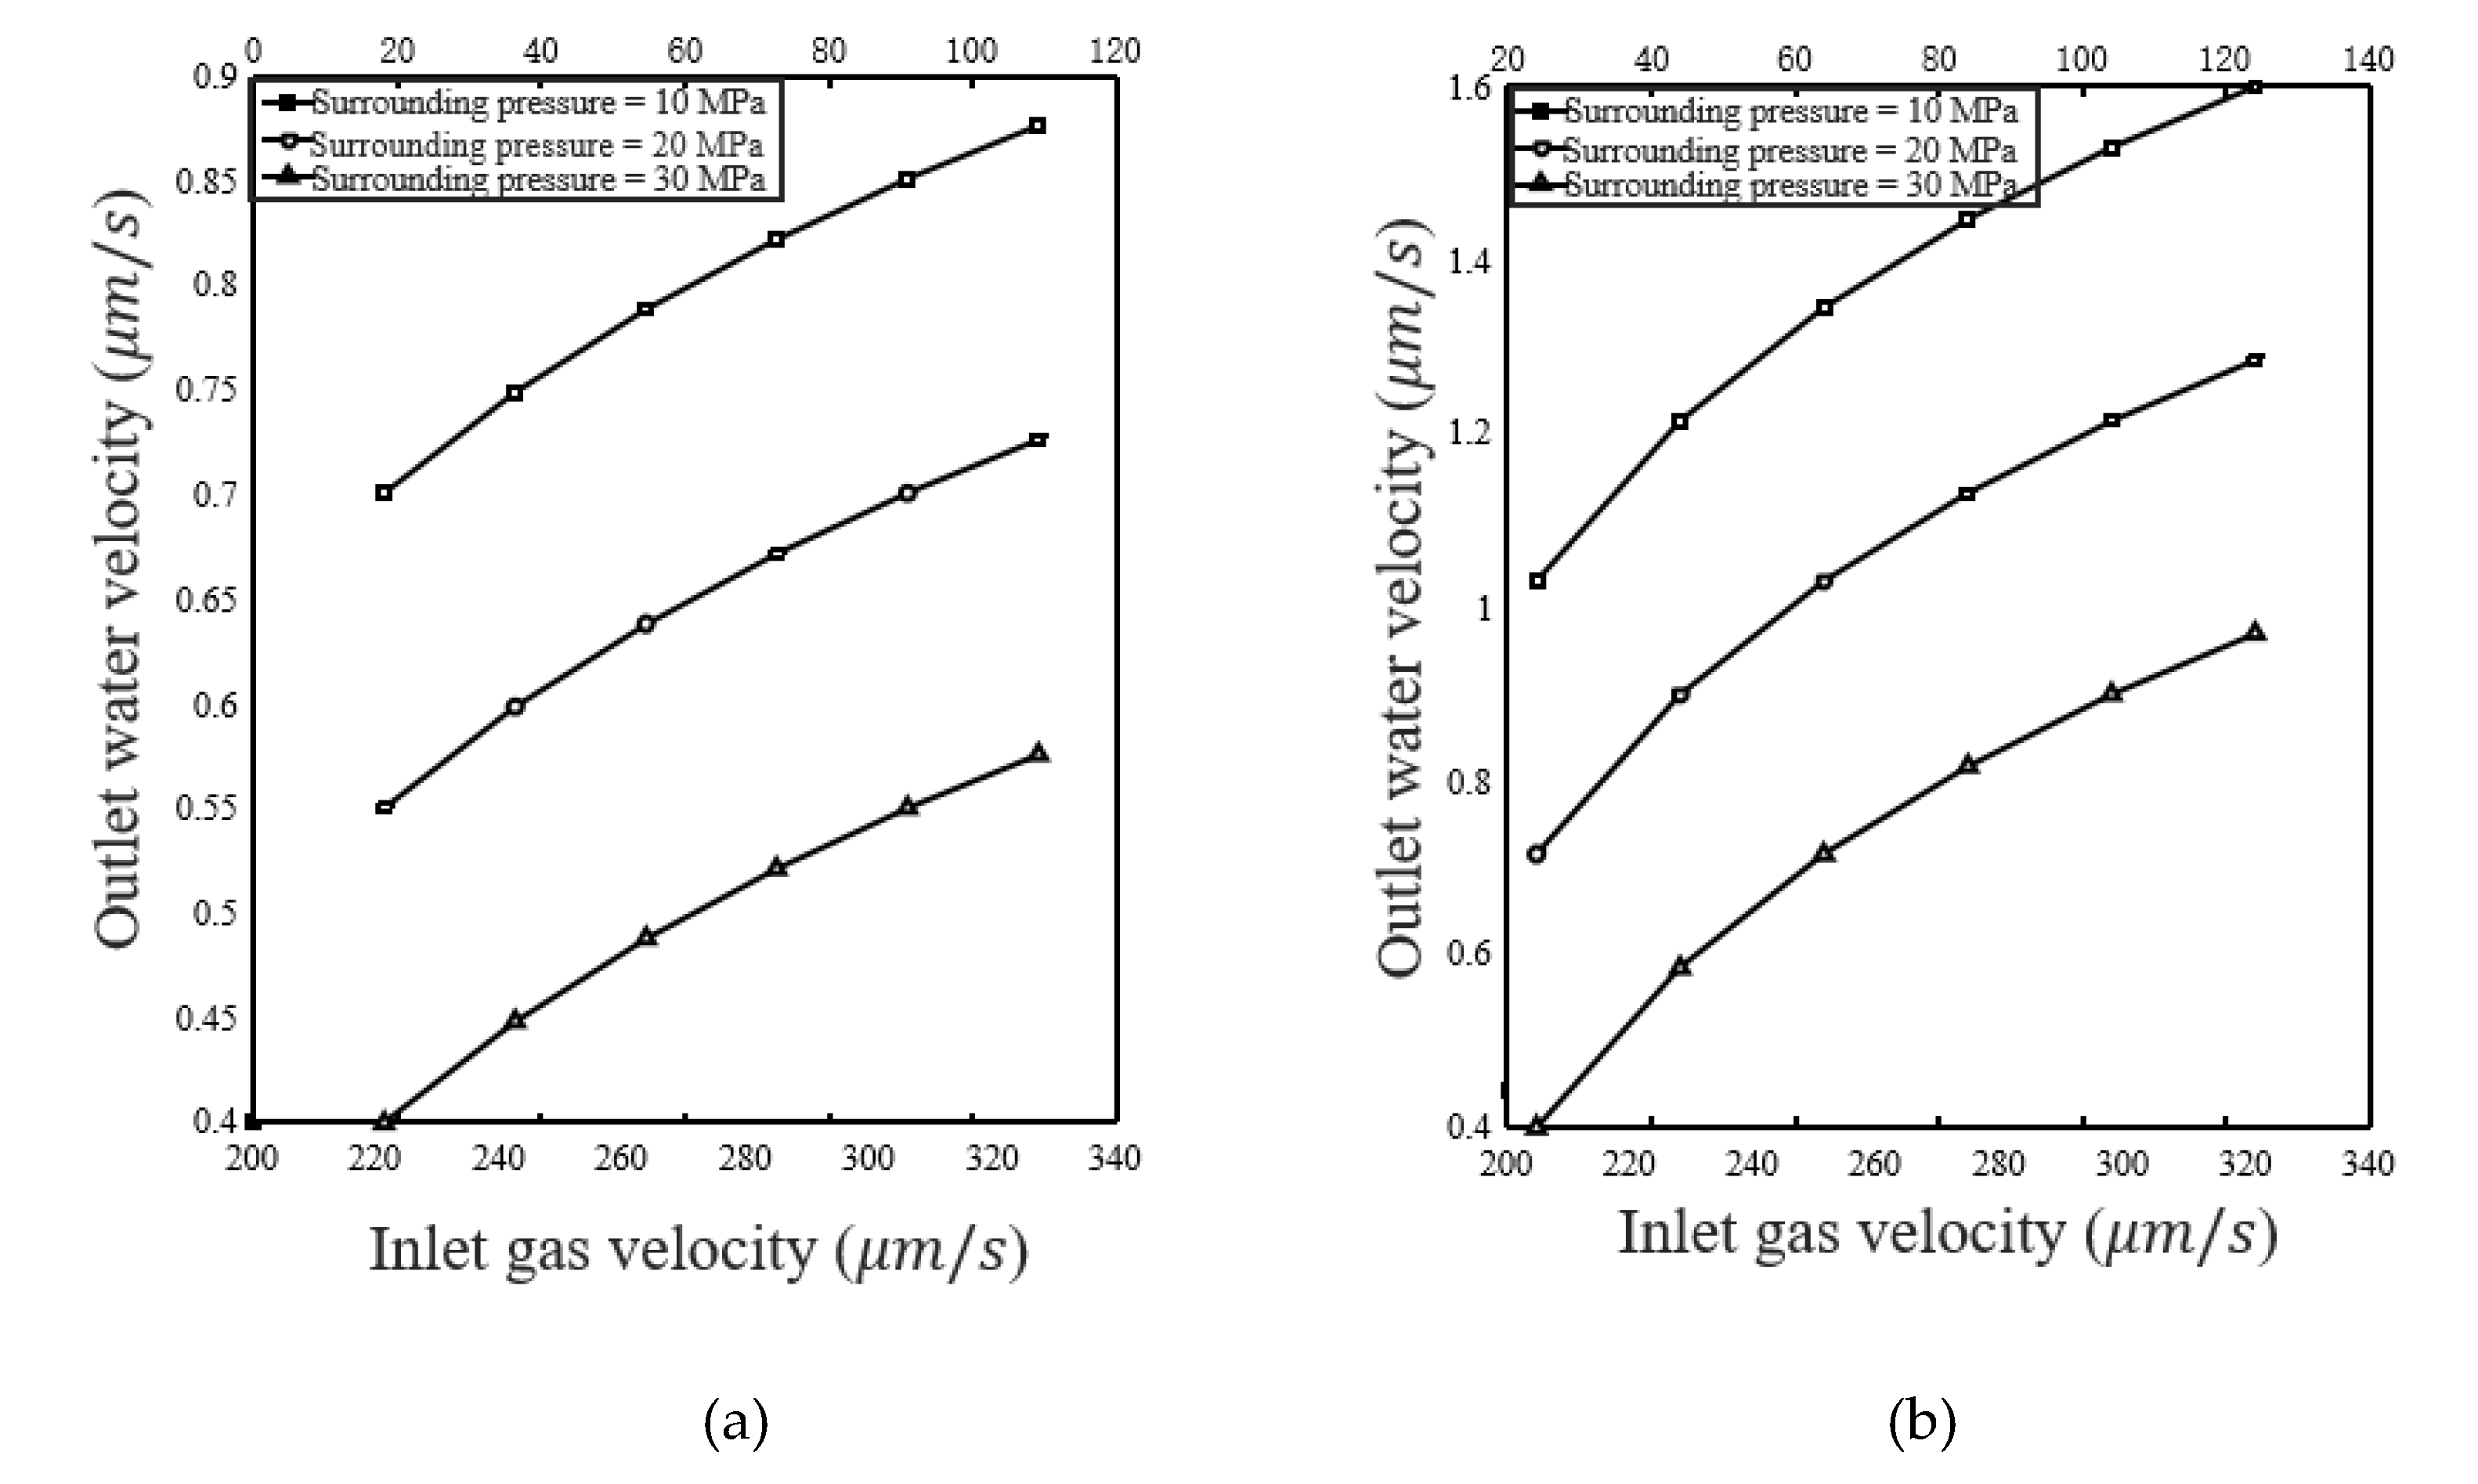
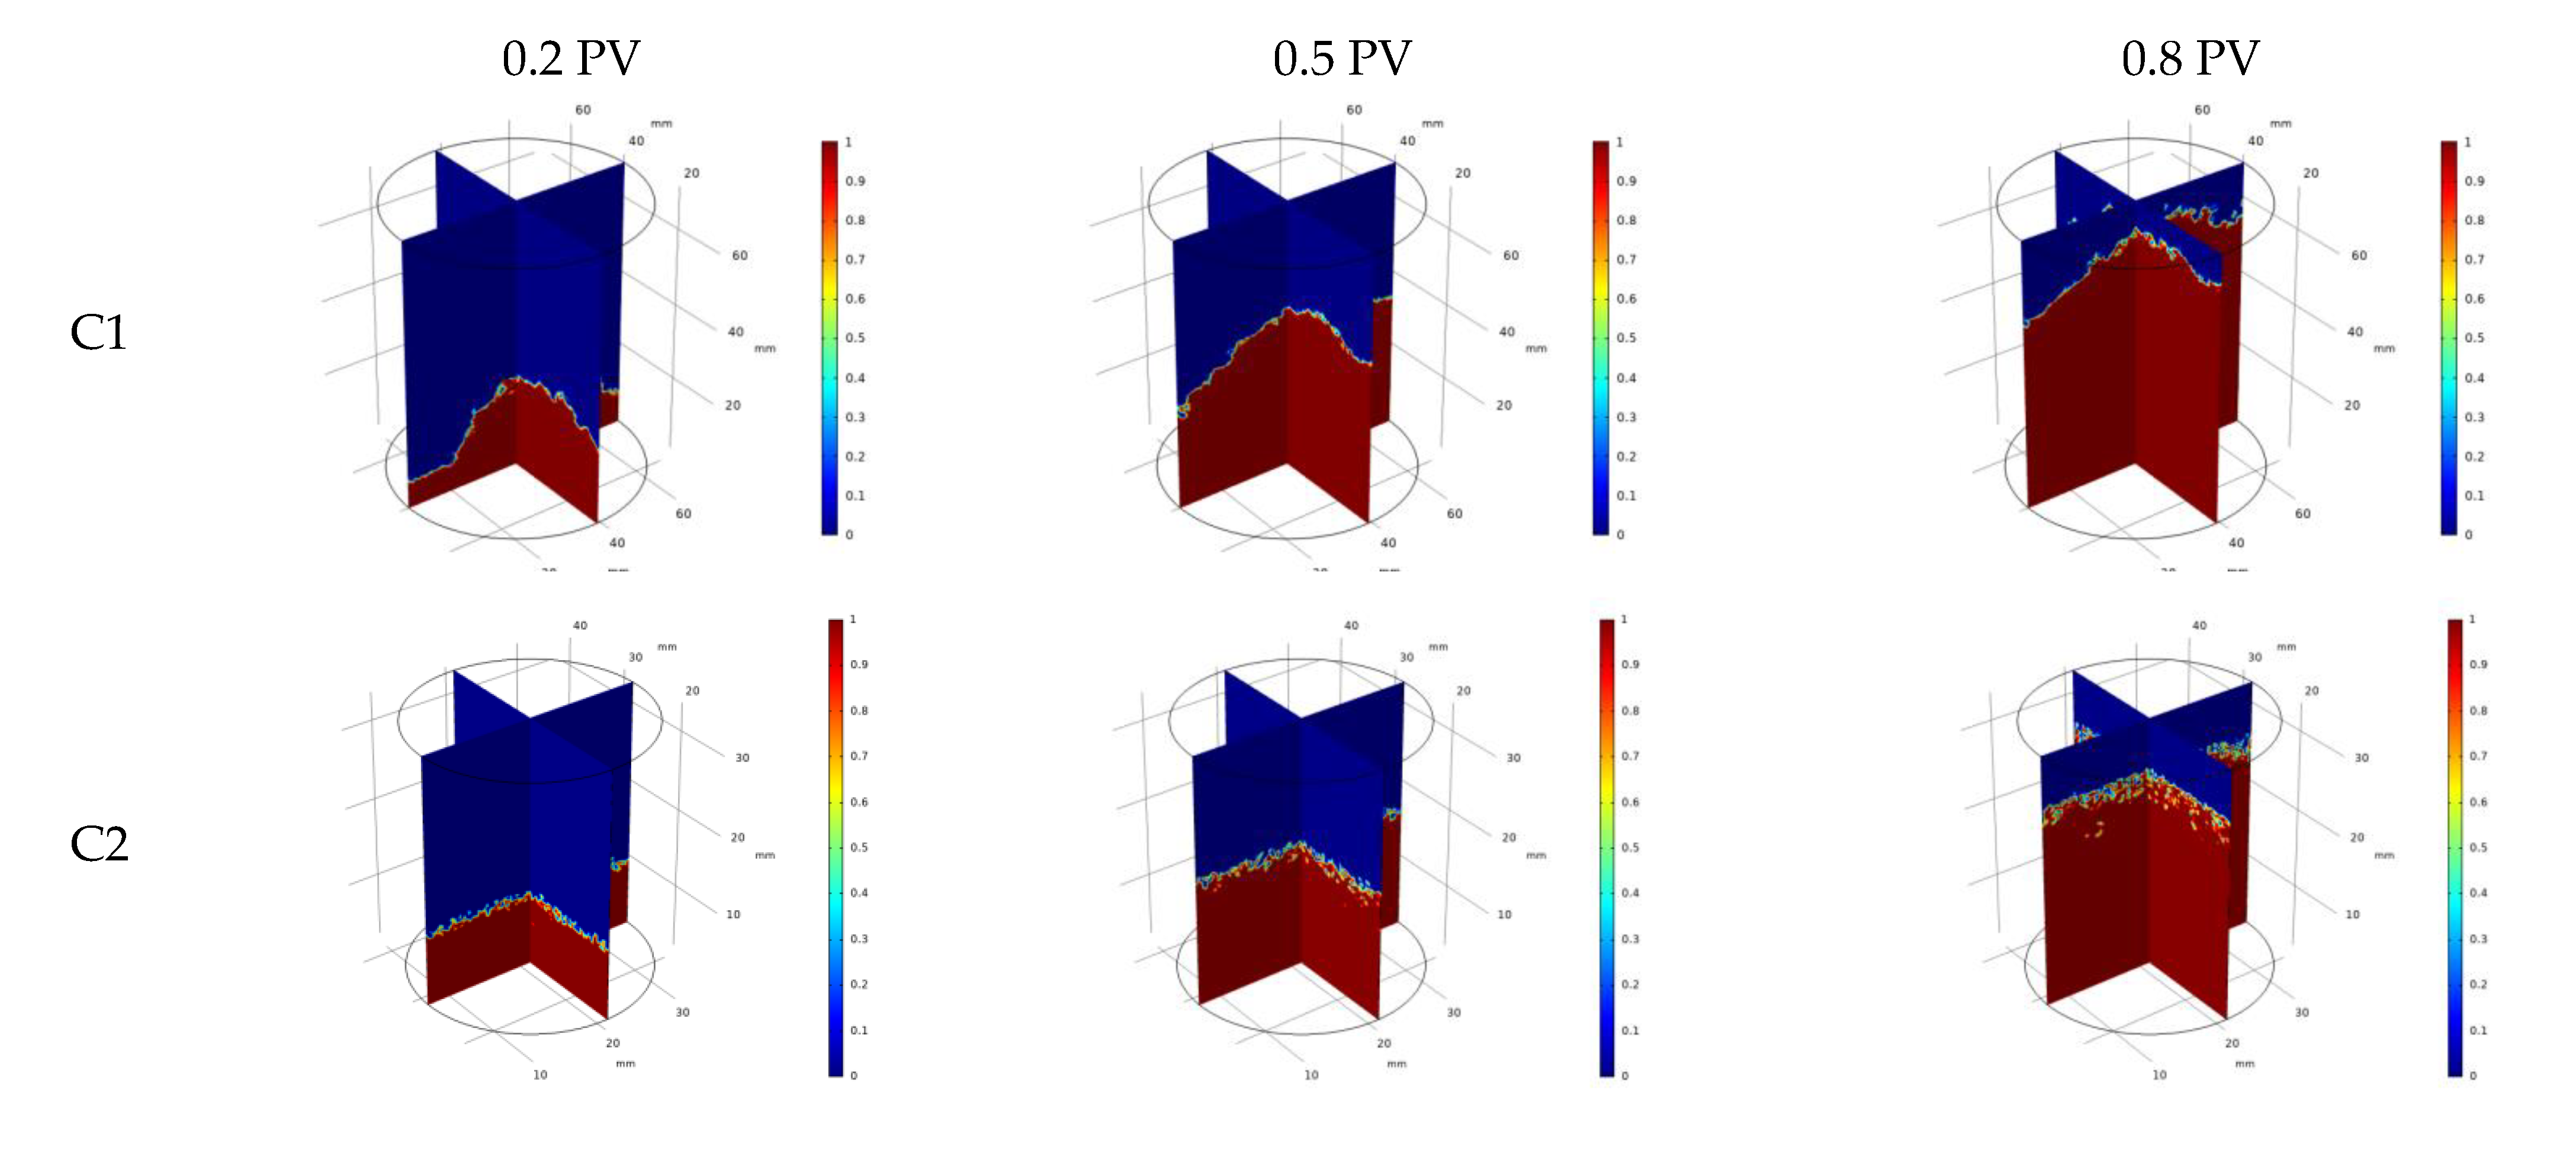
(3)
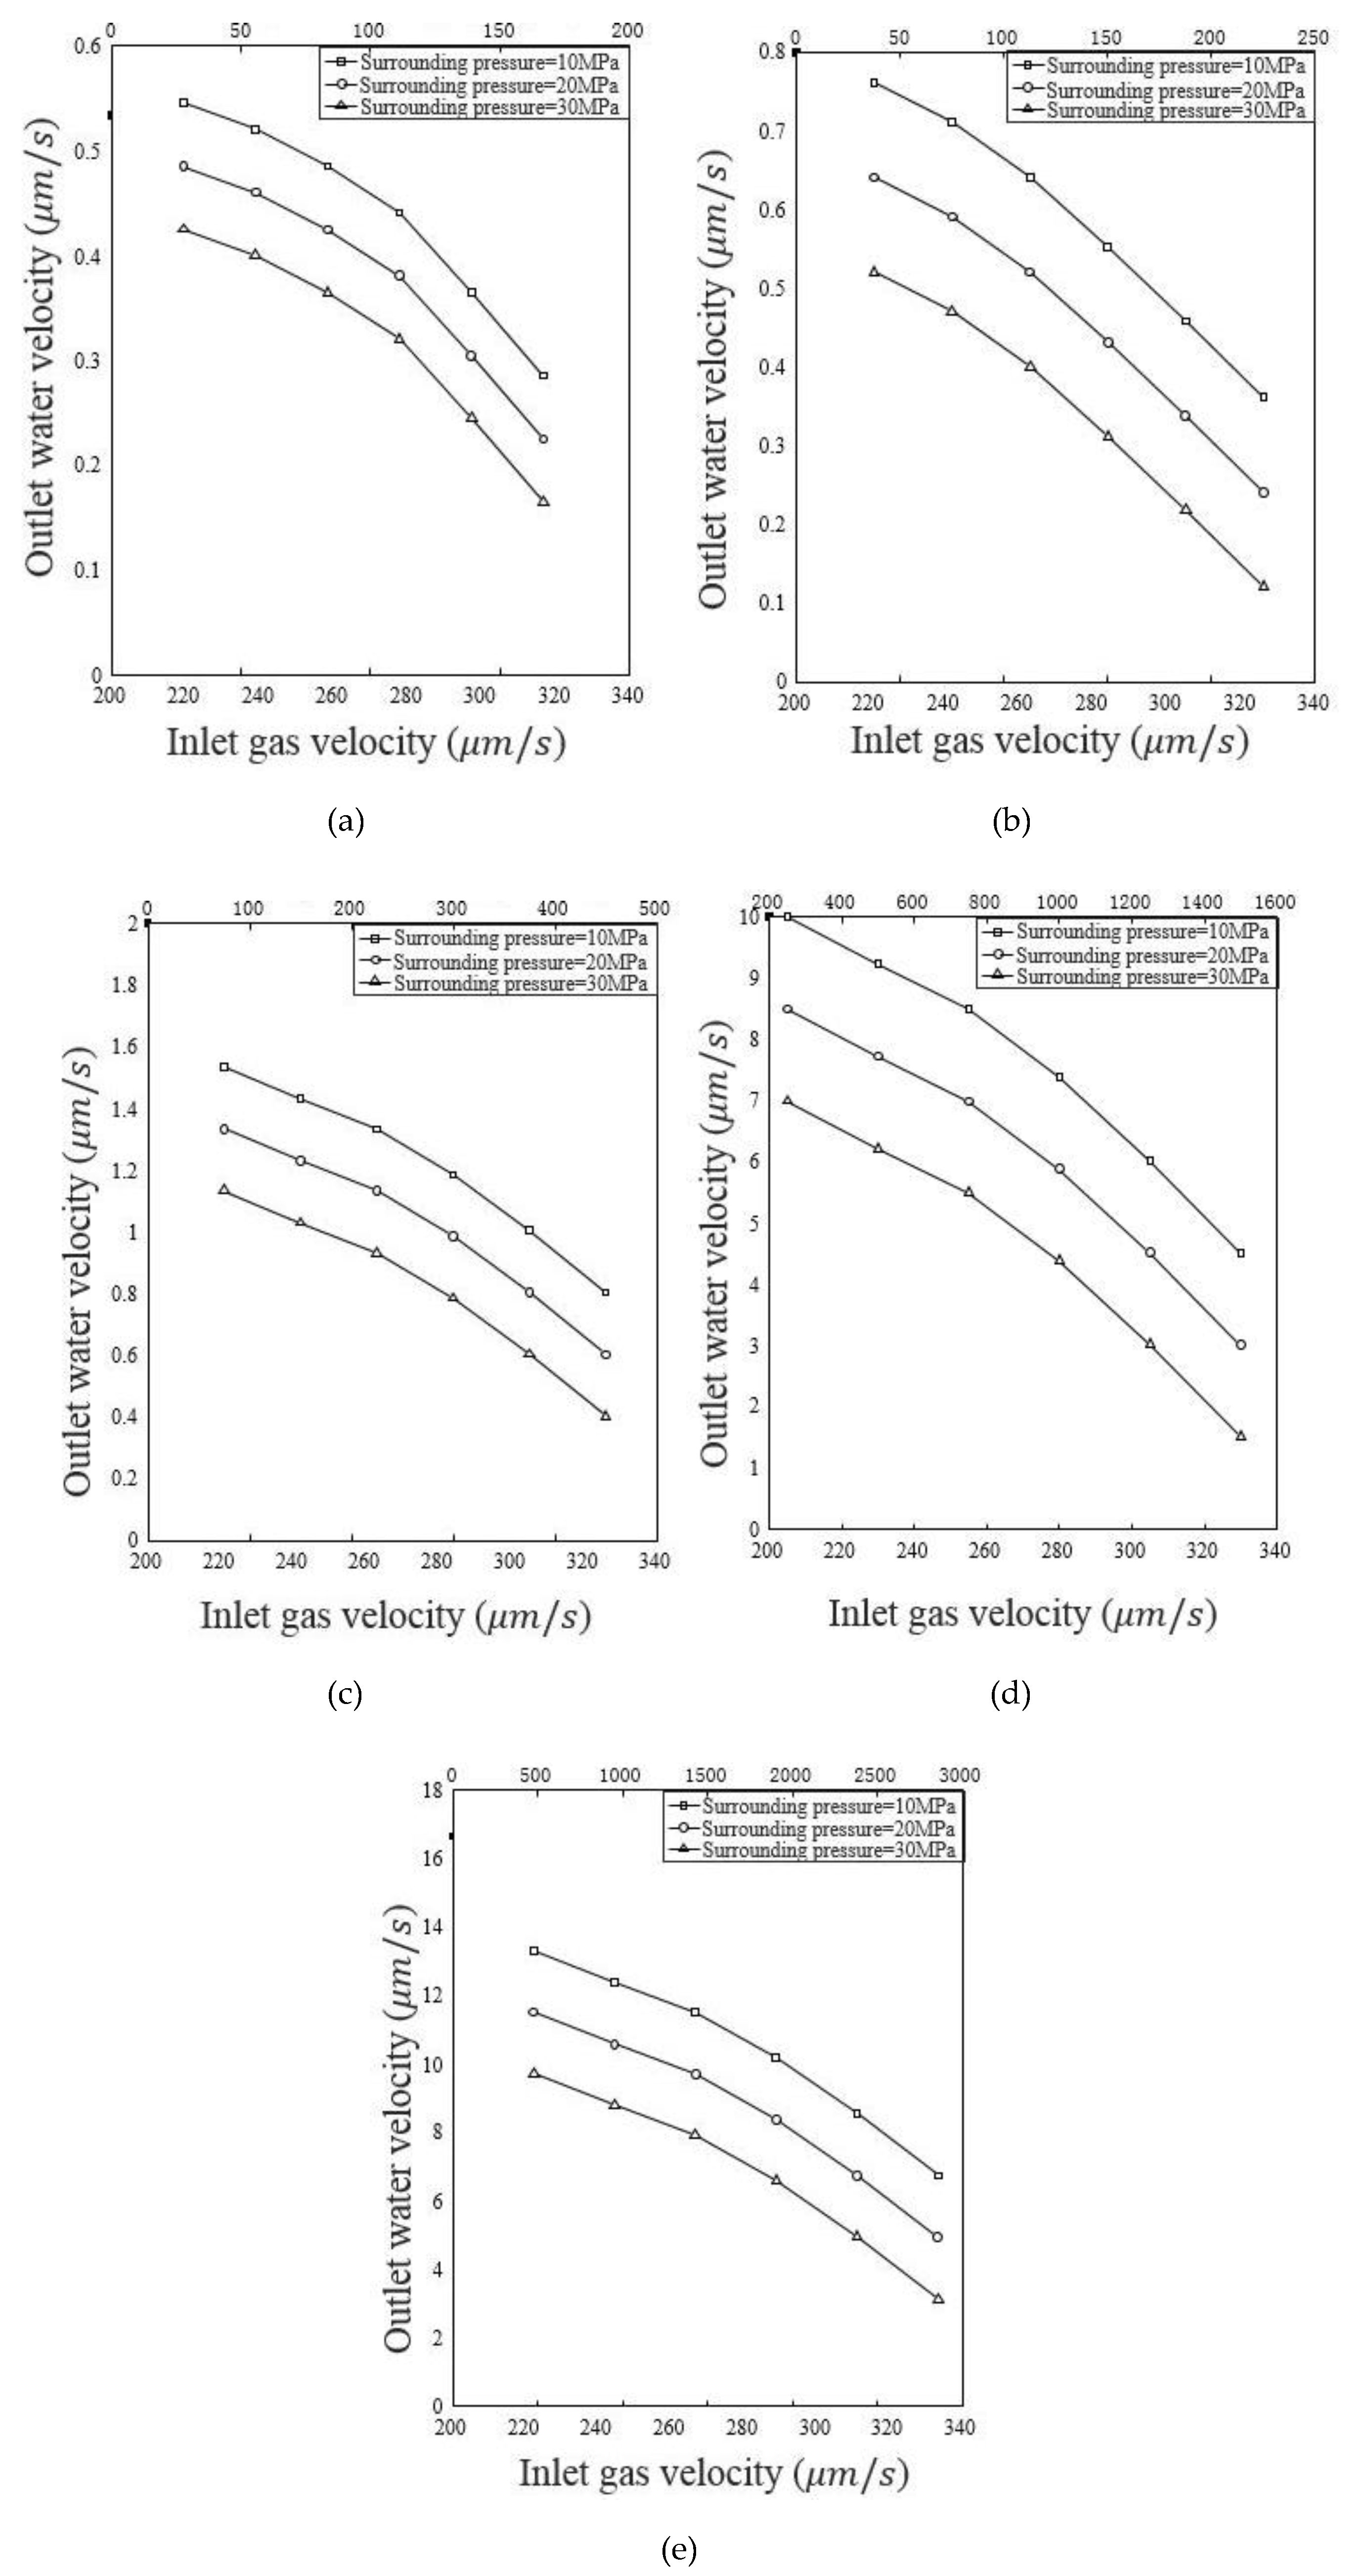
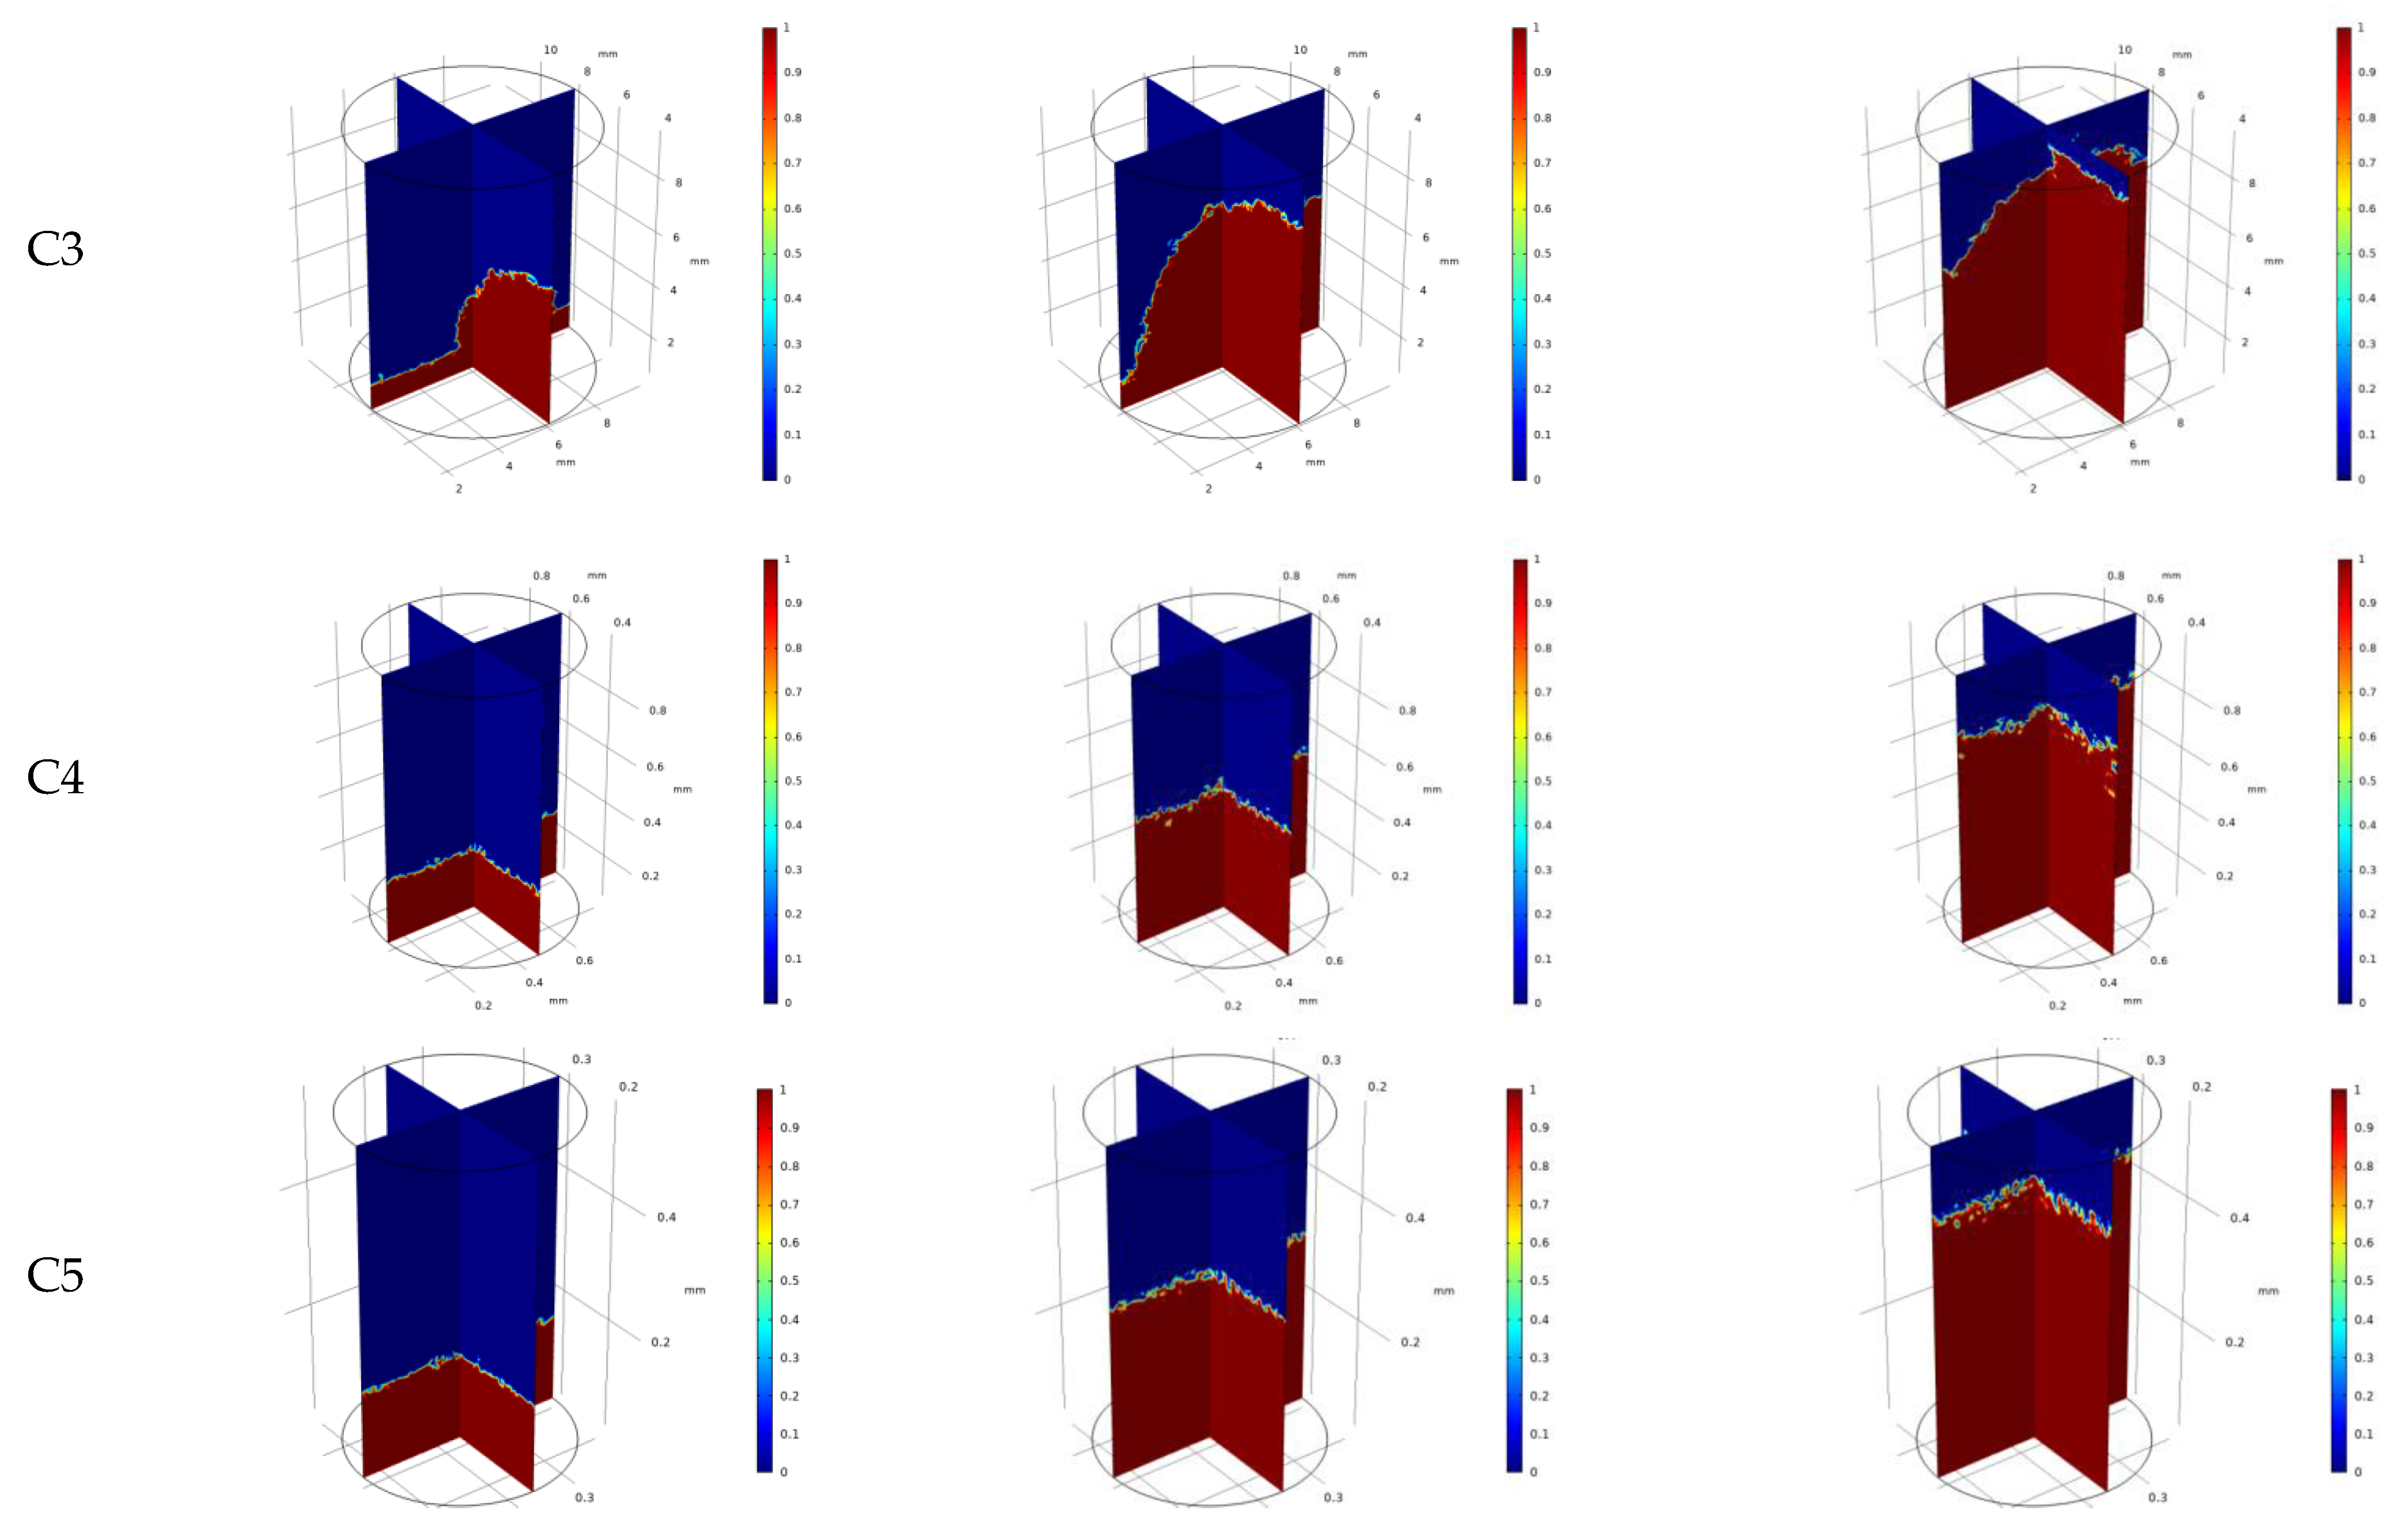
The simulation of gas-water two-phase flow in strongly heterogeneous multiple media is carried out based on the digital image model. The variation law of the two-phase outlet flow velocity with the inlet gas pressure and the motion law of the two-phase interface of carbonate rock samples are obtained. Under certain surrounding pressure, the outlet gas velocity is larger than the outlet water velocity. With the increase of the inlet gas pressure, the pore space occupied by the gas phase in the rock becomes larger and larger. With the increase of the surrounding pressure, the velocities of both outlet gas and water decrease. As the sample size decreases, both outlet gas and water velocities increase. The injected gas can flow faster toward the outlet due to the influence of the pores, vugs, and fractures, causing a nonlinearity in the velocity of the displacement front.

Author Contributions

Conceptualization, Y.H. and M.W.; methodology, J.W. and T.L.; software, J.W.; validation, T.L. and W.G.; investigation, J.W. and T.L.; resources, T.L. and D.H.; data curation, T.L. and D.H.; writing—original draft preparation, J.W. and T.L.; writing—review and editing, W.Z. and M.W.; supervision, M.W. All authors have read and agreed to the published version of the manuscript.

Funding

This research was funded by the National Key Research and Development Program of China (2019YFA0708704), and the NSF grant of China (No. U1837602).

Conflicts of Interest

The authors declare no conflict of interest.

Appendix A

Appendix A.1. Mathematical Model of Flow–Solid Coupling in Pore–Vug–Fracture Structure

In this paper, although the nonuniform distribution of the mechanical parameters of the rock material is considered, it is assumed that they satisfy the theory of elasticity, and the deformation satisfies the following static equilibrium equation for individual mineral particles [36]
G u i , j j + G 1 2 ν u j , j i α p , i + F i = 0
where G denotes the shear modulus, ui (i = x, y, z) denotes the displacement, Fi denotes the i-directional body force component, p is the gas pressure, and α is the effective pressure coefficient (Biot coefficient).
Based on the continuous medium assumption, the flow equation is considered an equivalent continuous model when deriving it, and different nodes and unit locations in the model are assigned different permeability to distinguish between pores, fractures, cavities, and matrices. Based on the mass conservation law, the continuity equation of gas seepage (mass conservation equation) can be expressed as
t ϕ ρ g + ρ g q g = Q s
where ϕ is the porosity, ρ g is the gas density, q g is the Darcy velocity, and Q s is the sink term.
Assuming that the gas satisfies the ideal gas law and the temperature keeps constant, the gas density can be expressed as
ρ g = p p a ρ g a
where p is the gas pressure and p a and ρ g a are the gas pressure and density under the standard conditions.
Assuming that the gas flow process conforms to Darcy’s law, and also assuming that the gravitational effect is relatively small and can be neglected, Darcy’s velocity can be expressed as
q g = k μ p
where k is the permeability and μ is the dynamic viscosity coefficient of the gas. Bringing Equations (A3) and (A4) into Equation (A2), we get.
ϕ p t k μ p p = p a ρ g a Q s
During the flow process, the deformation of the rock causes a change in porosity. The change in porosity can be defined as [37].
ϕ = ϕ 0 + ε v
where ϕ0 is the initial porosity and εv is the volume strain. This equation means that the decrease/increase in porosity is caused by the overall contraction/expansion of the rock. Furthermore, the change in porosity causes a change in permeability, which is related to [38].
k = k 0 ϕ ϕ 0 3
where k0 is the initial permeability.

Appendix A.2. Gas–Water Two-Phase Fluid-Solid Coupling Mathematical Model

Appendix A.2.1. Force Balance Equation

In the coupled model, all relevant variables are averaged over a representative element volume, and the equilibrium equation is expressed as
σ i j , j + F i = 0
where σij is the stress tensor (i, j = x, y, z) and Fi is the body force. The strain–displacement relationship is expressed as
ε i j = 1 2 ( u i , j + u j , i )
where εij is the strain tensor and ui is the displacement vector. The average pressure of the model can be estimated as the weighted average pressure of oil and water, defined as
p a v = S w p w + S g p g
where Sw and Sg are water saturation and natural gas saturation, respectively; pw and pg are water pressure and natural gas pressure, respectively. The effective stress tensor is expressed as [39]
s i j = s i j + a ( S w p w + S g p g ) d i j
where δ is the Kronecker symbol; α is the Biot coefficient. The two-phase fluid–solid coupling equilibrium equation can be rewritten in the form of the Navier equation
G u i , j j + G 1 2 ν u j , j i a S w , i p w a S w p w , i a S g , i p g a S g p g , i + F i = 0

Appendix A.2.2. Gas–Water Two-Phase Flow Equation

The masses of water and natural gas are described as
m w = S w f r w
m g = S g ϕ ρ g
where mw and mg are the masses of water and natural gas, respectively; ϕ is the rock porosity; ρw and ρg are the densities of water and natural gas, respectively. Sw and Sg are the saturation of water and natural gas, respectively. Based on the mass balance equation for a single-phase fluid, the mass conservation equation for the water–gas system is expressed as [40]
m w t + ( ρ q w ) = Q s w
m g t + ( ρ q g ) = Q s g
An extension of the single-phase Darcy’s law leads to the two-phase Darcy’s law [41].
q w = k k r w μ w ( p w ρ w g )
q g = k k r g μ g ( p g ρ g g )
where k is the absolute permeability of the rock; krw and krg are the relative permeabilities of water and natural gas, respectively; g is the gravitational acceleration vector. Relative permeability is a key parameter to describe the relative flow patterns of multiphase fluids in porous media. Usually, people use the empirical relationship between relative permeability and the wetting saturation for model solving [39]
k r w = S w S w i 1 S w i m 1
k r g = k m a x p 1 S w 1 S w i m 2
S w i S w 1
where Swi is the residual water saturation (0.05); kmaxp is the maximum oil phase saturation (0.95); m1 and m2 are the model parameters, taken as 0.85 and 4.67, respectively.
At each time step, the sum of water saturation and oil saturation should be 1, so the auxiliary equation for saturation is shown below.
S w + S g = 1
When considering the interfacial tension between the aqueous and oil phases, capillary pressure is defined as the difference in pressure between the two fluid phases.
p c = p g p w
In this paper, the conventional capillary pressure model (VG model) proposed by van Genuchten is used to relate the aqueous phase saturation to the capillary pressure [42].
S w e = 1 + ( α 0 h c ) N M
where hc is the head of capillary pressure (hc = pc/ρwg), N and M are model parameters, and Swe is the effective saturation of the aqueous phase, defined as
S w e = S w S w i 1 S w i

References

  1. Pal, S.; Mushtaq, M.; Banat, F.; Al Sumaiti, A.M. Review of surfactant-assisted chemical enhanced oil recovery for carbonate reservoirs: Challenges and future perspectives. Pet. Sci. 2018, 15, 77–102. [Google Scholar] [CrossRef] [Green Version]
  2. Xu, X.; Saeedi, A.; Liu, K. An experimental study of combined foam/surfactant polymer (SP) flooding for carbone dioxide-enhanced oil recovery (CO2-EOR). J. Pet. Sci. Eng. 2017, 149, 603–611. [Google Scholar] [CrossRef] [Green Version]
  3. Li, Y.; Kang, Z.; Xue, Z.; Zheng, S. Theories and practices of carbonate reservoirs development in China. Pet. Explor. Dev. 2018, 45, 669–678. [Google Scholar] [CrossRef]
  4. Lucia, F.J.; Kerans, C.; Jennings, J.W. Carbonate reservoir characterization. J. Pet. Technol. 2003, 55, 70–72. [Google Scholar] [CrossRef]
  5. Camacho-Velazquez, R.; Vasquez-Cruz, M.; Castrejon-Aivar, R.; Arana-Ortiz, V. Pressure-transient and decline-curve behavior in naturally fractured vuggy carbonate reservoirs. SPE Reserv. Eval. Eng. 2005, 8, 95–112. [Google Scholar] [CrossRef]
  6. Guo, J.-C.; Nie, R.-S.; Jia, Y.-L. Dual permeability flow behavior for modeling horizontal well production in fractured-vuggy carbonate reservoirs. J. Hydrol. 2012, 464, 281–293. [Google Scholar] [CrossRef]
  7. Al-Bazzaz, W.H.; Al-Mehanna, Y. Porosity, permeability, and MHR calculations using SEM and thin-section images for characterizing complex Mauddud-Burgan carbonate reservoir. In Proceedings of the Asia Pacific Oil and Gas Conference and Exhibition, Jacarta, Indonesia, 30 October–1 November 2007. [Google Scholar]
  8. Zhang, K.; Pang, X.; Zhao, Z.; Shao, X.; Zhang, X.; Li, W.; Wang, K. Pore structure and fractal analysis of Lower Carboniferous carbonate reservoirs in the Marsel area, Chu-Sarysu basin. Mar. Pet. Geol. 2018, 93, 451–467. [Google Scholar] [CrossRef]
  9. Shi, Z.; Zhou, T.; Wang, H.; Sun, S. Depositional structures and their reservoir characteristics in the Wufeng-Longmaxi Shale in Southern Sichuan Basin, China. Energies 2022, 15, 1618. [Google Scholar] [CrossRef]
  10. He, J.; Deng, H.; Ma, R.; Wang, R.; Wang, Y.; Li, A. Reservoir characteristics of the Lower Jurassic lacustrine shale in the Eastern Sichuan Basin and its effect on gas properties: An integrated approach. Energies 2020, 13, 4495. [Google Scholar] [CrossRef]
  11. Ioannidis, M.A.; Chatzis, I. A dual-network model of pore structure for vuggy carbonates. In Proceedings of the SCA2000-09, International Symposium of the Society of Core Analysts, Abu Dhabi, United Arab Emirates, 18–22 October 2000. [Google Scholar]
  12. Békri, S.; Nardi, C.; Vizika, O. Effect of wettability on the petrophysical parameters of vuggy carbonates: Network modeling investigation. In Proceedings of the International Symposium of the Society of Core Analysts held in Abu Dhabi, United Arab Emirates, 5–9 October 2004. [Google Scholar]
  13. Xia, C.; Teng, Q.; Qin, L.; Wu, X.; He, X. Crack recognition of 3D rock images. Comput. Eng. Appl. 2018, 54, 186–191. [Google Scholar]
  14. Yan, Y.; Li, L.; Xu, W.; Chang, C.; Deng, H.; Yang, L. Application of 3D digital core flow simulation technique in the study of gas flow in fractured-vuggy gas reservoir in Sichuan Basin. Nat. Gas Geosci. 2017, 28, 1425–1432. [Google Scholar]
  15. Gao, S.; Hu, Z.; An, W.; Liu, H.; Li, H. Distribution characteristics of dolomite reservoir pores and caves of Longwangmiao Fm gas reservoirs in the Sichuan Basin. Nat. Gas Ind. 2014, 34, 103–109. [Google Scholar]
  16. Wei, C.; Tian, C.; Zheng, J.; Cai, K.; Du, D.; Song, B.; Hu, Y. Heterogeneity characteristics of carbonate reservoirs: A case study using whole core data. In Proceedings of the SPE Reservoir Characterisation and Simulation Conference and Exhibition, Abu Dhabi, United Arab Emirates, 14–16 September 2015. [Google Scholar]
  17. Bruce, G.H.; Peaceman, D.W.; Rachford, H.H.; Rice, J.D. Calculations of unsteady-state gas flow through porous media. J. Pet. Technol. 1953, 5, 79–92. [Google Scholar] [CrossRef]
  18. Warren, J.E.; Root, P.J. The behavior of naturally fractured reservoirs. Soc. Pet. Eng. J. 1963, 3, 245–255. [Google Scholar] [CrossRef] [Green Version]
  19. Long JC, S.; Gilmour, P.; Witherspoon, P.A. A model for steady fluid flow in random three-dimensional networks of disc-shaped fractures. Water Resour. Res. 1985, 21, 1105–1115. [Google Scholar] [CrossRef] [Green Version]
  20. Kang, Z. New method of coupling numerical simulation and application to Fracture-Cavern carbonate reservoir. Xinjiang Pet. Geol. 2010, 31, 514. [Google Scholar]
  21. Muralidharan, V.; Chakravarthy, D.; Putra, E.; Schechter, D.S. Investigating fracture aperture distributions under various stress conditions using X-ray CT scanner. In Proceedings of the Canadian International Petroleum Conference, Calgary, AB, Canada, 8–10 June 2004. [Google Scholar]
  22. Zhang, F.; An, M.; Yan, B.; Wang, Y.; Han, Y. A novel hydro-mechanical coupled analysis for the fractured vuggy carbonate reservoirs. Comput. Geotech. 2019, 106, 68–82. [Google Scholar] [CrossRef]
  23. Hawez, H.K.; Sanaee, R.; Faisal, N.H. Numerical modeling for coupled hydro-mechanical processes in fractured-vuggy carbonate reservoirs. J. China Univ. Pet. 2020, 44, 96–105. [Google Scholar]
  24. Wang, M.; Cheung, S.W.; Chung, E.T.; Vasilyeva, M.; Wang, Y. Generalized multiscale multicontinuum model for fractured vuggy carbonate reservoirs. J. Comput. Appl. Math. 2020, 366, 112370. [Google Scholar] [CrossRef] [Green Version]
  25. Yan, X.; Huang, Z.; Yao, J.; Zhang, Z.; Liu, P.; Li, Y.; Fan, D. Numerical simulation of hydro-mechanical coupling in fractured vuggy porous media using the equivalent continuum model and embedded discrete fracture model. Adv. Water Resour. 2019, 126, 137–154. [Google Scholar] [CrossRef]
  26. Jiang, Z.; Van Dijke MI, J.; Sorbie, K.S.; Couples, G.D. Representation of multiscale heterogeneity via multiscale pore networks. Water Resour. Res. 2013, 49, 5437–5449. [Google Scholar] [CrossRef]
  27. Liu, L.; Huang, Z.; Yao, J.; Lei, Q.; Di, Y.; Wu, Y.S.; Zhang, K.; Cui, S. Simulating two-phase flow and geomechanical deformation in fractured karst reservoirs based on a coupled hydro-mechanical model. Int. J. Rock Mech. Min. Sci. 2021, 137, 104543. [Google Scholar] [CrossRef]
  28. Zhang, J.; Zhou, G.; Zhang, G.; Li, G.; Wang, H. Geological characteristics and exploration orientation of Mid-Permian natural gas in the Sichuan Basin. Nat. Gas Ind. 2018, 38, 10–20. [Google Scholar]
  29. Renard, F.; Kandula, N.; McBeck, J.; Cordonnier, B. Creep burst coincident with faulting in marble observed in 4-D synchrotron X-ray imaging triaxial compression experiments. J. Geophys. Res. Solid Earth 2020, 125, e2020JB020354. [Google Scholar] [CrossRef]
  30. Yang, Y.; Liu, Z.; Yao, J.; Wang, C.; Sun, H.; Zhang, L.; Liu, L.; Zhao, J.; An, S.; Zhang, W.; et al. Pore space characterization method of shale matrix formation based on superposed digital rock and pore-network model. Sci. Sin. Technol. 2018, 48, 488–498. [Google Scholar] [CrossRef]
  31. Matthäi, S.K.; Belayneh, M. Fluid flow partitioning between fractures and a permeable rock matrix. Geophys. Res. Lett. 2004, 31. [Google Scholar] [CrossRef]
  32. Taud, H.; Martinez-Angeles, R.; Parrot, J.F.; Hernandez-Escobedo, L. Porosity estimation method by X-ray computed tomography. J. Pet. Sci. Eng. 2005, 47, 209–217. [Google Scholar] [CrossRef]
  33. Zhu, W.C.; Liu, J.; Elsworth, D.; Polak, A.; Grader, A.; Sheng, J.C.; Liu, J.X. Tracer transport in a fractured chalk: X-ray CT characterization and digital-image-based (DIB) simulation. Transp. Porous Media 2007, 70, 25–42. [Google Scholar] [CrossRef]
  34. Bourbie, T.; Zinszner, B. Hydraulic and acoustic properties as a function of porosity in Fontainebleau sandstone. J. Geophys. Res. Solid Earth 1985, 90, 11524–11532. [Google Scholar] [CrossRef]
  35. Revil, A.; Kessouri, P.; Torres-Verdín, C. Electrical conductivity, induced polarization, and permeability of the Fontainebleau sandstone. Geophysics 2014, 79, D301–D318. [Google Scholar] [CrossRef] [Green Version]
  36. Zhou, J.; Wei, J.; Yang, T.; Zhu, W.; Li, L.; Zhang, P. Damage analysis of rock mass coupling joints, water and microseismicity. Tunn. Undergr. Sp. Technol. 2018, 71, 366–381. [Google Scholar] [CrossRef]
  37. Tan, X.; Konietzky, H.; Frühwirt, T. Experimental and numerical study on evolution of Biot’s coefficient during failure process for brittle rocks. Rock Mech. Rock Eng. 2015, 48, 1289–1296. [Google Scholar] [CrossRef]
  38. Zhu, W.C.; Wei, C.H.; Li, S.; Wei, J.; Zhang, M.S. Numerical modeling on destress blasting in coal seam for enhancing gas drainage. Int. J. Rock Mech. Min. Sci. 2013, 59, 179–190. [Google Scholar] [CrossRef]
  39. Yu, Y.; Zhu, W.; Li, L.; Wei, C.; Yan, B.; Li, S. Multi-fracture interactions during two-phase flow of oil and water in deformable tight sandstone oil reservoirs. J. Rock Mech. Geotech. Eng. 2020, 12, 821–849. [Google Scholar] [CrossRef]
  40. Chen, S.; Yang, T.; Ranjith, P.G.; Wei, C. Mechanism of the two-phase flow model for water and gas based on adsorption and desorption in fractured coal and rock. Rock Mech. Rock Eng. 2017, 50, 571–586. [Google Scholar] [CrossRef]
  41. Huang, Z.-Q.; Yao, J.; Wang, Y.-Y. An efficient numerical model for immiscible two-phase flow in fractured karst reservoirs. Commun. Comput. Phys. 2013, 13, 540–558. [Google Scholar] [CrossRef] [Green Version]
  42. Van Genuchten, M.T. A closed-form equation for predicting the hydraulic conductivity of unsaturated soils. Soil Sci. Soc. Am. J. 1980, 44, 892–898. [Google Scholar] [CrossRef] [Green Version]
Figure 1. Three solution strategies for flow problems in porous media. (a) Pore–scale simulation based on N-S equation; (b) Continuous scale simulation based on Darcy’s law; (c) Hybrid simulations.
Energies 15 03748 g001
Figure 2. Photos of full-diameter cores and mineral composition.
Energies 15 03748 g002
Figure 3. Basic physical properties of full diameter cores. The red line is the fitting curve of the Weibull distribution.
Energies 15 03748 g003
Figure 4. Relationship between permeability and porosity. The blue circles are experimental data.
Energies 15 03748 g004
Figure 5. Classification criteria for pore, fracture, and cavity.
Energies 15 03748 g005
Figure 6. Distribution characteristics of pore–vug–fracture structures of cores at different scales.
Energies 15 03748 g006aEnergies 15 03748 g006b
Figure 7. Spatial distribution of pores and cavities in representative cores at different scales (red indicates pores, blue indicates fractures, green indicates cavities).
Energies 15 03748 g007
Figure 8. Statistics on the number of core types at different scales.
Energies 15 03748 g008
Figure 9. Schematic plot of the numerical model. (a) k = 0.51 mD; (b) k = 0.25 mD; (c) k = 0.35 mD.
Energies 15 03748 g009
Figure 10. CT section grayscale map with porosity conversion. (a) Grayscale image; (b) Porosity; (c) Permeability.
Energies 15 03748 g010
Figure 11. Pore–vug–fracture structure in a numerical model. (a) Sample C1; (b) Sample C2; (c) Sample C3; (d) Sample C4; (e) Sample C5.
Energies 15 03748 g011
Figure 12. Velocity distribution (unit: m/s). (a) Sample C1; (b) Sample C2; (c) Sample C3; (d) Sample C4; (e) Sample C5.
Energies 15 03748 g012
Figure 13. Pore pressure distribution diagram (unit: Pa). (a) Sample C1; (b) Sample C2; (c) Sample C3; (d) Sample C4; (e) Sample C5.
Energies 15 03748 g013
Figure 14. Variation curve of permeability with pore pressure and surrounding pressure (a) Sample C1, (b) Sample C2, (c) Sample C3, (d) Sample C4.
Energies 15 03748 g014
Figure 15. Outlet gas velocity with an inlet gas pressure (pw = 200 kPa) for different samples, (a) Sample C1, (b) Sample C2, (c) Sample C3, (d) Sample C4, (e) Sample C5.
Energies 15 03748 g015
Figure 16. Outlet gas velocity with an inlet gas pressure (pw = pg), (a) Sample C1, (b) Sample C2.
Energies 15 03748 g016
Figure 17. Variation of phase distribution with injected volume (blue for water phase, red for natural gas phase, pc = 10 MPa, pg = 325 kP, pw = 200 kPa).
Energies 15 03748 g017aEnergies 15 03748 g017b
Table 1. Core type classification.
TypeStorage SpaceVug Volume
Proportion
Fracture Volume
Proportion
Porosity, %
PorePore<20%<10%0.11~0.5
Pore–FracturePore, Fracture<20%≥10%0.3~0.78
Pore–VugPore, Vug≥20%<10%0.14~10
Pore–Fracture–VugPores, Fracture, Vug≥20%≥10%0.51~5.19
Table 2. Parameters of the numerical model.
ParameterValueUnit
Matrix modulus of elasticity60GPa
Matrix density2695kg/m3
Poisson’s ratio0.33-
Biot coefficient0.9-
Natural gas kinetic viscosity factor under standard conditions1.38 × 10−5Pa⋅s
Natural gas density under standard conditions0.72kg/m3
Table 3. Comparison between simulated results of core permeability and experimental results.
SamplePermeability
(Experiment), mD
Permeability
(Simulation), mD
Relative
Discrepancy, %
C10.670.652.99
C20.540.523.70
C30.340.325.88
C40.280.273.57
C50.220.220
Table 4. Numerical model parameters.
ParameterValueUnit
Matrix modulus of elasticity60GPa
Matrix density2695kg/m3
Poisson’s ratio0.33-
Biot coefficient0.9-
Water kinetic viscosity factor1 × 10−3Pa s
Water density1000kg/m³
Natural gas kinetic viscosity factor under standard conditions1.38 × 10−5Pa s
Natural gas density under standard conditions0.72kg/m3
Publisher’s Note: MDPI stays neutral with regard to jurisdictional claims in published maps and institutional affiliations.

