1. Introduction
According to European Commission regulation number 244/2009 of 18 March 2009 implementing directive 2005/32/EC of the European Parliament and of the Council with regard to eco-design requirements for non-directional household lamps, traditional incandescent lamps had to be replaced by other light sources characterized by lower energy consumption during normal operation mode. From an energy consumption point of view, the above-mentioned regulations will bring about a decrease in global energy demand.
Since 1 September 2016, energy-intensive incandescent light bulbs for household illumination purpose are no longer available in the market. Consequently, as light sources meeting the aforementioned regulation, energy-efficient substitutes such as compact fluorescent lamps (CFL), LED lamps or halogen lamps may be used.
From the point of view of the global reduction in energy consumption and environmental protection, the adopted course of action seems to be appropriate. On the other hand, the increasing use of energy-efficient light sources has affected the quality of energy, which is also subjected to the specific regulations and standards of the European Union.
Because of the specific construction of these types of light sources, consisting of, in the case of CFL lamps, a glass bulb with appropriate electrodes, or LED diodes in the case of LED light bulbs, additional electronic circuits are installed. In the case of CFL lamps, which are currently used mainly in horticulture or gardening and in the lighting of large areas, this type of electronic circuit is required to initiate luminescent material.
In present-day domestic use, LED lamps are mainly employed. The power electronic components that are part of these light bulbs are designed to stabilize the voltage or current supplying the LED diodes so as to optimize their operating conditions. As a result, desired luminous efficiency and lifetime are secured. On other hand, the use of such power electronic circuits affects the supplied voltage and current shape, causing their distortion.
Taking into account the popularity of LED light sources, large numbers of transients are expected in a power network where LED drivers are installed. LED lamps in the form of “light bulbs” or popular in the market “lighting stripes”, for appropriate operation, require dedicated drivers. Depending on the design, the aforementioned drivers comprise input filters, rectifiers, inverters or other semiconductive elements operating at increased frequency [
1,
2]. Therefore, because of the highly non-linear current and voltage characteristic of such power electronic circuits, higher harmonics are present in low-voltage (LV) power networks containing LED lights [
3,
4,
5]. Its negative impact on the power quality in the supply network has also been confirmed [
6,
7,
8,
9,
10].
The higher harmonics content in voltage and current waveforms of the distribution system has a negative impact on components. This may be a source of additional power losses in electrical devices or their incorrect operation. Its destructive influence is noticed on passive elements such as cables [
11] or capacitors, and on active devices as well, e.g., current interrupters [
12,
13,
14], which may behave unpredictably. In extreme cases, an increased level of generated losses may be a source of premature aging of relay components or decreased effectiveness of current interruption.
In this connection, it is advisable to estimate newly designed driver circuits’ operation conditions and their influence on electric energy quality. This can be realized by means of large-scale laboratory tests preceded by dedicated simulations using modern specialized software tools.
Over the years, the utilized lamp driver solutions have changed [
15]. In today’s market, new designs of specialized lamps for industrial and domestic use are available [
16]. As a result, simple circuits based on rectifier and capacitors have been replaced by specific ICs that provide desired operating conditions for best LED operation [
17,
18,
19].
Simultaneously, simulation tools have been significantly improved and are characterized by higher operation precision. Compared to the previously used tools, they have the ability to reproduce real phenomena with higher accuracy. Hence, it seems to be reasonable to present new simulation results reflecting changes in the construction of driving circuits that nowadays mainly contain microcontrollers (μC).
Analyses available in current literature are mainly focused on operation studies of particular complete constructions of light bulbs, where fixed numbers of LEDs are supplied by dedicated drivers that are integral parts of the light bulbs [
20,
21]. The variable factor in this case is the number of bulbs connected to the power network. In contrast, this paper contains a comparative simulation analysis of two different driver designs operating within different principles of operation. Moreover, each of the tested universal drivers was loaded with a varied number of LEDs.
Typically available in the existing literature, simulations were focused on the presentation of general tendencies in supply current distortion and on the estimation of introduced harmonics content [
22,
23,
24]. Indeed, the presently used drivers require careful and inclusive analysis, reproducing phenomena that previously have been neglected.
For example, the presence of low-energy and HF surges was omitted in the executed simulations, while research was mainly focused on approximation of the supply voltage and current waveform shape and introduced harmonic content [
9,
25,
26,
27,
28]. Moreover, the results did not include the additional interferences that come about due to the operation of power electronic components, while the elaborated models were based on simplified circuits.
In addition, the models that were advanced did not take into account specific parameters of the used electronic components (e.g., capacitor leakage currents or transistor switching surges). As a result, simulation results were based on relatively large simplifications.
In comparison to surveys available in the literature, the simulation results presented in this study are characterized by high precision and high similarity coefficients of the recorded and simulated waveforms.
2. Simulation Models Development
In the framework of the study, two diverse types of LED drivers were analyzed. As a result, different harmonic content in the current was expected. The first formerly popular and still-used driver works on the principle of supply voltage stabilization. The second one is based on a current stabilization method that contains a dedicated AL8806 μC.
The first controller is built upon a Zener diode and consists of two blocks: a rectifier and a voltage stabilization circuit. The applied full-wave rectifier is fed via an external AC transformer and consists of a Graetz bridge. The rectified input voltage is then smoothed using a capacitor (C1) and a voltage divider implemented through a resistor (R1) and a capacitor (C2). Voltage is applied to a 12 V Zener diode, plugged between the base of the transistor (Q1) working in common emitter mode, and the mass. The resistor (R1) limits the current flowing through the Zener diode. Positive voltage is applied to the collector of the transistor, which is then received by the emitter, which is also the output powering the connected LEDs. The collector–emitter current is limited by the Zener diode should voltage exceed 12 V. In this case, voltage will drop below 0.7 V at the emitter–base junction, and clogging of the transistor will occur. When the voltage across the diode decreases, the transistor opens again.
The opening and closing of the transistor generates current pulses, and in order to smooth them out, a smoothing capacitor (C3) is used at the output of the circuit. The capacitor model used in the simulation takes into account leakage phenomena by adding 1 kΩ, a parallel resistance. Resistance values representing remaining capacitances leakage phenomena are presented in the figures, in brackets. As load, various numbers of LEDs of the NSSW008CT-P1 type were used. These are characterized by maximum forward load current 35 mA and power dissipation 123 mW.
Based on a reverse engineering method, the SPACE simulation model (
Figure 1) was elaborated and the results were experimentally verified at the laboratory test stand.
In order to take into account the minor HF energy surges generated by the driver circuit, four additional current sources (I1, I2, I3, I4) were applied. The first (I1) current signal is described by the SPACE function (1):
The amplitude value of the I1 current source was selected experimentally at 14.5 mA RMS. The I2, I3 signal sources are sources of sinusoidal currents with amplitude of 10 mA and frequencies of 5.7 kHz and 6.1 kHz, respectively. The I4 signal is a 5.9 kHz current sinusoidal signal with amplitude of 12 mA.
The second controller is built on the use of an AL8806 IC, the block diagram of which, according to manufacturer specifications, is presented in
Figure 2. The AL8806 IC with additional external elements (
Figure 3) and built-in output open-circuit protection induces stabilization of the load current. According to the manufacturer’s description, the utilized AL8806 integrated circuit is a step-down DC/DC converter especially designed to supply LEDs.
The circuit is able to drive LEDs from a voltage source of 6 V to 36 V. The maximum output current is set via an external resistor. The IC switches at frequencies up to 1 MHz, which allows the use of small size external components and consequently does not need large space for application. Additionally, the IC is equipped with a dimming function that was switched off in this application.
In order to reflect the “noise” signal observed at the recorded current waveform and additional pulsations on the falling edges of the recorded current waveforms, the simulation model contains extra “noise signals” (
Table 1).
The “noise signal” consists of a 10 kHz modulated signal, a 2 kHz modulation signal with a 6 kHz index (I1), six sine wave current sources (I2–I7) and one pulsed current source (I8) with set SPACE parameters: rising time (T
rise), falling time (T
fall) and duration (T
on) at 1 ms and period (T
period) at 3.1 ms (
Table 1).
Additionally, two voltage sources were included (V2, V3). The first is with sine wave and the other is with modulated voltage wave. Frequency and amplitude of the signal pulsation were obtained based on oscilloscopic measurements. When selecting the voltage source parameters, the harmonic distribution obtained during the simulation was taken into account, as well. Preliminary experimental verification of the waveforms obtained by means of simulations without taking into account additional interferences sources indicated underestimation of the calculated factors. Both circuits were energized through a step-down transformer with assumed SPACE model parameters listed in
Table 2.
3. Numerical Simulation
The main purpose of the simulation was to precisely reflect the current waveforms of recorded actual flow through the load that comes about as a result of usage of various constructions of LED drivers. The simulation included numerical calculations made for a different number of LEDs connected to each tested driver and various numbers of each driver type with the same number of LEDs connected as load. Then, based on the simulation results, a comparative analysis was executed that aimed at studying the energy quality in LV power networks with LED stripes used as load. The following general simulation parameters were assumed for analysis (
Table 3).
The analysis included voltage and current distortion level, harmonic content parameters estimation and power factors, including active and reactive power distribution for various configurations of the load. As a base, 25 LEDs used as load was assumed, as this is approximately the most common number of diodes employed in similar applications (in this scenario, a single LED light bulb).
The simulation comprised current and voltage waveforms calculated for the following cases:
Single driver based on a voltage stabilization principle of operation, hereafter referred to as driver Type I and loaded by 25 LEDs;
Single driver based on AL8806 IC and working via a current stabilization circuit, hereafter referred to as driver Type II and loaded by 25 LEDs;
Single Type I LED driver loaded by 100 and 200 LEDs;
Single Type II LED driver loaded by 100 and 200 LEDs;
5 and 10 Type I drivers loaded by 25 LEDs; and
5 and 10 Type II drivers loaded by 25 LEDs.
3.1. Simulation Analysis for Single Drivers Loaded by Various Number of LEDs
The current and voltage waveforms obtained during simulations were stored in the form of *.csv files, and were subsequently analyzed in the frequency domain by applying the Fast Fourier Transformation method (FFT). The AC current in the circuit with a sinusoidal power source is represented in the form of the Fourier series (2):
where:
X0—constant component;
Y1 sin(ωt)—active component of the first harmonic content;
Z1 cos(ωt)—passive component of the first harmonic content;
—nth higher harmonics active component; and
—nth higher harmonics passive component.
Based on Fourier transformation of the obtained waveforms, specific coefficients were developed determining the quality of the electric energy. Among these are THD factors for current (
THDI) defined as (3) and for voltage (
THDU) defined as (4) [
30], and form factors for current (
FFI) (5) and for voltage (
FFU) (6).
where:
Ik—RMS value of the kth harmonic current; and
I1—RMS value of the current fundamental component.
where:
Uk—RMS value of the kth harmonic voltage; and
U1—RMS value of the voltage fundamental component.
where:
IRMS—RMS value of the current; and
IAVG—average value of the current.
where:
URMS—RMS value of the voltage; and
UAVG—average value of the voltage.
In view of the specific character of the load consisting of power electronic circuits, analysis comprised active power
P (7), apparent power
S (8) and reactive power
Q (9), and power factors (10) were calculated for each of the considered cases, as well.
As the reference cases for further analysis, current and voltage waveforms calculated for single drivers loaded by 25 LEDs were assumed.
Figure 4 presents waveforms calculated for the Type I driver.
The operation potential disturbance character of electric devices connected to a power network containing electronic circuits is conditioned by parameters of electric energy.
Figure 4 shows the specific transients observed in the current waveform.
The estimated frequency of these disturbances is in the range of 5–5.5 kHz, and the calculated amplitude is in the range of 10–13 mA.
A magnified half-wave of the current waveform with marked rise time and pulse time duration is presented in
Figure 5.
Fourier transformation of the current waveform indicates the occurrence of odd numbers of harmonic components. Amplitudes of even numbers of components are negligible and may be neglected during further analysis (
Figure 6).
Loading the controller with more LEDs resulted in changes in THD factors for voltage and current, as well as modification of the FF
i factor for current (
Figure 7). Changes in current waveform shape were induced by faster discharge of the filtering capacitor C1 (see
Figure 1).
Similarly as in the case of Type I, numerical analysis for the Type II driver was carried out.
Figure 8 presents the simulation results for a single driver of Type II loaded by 25 LEDs. The preliminary analysis of the obtained current and voltage waveforms indicates some differences in energy factors. The current stabilization method applied in the case of AL8806 chip usage results in lower
THDI factor and higher form factor for current. Simultaneously, the IC application induces high voltage and current waveform distortion, resulting in the presence of high-frequency transients. This is an effect brought about by way of the switching transistor (T
sw) at the IC output being combined with the hysteresis control circuit principle of operation.
Detailed analysis of the single current pulse (
Figure 9) indicates longer value of the rising time (0.89 vs. 0.7 ms) and impulse time (7.09 vs. 5.7 ms) duration (see
Figure 5). This results in higher RMS value of the single current pulse and in a higher form factor.
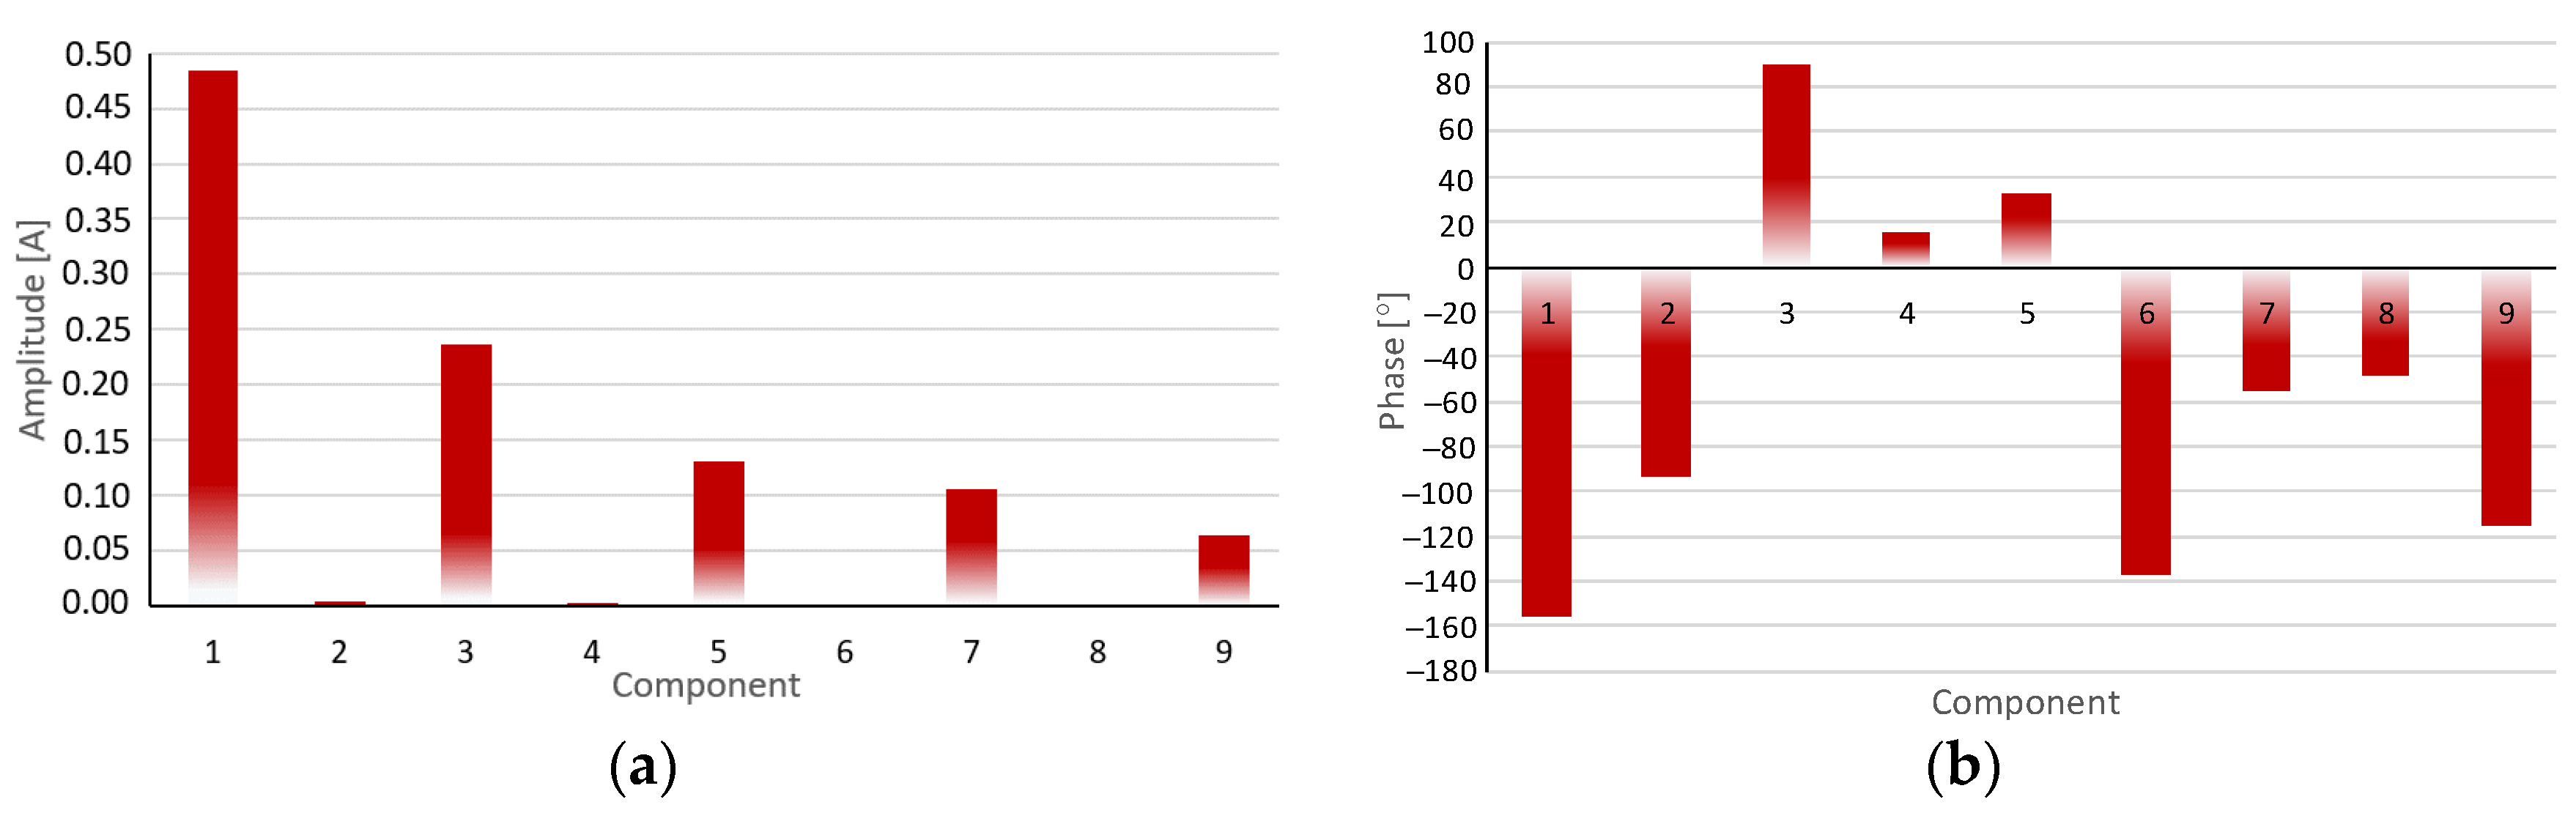
Similarly to the Type I driver, Fourier transformation of the current waveform indicates the occurrence of odd numbers of harmonic components. Component amplitudes of even numbers are negligible (
Figure 10).
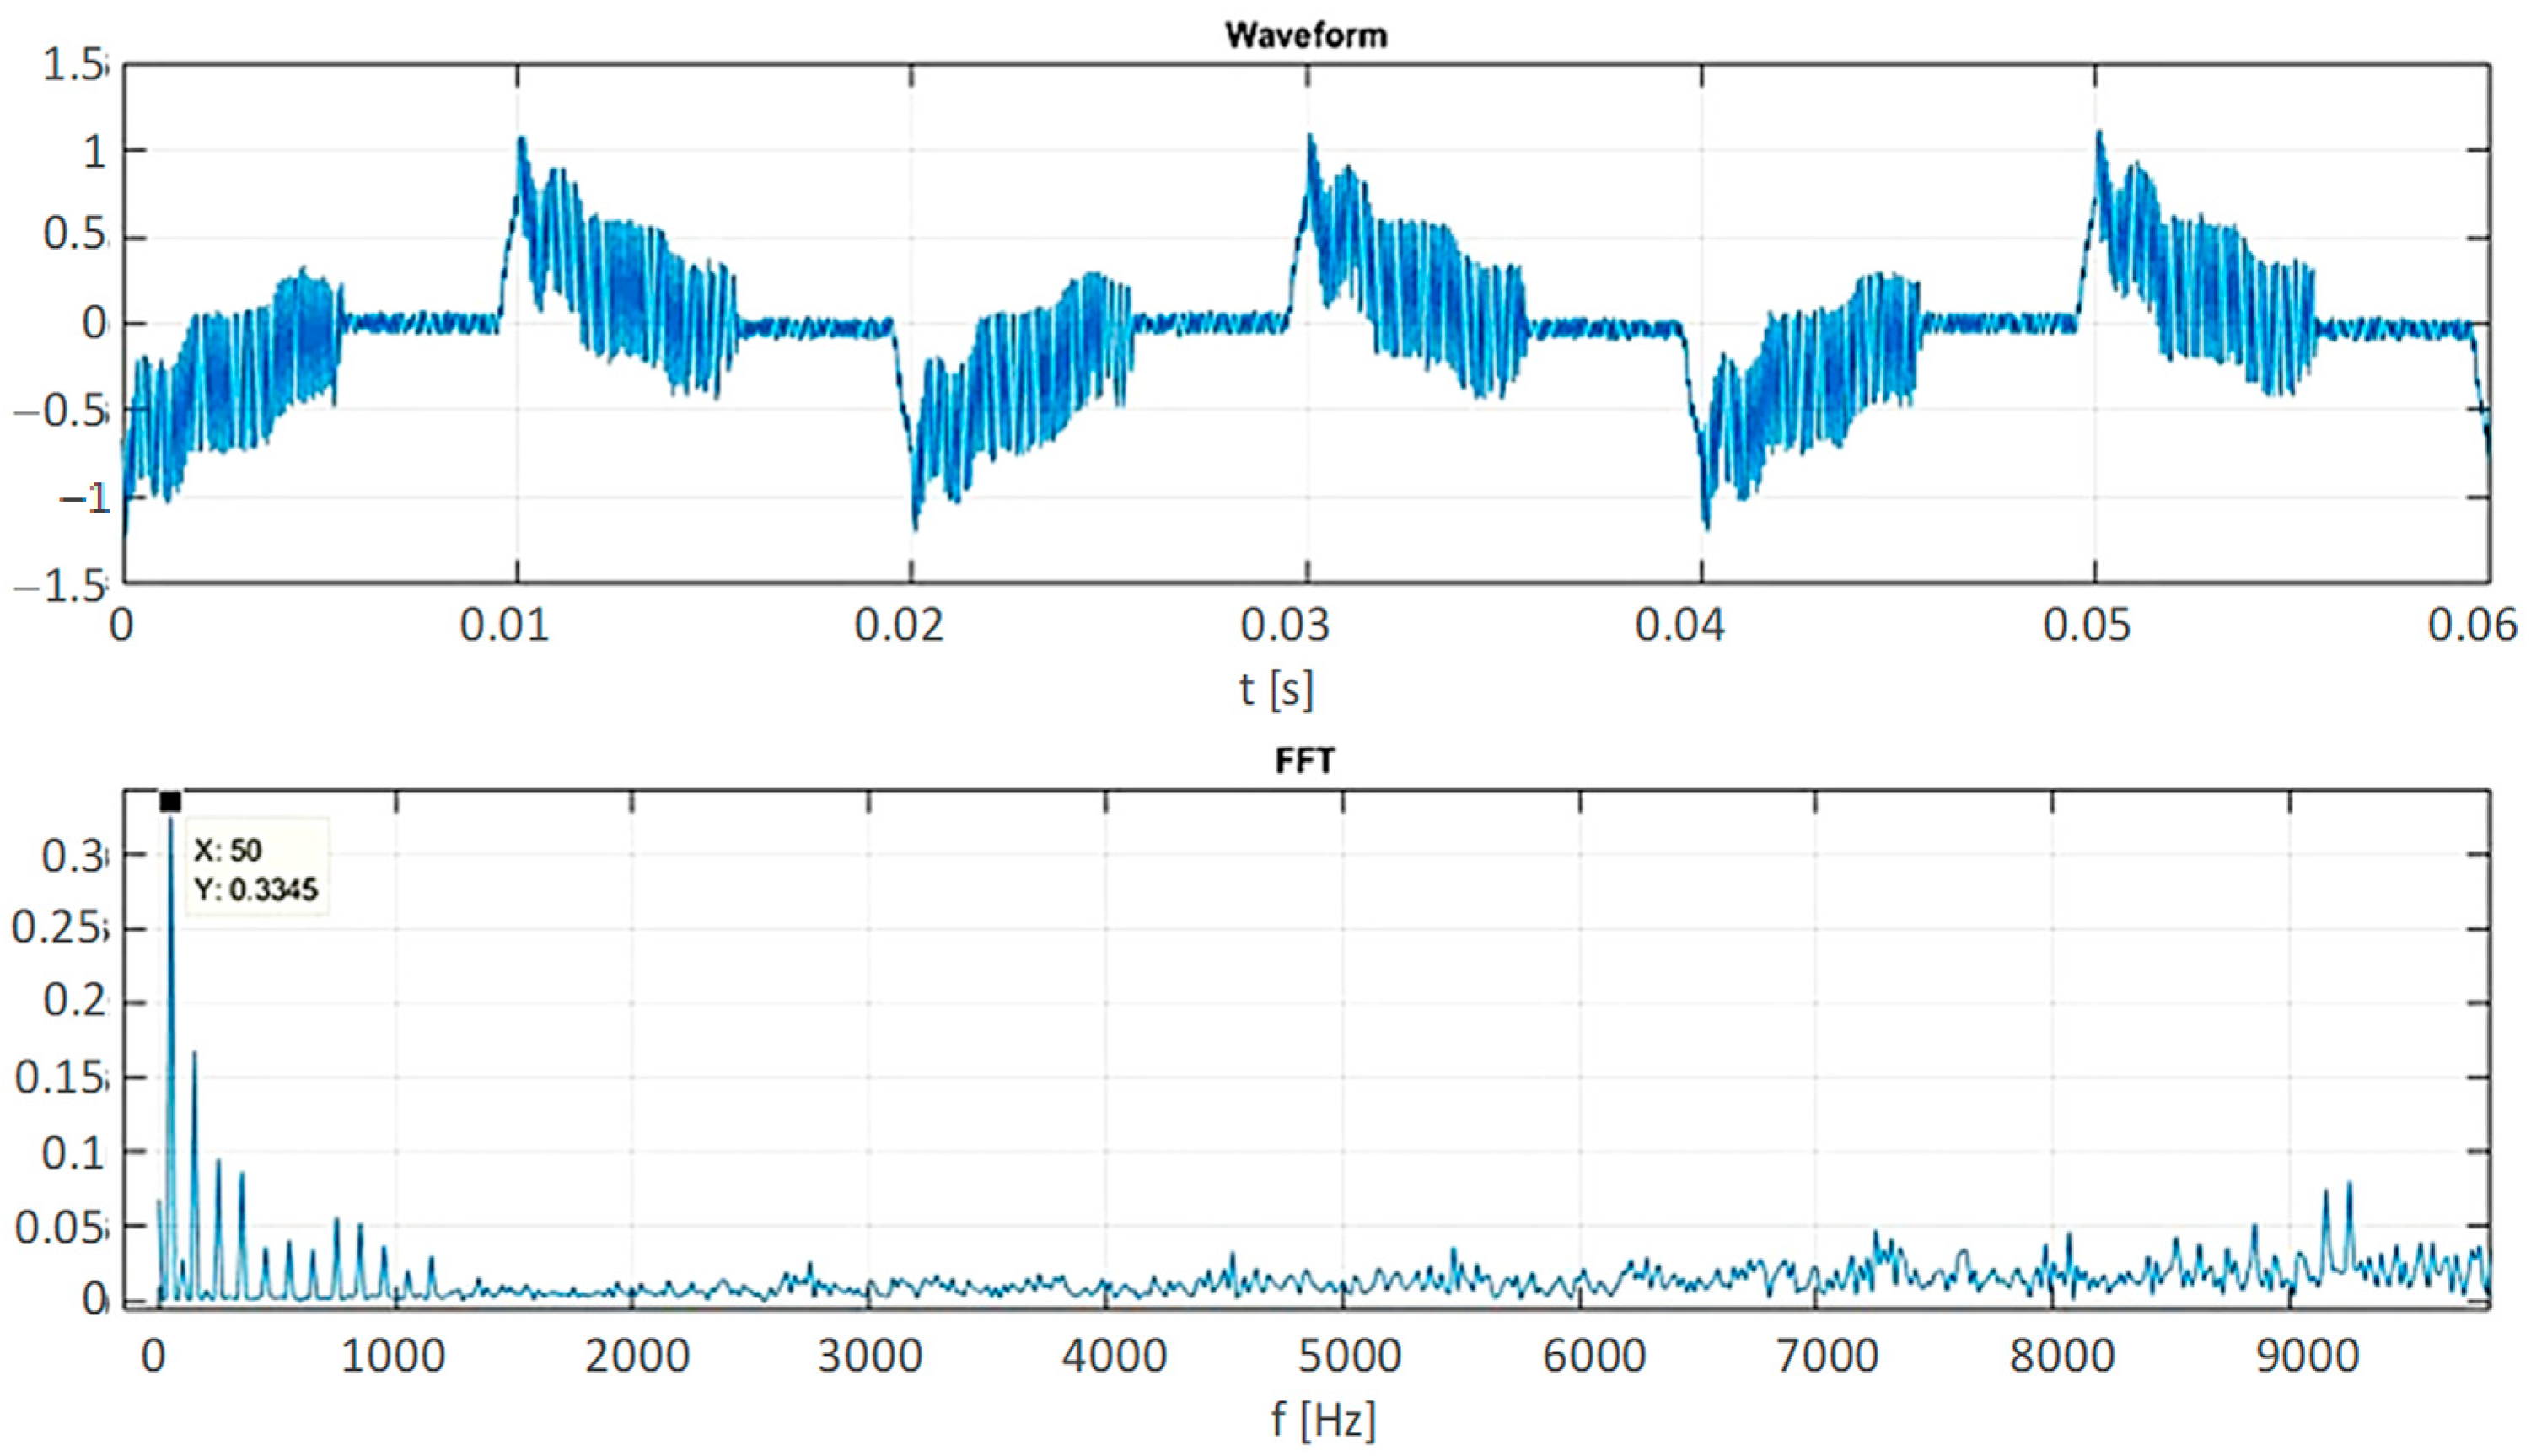
The calculated high-frequency transients observed at the current and voltage waveforms are visible via spectral analysis (
Figure 11 and
Figure 12).
The controller being loaded by more LEDs (100) resulted in changes in
THDI and
FFI factors for the current (
Figure 13). Changes in current waveform shape were induced by faster discharge of the filtering capacitor C2. This is a result of the limitation in the maximum capacity of the driver and depends on the LED type used as load.
The THD factor is commonly applied for estimating the harmonic components’ content level in the waveform. Hence,
Table 4 contains a summary of THD factors for load current and supply voltage for both analyzed drivers. Factors were calculated for various numbers of LEDs used as load.
In the current and voltage waveforms, various distortion levels entail different power distributions. Active, reactive and total apparent power distributions, with power factors for the considered cases, are thus listed in
Table 5.
3.2. Simulation Analysis of Various Numbers of Drivers Loaded by the Same Number of LEDs
Beyond the number of LED light sources used as load, the current and voltage harmonic components’ presence in the power network depends on the number of electronic power control devices that are employed, as well. Therefore, analysis of the simulation of current and voltage waveforms must consider the effects of differences in the number of connected LED drivers loaded by the same number of LEDs.
Figure 14 and
Figure 15 present the calculated exemplary current waveforms and electric energy parameters for a case wherein five drivers of each type were used. Each driver controls 25 LEDs. Preliminary analysis indicates increased power factor for circuits that comprise more drivers. A similar relationship was previously observed for more LEDs used as load.
As expected, more drivers connected to the power network resulted in changes in current and voltage waveforms and increases in THD factors for current and supplying voltage (
Table 6), as well as different power distribution (
Table 7).
4. Experimental Verification
In the analysis of electric energy quality for LV power networks with connected LED light sources, the effects of different numbers of drivers loaded by varying numbers of LEDs on electric energy quality were predicted by developing a reliable model of each of the assessed driver circuits. Based on the results of single model analysis, tests for other cases were subsequently carried out.
All results obtained by means of numerical calculation were experimentally verified at the testing stand (
Figure 16) for the same conditions as assumed during the simulation process. The electric energy quality analysis included harmonic components and calculated factors’ verification. For this purpose, a Sonel PQM707 power analyzer was used. Recorded by means of digital oscilloscope, the current and voltage waveforms were stored for future study in the form of *csv files. Detailed analyses of each obtained current and voltage waveforms, e.g., power and power factor calculations, were realized using MATLAB software.
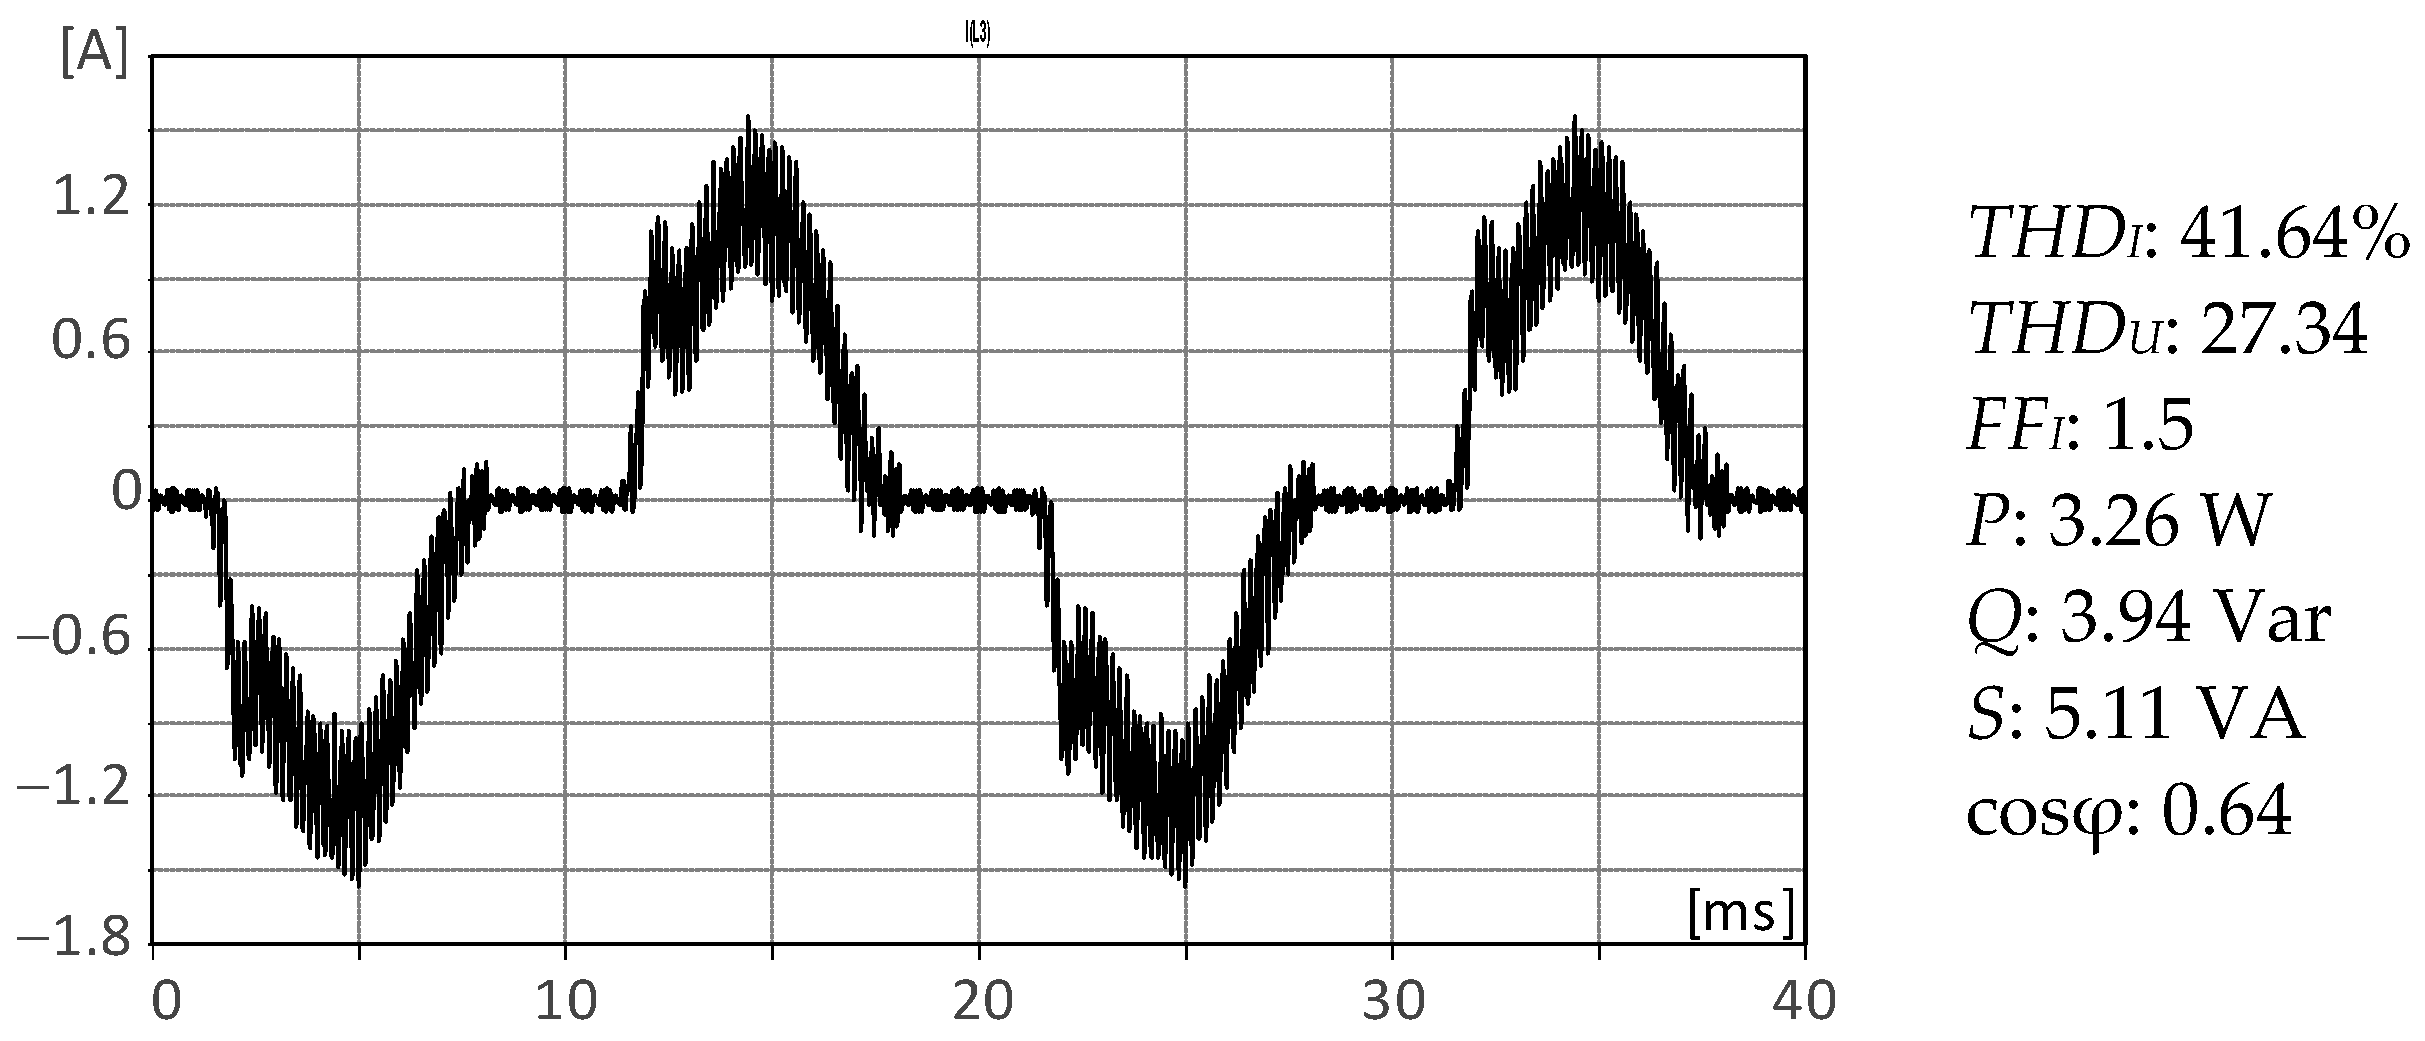
Figure 17 and
Figure 18 show exemplary waveforms obtained by means of oscilloscopic measurements for Type I and Type II LED drivers, respectively, along with the related FFT analysis results.
Figure 19 presents comparisons of current waveforms for single drivers loaded with 25 LEDs and obtained by means of simulation and during experimental measurements.
The comparison results indicate high similarity and consistency of simulated and measured waveforms, the main goal of the executed simulations. The subsequent stages of work and refinement of the driver models were based on the results obtained from the oscilloscopic measurements and the measurement results obtained by means of the power analyzer. In view of this connection, power factor analyses in the subsequent stages of the study are based on simulation results.
In view of the complex shape of the current waveform caused by the presence of a high level of HF disturbances, the similarity level for analyzed waveforms was significantly lower in the case of the circuit that utilized the AL8806 IC. The main problem encountered during the simulation was the recognition of frequency and source of the disturbances. Analysis of the IC structure indicates that the main source of recognized transience comes from output switching transistor (TSW) operation, combined with the hysteresis and voltage control module.
5. Results Analysis
The calculation of current and voltage waveforms for various configurations of the LV power network were executed in the frame of complete simulation analysis. Based on the achieved results for a single driver model application, we investigated the electric energy harmonic components for other configurations. Because current waveform shape and current higher harmonics parameters are decisive factors for estimating the electric energy quality, the current distortion level was assessed as the main parameter to be examined in this study. This allowed for determining the more significant factors responsible for harmonics generation for various load configurations.
Current harmonics component amplitudes for Type I and II drivers loaded with 25, 100 and 200 LEDs are presented in
Figure 20. Corresponding component phases are displayed in
Figure 21.
A summary of current harmonic component parameters for various numbers of Type I and II drivers (1, 5, 10) is presented in
Figure 22 and
Figure 23.
The simultaneous impact on THD value evaluation of the number of LEDs used as load for a single driver was assessed and compared with the number of drivers loaded by the same number of LEDs (
Figure 24).
With regard to variation in configurations of lighting systems based on LED stripes, usage of a higher number of drivers has a greater impact on the level of harmonic component generation than does the number of diodes connected to each driver. Therefore, it is advisable to design systems based on a small number of drivers that are characterized by higher efficiency than that built upon a higher number of low-efficiency drivers. As a consequence, a higher value of reactive power generated for various configurations is observed for a higher number of installed drivers (see
Table 6).
6. Filtering Circuits Application
Several types of input systems for power factor improvement are presently used. Depending on the application, they are based on simple passive filter units or active power factor control circuits.
The basic input circuits frequently applied in low-cost LED drivers do not include filtering circuits for power factor improvement. The only circuit for preventing unfavorable phenomena during LED light source operation is a series resistor (Rp) applied to limit current peak value and a capacitor used for basic filtering of the output voltage obtained from the rectifier system. LEDs with this input system generate high harmonic current levels that depend on resistor and capacitor values.
More advanced supply systems include diverse types of passive filtering circuits [
31,
32,
33], and a variety of harmonic filtering circuit arrangement types are utilized in such commercial applications. Exemplary typical passive filtering circuits are presented in
Figure 25.
The main advantage of employing systems based on the use of low-passive filters (LPF) is the ease of implementation and simplicity of construction. In contrast, filters with passive components generate inherent power losses, and the application of more advanced filtering circuits (e.g., [
34]) is economically unreasonable.
Unfortunately, taking into account the very limited space available in LED bulbs or drivers, and due to cost reduction, filters based on passive elements are often omitted, or elements used for filter manufacturing are not properly selected. This problem is especially observed due to the standardization of the manufacturing process.
In the final stage of our analysis, to verify the correctness of the developed models, we executed simulation analysis aimed at calculating THD factors values for drivers without and with applied filtering circuits.
To accomplish this, LPF was applied with appropriate values of capacitor
C and inductor
L (11) for resonance frequency
fr.
The value of the capacitor was fixed at 4.7 μF, as this value is in accordance with the range of capacitor capacity values offered by popular manufacturers. Based on the fixed capacitance value, inductors were found to have been manufactured with a 239.5 mH value. In this study, as resonance frequency,
fr = 150 Hz was then assumed. The results of the designed filter application (+LPF) are presented in
Figure 26.
Calculation results were experimentally verified at the test stand using a power analyzer. Experimental verification (marked as M in figures) of THD values for drivers loaded by various numbers of LEDs and equipped with filtering (+LPF) and without filtering circuits are collected in
Figure 27 and
Figure 28.
Experimental verification (marked as M in figures) of THD values for various numbers of drivers loaded by the same number of LEDs and equipped with filtering (+LPF) and without filtering circuits are collected in
Figure 29 and
Figure 30.
It should be stated that only single resonance frequency of third current harmonic content was taken into account for the filter design. For more effective filtering, LP filters should comprise more filtering circuits designed for specific higher harmonic component filtration.
7. Conclusions
The numerical models of LED drivers developed for SPICE simulation software were utilized for simulations related to ascertaining the influence of the impact on power quality of LED drivers installed into the power network. In the study, the analyzed driver topologies represented two different supply methods for powering of the LED light sources.
In the course of this work, the applied mapping method for transients present in the current and voltage waveforms and based on various frequencies and amplitudes source applications in the circuit model demonstrated its effectiveness. The use of additional elements taking into account the power electronic components switching transients allowed an increase in the precision of the performed simulations.
Omitting in the analysis additional disturbances brought about by the operation of power electronic components, however, resulted in the underestimation of the amplitude of specific harmonics components, and, in some cases, even their omission. This resulted in an underestimation of the calculated THD, FF and other electric energy-related factors.
Still, high consistency with regard to the results obtained by means of simulations and laboratory measurements was achieved. In consequence, the developed model is highly effective in simulating current and voltage waveforms in LED drivers. The method can, therefore, be used to simulate transients in the operation of similar controller constructions.
A comparison of both drivers operating through different principles of operation indicates that when used for powering the LEDs stripes and LEDs operating as load, the current stabilization method is of higher efficiency than the voltage stabilization method.
Moreover, the current stabilization method is more effective for appropriate LEDs supply and in providing suitable LEDs working conditions. As result, the expected parameters of the generated luminous flux can be achieved. Simultaneously, securing appropriate working conditions for durability of LED light sources can be increased.
Taking into account possible various load configurations, additional simulation analysis for different load topologies and their influence on current distortion level was presented. The calculated THD values analysis reveals that in designing lighting systems based on LED stripes, the better approach is to employ a small number of efficient drivers. Thus, current harmonics components and active and reactive power balance can be optimized in the designed lighting systems’ topology.
Both analyzed circuit models reflect real objects; thus, potentially applied filtering circuits in the real objects were applied to the models, as well. Using dedicated filtering circuits, decreased supply voltage and load current distortion levels may be achieved. The presented problem is often underestimated and ignored by the powering circuit manufacturers. The reason for this is the reduction in manufacturing costs. The analyzed circuits are examples of such a line of producer reasoning.


