Article

Evolution of Biomarker Maturity Parameters and Feedback to the Pyrolysis Process for In Situ Conversion of Nongan Oil Shale in Songliao Basin

1
Production Project Division, Sinopec Exploration & Production Research Institute, Beijing 100083, China
2
College of Earth Sciences, Jilin University, Changchun 130021, China
3
College of Construction Engineering, Jilin University, Changchun 130021, China
*
Author to whom correspondence should be addressed.
Energies 2022, 15(10), 3715; https://doi.org/10.3390/en15103715
Submission received: 1 April 2022 / Revised: 8 May 2022 / Accepted: 10 May 2022 / Published: 19 May 2022
(This article belongs to the Collection State of the Art Geo-Energy Technology in China)

Abstract

:
In the oil shale in situ conversion project, it is urgent to solve the problem that the reaction degree of organic matter cannot be determined. The yield and composition of organic products in each stage of the oil shale pyrolysis reaction change regularly, so it is very important to master the process of the pyrolysis reaction and reservoir change for oil shale in situ conversion project. In the in situ conversion project, it is difficult to directly obtain cores through drilling for kerogen maturity testing, and the research on judging the reaction process of subsurface pyrolysis based on the maturity of oil products has not been carried out in-depth. The simulation experiments and geochemical analysis carried out in this study are based on the oil shale of the Nenjiang Formation in the Songliao Basin and the pyrolysis oil samples produced by the in situ conversion project. Additionally, this study aims to clarify the evolution characteristics of maturity parameters such as effective biomarker compounds during the evolution of oil shale pyrolysis hydrocarbon products and fit it with the kerogen maturity in the Nenjiang formation. The response relationship with the pyrolysis process of oil shale is established, and it lays a theoretical foundation for the efficient, economical and stable operation of oil shale in situ conversion projects.

1. Introduction

Oil shale is an important strategic resource, which has the characteristics of wide distribution and huge resources and has always been widely concerned [1]. The development methods of converting oil shale into usable petroleum resources are divided into ground retorting technology and in situ conversion technology [2,3,4,5,6]. The application of ground retorting technology is mainly for oil shale occurring at shallow burial depth, which limits the number of available resources, and the technology itself has problems such as environmental pollution [7,8,9,10,11,12]. Oil shale in situ conversion technology can exploit deep oil shale and has the advantages of green environmental protection, small footprint and low cost [12,13,14,15,16,17,18,19]. In Songliao Basin, Jilin University built two pilot test bases for oil shale in situ conversion and successfully produced oil in 2016 and 2020, respectively. The pilot experiments accelerated the industrialization of oil shale, but the difficulty in monitoring the process of pyrolysis of oil shale organic matter has become more and more prominent in the project [20,21,22,23].
Studies showed that the production and composition of organic products in each stage of oil shale pyrolysis change regularly [1,2,3,4,5,21,22]. Therefore, it is very important to master the process of pyrolysis in oil shale in situ conversion project for efficient cracking and maximizing economic benefits [24,25,26,27,28]. However, the process of pyrolysis reaction can be analyzed by the maturity of oil shale kerogen [29,30,31,32]. This method necessitates coring in the pyrolysis reaction formation with additional drilling, which can destroy the subsurface thermal reaction environment and cause serious adverse effects on the mining industry. In addition, the current research on the maturity of oil shale organic matter fails to fully consider the complex subsurface conditions and artificial thermal reaction environment of oil shale and is not suitable for in situ conversion of oil shale [33,34,35,36]. Based on the experience of in situ conversion pilot experiments, the study proposes that oil and gas products are to be obtained through production wells during the operation of the project, and the maturity information of oil and gas products can be fed back to the reaction process of oil shale pyrolysis, but related research has not yet been conducted in-depth development.
In this study, the research on the dynamic evolution of the maturity parameters of oil shale pyrolysis hydrocarbon products was carried out, and the applicable maturity parameters were selected to accurately feedback the maturity of kerogen in the Nenjiang formation. Then, the response to the oil shale pyrolysis process relationship was established, and the real-time situation of the yield and composition of organic products in the underground kerogen pyrolysis reaction was informed. This study is a necessary way to dynamically monitor the oil shale in situ cracking reaction process, and it is also the key to ensuring the high efficiency, economy and stability of the oil shale in situ conversion project.

2. Samples and Methods

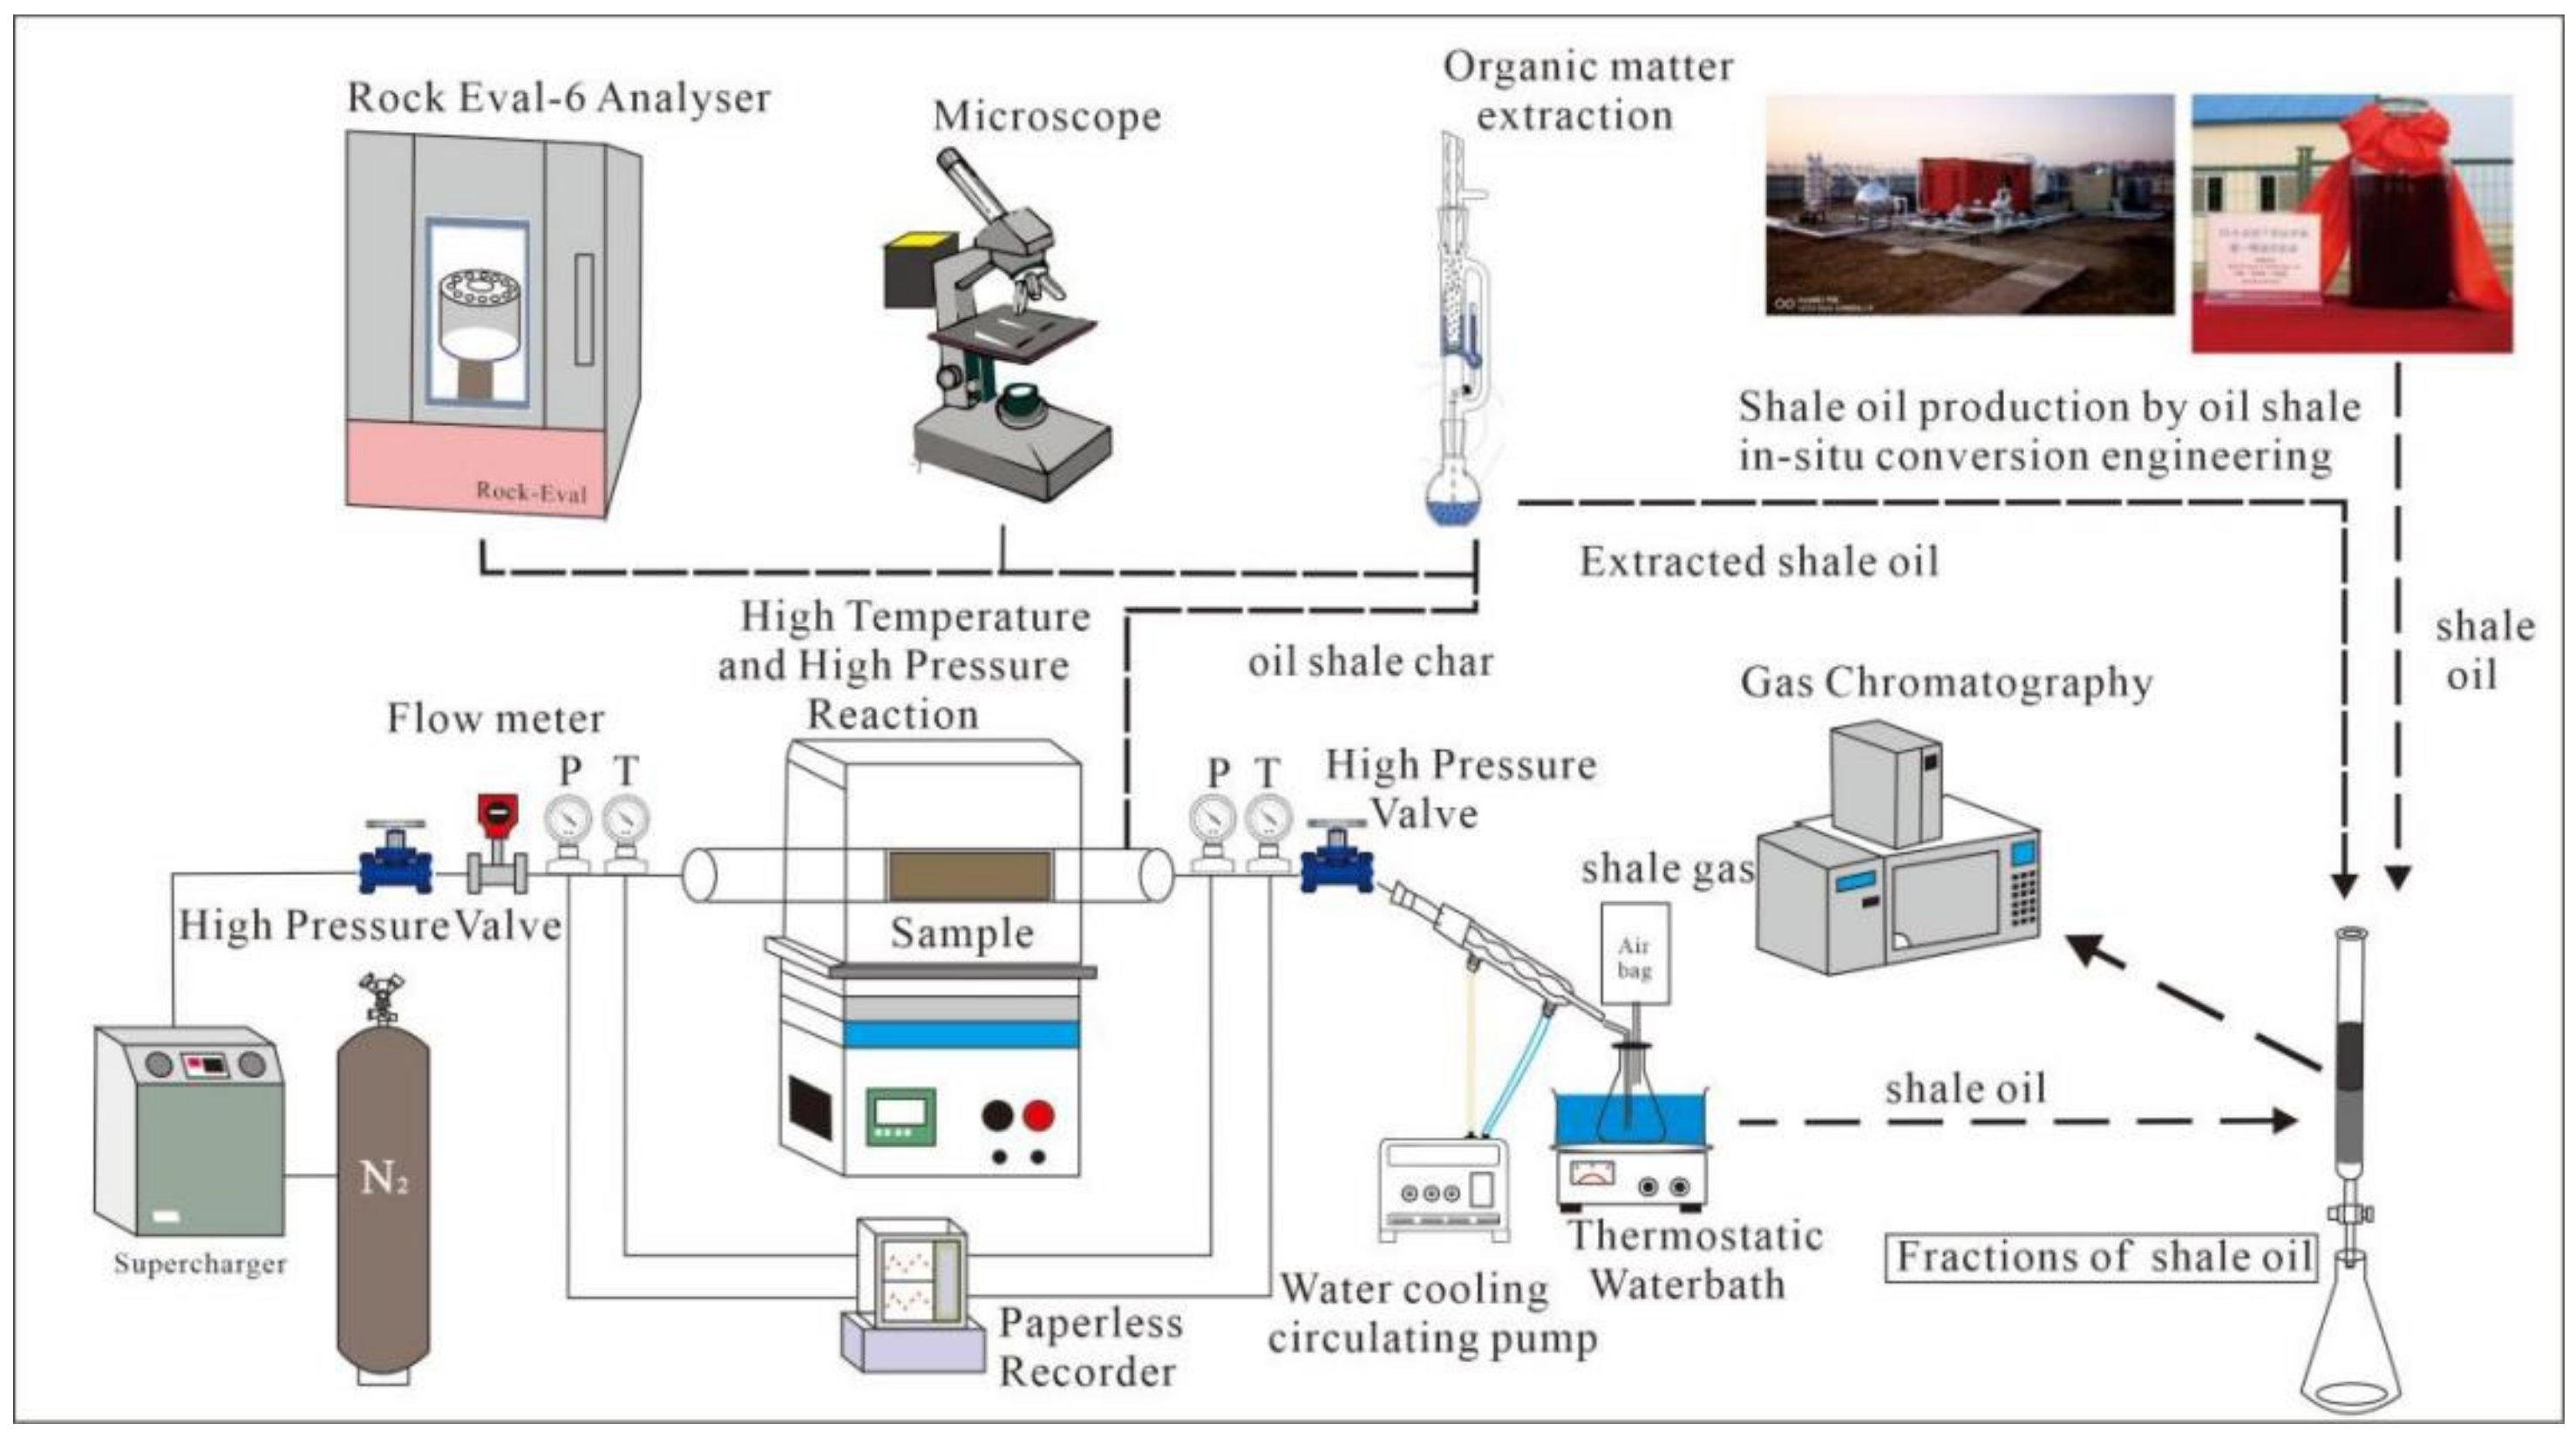
2.1. Research Methodology

In this study, core samples from oil shale exploration drilling in the Nongan (NA) experimental area were selected for this research, which included core logging, stratigraphic age division, and high-precision geochemical logging (total organic carbon). The preliminary results revealed the target sampling horizon of subsequent experiments. Then, the experiment began with high-temperature and high-pressure reactions on oil shale samples from the Nenjiang Formation in the reactor. Vitrinite reflectance tests, rock-eval pyrolysis and elemental analyses were performed on the semicoke products. The pyrolysis oil extracted from oil shale semicoke was quantitatively separated and analyzed by gas chromatography–mass spectrometry (GC-MS). The related tests performed on pyrolysis oil samples collected from the Nongan oil shale in situ production product include group component separation and GC-MS analysis (Figure 1).

2.2. Selection of Oil Shale Samples

2.2.1. Stratigraphy of the Nenjiang Formation

The lower part of the Nenjiang Formation is a dark mudstone, and the upper part is composed of grey-green mudstone and glutenite deposits (Figure 2) [37,38]. These strata can be further divided into 5 members based on lithology. The first member of the Nenjiang Formation is composed of dark mudstone and thin oil shale. In the second member, the stable thick layer of oil shale in the whole area is at the bottom, and it transitions to grey mudstone and grey-green mudstone upward. The third to fifth members are eroded in the southeastern part of the basin, and the main parts are greyish green mudstone and greyish white sandstone, followed by a transition to purplish-red mudstone in the central part of the basin, and the Nenjiang group formation is the horizontal stratum of Shenzhen Lake phase in the research area [37,38,39] (Figure 3).
The Nongan oil shale in situ conversion project is located 110 km north of Changchun. The total drilling depth is 135 m, and the drilling technique is full-core drilling. After a thin layer of Quaternary deposits, the strata that have been encountered are the Cretaceous upper Yaojia Formation (8 m) and the Nenjiang Formation (112 m). Based on core descriptions and lithofacies divisions of drilling cores in Nongan, we have a preliminary understanding of the overall features and sedimentary environment of the Nenjiang Formation and provide an important basis for selecting appropriate samples for testing and analysis. According to core records during drilling in Nongan, Quaternary sands are located 10 m from the surface to the ground, and no sampling has been carried out in this interval (Figure 3). Sampling was performed every 1 m for the cores until 133 m of depth. The main core samples from 66 to 74 m from the Nongan oil shale in situ conversion test area. The drilling fluid was washed off in distilled water and then dried at a constant temperature of 60 °C for 12 h [22,23].

2.2.2. Sampling of Shale Oil Samples for In Situ Conversion Project

As shown in Figure 4, the process mainly involves drilling thermal injection wells and production wells in the ground facing the oil shale layer and performing conventional work, such as casing running and cementing after drilling. Then, the conventional hydraulic fracturing method is used for fracking the heat injection wells so that the heat injection wells and the production wells are connected through the fractures formed by fracturing. After the connection between the heat injection well and the production well is established, high-temperature nitrogen (450 °C) is introduced into the heat injection well on the ground surface, and nitrogen flows to the production well through the fractures formed by hydraulic fracturing. During the flow of high-temperature nitrogen, nitrogen contacts the oil shale layer to conduct convective heat conduction, thereby heating the oil shale layer [22,23], and this convection keeps it warm for the experiment. After heating for a period of time, the produced oil and gas and nitrogen flow to the production well and are recovered in the production well, and the generated oil, gas and mixed vapor and gas are sent to the surface. Two-stage cooling and separation are carried out to separate pyrolysis oil, pyrolysis gas and water. The heat carrier, nitrogen, used in the process of heating the oil shale layer, is obtained by separating the air from the pressure swing adsorption (PSA) air separation nitrogen generator and is heated to the designed temperature by ground heating equipment.

2.3. Experimental Methods

(1)
High-pressure pyrolysis experiment
This experiment was carried out using a high-pressure nitrogen pyrolysis oil shale test device. The oil shale core samples were subjected to high-pressure heating treatment, and the samples were dried and put into the reactor, the reactor was filled with nitrogen and the pressure in the reactor was increased to the lithostatic pressure of the formation; the nitrogen was turned off, the reactor was heated up and the heating rate was 10 °C/min. The end-point temperatures of different samples were selected as 150 °C, 200 °C, 250 °C, 300 °C, 350 °C, 375 °C, 400 °C, 425 °C, 450 °C, 475 °C and 520 °C. After reaching the end temperature, keep the temperature for 6 h, then keep the pressure in the kettle unchanged for 2 h, open the inlet and outlet of the reaction kettle and pass nitrogen for 2 h, and the N2 flow rate is 1 L/min. At the outlet, the cracked oil product was received through a water-cooled tube, and the cracked gas product was collected by an air bag. After reaching the termination time, the temperature of the reactor was lowered, the pressure was reduced, and the oil shale semicoke product in the reactor was taken out and stored in a sealed [16,17,18,27].
(2)
Rock pyrolysis evaluation experiment with oil shale semicoke
Different oil shale semicoke samples were crushed into size 200 mesh for pyrolysis evaluation. A Rock Eval-6 analyzer developed by the French Academy of Petroleum Sciences was used for the experimental analysis of rock pyrolysis. S1, S2, S3 and Tmax were measured [40,41,42].
(3)
Total organic carbon
The total organic carbon (TOC) of all oil shale semicoke samples was determined by vario PYRO cube elemental analyzer produced by Elementar, UK, which conformed to the GBT-19145-2003 standard [43].
(4)
Separation of pyrolysis oil components
In the separation and analysis of group components in organic matter extracts of oil shale semicoke, the selected oil shale semicoke samples were extracted with a dichloromethane and methanol (93:7) mixture by an automatic Soxhlet apparatus. Then, sulfur was removed from the organic extracts of oil shale semicoke and other pyrolysis oil samples by active copper, and asphaltene was precipitated from n-hexane dichloromethane (DCM) solution (80:1). After centrifugation, the extracted organic matter was separated into saturated hydrocarbons and NSO by liquid chromatography. The experiment was carried out according to the SY/T5119-2008 standard [35,36,41,42,43].
(5)
Gas chromatography-mass spectrometry
After obtaining the saturated hydrocarbon components separated from the organic group components, the saturated components were dissolved in petroleum ether. The relative abundance of related biomarker compounds in saturated hydrocarbons and aromatic hydrocarbons was calculated from the manually integrated peak areas of the relevant ion chromatograms. Compared with the indicated range and the evolution law of natural hydrocarbon generation, the analysis process follows the GBT-30431-2013 standard [35,36,39].
(6)
Organic lithofacies observations and vitrinite reflectance (Ro) test
Petrological observations were performed using a high-power optical microscope (Zeiss axioscope A1) equipped with a photometric system with fluorescent lamps. According to ASTM standard d7708-14 (2014), the average random vitrinite reflectance (%), Ro was carried out [39,41].

3. Results and Discussion

3.1. Evolutionary Characteristics of Organic Matter at Different Pyrolysis Temperatures

3.1.1. Analysis of the High-Pressure Pyrolysis of Oil Shale

In the pyrolysis experiments of Nongan oil shale samples at different temperatures, all reaction temperatures can be divided into 20 °C to 300 °C, 300–475 °C and 475–520 °C. At 20–300 °C, the yield of pyrolysis oil is very low, reaching 0.76%, the total organic carbon content of semicoke decreases slightly, from 8.09% to 6.22%, and the amount of gas produced also increases slightly. At 300–475 °C, the main product of the emission was thermal solution oil, and the output increased significantly, up to 6.37%, and the output of water at the same time increased [44,45,46,47]. At 475–520 °C, the output of oil and water only increased slightly [46,47,48,49,50] (Figure 5, Table 1 and Table 2).

3.1.2. TOC Content

The average TOC content of the oil shale in this study is 8.09 wt% [35,36]. The TOC content of the 150 °C sample in each heating process is slightly lower than that of the original sample, which may be due to the fact that the water in the oil shale was dried in the previous test [33,34]. The TOC content of the pyrolyzed samples decreased slightly at 150–300 °C, and the S1 value gradually increased. It is because free hydrocarbon expulsion leads to a reduction in TOC [35,36,44,46]. In the 300–450 °C stage, TOC decreased significantly, corresponding to a large amount of oil generated from oil shale. In the 450–520 °C stage, TOC decreased slowly and tended to be stable (Table 2).

3.1.3. The Evolutionary Trend of Ro% and Tmax

Vitrinite reflectance is used to judge the kerogen thermal maturity and is generally divided into five stages according to Ro: <0.5% immature, 0.5–0.7 early mature stage of oil generation, 0.7–1.0 mature middle stage of oil generation, 1.0–1.3 late mature stage of oil generation, >1.3 main gas generation stage [39,40,41,51,52,53]. In this experiment, the Ro value of agricultural dried samples was between 0.266% and 1.376%, indicating that the kerogen maturity from immature to mature (Table 2).
When Tmax is lower than 435 °C, the organic matter is in the immature stage. When Tmax is 435–440 °C, the kerogen is low mature. When Tmax is 440–450 °C, kerogen is mature. When Tmax is higher than 450 °C, it is in the high-maturity stage [54,55,56]. The Tmax of Nongan oil shale is 430 °C, which indicates that the kerogen is immature [57]. The results show that the Tmax of the semicoke sample increases with the increase in the pyrolysis temperature. The Tmax of samples below 450 °C varies between 430 and 445 °C, indicating the gradual maturity of kerogen, while the Tmax from 450 °C to 520 °C is 566–600 °C. According to the spectrum, the peak value of S2 may be too low, while the instrument system calculates the maximum peak value, which may be caused by rapid pyrolysis. Therefore, when the pyrolysis temperature reaches 450 °C, it may be inaccurate to judge oil shale maturity by Tmax [57].

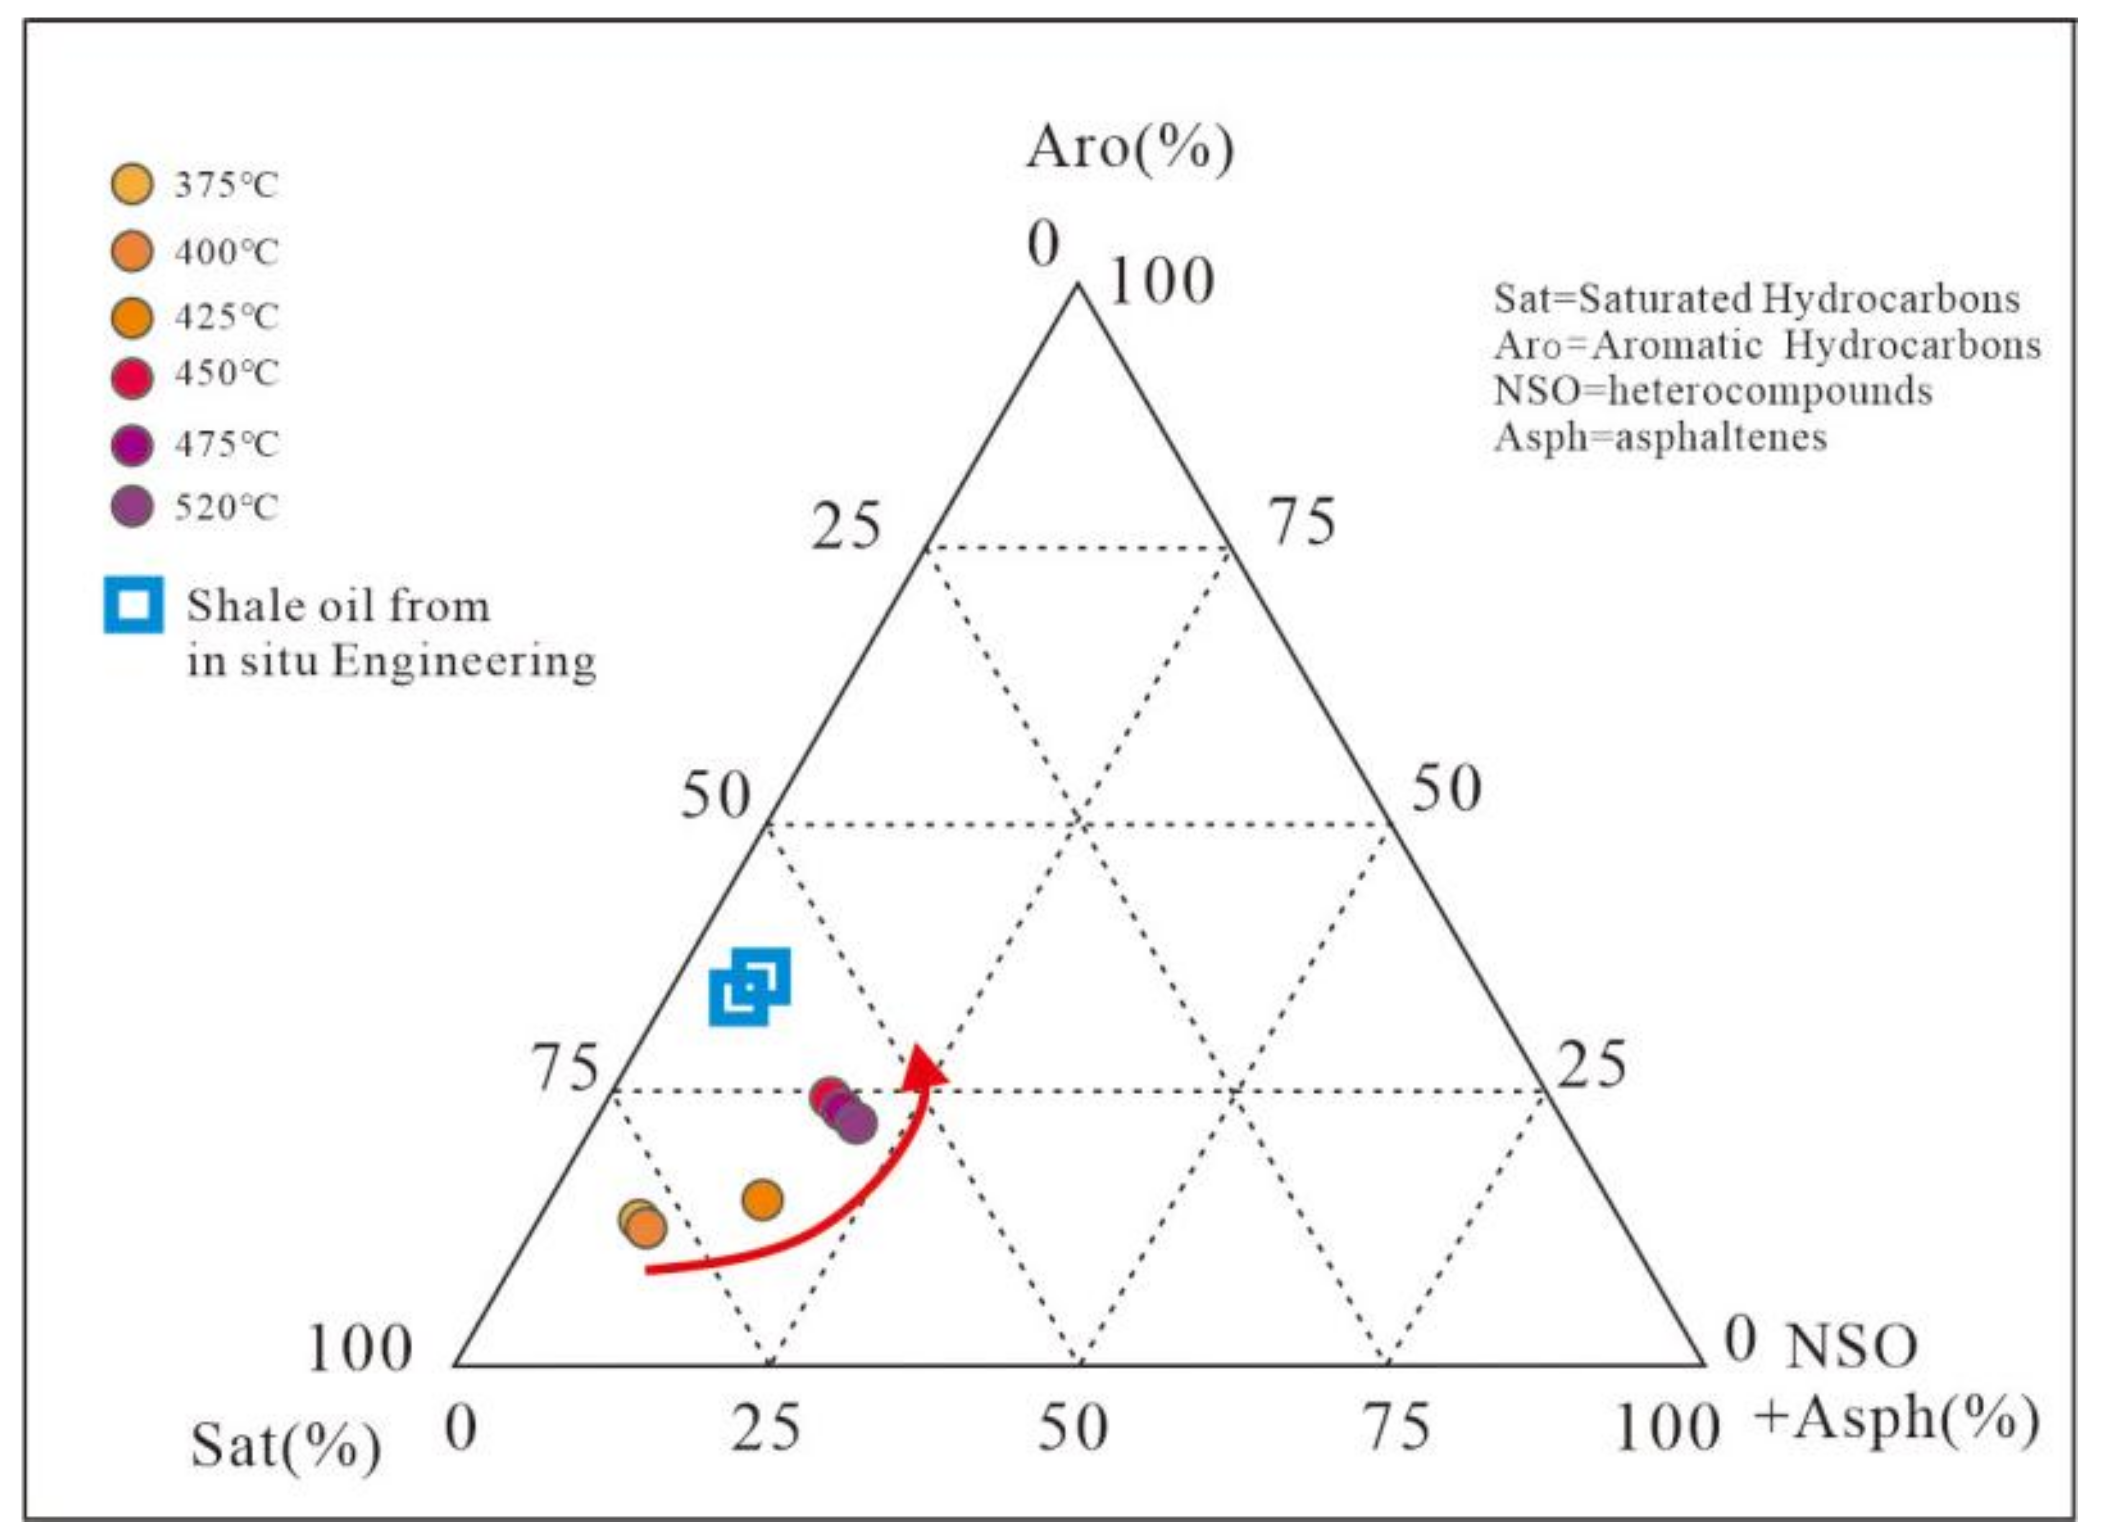
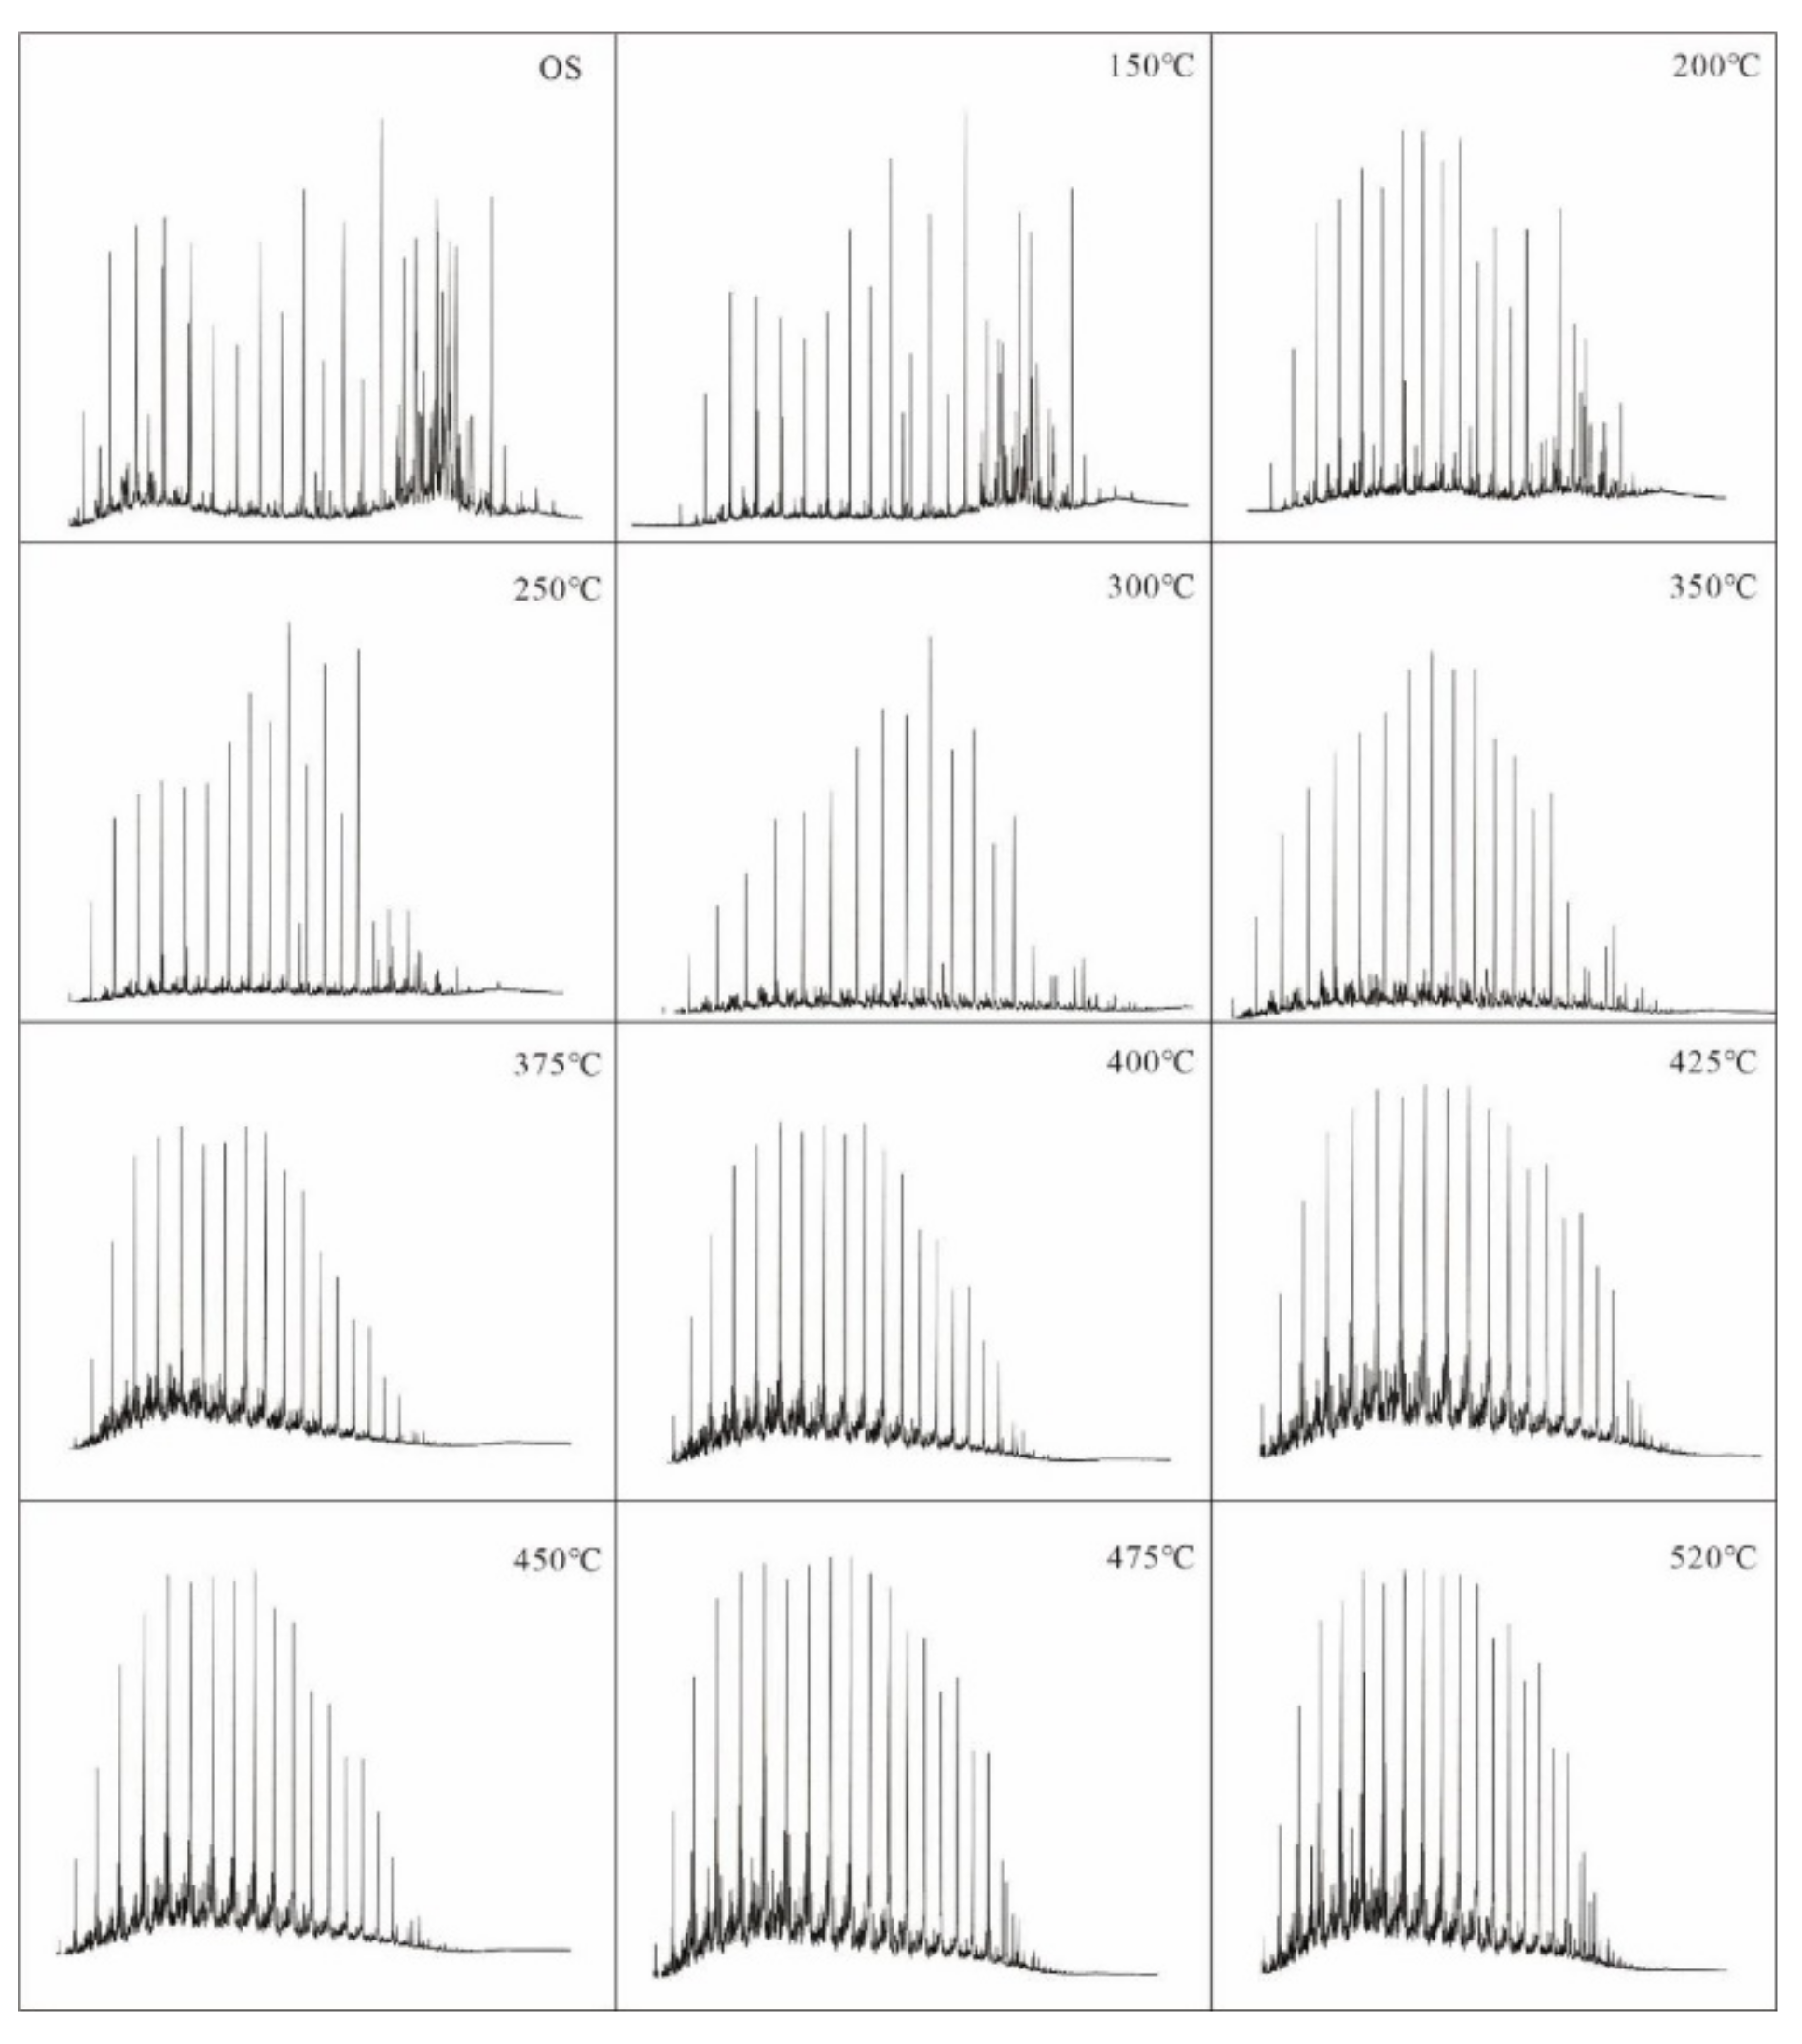
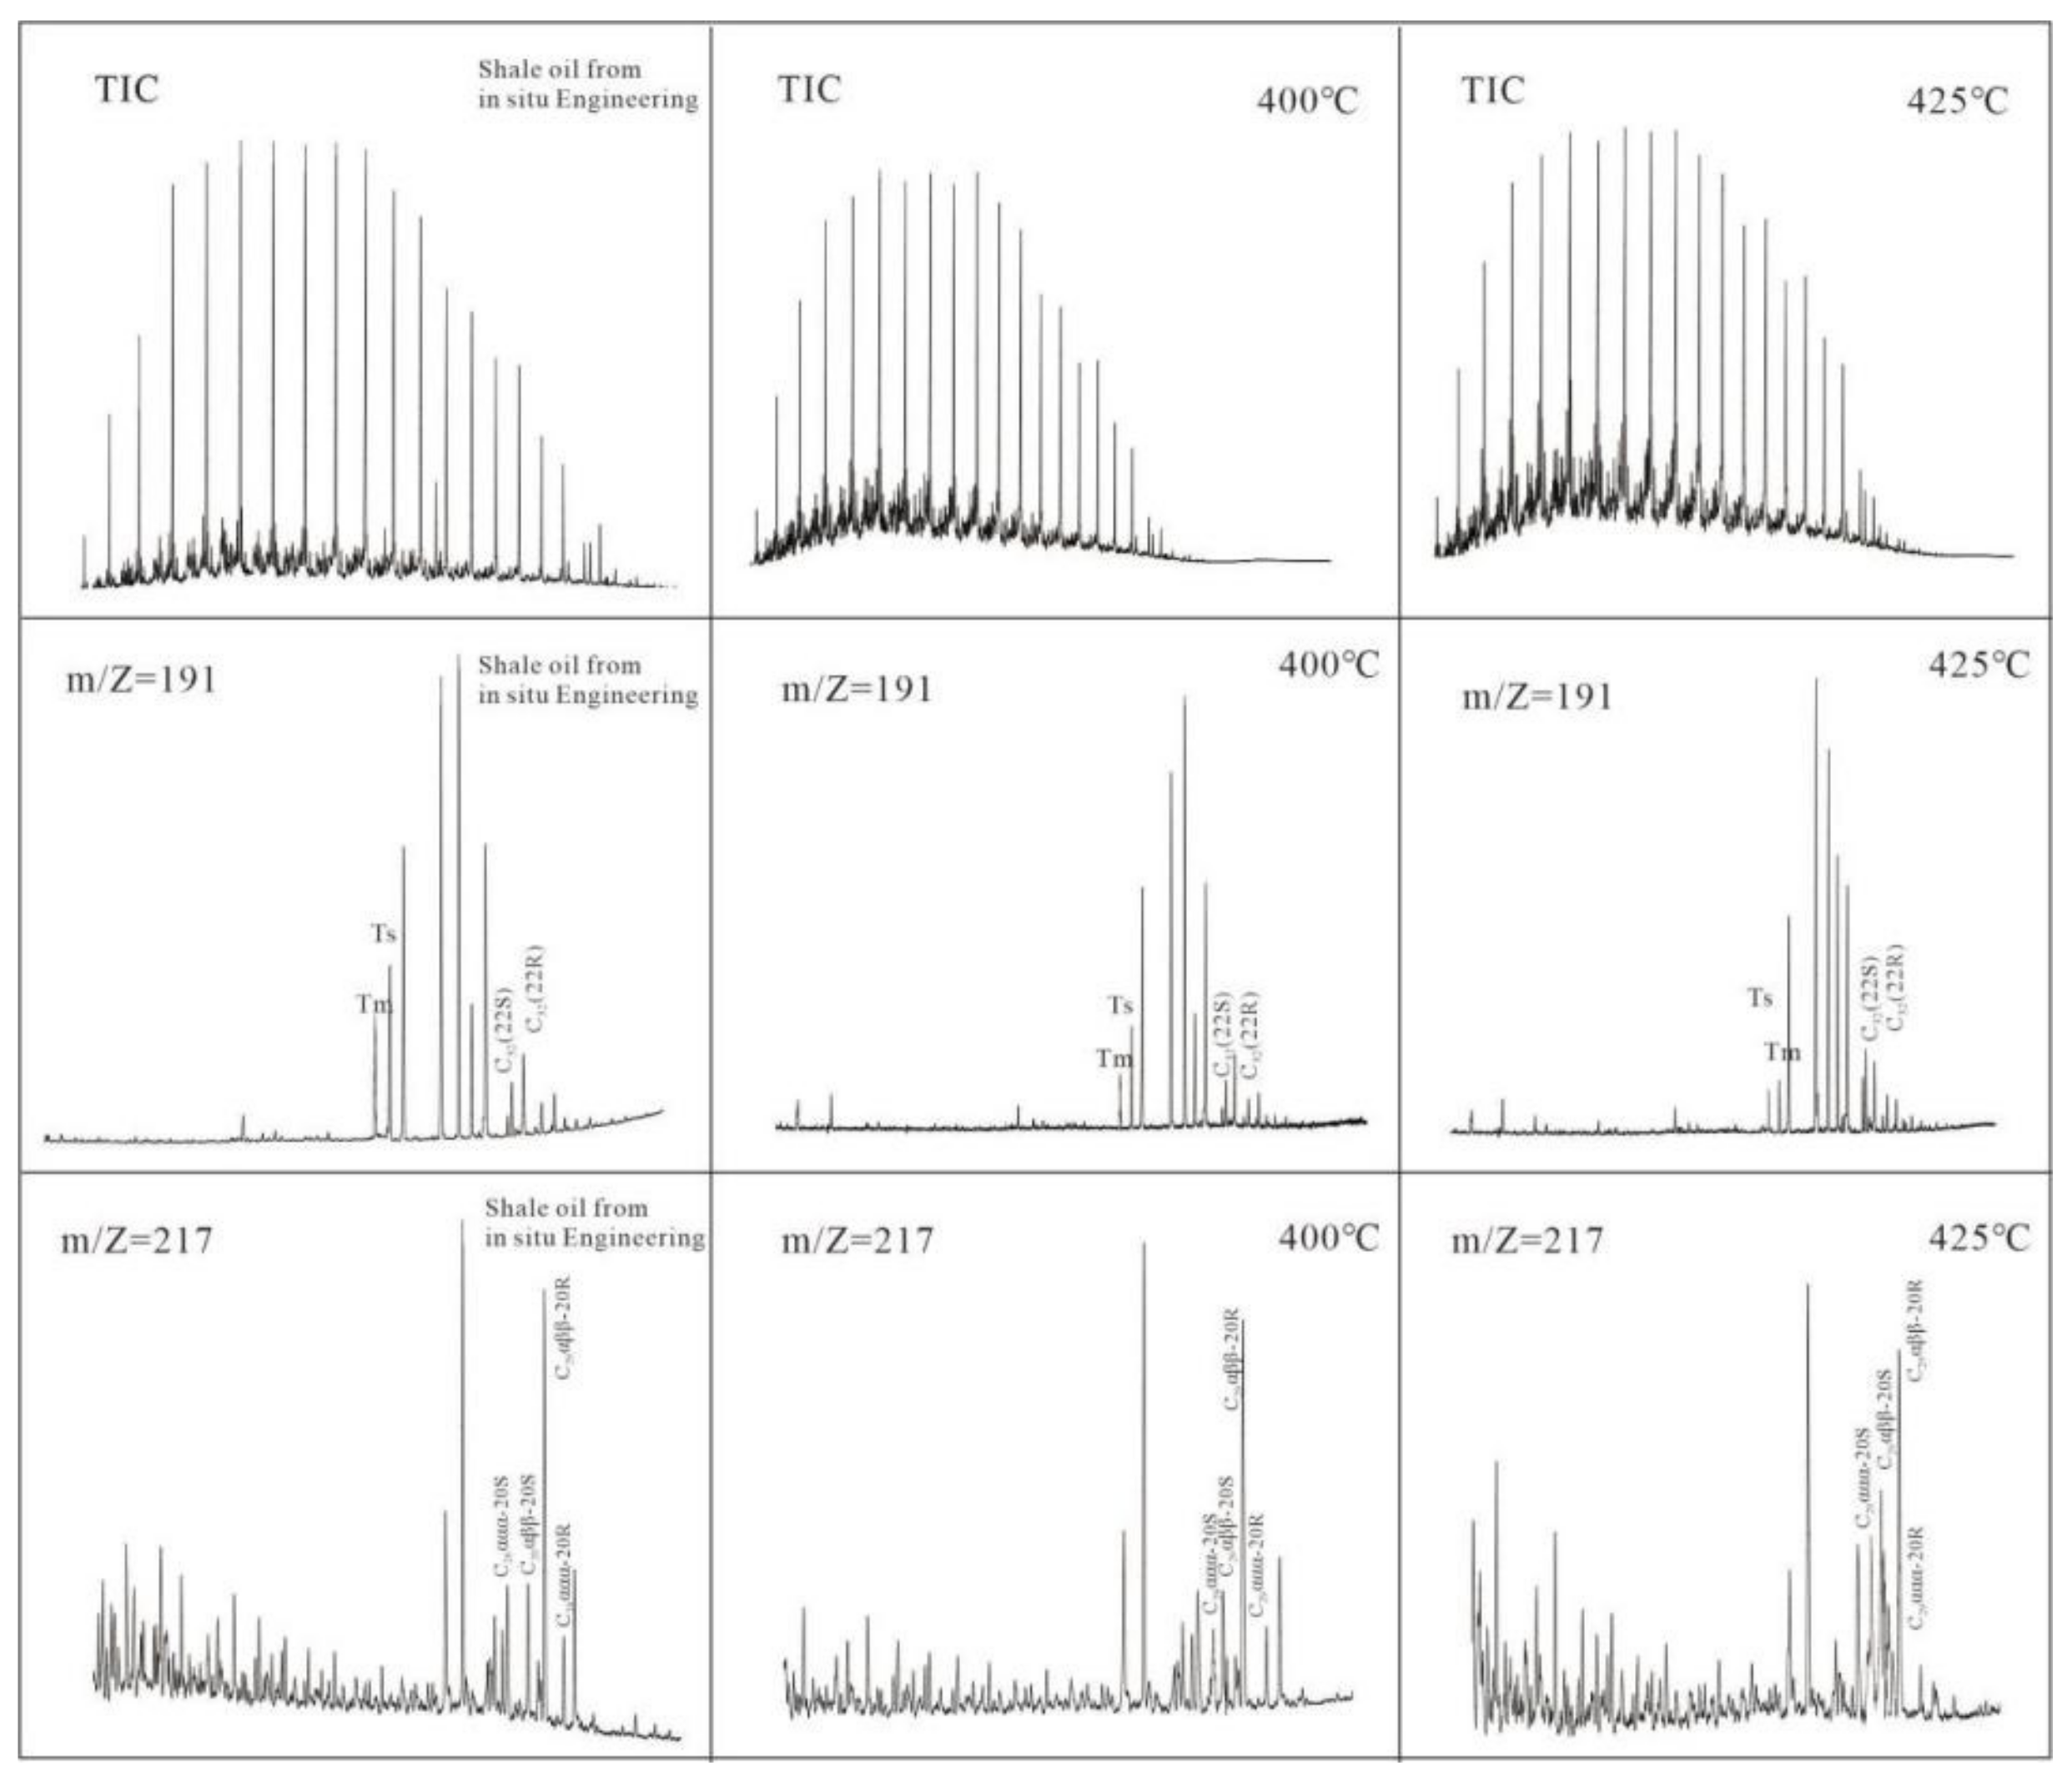
3.1.4. Changes in Pyrolysis Oil Composition

Studies showed that the production and composition of organic products in each stage of oil shale pyrolysis change regularly, so it is very important to master the composition changes in pyrolysis oil in oil shale in situ conversion project for efficient pyrolysis [35,36,41,42,43]. In this study, it was found that the components of pyrolysis oil in the organic matter extract of oil shale semicoke showed regular changes. When the temperature is lower than 350 °C, the proportion of non-hydrocarbon components to asphalt is the highest, but when the pyrolysis temperature exceeds 375 °C, the value of the ratio is sharply reduced to 0.17. Additionally, when the pyrolysis temperature exceeds 375 °C, the oil yield starts to rise (Figure 6). Saturated hydrocarbons were the main component, followed by aromatic hydrocarbons, while NSO and asphaltene were the main components. A calculation of the composition of total pyrolysis oil from oil shale revealed that asphaltene accounted for the largest proportion in the pyrolysis oil at the initial stage of the pyrolysis reaction (room temperature to 250 °C, reaching 0.626%), while saturated hydrocarbons and aromatic hydrocarbons accounted for a small proportion (0.25% and 0.124%, respectively). Within 250–375 °C, the amount of pyrolysis oil increased gradually (0.16–1.35%). When the cracking temperature reaches 375 °C, the cracked oil is mainly saturated hydrocarbon, and the proportion of each component is relatively stable (Figure 6, Table 3).

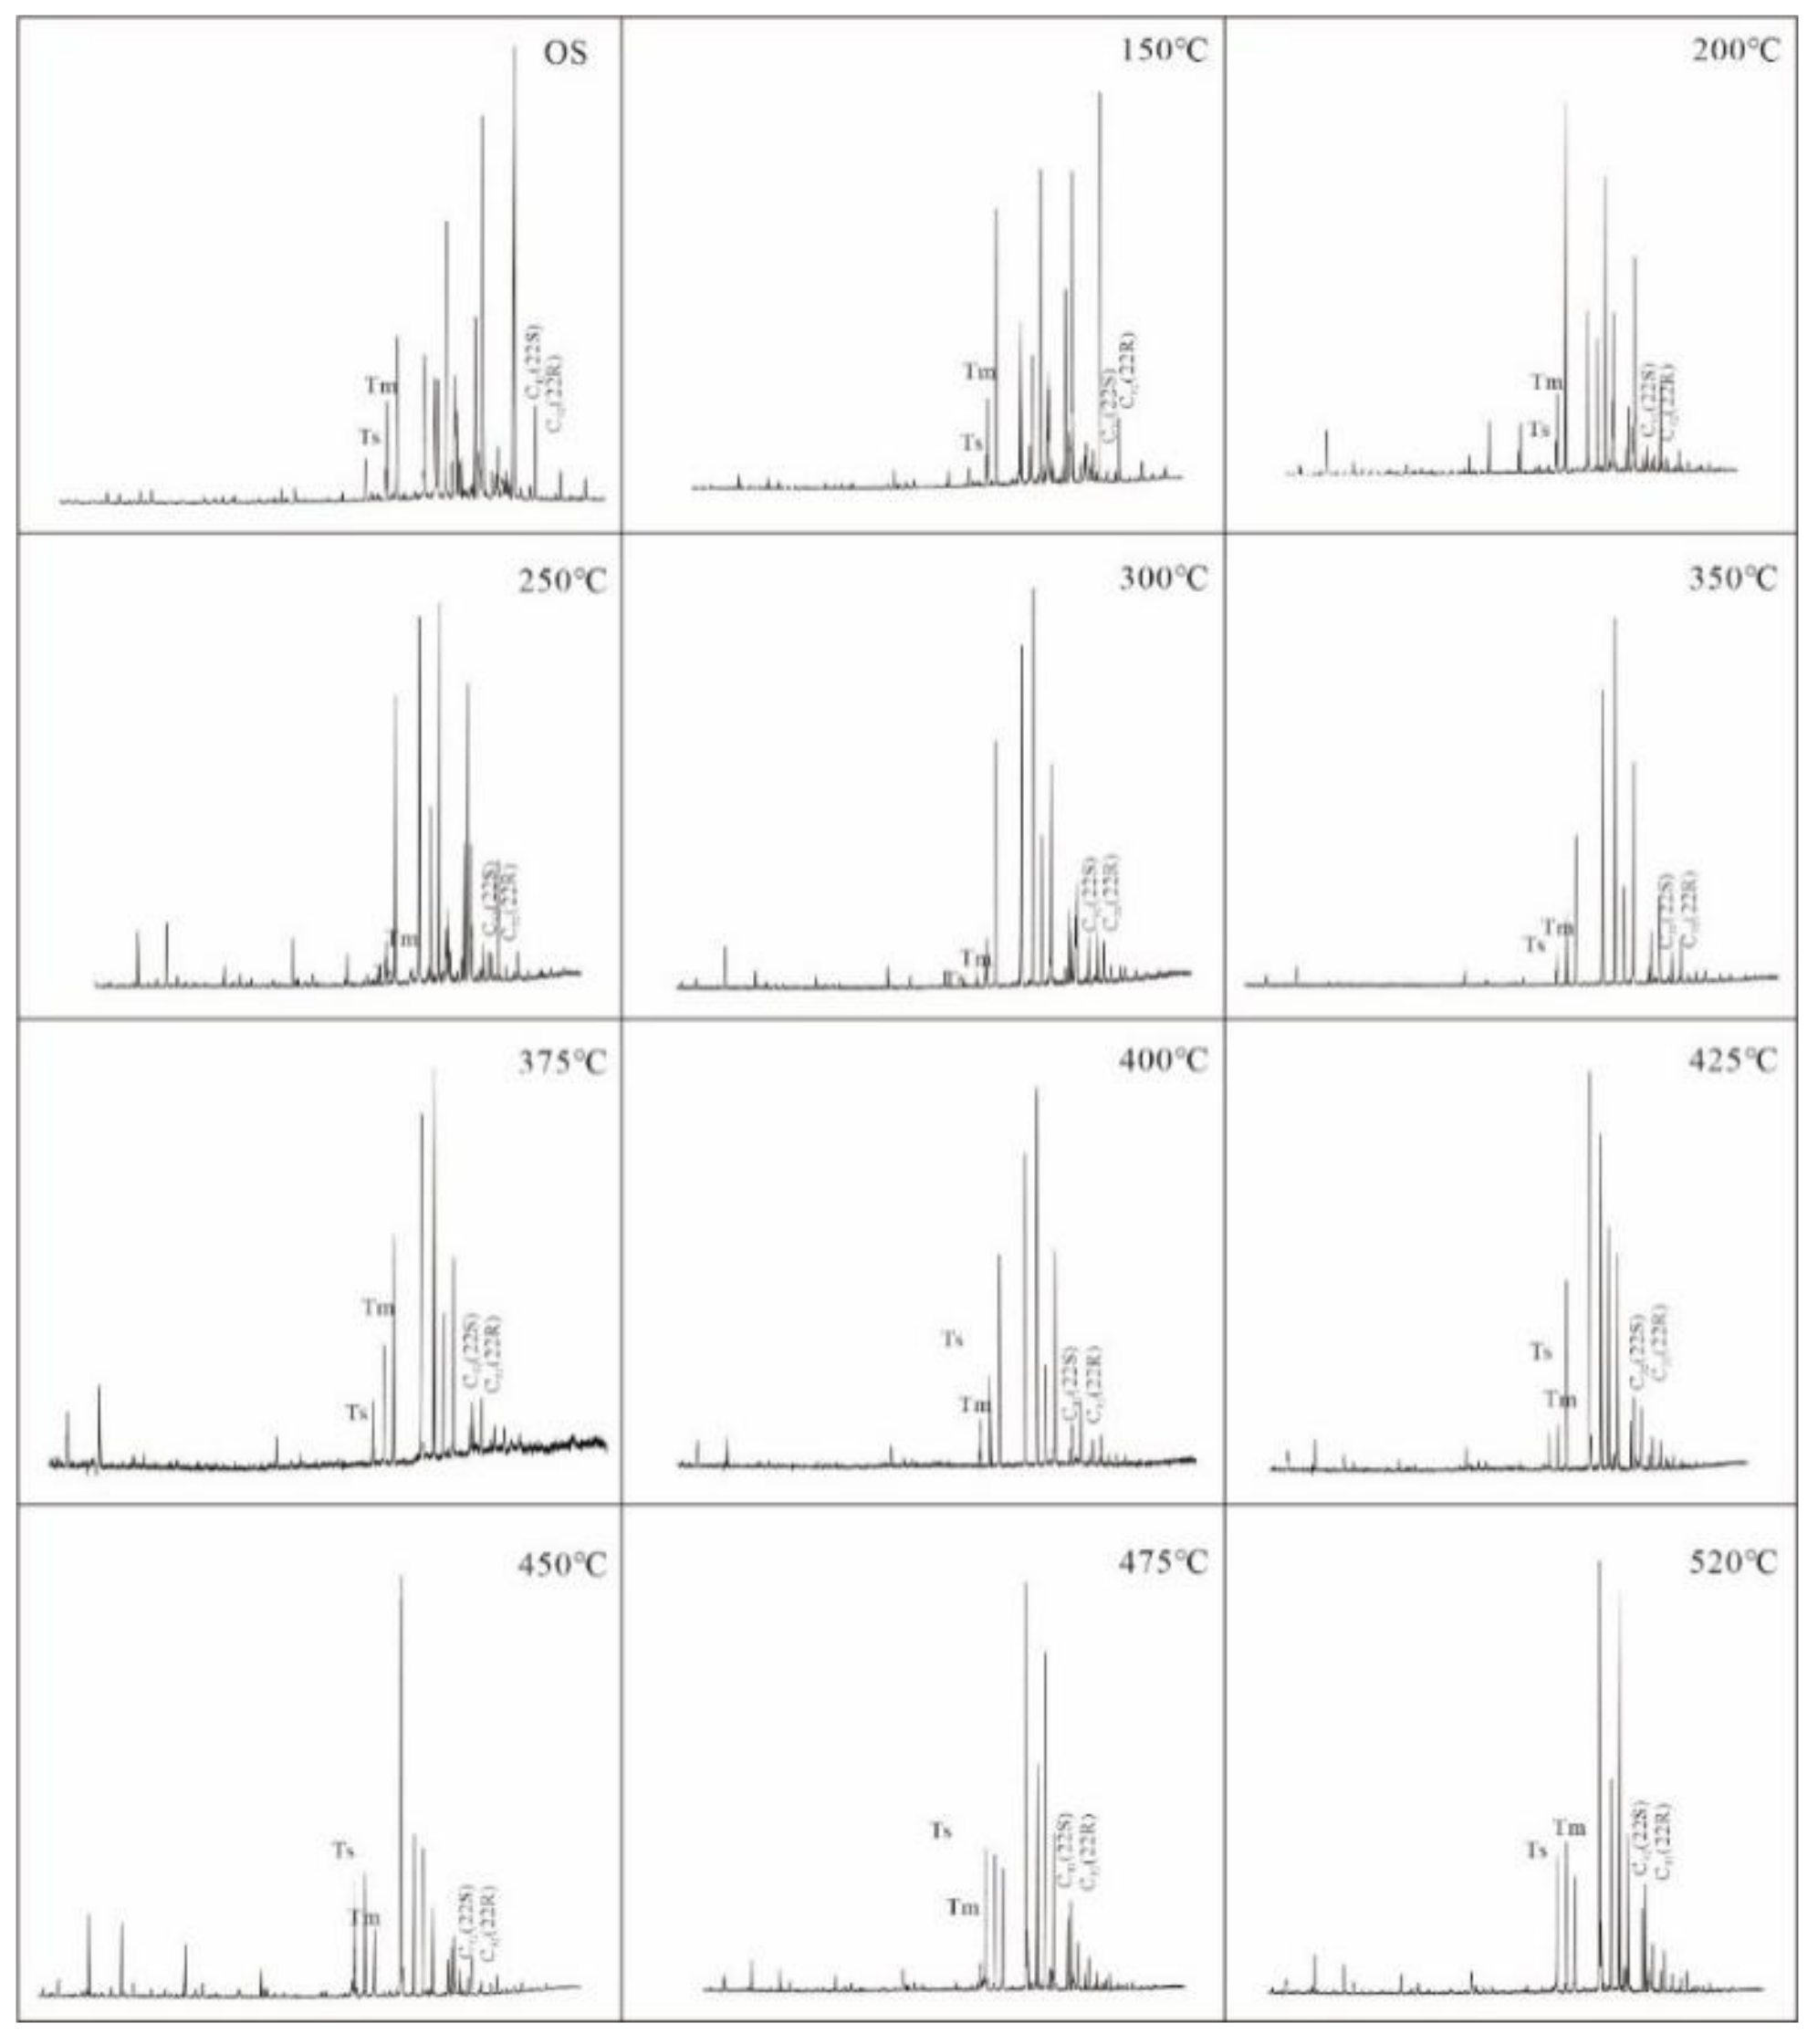
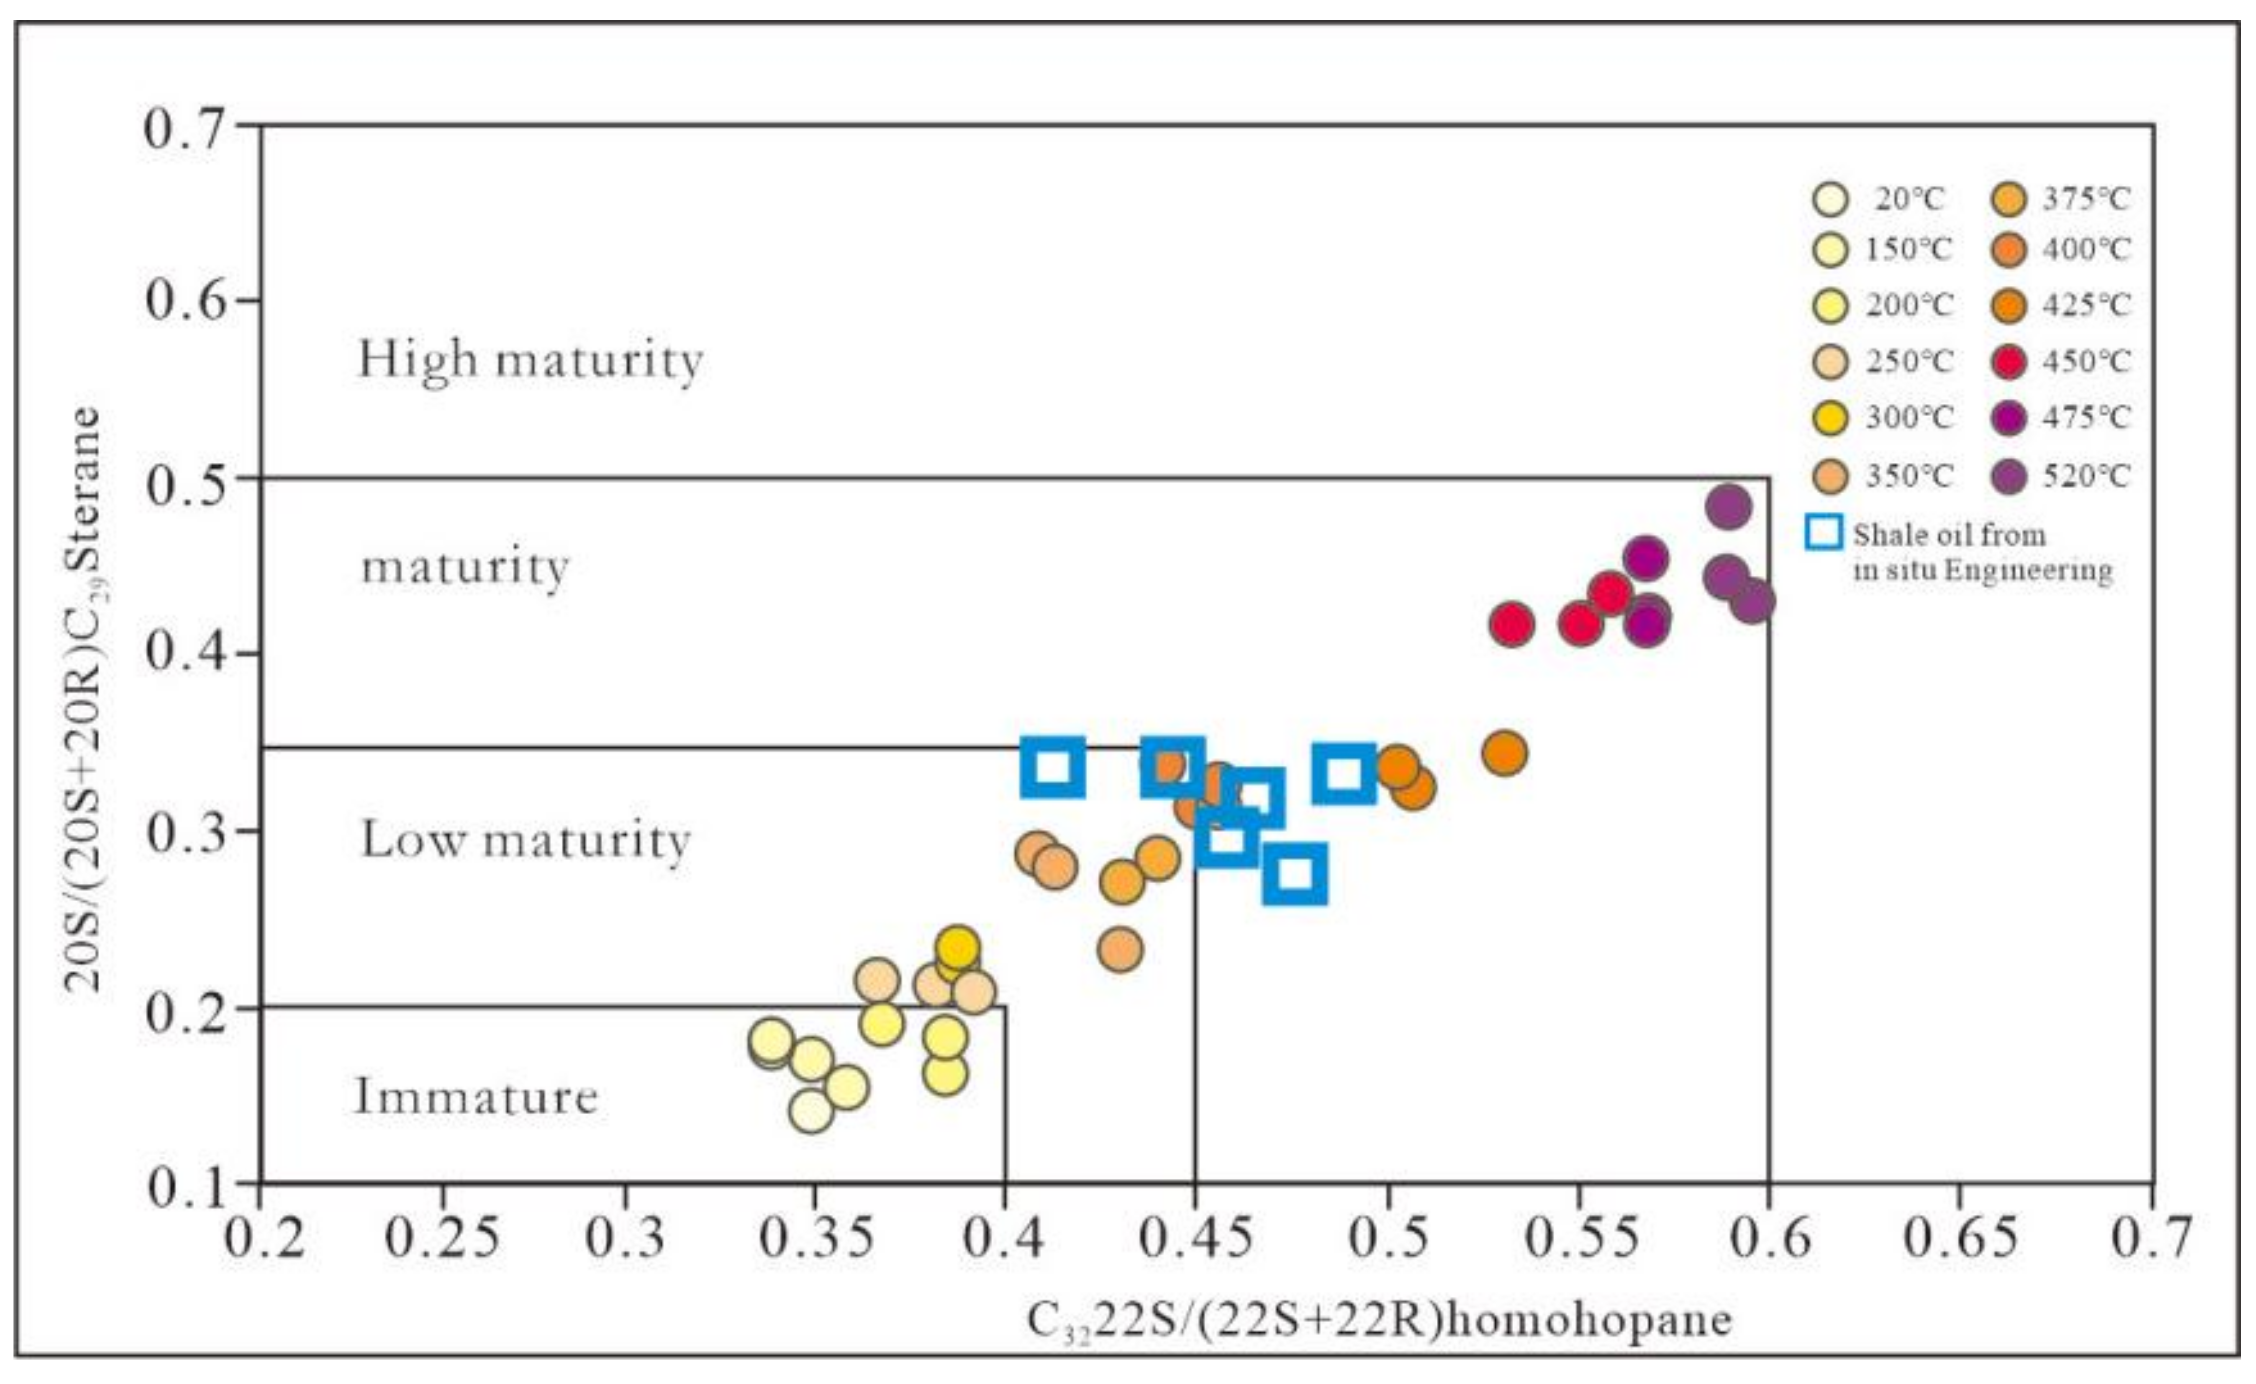
3.2. Biomarker Maturity Parameter of Pyrolysis Oil

When the pyrolysis temperature is lower than 375 °C, a small amount of pyrolysis oil is sealed in the pores of oil shale because the pores in oil shale are nanopores [58,59,60,61]. In this study, oil shale semicoke at all temperature stages was pulverized and subjected to extraction of organics. The semicoke extracts and the pyrolysis oil collected from the simulation experiment were tested for group composition and analysed by GC-MS.
The carbon number distribution ranged from C11 to C33, and the main carbon peak decreased with increasing temperature from C23 to C16. Therefore, the main carbon peak also moved forward (Figure 7). The carbon preference index (CPI) (an odd and even dominance index) values of Nongan samples decreased with increasing pyrolysis temperature, gradually decreased to 1.025 at 400 °C, and reached relatively stable values, all at approximately 1.0 [60].
N-alkanes in organic matter rich in terrigenous clastic rock series have obvious odd carbon predominance. It is generally believed that these n-alkanes are derived from the wax of higher plants, are directly synthesized by plants or are from acid alcohol esters, even with carbon in early diagenesis [48,60,61]. The CPI represents the molecular ratio of odd carbon to even carbon of n-alkanes in the range of C25–C33 [62].
CPI = 1 / 2 C 25 ~ C 33 C 24 ~ C 32 + C 25 ~ C 33 C 26 ~ C 34
As organic matter matured, the carbon preference gradually disappeared and approached 1. The CPI can identify organic matter maturity; the index cannot differentiate between thermal evolution stages.
Biomarkers are mainly used to study the source, maturity and paleosedimentary environment of organic matter in sediments [36,61,62]. In this study, the composition and biomarker characteristics of n-alkanes, isoprenoids, steranes, hopanes and other organic matter in the semicoke and pyrolysis oil of Nenjiang Formation oil shale in Nongan were investigated (Figure 8 and Figure 9; Table 3) and selected to analyze the change in thermal.
A previous study found that the maturity parameter based on the relative stability of C27 hopanes ranged from immature to mature, but it was strongly dependent on the source [36]. The stability of C27 17α-trinorhopane (Tm) is better than that of C27 18α-trinorhopane II (Ts). As organic matter matures, the Ts/(Ts + Tm) value increases. Ts/(Ts + Tm) is a relatively reliable maturity index for evaluating samples from the same source rock location [62]. It was found that the Ts/(Ts + Tm) ratio increases with the increase in pyrolysis temperature. It seems that the value from the ratio increases gradually from 20 to 425 °C [61,62] (Figure 8 and Figure 9, Table 3).
The isomerization index 22S/(22S + SSR) of hopane is feasible to evaluate the maturity from the immature to low maturity [36]. The isomerization of C31–C35 17α-hopane on C-22 can be used to evaluate the maturity of crude oil or asphalt. The biogenic hopane precursor has a 22R configuration, and it gradually transforms into a mixture of 22R and 22S isomers. After the oil generation stage reaches equilibrium, the 22S/(22S + 22R) value remains unchanged, so it is impossible to obtain further maturity information from it [36,61,62,63,64]. The change in hopane C32 22S/(22S + 22R) in Nongan samples in the range of 20–520 °C can be divided into two stages, which increase from 0.341 to 0.447 within 0–400 °C. The hopane C32 22S/(22S + 22R) in samples increases suddenly to 0.52 at 425°C and slowly from 0.52 to 0.584 within 425–520 °C (Figure 8 and Figure 9).
In this study, the CPI and hopane 22S/(22S + 22R) have mutations when the temperature reaches 350–400 °C, indicating the kerogen has reached the maturity stage. The value of Ts/(Ts + Tm) can indicate that the organic matter has never matured to the peak of the oil generation window.
The C29 ααα20R of sterane is the biological configuration of the sterane precursor that exists only in living organisms, while C29 ααα 20S, C29 αββ 20R and C29 αββ 20S have stable chemical structures [36,65]. As the kerogen matures, the C-20 bond of the C29 ααα20R configuration is isomerized. The bond converts the C29 ααα20R configuration to a C29 ααα20S configuration and forms a mixture of 20R and 20S, which increases the ratio of 20S/20 (R + S) of sterane from 0 to 0.5 [36,65,66]. The isomerization of 20 s and 20 R regular steranes at the C-14 and C-17 sites leads to the formation of isomers ββ/(αα + ββ). The ratio increases from nearly 0 to approximately 0.7 with increasing thermal maturity [67,68,69]. This study found that with the increase in pyrolysis temperature, the evolution of sterane C29 20S/20(R + S) and ββ/(αα + ββ) can be subdivided into three stages. In the immature stage of the non-oil shale semicoke, the ββ/(αα + ββ) ratio sample range from 0.165 to 0.214 and from 0.071 to 0.201, respectively, when the pyrolysis temperature is 0–250 °C. The temperature increases gradually and rapidly in the range of 250–450 °C leading to ββ/(αα + ββ) values from 0.243 to 0.424 and from 0.233 to 0.390, respectively. As the pyrolysis temperature continues to increase to 520 °C, only C29 20S/20(R + S) and ββ/(αα + ββ) increase slowly, and this also shows that the kerogen is in the mature stage (Figure 8 and Figure 9, Table 3).

3.3. Feedback of Maturity Parameters on the Progress of the Pyrolysis Reaction

The production and composition of organic products in each stage of oil shale pyrolysis change regularly. Therefore, it is very important to master the process of underground pyrolysis reaction in oil shale in situ conversion project for efficient cracking and maximization of economic benefits. Although the process of pyrolysis reaction can be analyzed by the maturity of oil shale kerogen, the existing theoretical research on oil shale organic matter maturity can only analyze the maturity of oil shale core samples Ro and Tmax [29,30,31,32,33,34,36]. However, drilling and coring in the process of in situ conversion of oil shale not only greatly increases the cost of the project. Moreover, it destroys the underground thermal reaction environment and causes serious disadvantages to the exploitation. In order to realize the dynamic feedback of the in situ pyrolysis process of oil shale, this time, combined with the experience of in situ conversion pilot experiments, it is proposed that oil and gas products can be obtained through production wells during project operation. By testing the maturity information of biomarker compounds of oil and gas products, the reaction process of subsurface oil shale pyrolysis can be feedback.
As shown in Figure 10, as organic matter decreased, six different maturity indicators changed differently with thermal maturity. The Tmax can define the reaction process of oil shale with pyrolysis temperatures at a temperature lower than 425 °C, but the small change in Tmax can be used only as an indicator to judge the maturity stage [29], and it is difficult to give feedback on the kerogen pyrolysis process. In the simulation experiment, the Ro and biomarker compounds at various temperature stages change regularly with the increase in the pyrolysis temperature, especially for the stage of rapid reduction in TOC; these thermal maturity parameters have obvious changes.

3.4. Analysis of Pyrolysis Process of Nong’an Oil Shale In Situ Conversion Project

The pyrolysis oil samples obtained on-site were geochemically tested, including group component separation and GC-MS analysis. The test results of the on-site cracking oil group components revealed that the sum of saturated hydrocarbons and aromatic hydrocarbons accounted for approximately 90%, non-hydrocarbon accounted for 10%, and asphaltene accounted for less than 1% (Table 4). The high-temperature and high-pressure simulation experiment of Nongan oil shale revealed that the proportion of non-hydrocarbon to asphaltene is more than 10% (Figure 6), but the sum of non-hydrocarbons and asphaltene in the group components of pyrolysis oil in the in situ conversion project is lower than 10%. When combined with field project analysis, it is necessary to pass through 66 m of strata from the thermal reaction strata at the bottom of the well to the wellhead of the mining well; this separation may have been due to the large molecular weight of asphaltene and non-hydrocarbon during the migration from the bottom of the well to the surface.
The two collected pyrolysis oils were subjected to group composition tests and GC-MS analysis together, with three parallel samples for each test and six samples in total. The results showed that the carbon number distribution range was between C11 and C33, and the main peak carbon was between C19 and C22. The CPI (the odd-even advantage index) was between 0.95 and 1.07, and the change was not significant. The average values of the two samples were 1.01 and 1.05, respectively, indicating that the organic matter in underground oil shale was mature (Figure 11).
The homohopane isomerization index 22S/(22S + SSR) has high feasibility for evaluating the maturity from the immature to early oil generation stages [65,66]. According to the identification integral of the mass spectrum at m/z = 191, the ratio of the homohopane isomerization index C32 22S/(22S + SSR) of on-site pyrolysis oil samples remained between 0.41 and 0.49, and the average values were 0.45 and 0.47, respectively, reaching the hydrocarbon generation threshold [67,68]. The Ts/(Ts + Tm) ratios of the samples were maintained between 0.41 and 0.46, and the average values of the two samples were 0.43 and 0.44, respectively, which had reached the mature stage (Figure 11, Figure 12 and Figure 13, Table 5). Additionally, this study found that sterane C29 20S/20 (R + S) and ββ/(αα + ββ) were 0.29–0.34 and 0.28–0.34, respectively, indicating that organic matter had entered the mature stage [62,63,64,65,66] (Table 5).
By comparing the maturity parameters of biomarkers in the simulation results of Nongan oil shale, the experimental field data are similar to the simulation data at 400 and 425 °C. The projection plots in Figure 12 and Figure 13 also showed that the field cracking oil projection is uniform and concentrated for the maturity indicator, including the immature to overmature sterane C29 20S/20(R + S) and ββ/(αα + ββ) projection plots. In the isomerization diagram, the input point of hopanoids is relatively dispersed because the indicating ability is only to the hydrocarbon generation threshold, but the lateral concentration is also in the range of 400–425 °C. The target heating formation is in the maturity stage [62,63,64,65,66] (Table 5, Figure 11, Figure 12 and Figure 13).

3.5. Calculation and Application Feasibility of the In Situ Conversion Degree of Nongan Oil Shale

Organic geochemistry of pyrolysis oil samples obtained in the in situ conversion project of the Nongan oil shale was carried out. In summary, the organic matter reaction process of subsurface oil shale in the in situ conversion project of Nongan oil shale is equivalent to the reaction of Nongan oil shale in the high-temperature and high-pressure simulation laboratory in the range of 400–425 °C. The TOC test of the Nongan subsurface oil shale reaction layer shows that the peak period of hydrocarbon generation is in the range of 400–425 °C, which also corresponds to the oil yield in the high-pressure thermal weightlessness experiment and high-pressure distillation experiment. Therefore, the pyrolysis oil is equivalent to the 400–425 °C range of the pyrolysis test samples and should be the best temperature for heating the oil shale formation to the oil production peak [35,36]. The previous paper on the area also points out that 425 °C is the key heating control point, and there is a turning point within 425–450 °C [39]. If heating continues, the input energy is wasted, and the economic benefits are reduced. Therefore, the research on the pyrolysis oil of the mining well in the in situ conversion project of Nongan oil shale reveals that the heating technology used in site construction corresponds to the original purpose of project experiments and has economic value.
In this paper, the analysis of biomarker compounds in pyrolysis oil is essential for the in situ mining of oil shale in other areas. Early resource evaluation should be undertaken, as well as tracking evaluation during the project and evaluation of surplus resource potential at the end of the project. It is necessary to conduct a detailed simulation study on the target horizon in early resource evaluation by comprehensive geochemical research. The geochemical characteristics of hydrocarbon gas and cracked oil samples discharged from mining wells were analyzed during project construction, and the reaction process of organic matter in subsurface oil shale was estimated. The total organic carbon reduction, as well as the oil and gas production rates, were calculated to aid in decision-making for the temperature increase and project process.

4. Conclusions

The results of high-pressure heating experiments show that when the pyrolysis temperature is 300–475 °C, the main emission products are pyrolysis oil, and the TOC of the semicoke sample decreases from 8.06% to 2.65%, and the yield is significantly improved. A transition point appeared between 425 °C and 450 °C, and the TOC of the oil shale above the temperature of the transition point decreased slowly. This temperature node is of great significance for the selection and control of the subsurface temperature during the original production of oil shale.
The research on the parameters of pyrolysis oil biomarker compounds found that the four parameters Ts/(Ts + Tm), C32 22S/(22S + 22R), C29 20S/(20S + 20R), and C29 ββ/(αα + ββ) also have a good feedback effect on the progress of Nongan oil shale pyrolysis reaction.
A comprehensive analysis of the current in situ conversion project of Nongan oil shale shows that the pyrolysis stage of the Nongan oil shale in situ conversion project is equivalent to the 400–425 °C simulated experiment, which is at the peak of the oil window. The heating process that is currently used corresponds to the experimental purpose and has economic value.
If the evolutionary trend of maturity parameters of pyrolysis oil biomarker compounds during in situ conversion of oil shale is studied, and accurate feedback of the maturity of kerogen in the formation is obtained, it can reveal its response principle to the organic matter pyrolysis process. The study is of great significance to the efficient, economic and stable development of oil shale in situ conversion projects.

Author Contributions

Conceptualization, methodology, validation, formal analysis, investigation, resources, H.Z., L.Y., J.S., X.M. and X.C.; data curation, writing—original draft preparation, writing—review and editing, visualization, supervision, project administration, and funding acquisition, W.H. and W.G. All authors have read and agreed to the published version of the manuscript.

Funding

This work was supported by the Sinopec “Key Technologies for In-situ Conversion and Exploitation of Oil Shale” (Grant No. P20066), and the National Key R&D Program of China (Grant No. 2019YFA0705502, Grant No. 2019YFA0705503), and the National Natural Science Fund Project of China (Grant No. 41790453, 4210020395 and 42002153), and the China Postdoctoral Science Foundation (Grant No. 2021M700053).

Acknowledgments

Thanks to my sweetie Chenyang Wu for her contribution and assistance with this study.

Conflicts of Interest

The authors declare no conflict of interest.

References

  1. Dyni, J.R. Geology and Resources of Some World Oil Shale Deposits; US Geological Survey Scientific Investigations: Reston, VA, USA, 2006. [Google Scholar]
  2. Kok, M.V. Oil shale resources in Turkey. Oil Shale 2006, 23, 209–210. [Google Scholar]
  3. Taciuk, W. Does oil shale have a significant future? Oil Shale 2013, 30, 1–5. [Google Scholar] [CrossRef]
  4. Wang, S.; Jiang, X.M.; Han, X.X.; Tong, J.H. Investigation of Chinese oil shale resources comprehensive utilization performance. Energy 2012, 42, 224–232. [Google Scholar] [CrossRef]
  5. Jiang, X.M.; Han, X.X.; Cui, Z.G. New technology for the comprehensive utilization of Chinese oil shale resources. Energy 2007, 32, 772–777. [Google Scholar] [CrossRef]
  6. Han, X.X.; Niu, M.T.; Jiang, X.M. Combined fluidized bed retorting and circulating fluidized bed combustion system of oil shale: 2. Energy and economic analysis. Energy 2014, 74, 788–794. [Google Scholar] [CrossRef]
  7. Altun, N.E.; Hicyilmaz, C.; Wang, J.Y.; Baggi, A.S.; Kok, M.V. Oil shales in the world and Turkey; reserves, current situation and future prospects: A review. Oil Shale 2006, 23, 211–227. [Google Scholar]
  8. Pan, Y.; Zhang, X.M.; Liu, S.H.; Yang, S.C.; Ren, N. A review on technologies for oil shale surface retort. J. Chem. Soc. Pak. 2012, 34, 1331–1338. [Google Scholar]
  9. Pan, S.; Wang, Q.; Bai, J.; Liu, H.; Chi, M.; Cui, D.; Xu, F. Investigation of Behavior of Sulfur in Oil Fractions During Oil Shale Pyrolysis. Energy Fuels 2019, 33, 10622–10637. [Google Scholar] [CrossRef]
  10. Gavrilova, O.; Vilu, R.; Vallner, L. A life cycle environmental impact assessment of oil shale produced and consumed in Estonia. Resour. Conserv. Recycl. 2010, 55, 232–245. [Google Scholar] [CrossRef]
  11. Velts, O.; Uibu, M.; Rudjak, I.; Kallas, J.; Kuusik, R. Utilization of oil shale ash to prepare PCC: Leachibility dynamics and equilibrium in the ash-water system. Energy Procedia 2009, 1, 4843–4850. [Google Scholar] [CrossRef] [Green Version]
  12. Trikkela, A.; Kuusik, R.; Martins, A.; Pihu, T.; Stencel, J.M. Utilization of Estonian oil shale semicoke. Fuel Process. Technol. 2008, 89, 756–763. [Google Scholar] [CrossRef]
  13. Bai, F.T.; Sun, Y.H.; Liu, Y.M.; Guo, M.Y. Evaluation of the porous structure of Huadian oil shale during pyrolysis using multiple approaches. Fuel 2016, 187, 1–8. [Google Scholar] [CrossRef]
  14. Burnham, A.K. Porosity and permeability of Green River oil shale and their changes during retorting. Fuel 2017, 203, 208–213. [Google Scholar] [CrossRef]
  15. Li, L.; Liu, Z.; Sun, P.; Li, Y.; George, S.C. Sedimentary basin evolution, gravity flows, volcanism, and their impacts on the formation of the Lower Cretaceous oil shales in the Chaoyang Basin, northeastern China. Mar. Pet. Geol. 2020, 119, 104472. [Google Scholar] [CrossRef]
  16. He, W.; Sun, Y.; Guo, W.; Shan, X. Controlling the in-situ conversion process of oil shale via geochemical methods: A case study on the Fuyu oil shale, China. Fuel Process. Technol. 2021, 219, 106876. [Google Scholar] [CrossRef]
  17. Cao, H.; Guo, W.; Shan, X.; Ma, L.; Sun, P. Paleolimnological environments and organic accumulation of the Nenjiang formation in the southeastern Songliao basin, China. Oil Shale 2015, 32, 5–24. [Google Scholar] [CrossRef] [Green Version]
  18. Bansal, V.R.; Kumar, R.; Sastry, M.I.S.; Badhe, R.M.; Kapur, G.S.; Saxena, D. Direct estimation of shale oil potential by the structural insight of Indian origin kerogen. Fuel 2019, 241, 410–416. [Google Scholar] [CrossRef]
  19. Burnham, A.K.; Mcconaghy, J.R. Semi-open pyrolysis of oil shale from the garden gulch member of the green river formation. Energy Fuels 2014, 28, 7426–7439. [Google Scholar] [CrossRef]
  20. Jia, J.; Zhou, R.; Liu, Z.; Han, X.; Gao, Y. Organic Matter-Driven Electrical Resistivity of Immature Lacustrine Oil-Prone Shales. Geophysics 2021, 86, 165–178. [Google Scholar] [CrossRef]
  21. Campbell, J.H.; Koskinas, G.H.; Stout, N.D.; Coburn, T.T. Oil shale retorting—Effects of particle size and heating rate on oil evolution and intraparticle oil degradation. Situ 1978, 2, 1–47. [Google Scholar]
  22. Wang, Z.; Lü, X.; Li, Q.; Sun, Y.; Wang, Y.; Deng, S.; Guo, W. Downhole electric heater with high heating efficiency for oil shale exploitation based on a double-shell structure. Energy 2020, 211, 118539. [Google Scholar] [CrossRef]
  23. Guo, W.; Wang, Z.; Sun, Z.; Sun, Y.; Lü, X.; Deng, S.; Qu, L.; Yuan, W.; Li, Q. Experimental investigation on performance of downhole electric heaters with continuous helical baffles used in oil shale in-situ pyrolysis. Appl. Therm. Eng. 2019, 147, 1024–1035. [Google Scholar] [CrossRef]
  24. Burnham, A.K.; Ethan, B.H.; Mary, F.S. Pyrolysis kinetics for Green River oil shale from the saline zone. Fuel 1983, 62, 1199–1204. [Google Scholar] [CrossRef]
  25. Jaber, J.O.; Probert, S.D. Non-isothermal thermogravimetry and decomposition kinetics of two Jordanian oil shales under different processing conditions. Fuel Process. Technol. 2000, 63, 57–70. [Google Scholar] [CrossRef]
  26. Jiang, X.M.; Han, X.X.; Cui, Z.G. Progress and recent utilization trends in combustion of Chinese oil shale. Prog. Energy Combust. Sci. 2007, 33, 552–579. [Google Scholar] [CrossRef]
  27. Zhao, S.; Sun, Y.; Wang, H.; Li, Q.; Guo, W. Modeling and field testing of fracturing fluid back-flow after acid fracturing in unconventional reservoirs. J. Pet. Sci. Eng. 2019, 176, 494–501. [Google Scholar] [CrossRef]
  28. Kök, M.V. Heating rate effect on the DSC kinetics of oil shale. J. Anal. Calorim. 2007, 90, 817–821. [Google Scholar] [CrossRef]
  29. He, W.T.; Sun, Y.H.; Shan, X.L. Geochemical characteristics of the Lower Cretaceous Hengtongshan Formation in the Tonghua Basin, Northeast China: Implications for Depositional Environment and Shale Oil Potential Evaluation. Appl. Sci. 2021, 11, 23. [Google Scholar] [CrossRef]
  30. Cao, H.; He, W.; Chen, F.; Shan, X.; Kong, D.; Hou, Q.; Pu, X. Integrated chemostratigraphy (δ13C-δ34S-δ15N) constrains cretaceous lacustrine anoxic events triggered by marine sulfate input. Chem. Geol. 2021, 559, 119912. [Google Scholar] [CrossRef]
  31. Wang, L.; Yang, D.; Zhao, Y.; Wang, G. Evolution of pore characteristics in oil shale during pyrolysis under convection and conduction heating modes. Oil Shale 2020, 37, 224–241. [Google Scholar] [CrossRef]
  32. Staplin, F.L. Interpretation of thermal history from color of particulate organic matter—A review. Palynology 1977, 1, 9–18. [Google Scholar] [CrossRef]
  33. Wei, G.; Xie, Z.Y.; Bai, G.L.; Li, J.; Wang, Z.H.; Li, A.G.; Li, Z.S. Organic geochemical characteristics and origin of natural gas in Sinian-Lower Paleozoic reservoirs, Sichuan Basin. Nat. Gas Ind. 2014, 34, 44–49. [Google Scholar]
  34. Dhaundiyal, A.; Singh, S.B. Study of Distributed Activation Energy Model using Various Probability Distribution Functions for the Isothermal Pyrolysis Problem. Rud.-Geol.-Naft. Zb. 2017, 32, 1–15. [Google Scholar] [CrossRef] [Green Version]
  35. Peters, K.E.; Moldowan, J.M. The biomarker guide: Interpreting molecular fossils in petroleum and ancient sediments. Choice Rev. Online 1993, 30, 30–2690. [Google Scholar]
  36. Peters, K.E.; Walters, C.C.; Moldowan, J.M. The Biomarker Guide; Cambridge University Press: Cambridge, UK, 2004. [Google Scholar]
  37. Liu, Z.; Sun, P.; Jia, J.; Liu, R.; Meng, Q. Distinguishing features and their genetic interpretation of stratigraphic se-quences in continental deep water setting:A case from Qingshankou Formation in Songliao Basin. Earth Sci. Front. 2011, 18, 171–180, (In Chinese with English abstract). [Google Scholar]
  38. Liu, Z.; Wang, D.; Liu, L.; Liu, W.; Wang, P.; Du, X.; Yang, G. Sedimentary Characteristics of the Cretaceous Songliao Basin. Acta Geol. Sin. 1992, 66, 327–338. [Google Scholar]
  39. He, W.; Sun, Y.; Shan, X.; Cao, H.; Zheng, S.; Su, S. The oil shale formation mechanism of the Songliao Basin Nenjiang Formation triggered by marine transgression and OAE3. Oil Shale 2021, 38, 89–118. [Google Scholar]
  40. He, W.; Sun, Y.; Shan, X. Organic matter evolution in pyrolysis experiments of oil shale under high pressure: Guidance for in-situ conversion of oil shale in the Songliao Basin. J. Anal. Appl. Pyrolysis 2021, 155, 105091. [Google Scholar] [CrossRef]
  41. Caricchi, C.; Corrado, S.; Di Paolo, L.; Aldega, L.; Grigo, D. Thermal maturity of Silurian deposits in the Baltic Syneclise (on-shore Polish Baltic Basin): Contribution to unconventional resources assessment. Ital. J. Geosci. 2016, 135, 383–393. [Google Scholar] [CrossRef]
  42. Li, C.; Huang, W.; Zhou, C.; Chen, Y. Advances on the transition-metal based catalysts for aqua thermolysis upgrading of heavy crude oil. Fuel 2019, 257, 115779. [Google Scholar] [CrossRef]
  43. Li, L.; Liu, Z.; Jiang, L.; George, S.C. Organic petrology and geochemistry of Lower Cretaceous lacustrine sediments in the Chaoyang Basin (Liaoning Province, northeast China): Influence of volcanic ash on algal productivity and oil shale formation. Int. J. Coal Geol. 2021, 233, 103653. [Google Scholar] [CrossRef]
  44. Puig-Gamero, M.; Fernandez-Lopez, M.; Sánchez, P.; Valverde, J.L.; Sanchez-Silva, L. Pyrolysis process using a bench scale high pressure thermobalance. Fuel Process. Technol. 2017, 167, dd345–dd354. [Google Scholar] [CrossRef]
  45. Bai, F.; Sun, Y.; Liu, Y.; Li, Q.; Guo, M. Thermal and kinetic characteristics of pyrolysis and combustion of three oil shales. Energy Convers. Manag. 2015, 97, 374–381. [Google Scholar] [CrossRef]
  46. Cao, H.; He, W.; Chen, F.; Kong, D. Superheavy pyrite in the upper cretaceous mudstone of the Songliao basin, NE China and its implication for paleolimnological environments. J. Asian Earth Sci. 2020, 189, 104156. [Google Scholar] [CrossRef]
  47. Burnham, A.K. Thermomechanical properties of the Garden Gulch Member of the Green River Formation. Fuel 2018, 219, 477–491. [Google Scholar] [CrossRef]
  48. Wang, S.; Jiang, X.; Han, X.; Tong, J.H. Effect of residence time on products yield and characteristics of shale oil and gases produced by low-temperature retorting of Dachengzi oil shale. Oil Shale 2013, 30, 501–516. [Google Scholar] [CrossRef] [Green Version]
  49. Wang, S.; Jiang, X.; Han, X.; Tong, J.H. Effect of retorting temperature on product yield and characteristics of non-condensable gases and shale oil obtained by retorting Huadian oil shales. Fuel Process. Technol. 2014, 121, 9–15. [Google Scholar] [CrossRef]
  50. Wang, L.; Zhao, Y.; Yang, D.; Kang, Z.; Zhao, J. Effect of pyrolysis on oil shale using superheated steam: A case study on the Fushun oil shale, China. Fuel 2019, 253, 1490–1498. [Google Scholar] [CrossRef]
  51. He, W.; Sun, Y.; Shan, X.; Cao, H.; Li, J. Geochemical characteristics and oil generation potential evaluation of lower cretaceous Xiahuapidianzi formation shale in the southeastern sankeyushu depression, Tonghua basin: Evidence from shale pyrolysis experiments and biomarkers. ACS Earth Space Chem. 2021, 5, 409–423. [Google Scholar] [CrossRef]
  52. Burnham, A.K.; Sweeney, J.J. A chemical kinetic model of vitrinite maturation and reflectance. Geochim. Cosmochim. Acta 1989, 53, 2649–2657. [Google Scholar] [CrossRef]
  53. Sweeney, J.J.; Burnham, A.K. Evaluation of a simple model of vitrinite reflectance based on chemical kinetics. Am. Assoc. Pet. Geol. Bull. 1990, 74, 1559–1570. [Google Scholar]
  54. Cao, H.; He, W. Correlation of carbon isotope stratigraphy and paleoenvironmental conditions in the cretaceous Jehol group, northeastern China. Int. Geol. Rev. 2020, 62, 113–128. [Google Scholar] [CrossRef]
  55. Kalkreuth, W.; Sherwood, N.; Cioccari, G.; da Silva, Z.C.; Silva, M.; Zhong, N.; Zufa, L. The application of famm™ (fluorescence alteration of multiples macerals) analyses for evaluating rank of parana basin coals, brazil. Int. J. Coal Geol. 2004, 57, 167–185. [Google Scholar] [CrossRef]
  56. Cheshire, S.; Craddock, P.R.; Xu, G.; Sauerer, B.; Pomerantz, A.E.; McCormick, D.; Abdallah, W. Assessing thermal maturity beyond the reaches of vitrinite reflectance and Rock-Eval pyrolysis: A case study from the Silurian Qusaiba Formation. Int. J. Coal Geol. 2017, 180, 29–45. [Google Scholar] [CrossRef]
  57. Burnham, A.K.; Schmidt, B.J.; Braun, R.L. A test of the parallel reaction model using kinetic measurements on hydrous pyrolysis residues. Org. Geochem. 1995, 23, 931–939. [Google Scholar] [CrossRef]
  58. Shuai, Z.; Xiaoshu, L.; Qiang, L.; Youhong, S. Thermal-fluid coupling analysis of oil shale pyrolysis and displacement by heat-carrying supercritical carbon dioxide. Chem. Eng. J. 2020, 394, 125037. [Google Scholar] [CrossRef]
  59. Seifert, W.K.; Moldowan, J.M. Applications of steranes, terpanes and monoaromatics to the maturation, migration and source of crude oils. Geochim. Cosmochim. Acta 1978, 42, 77–95. [Google Scholar] [CrossRef]
  60. Zhang, K.; Liu, R.; Ding, W.; Li, L.; Liu, Z. The influence of Early Cretaceous paleoclimate warming event on sedimentary environment evolution and organic matter sources in Yin’e Basin: Evidence from petrology and molecular geochemistry. Int. J. Coal Geol. 2022, 254, 103972. [Google Scholar] [CrossRef]
  61. Jia, J.; Liu, Z. Particle-Size Fractionation and Thermal Variation of Oil Shales in the Songliao Basin, NE China: Implication for Hydrocarbon-Generated Process. Energies 2021, 14, 7191. [Google Scholar] [CrossRef]
  62. Zhao, S.; Sun, Y.; Lü, X.; Li, Q. Energy consumption and product release characteristics evaluation of oil shale non-isothermal pyrolysis based on TG-DSC. J. Pet. Sci. Eng. 2020, 187, 494–501. [Google Scholar] [CrossRef]
  63. Kolaczkowska, E.; Slougui, N.-E.; Watt, D.S.; Marcura, R.E.; Moldwan, J.M. Thermodynamic stability of various alkylated, dealkylated, and rearranged 17α and 17β hopane isomers using molecular mechanics calculations. Org. Geochem. 1990, 16, 1033–1038. [Google Scholar] [CrossRef]
  64. Ensminger, A.; Albrecht, P.; Ourisson, G.; Tissot, B. Evolution of polycyclic alkanes under the effect of burial (Early Toarcian shales, Paris Basin). In Advances in Organic Geochemistry 1975; Enadimsa: Madrid, Spain, 1977; pp. 45–52. [Google Scholar]
  65. Wang, L.; Yang, D.; Kang, Z. Evolution of permeability and mesostructure of oil shale exposed to high-temperature water vapor. Fuel 2021, 290, 119786. [Google Scholar] [CrossRef]
  66. Mackenzie, A.S. Application of Biological Markers in Petroleum Geochemistry; Academic Press: London, UK, 1984. [Google Scholar]
  67. Song, Y.; Li, S.; Hu, S. Warm-humid paleoclimate control of salinized lacustrine organic-rich shale deposition in the Oligocene Hetaoyuan Formation of the Biyang Depression, East China. Int. J. Coal Geol. 2019, 202, 69–84. [Google Scholar] [CrossRef]
  68. Peters, K.E.; Moldowan, J.M. The biomarker guide: Interpreting molecular fossils. In Petroleum and Ancient Sediments; Prentice Hall: Hoboken, NJ, USA, 1993; Volume 363. [Google Scholar]
  69. Peters, K.E. Guidelines for evaluating petroleum source rock using programmed pyrolysis. Am. Assoc. Pet. Geol. Bull. 1986, 70, 318–329. [Google Scholar]
Figure 1. Experiment flow chart.
Energies 15 03715 g001
Figure 2. Geological map of the Songliao Basin.
Energies 15 03715 g002
Figure 3. Stratigraphic log of the Nongan oil shale.
Energies 15 03715 g003
Figure 4. Scheme for the Nongan oil shale in situ conversion technology.
Energies 15 03715 g004
Figure 5. Nongan pyrolysis oil yield.
Energies 15 03715 g005
Figure 6. Variation in the pyrolysis oil composition.
Energies 15 03715 g006
Figure 7. TIC diagrams in each stage.
Energies 15 03715 g007
Figure 8. MS at different temperatures with mass chromatogram m/z = 191.
Energies 15 03715 g008
Figure 9. MS at different temperatures with mass chromatogram m/z = 217.
Energies 15 03715 g009
Figure 10. The changes in the six maturities and TOC contents of Nongan samples at different pyrolysis temperatures.
Energies 15 03715 g010
Figure 11. GC-MS analysis of field oil shale pyrolysis oil and 400–425 °C simulated pyrolysis oil samples.
Energies 15 03715 g011
Figure 12. Analysis of C29 sterane 20S/(20S + 20R) and C29 sterane ββ/(αα + ββ) on maturity.
Energies 15 03715 g012
Figure 13. Analysis of C29 sterane 20S/(20S + 20R) and C32 hopane 22S/(22S + 22R) on maturity.
Energies 15 03715 g013
Table 1. Results of pyrolysis products at different temperatures.
Pyrolysis Temperature (°C)Oil Yield (wt%)Moisture Content (wt%)Semicoke Yield (wt%)Gas and Loss (wt%)
15000.7898.830.39
20000.9698.390.65
2500.161.7397.680.43
3000.762.796.160.38
3501.253.4693.891.4
3751.533.8693.431.18
4001.764.3692.910.97
4252.554.8390.881.74
4506.245.3187.021.43
4756.376.5682.354.72
5206.586.5582.464.41
Table 2. TOC, Ro and Tmax values of Nongan samples at different pyrolysis temperatures.
Pyrolysis Temperature, °CTOC, wt%Ro, %Tmax, °C
original sample8.090.266430
1507.460.284433
2006.840.455437
2506.590.584439
3006.220.643440
3504.550.846440
3753.780.864441
4003.410.887443
4252.940.946445
4502.881.143566
4752.651.257590
5202.631.376600
Table 3. Geochemical parameters of Nongan oil shale samples at different pyrolysis stages.
Area-Pyrolysis TemperatureSample PropertiesOil ContentPyrolysis Oil Group ComponentsN-Alkanes and IsoprenoidsTerpanes (m/z = 191)Steranes and Rearranged Steranes (m/z = 217)
Saturated Hydrocarbon %Aromatic Hydrocarbon %Non Hydrocarbon + Asphaltene%CPITs/(Ts + Tm)C32 22S/(22S + 22R)C29 20S/(20S + 20R)C29 ββ/(αα + ββ)
123Average123Average123ave123Average123Average
NA-0Oil shale semi coke0.160.060.150.791.591.951.861.80.150.090.110.120.340.340.350.340.180.180.140.170.080.070.070.07
NA-1500.110.080.020.91.541.731.781.680.150.150.170.150.350.340.360.350.170.180.160.170.060.110.080.08
NA-2000.460.160.220.621.431.371.461.420.170.20.170.180.370.380.380.370.190.160.180.180.160.160.220.18
NA-2500.470.250.1240.6261.311.291.381.320.260.240.270.260.370.380.390.380.220.220.210.210.190.210.210.2
NA-3000.550.240.140.621.281.131.191.20.280.310.290.290.380.380.390.380.230.240.260.240.230.220.250.23
NA-3500.390.260.230.511.161.061.031.080.30.290.310.30.410.410.430.420.270.270.230.260.250.240.270.25
NA-375Pyrolysis oil 0.630.20.170.940.981.161.030.350.320.320.330.440.430.460.440.290.280.310.290.280.270.310.28
NA-400 0.630.280.090.850.771.050.890.440.430.430.430.450.440.460.450.320.340.310.320.290.340.340.32
NA-425 0.630.250.120.941.130.991.020.480.450.470.460.520.510.530.520.320.340.340.330.360.390.360.37
NA-450 0.660.210.131.081.050.911.020.570.550.540.550.530.550.560.550.420.410.440.420.40.40.370.39
NA-475 0.670.220.111.070.970.860.970.620.590.630.610.570.570.570.570.450.420.420.430.410.430.430.42
NA-520 0.670.140.190.951.081.161.060.630.630.610.620.580.580.590.580.490.440.430.450.50.460.530.5
Table 4. Composition of pyrolysis oil in the Nongan in situ conversion project.
SampleAsphaltene, %Saturated Hydrocarbon, %Aromatic Hydrocarbon, %Non-Hydrocarbon, %
NA 10.5160.2630.428.80
NA 20.8254.7035.219.25
Table 5. Geochemical parameters of field pyrolysis oil.
SampleN-Alkanes and IsoprenoidsTerpanes (m/z = 191)Steranes and Rearranged Steranes (m/z = 217)
CPITs/(Ts + Tm)C32 22S/(22S + 22R)C29 20S/(20S + 20R)C29ββ/(αα + ββ)
12 3 Average12 3 Average12 3 Average12 3 Average12 3 Average
NA-11.071.041.051.050.460.410.460.440.460.470.410.450.310.330.330.320.280.310.330.31
NA-21.020.951.061.010.420.460.410.430.480.440.490.470.290.340.340.320.300.320.340.32
Publisher’s Note: MDPI stays neutral with regard to jurisdictional claims in published maps and institutional affiliations.

