
Mechanical and Thermal Properties of 3D Printed Polycarbonate


 , and
, and 
Abstract
:1. Introduction
2. Experimental Layout
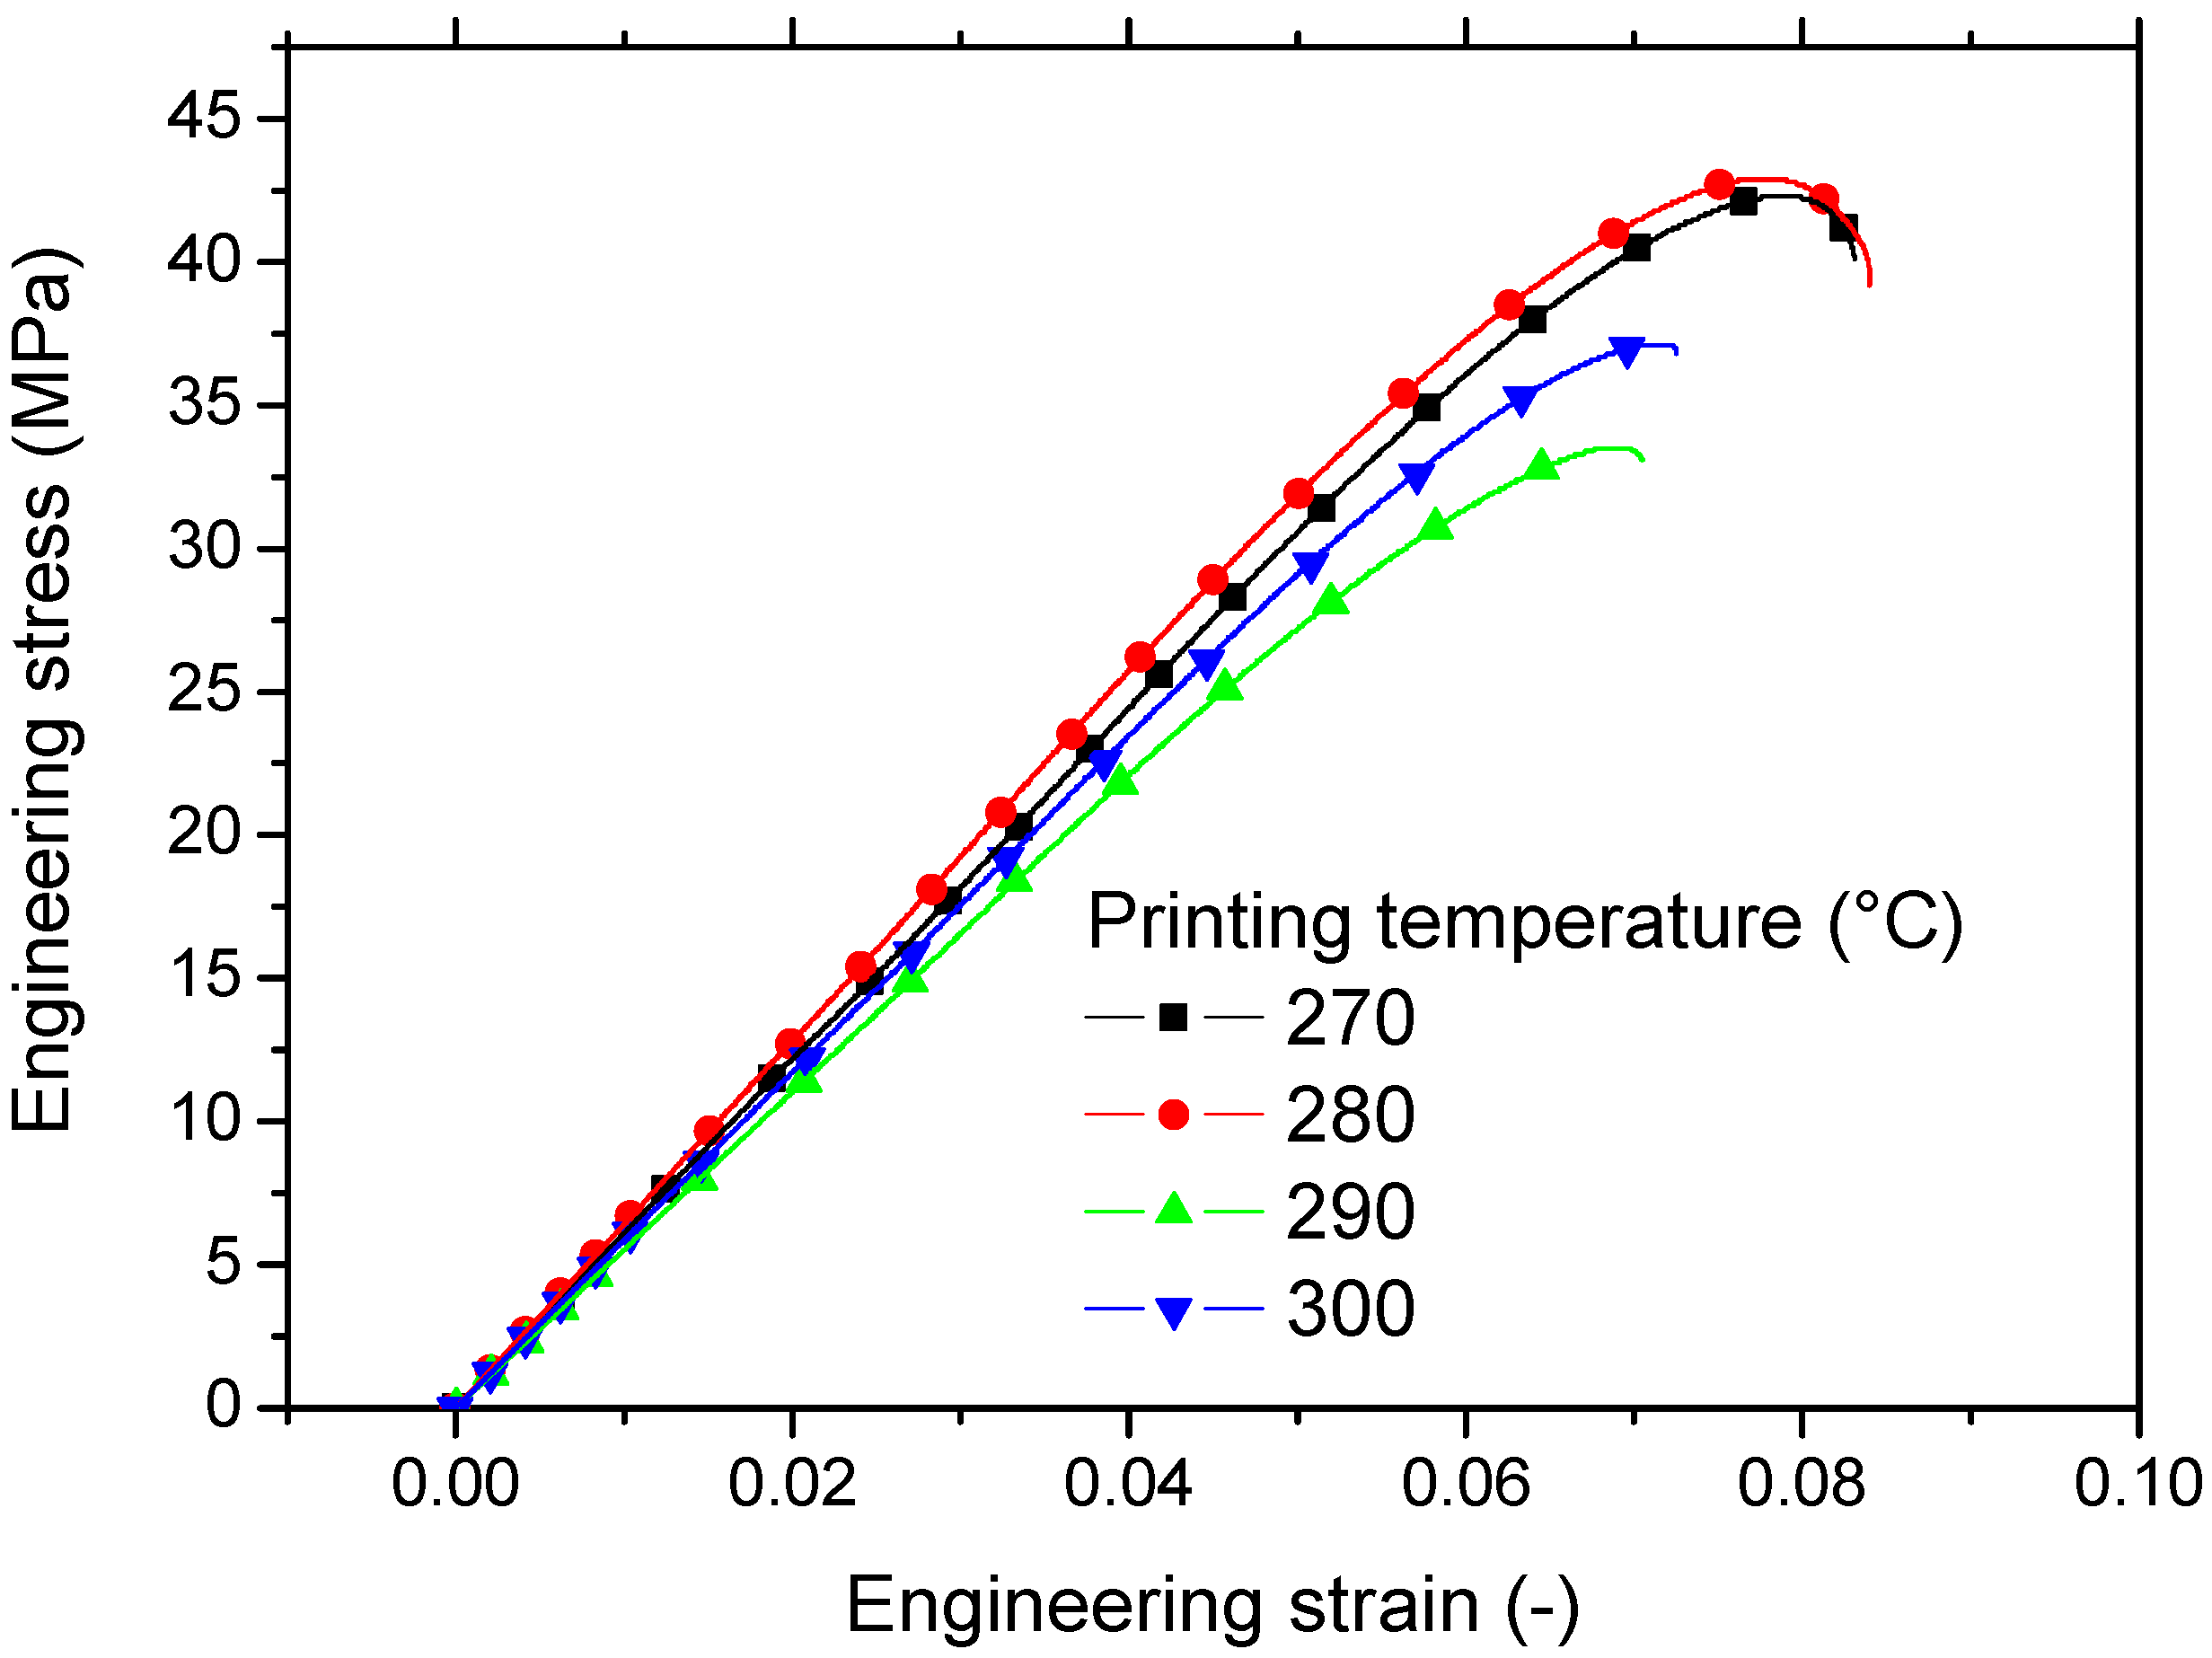
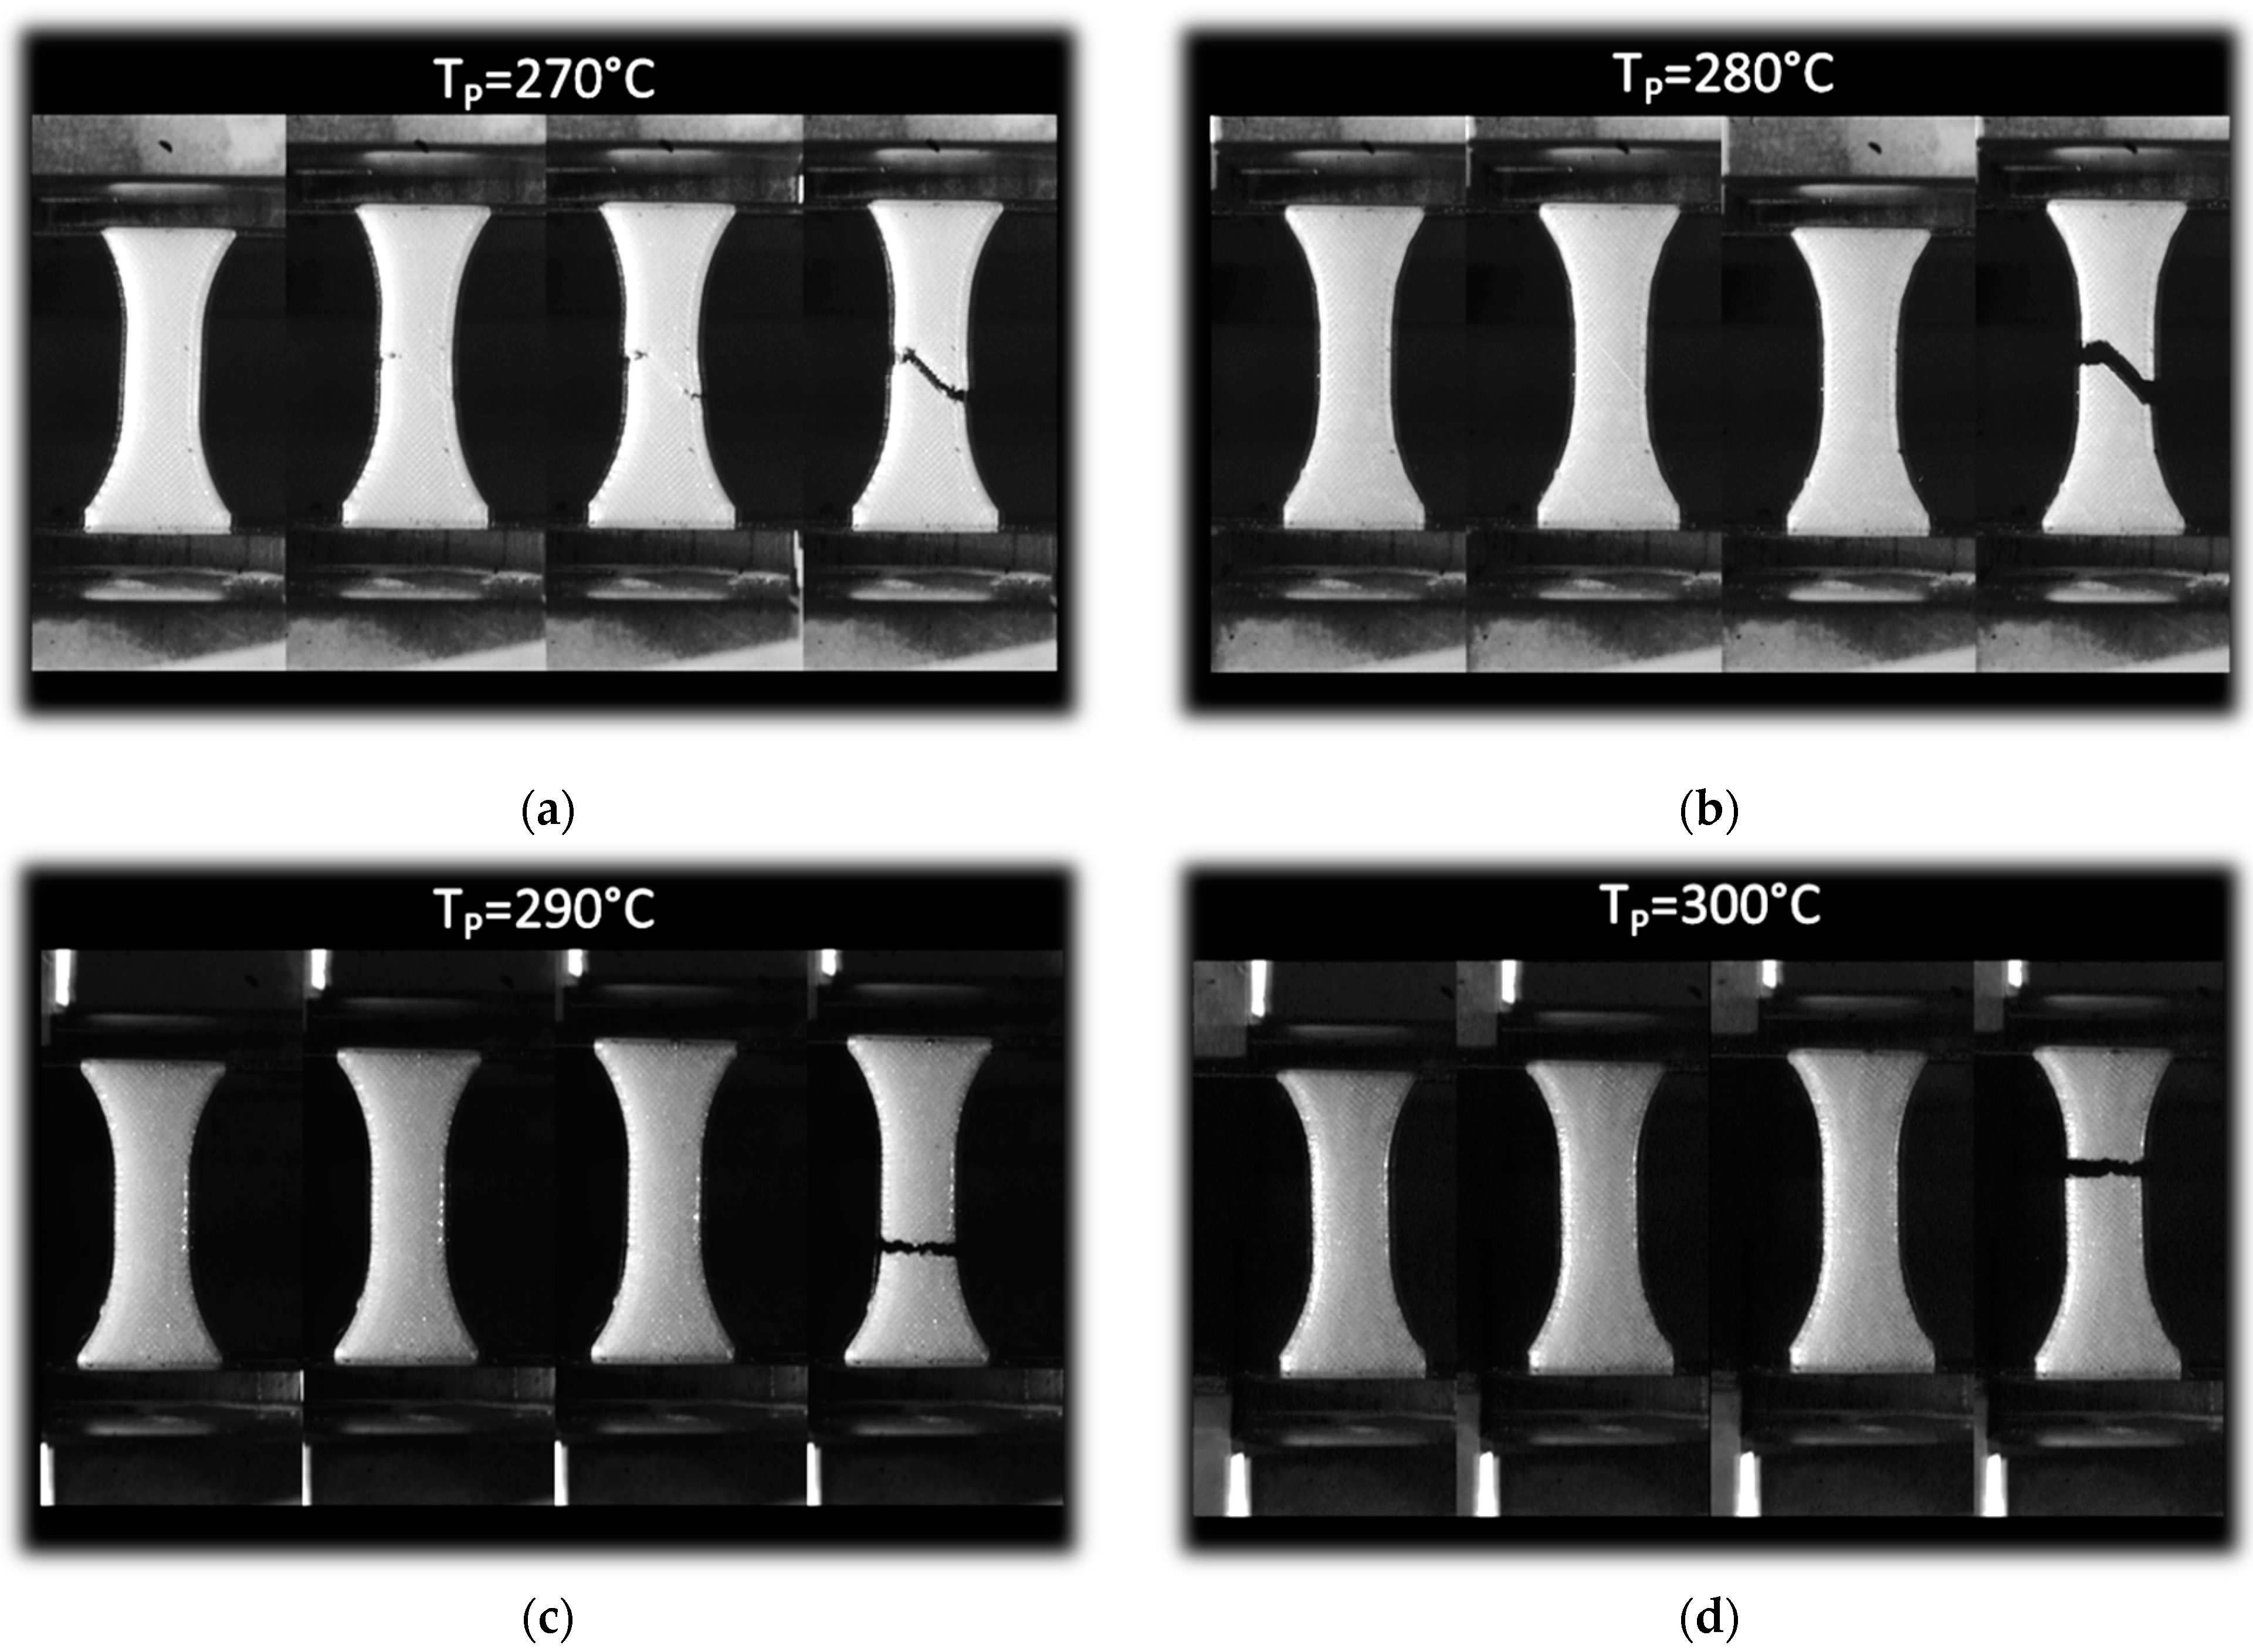
3. Results and Discussion
4. Conclusions
Author Contributions
Funding
Data Availability Statement
Acknowledgments
Conflicts of Interest
References
- Kaynakli, O. A review of the economical and optimum thermal insulation thickness for building applications. Renew. Sustain. Energy Rev. 2012, 16, 415–425. [Google Scholar] [CrossRef]
- Eurostat. Energy Consumption in Households (EU-28, 2016 Data); Eurostat: Luxembourg, 2016. [Google Scholar]
- Villasmil, W.; Fischer, L.J.; Worlitschek, J. A review and evaluation of thermal insulation materials and methods for thermal energy storage systems. Renew. Sustain. Energy Rev. 2019, 103, 71–84. [Google Scholar] [CrossRef]
- Aditya, L.; Mahlia, T.M.I.; Rismanchi, B.; Ng, H.M.; Hasan, M.H.; Metselaar, H.S.C.; Muraza, O.; Aditiya, H.B. A review on insulation materials for energy conservation in buildings. Renew. Sustain. Energy Rev. 2017, 73, 1352–1365. [Google Scholar] [CrossRef]
- Mort, R.; Vorst, K.; Curtzwiler, G.; Jiang, S. Biobased foams for thermal insulation: Material selection, processing, modelling, and performance. RSC Adv. 2021, 11, 4375–4394. [Google Scholar] [CrossRef] [PubMed]
- Łach, M. Geopolymer Foams—Will They Ever Become a Viable Alternative to Popular Insulation Materials?—A Critical Opinion. Materials 2021, 14, 3568. [Google Scholar] [CrossRef] [PubMed]
- Belhabib, S.; Guessasma, S. Compression performance of hollow structures: From topology optimisation to design 3D printing. Int. J. Mech. Sci. 2017, 133, 728–739. [Google Scholar] [CrossRef]
- Liu, T.; Guessasma, S.; Zhu, J.; Zhang, W.; Belhabib, S. Functionally graded materials from topology optimisation and stereolithography. Eur. Polym. J. 2018, 108, 199–211. [Google Scholar] [CrossRef]
- Carson, J.K.; Lovatt, S.J.; Tanner, D.J.; Cleland, A.C. An analysis of the influence of material structure on the effective thermal conductivity of theoretical porous materials using finite element simulations. Int. J. Refrig. 2003, 26, 873–880. [Google Scholar] [CrossRef]
- Nazir, A.; Jeng, J.-Y. A high-speed additive manufacturing approach for achieving high printing speed and accuracy. Proc. Inst. Mech. Eng. Part C J. Mech. Eng. Sci. 2019, 234, 2741–2749. [Google Scholar] [CrossRef]
- Löffler, R.; Koch, M. Innovative Extruder Concept for Fast and Efficient Additive Manufacturing. IFAC-Pap. 2019, 52, 242–247. [Google Scholar] [CrossRef]
- Ali, M.H.; Mir-Nasiri, N.; Ko, W.L. Multi-nozzle extrusion system for 3D printer and its control mechanism. Int. J. Adv. Manuf. Technol. 2015, 86, 999–1010. [Google Scholar] [CrossRef]
- Paolini, A.; Kollmannsberger, S.; Rank, E. Additive manufacturing in construction: A review on processes, applications, and digital planning methods. Addit. Manuf. 2019, 30, 100894. [Google Scholar] [CrossRef]
- Vyavahare, S.; Teraiya, S.; Panghal, D.; Kumar, S. Fused deposition modelling: A review. Rapid Prototyp. J. 2020, 26, 176–201. [Google Scholar] [CrossRef]
- Bakır, A.A.; Atik, R.; Özerinç, S. Mechanical properties of thermoplastic parts produced by fused deposition modeling:a review. Rapid Prototyp. J. 2021, 27, 537–561. [Google Scholar] [CrossRef]
- Guessasma, S.; Zhang, W.; Zhu, J.; Belhabib, S.; Nouri, H. Challenges of additive manufacturing technologies from an optimisation perspective. Int. J. Simul. Multidiscip. Des. Optim. 2016, 6, A9. [Google Scholar] [CrossRef] [Green Version]
- Szykiedans, K.; Credo, W. Mechanical Properties of FDM and SLA Low-cost 3-D Prints. Procedia Eng. 2016, 136, 257–262. [Google Scholar] [CrossRef] [Green Version]
- Agron, D.J.S.; Lee, J.-M.; Kim, D.-S. Nozzle Thermal Estimation for Fused Filament Fabricating 3D Printer Using Temporal Convolutional Neural Networks. Appl. Sci. 2021, 11, 6424. [Google Scholar] [CrossRef]
- Vidakis, N.; Petousis, M.; Velidakis, E.; Spiridaki, M.; Kechagias, J.D. Mechanical Performance of Fused Filament Fabricated and 3D-Printed Polycarbonate Polymer and Polycarbonate/Cellulose Nanofiber Nanocomposites. Fibers 2021, 9, 74. [Google Scholar] [CrossRef]
- Gupta, A.; Fidan, I.; Hasanov, S.; Nasirov, A. Processing, mechanical characterization, and micrography of 3D-printed short carbon fiber reinforced polycarbonate polymer matrix composite material. Int. J. Adv. Manuf. Technol. 2020, 107, 3185–3205. [Google Scholar] [CrossRef]
- 3D, V.I. FDM 3D Printers. Available online: https://imprimante-3d-volumic.com/imprimante-3d-francaise/ (accessed on 21 March 2022).
- Abouzaid, K.; Guessasma, S.; Belhabib, S.; Bassir, D.; Chouaf, A. Printability of co-polyester using fused deposition modelling and related mechanical performance. Eur. Polym. J. 2018, 108, 262–273. [Google Scholar] [CrossRef]
- Guessasma, S.; Belhabib, S.; Nouri, H.; Ben Hassana, O. Anisotropic damage inferred to 3D printed polymers using fused deposition modelling and subject to severe compression. Eur. Polym. J. 2016, 85, 324–340. [Google Scholar] [CrossRef]
- Zwick/Roell. Tensile Testing Machines and Testers. Available online: https://www.zwickroell.com/products/static-materials-testing-machines/universal-testing-machines-for-static-applications/tensile-tester/ (accessed on 21 March 2022).
- Photonlines. Scientific Cameras. Available online: https://photonlines-recherche.fr/categorie-produit/physique-photonique/cameras-scientifiques/ (accessed on 21 March 2022).
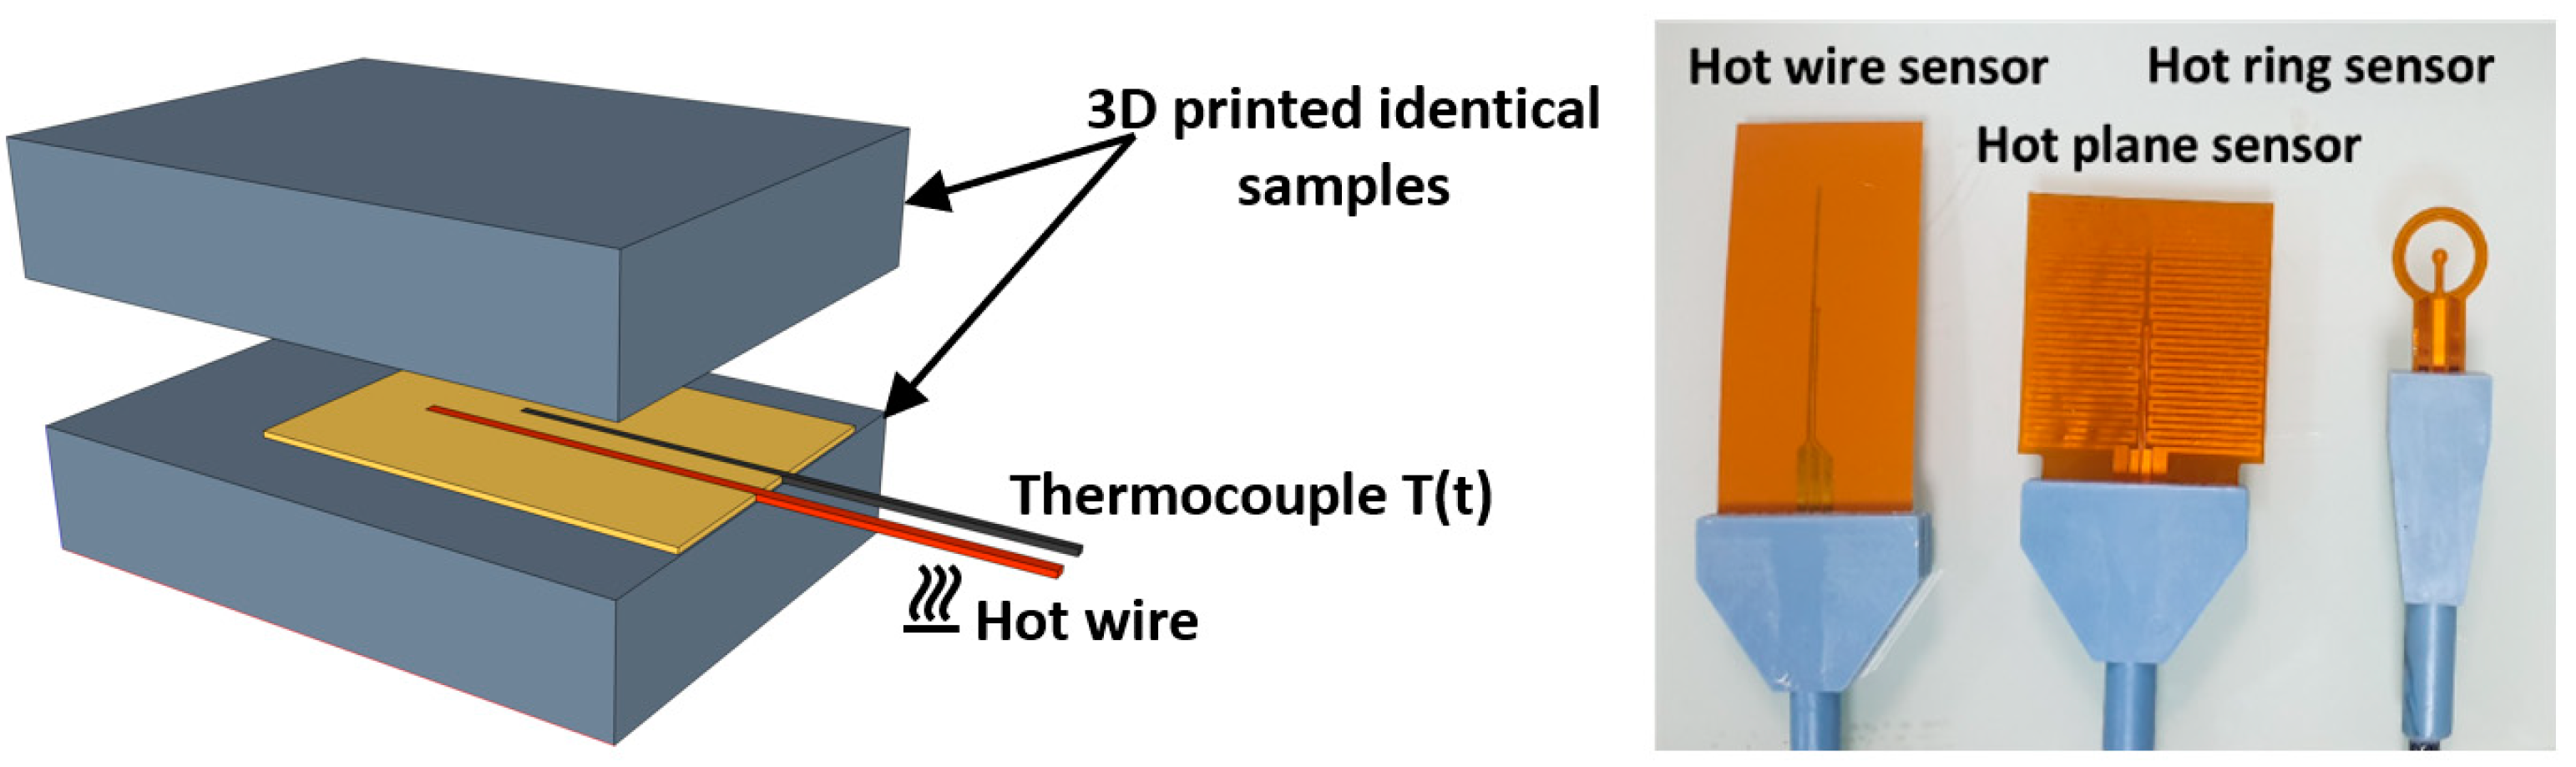
- ASTM. D 5930–97; Standard Test Method for Thermal Conductivity of Plastics by Means of a Transient Line-Source Technique. American Society for Testing and Materials: West Conshohocken, PA, USA, 2009.
- Marinos, P.G.K.; Tsiambaos, G.C.; Stournaras, H.C. Engineering Geology and the Environment. In Proceedings of the International Symposium on Engineering Geology and the Environmment Greek National Group IAEG, Athens, Greece, 23–27 June 1997; Balkema/Rotterdam/Brookfield: Athens, Greece, 1997. [Google Scholar]
- Guessasma, S.; Belhabib, S.; Altin, A. On the Tensile Behaviour of Bio-Sourced 3D-Printed Structures from a Microstructural Perspective. Polymers 2020, 12, 1060. [Google Scholar] [CrossRef] [PubMed]
- Benmahiddine, F.; Bennai, F.; Cherif, R.; Belarbi, R.; Tahakourt, A.; Abahri, K. Experimental investigation on the influence of immersion/drying cycles on the hygrothermal and mechanical properties of hemp concrete. J. Build. Eng. 2020, 32, 101758. [Google Scholar] [CrossRef]
- Seng, B.; Magniont, C.; Lorente, S. Characterization of a precast hemp concrete. Part I: Physical and thermal properties. J. Build. Eng. 2019, 24, 100540. [Google Scholar] [CrossRef]
- Mazhoud, B.; Collet, F.; Pretot, S.; Chamoin, J. Hygric and thermal properties of hemp-lime plasters. Build. Environ. 2016, 96, 206–216. [Google Scholar] [CrossRef]
- Gourlay, E.; Glé, P.; Marceau, S.; Foy, C.; Moscardelli, S. Effect of water content on the acoustical and thermal properties of hemp concretes. Constr. Build. Mater. 2017, 139, 513–523. [Google Scholar] [CrossRef]


| Category | Characteristics | Value |
|---|---|---|
| Mechanical properties | Density, (g/cm3) | 1.13 g/cm3 (ASTM D792) |
| Tensile modulus | 700 MPa (ISO 527) | |
| Flexual modulus | 2000 MPa (ISO 178) | |
| Elongation at break | 120% (ISO 527) | |
| IZOD1 impact testing (notched) | 65 kJ/m2 | |
| Thermal properties | MFI 1 | 10 g/10 min (300 °C, 1.2 kg/D1238) |
| HDT 2 | 144 °C (D648 @ 4.6 kg/cm2), 50 °C (D648 @ 18.6 kg/cm2) | |
| Thermal expansion | 5.5 × 10⁻⁵ mm/mm/°C (D696) | |
| Flammability | V-0 UL 94 @ 3.0 mm | |
| Fusion T° | 300 °C | |
| Tg | 120 °C | |
| Electric properties | Resistivity volume | 4 × 10¹⁶ Ω·cm (D257) |
| Dielectric strength | 2.80 D150 | |
| Dissipation factor | 0.0082 D150 | |
| ARC resistance | 120 s | |
| Recommended printing conditions | Extrusion T° | 260–290 °C |
| Plate T° | 100–140 °C | |
| Enclosure T° | >100 °C | |
| Nozzle | All | |
| Printing Speed | 20–60 mm/s | |
| Diameter | 1.75 & 2.85 mm ± 50 µm | |
| Warping | 0.5 to 0.7% | |
| Humidity abs. | 0.15% (D570) | |
| Linear weight | 2.73 @ Ø 1.75 mm 7.23 @ Ø 2.85 mm | |
| Colours | Translucid, white, black |
| Parameter | Value |
|---|---|
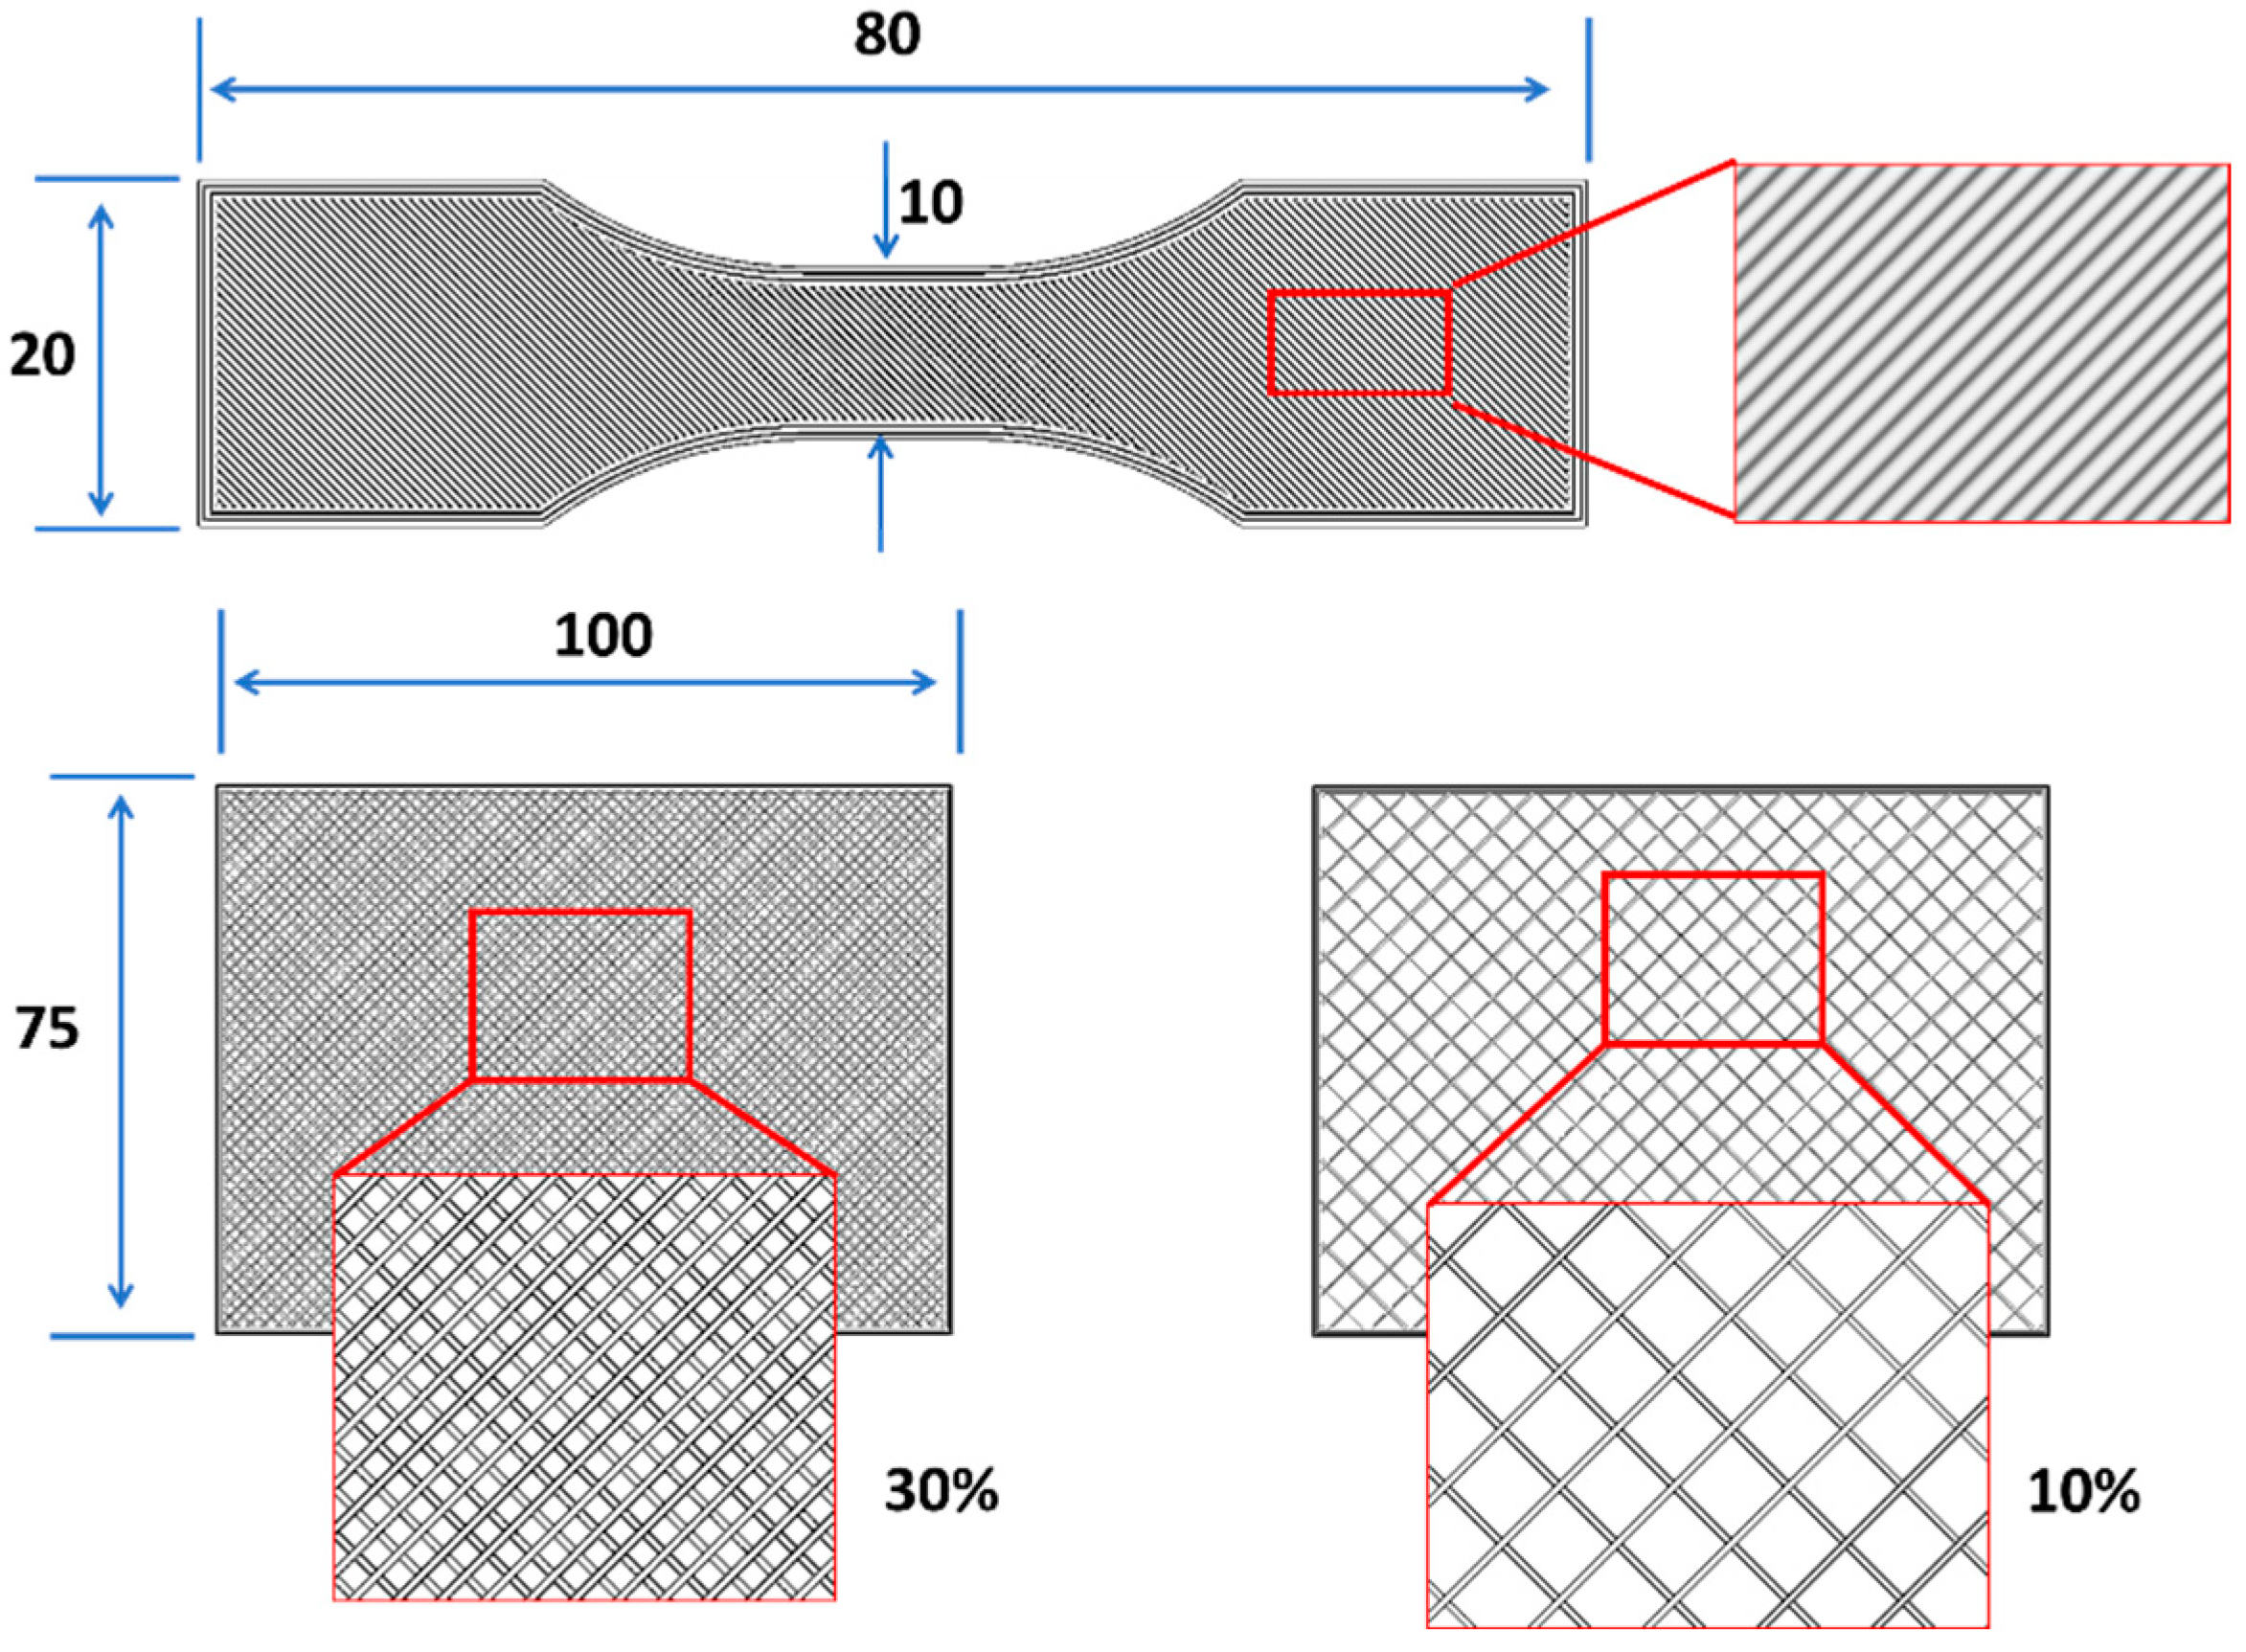
| Sample dimensions (cm) | 80 × 20 × 4 mm (dogbone sample) |
| 100 × 75 × 20 mm (thermal conductivity) | |
| 40 × 1.75 mm (filament) | |
| Infill | 100% (mechanical testing) |
| 10%, 30% (thermal conductivity) | |
| Layer height | 0.2 mm |
| Wall thickness | 0.8 mm |
| Top/Bottom thickness | 1.0 mm |
| Printing speed | 50 mm/s |
| Printing temperature | 270 °C, 280 °C, 290 °C, 300 °C |
| Bed temperature | 110 °C |
| Building sequence | +45°/−45° |
| TP (°C) | TB (°C) | |||||
|---|---|---|---|---|---|---|
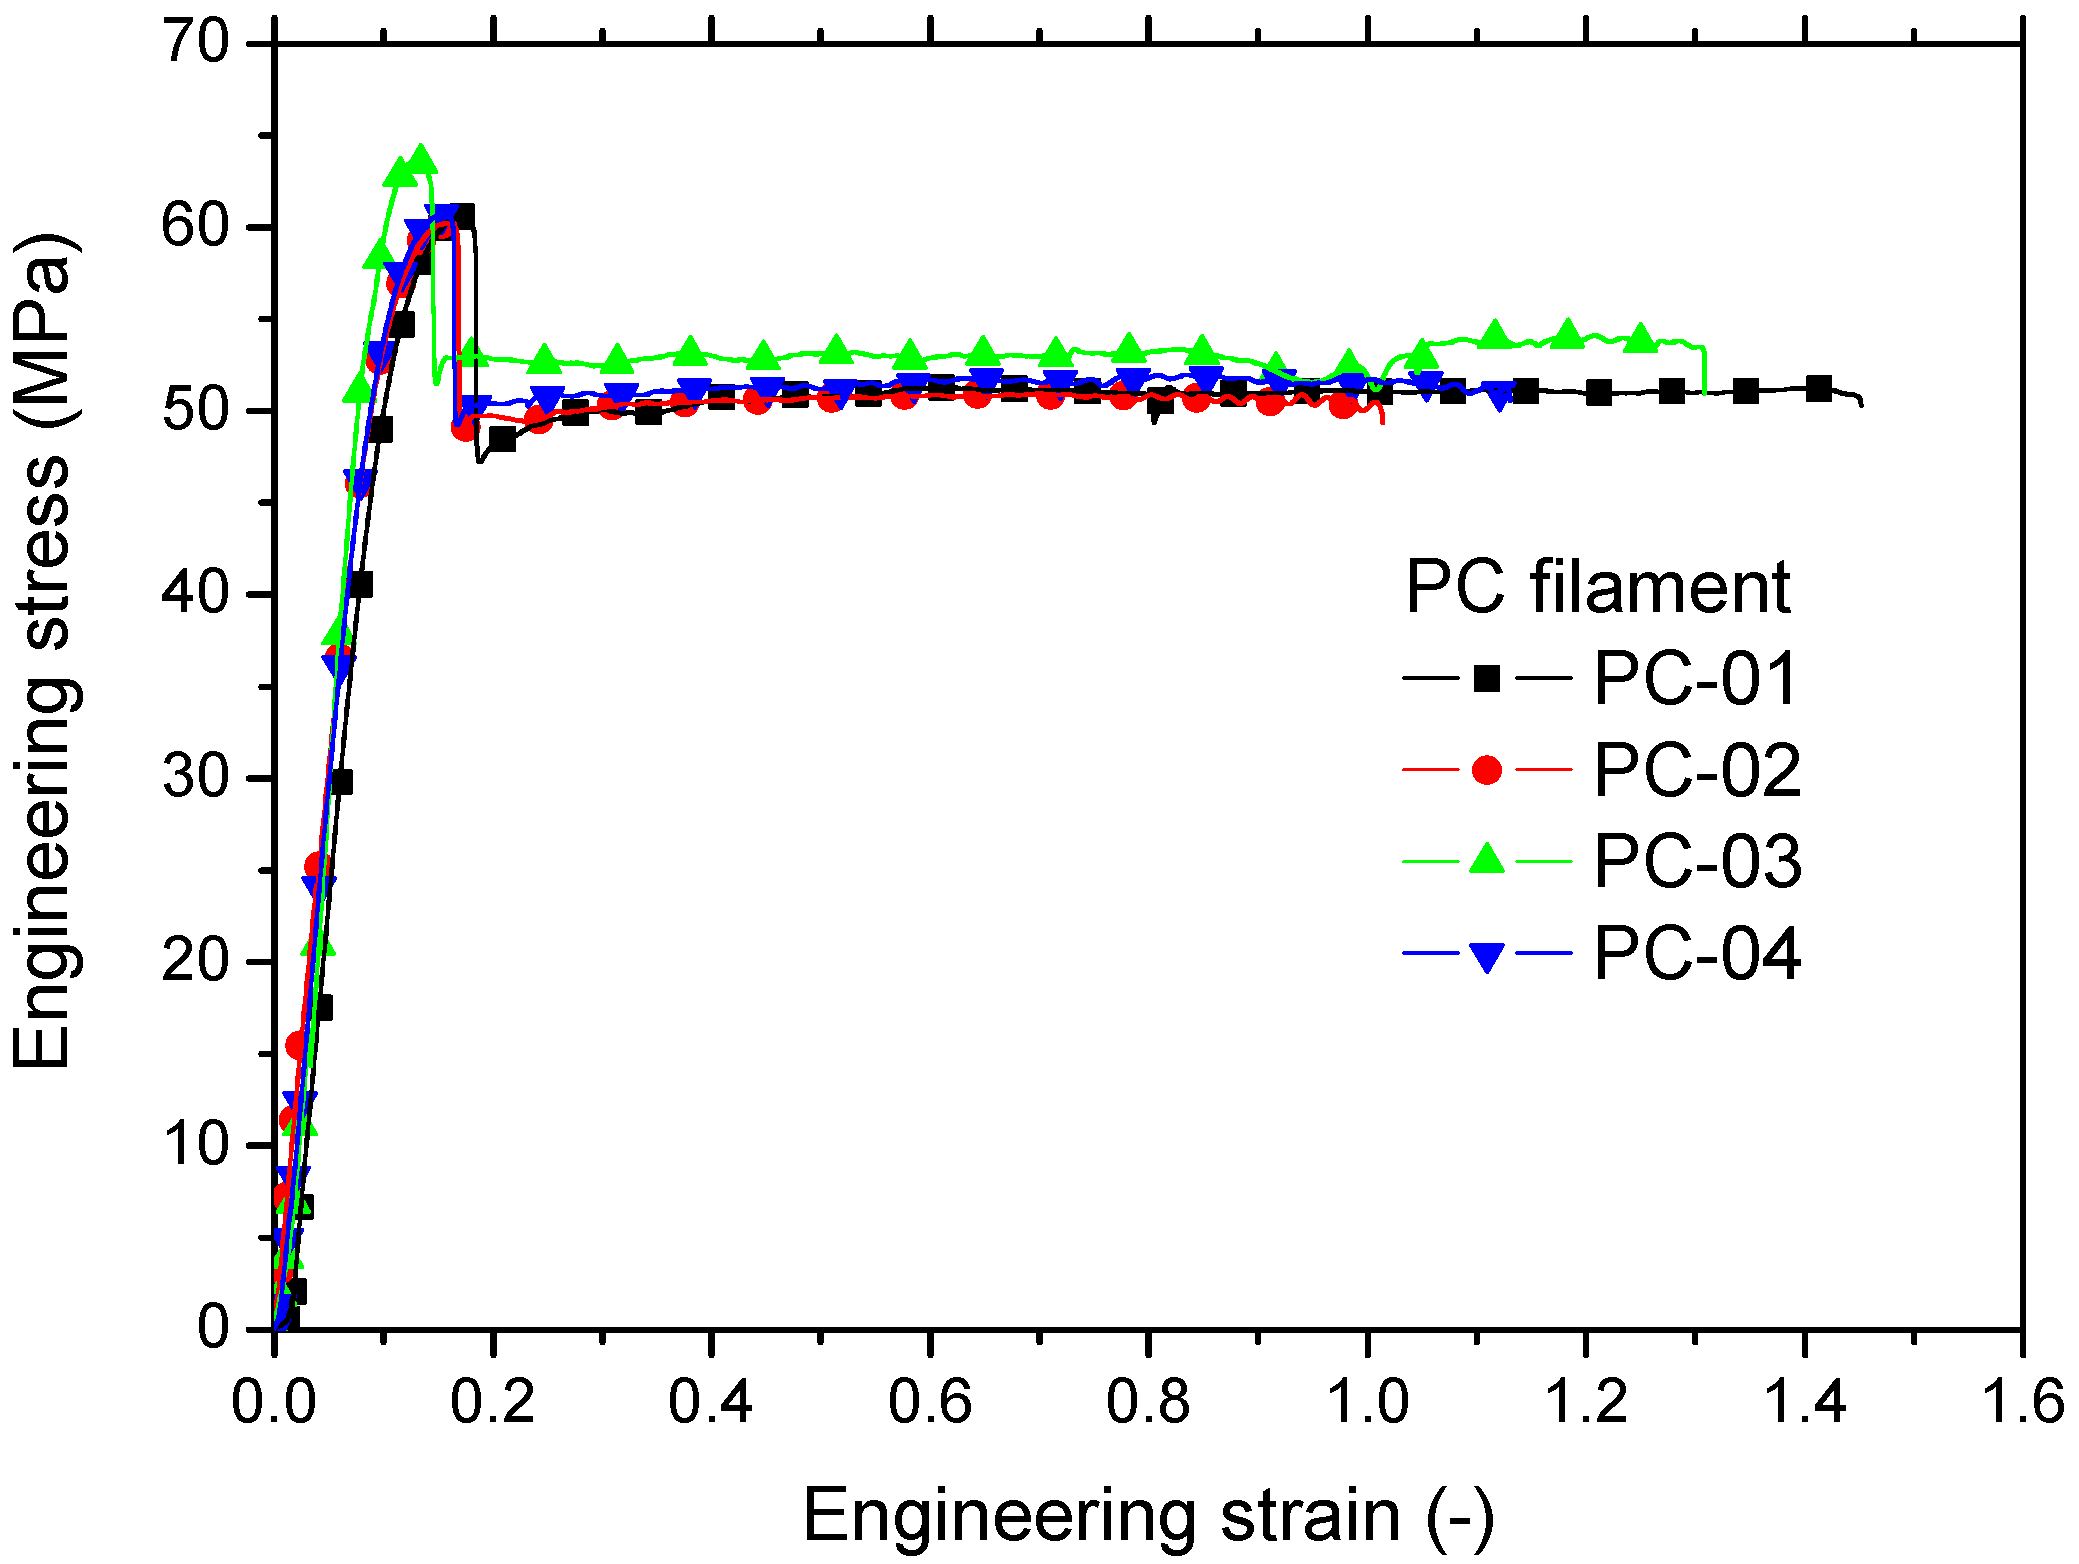
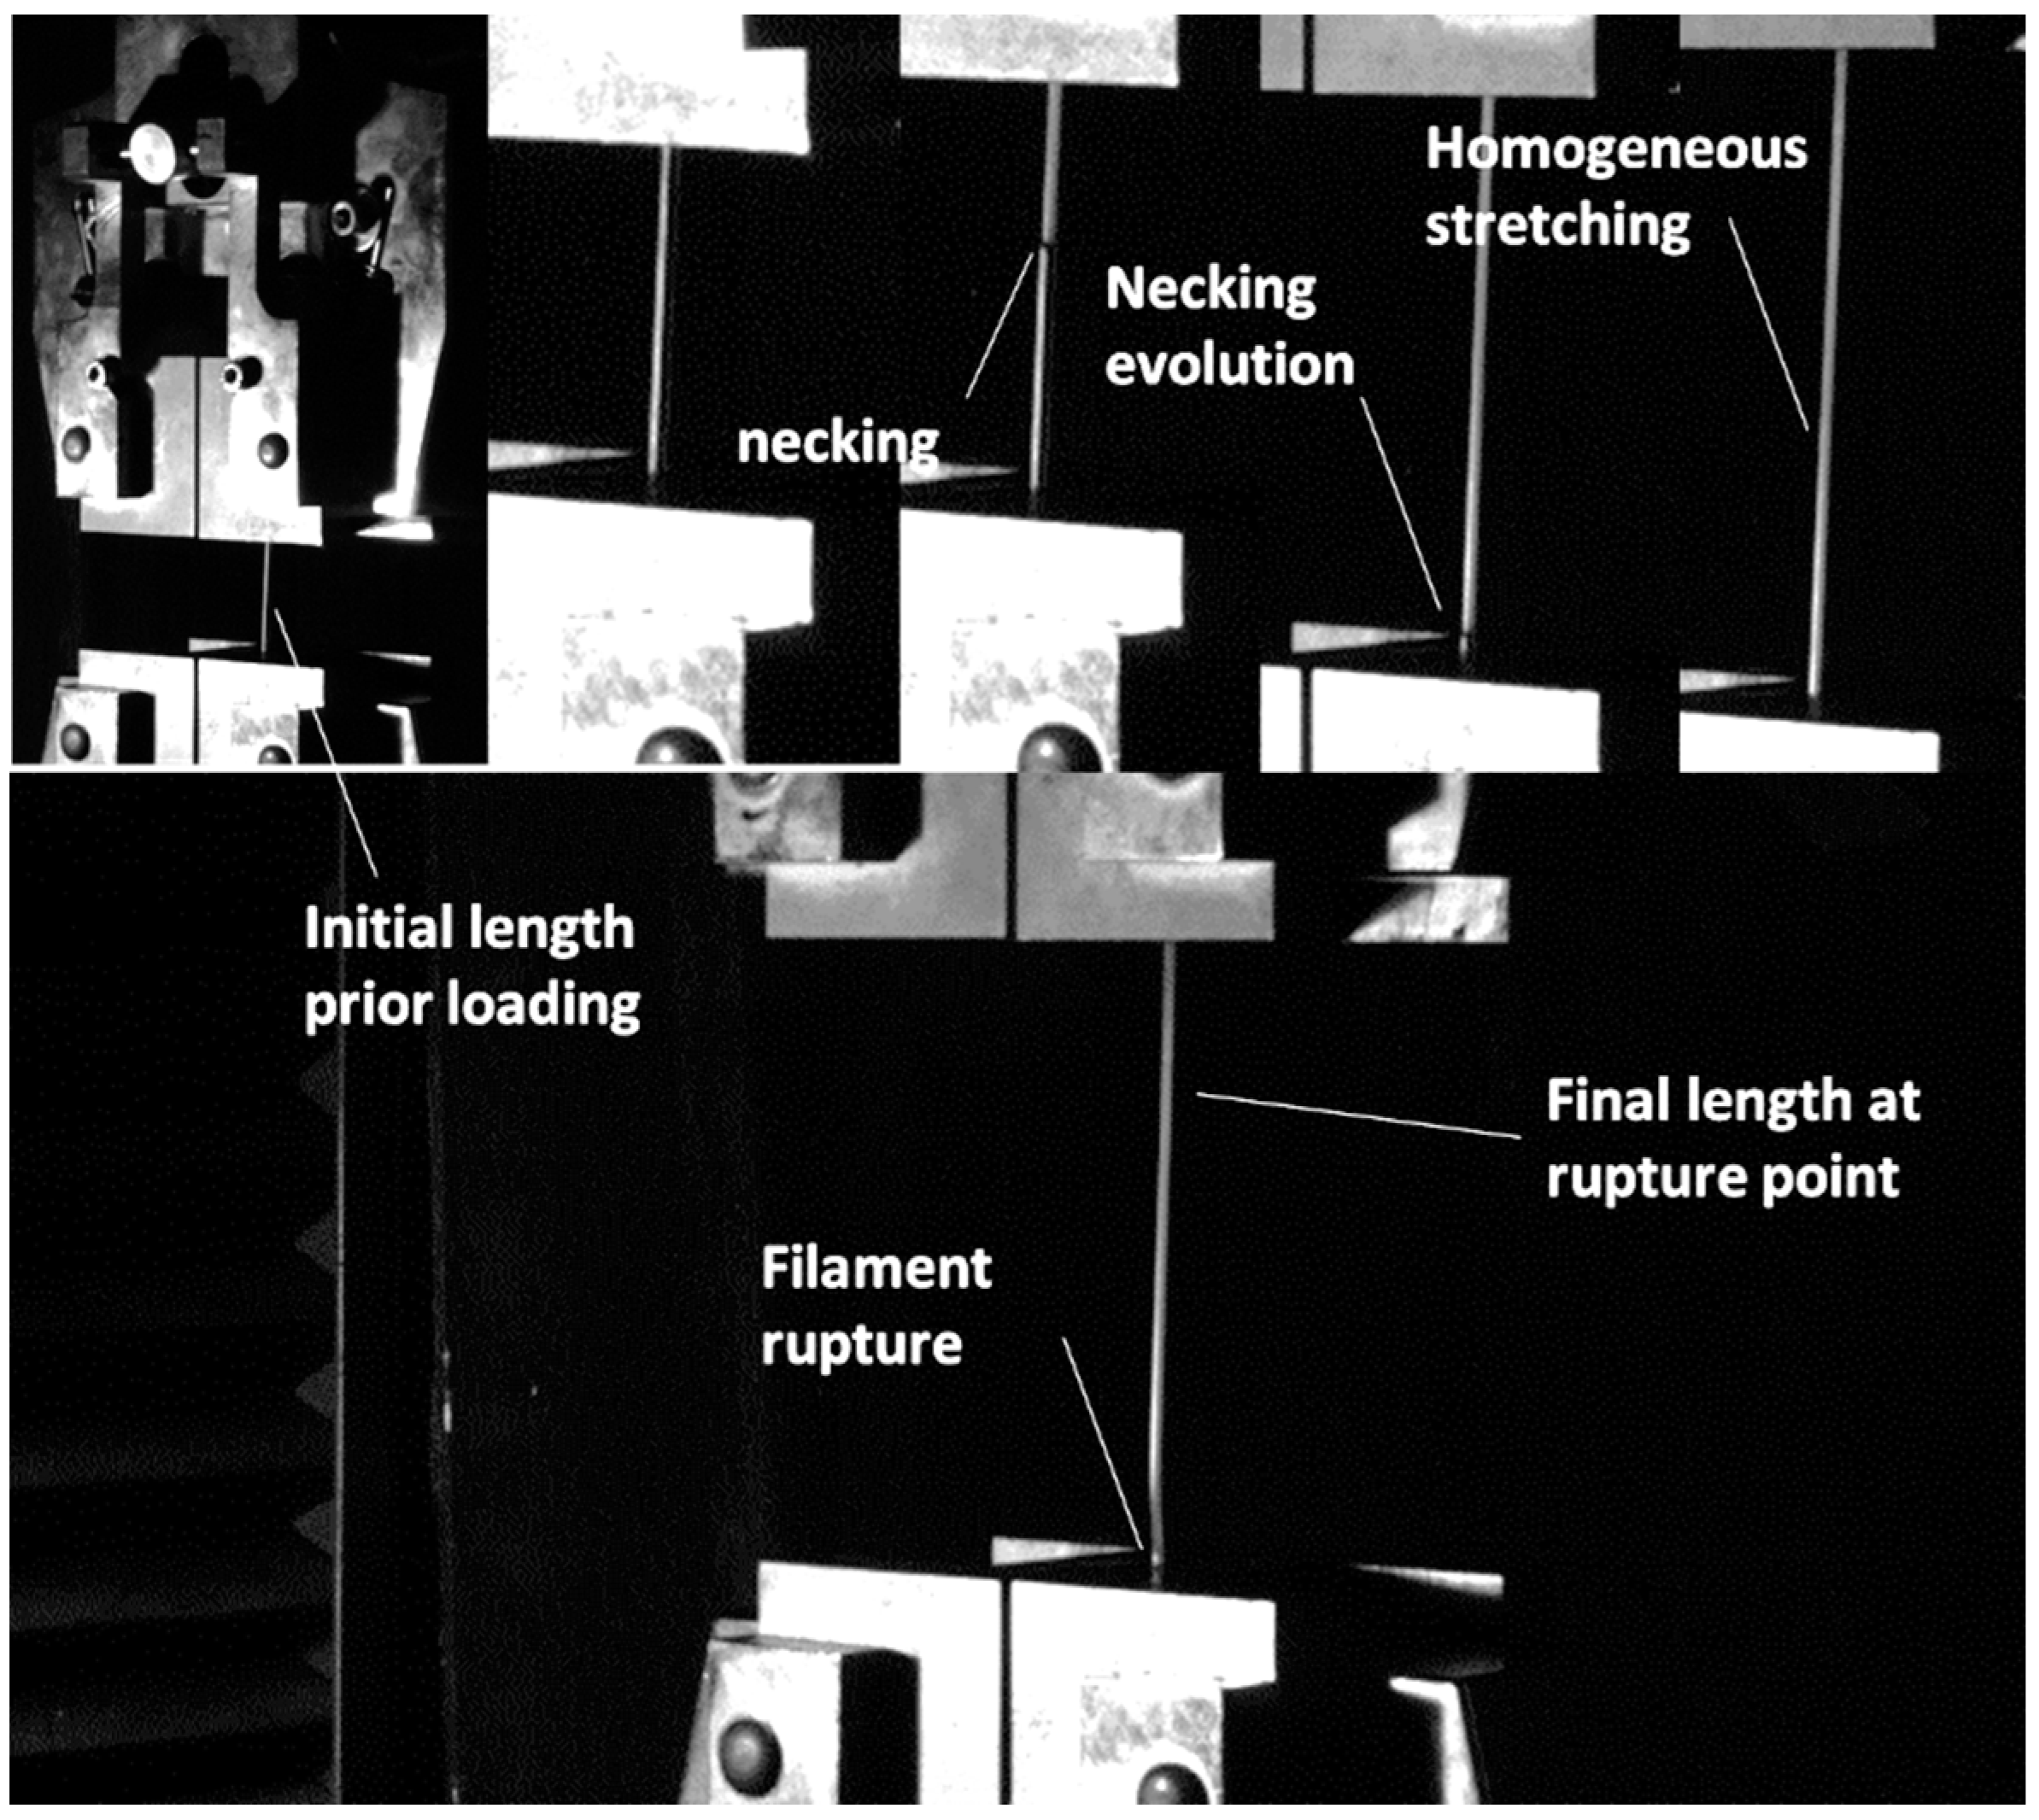
| PC filament | 678 ± 134 | 41.9 ± 2.36 | 61.3 ± 1.57 | 50.3 ± 0.68 | 1.23 ± 0.19 | |
| 270 | 110 | 568 ± 37 | 31.5 ± 4.88 | 37.2 ± 4.54 | 26.6 ± 14.16 | 0.09 ± 0.002 |
| 280 | 110 | 639 ± 10 | 35.5 ± 0.29 | 42.9 ± 0.49 | 39.0 ± 0.77 | 0.08 ± 0.003 |
| 290 | 110 | 568 ± 15 | 28.0 ± 0.96 | 33.9 ± 0.92 | 31.9 ± 2.61 | 0.07 ± 0.003 |
| 300 | 110 | 567 ± 25 | 31.6 ± 0.60 | 35.5 ± 1.58 | 34.8 ± 1.79 | 0.07 ± 0.003 |
| Infill (%) | Thermal Conductivity (mW/(m/K)) | Thermal Effusivity (W·s0.5/(m2·K)) | Thermal Diffusivity (×10−7 m2/s) |
|---|---|---|---|
| 10 | 54.5 ± 0.75 | 166.8 ± 3.75 | 2.4 + 0.08 |
| 30 | 62.3 ± 1.38 | 234.8 ± 8.75 | 2.0 + 0.03 |
Publisher’s Note: MDPI stays neutral with regard to jurisdictional claims in published maps and institutional affiliations. |
© 2022 by the authors. Licensee MDPI, Basel, Switzerland. This article is an open access article distributed under the terms and conditions of the Creative Commons Attribution (CC BY) license (https://creativecommons.org/licenses/by/4.0/).
Share and Cite
Bahar, A.; Belhabib, S.; Guessasma, S.; Benmahiddine, F.; Hamami, A.E.A.; Belarbi, R. Mechanical and Thermal Properties of 3D Printed Polycarbonate. Energies 2022, 15, 3686. https://doi.org/10.3390/en15103686
Bahar A, Belhabib S, Guessasma S, Benmahiddine F, Hamami AEA, Belarbi R. Mechanical and Thermal Properties of 3D Printed Polycarbonate. Energies. 2022; 15(10):3686. https://doi.org/10.3390/en15103686
Chicago/Turabian StyleBahar, Anis, Sofiane Belhabib, Sofiane Guessasma, Ferhat Benmahiddine, Ameur El Amine Hamami, and Rafik Belarbi. 2022. "Mechanical and Thermal Properties of 3D Printed Polycarbonate" Energies 15, no. 10: 3686. https://doi.org/10.3390/en15103686
APA StyleBahar, A., Belhabib, S., Guessasma, S., Benmahiddine, F., Hamami, A. E. A., & Belarbi, R. (2022). Mechanical and Thermal Properties of 3D Printed Polycarbonate. Energies, 15(10), 3686. https://doi.org/10.3390/en15103686