Article

Laser Additively Manufactured Magnetic Core Design and Process for Electrical Machine Applications

1
Department of Electrical Power Engineering and Mechatronics, Tallinn University of Technology, Ehitajate tee 5, 19086 Tallinn, Estonia
2
Department of Mechanical and Industrial Engineering, Tallinn University of Technology, Ehitajate tee 5, 19086 Tallinn, Estonia
3
Institute of Forestry and Engineering, Estonian University of Life Sciences, Fr. R. Kreutzwaldi 1, 51006 Tartu, Estonia
4
Department of Materials Science, Tallinn University of Technology, Ehitajate tee 5, 19086 Tallinn, Estonia
*
Author to whom correspondence should be addressed.
Energies 2022, 15(10), 3665; https://doi.org/10.3390/en15103665
Submission received: 25 April 2022 / Revised: 10 May 2022 / Accepted: 13 May 2022 / Published: 17 May 2022

Abstract

:
Additive manufacturing (AM) is considered the enabling technology for topology optimized components, with its unparalleled, almost free-form design freedom. Over the past decade, AM of electromagnetic materials has evolved into a promising new area of research. Considerable efforts have also been invested by the electrical machine (EM) research community to develop and integrate novel additive components. Several challenges remain, however, in printing soft magnetic flux guides—most prominently, reducing the induced eddy currents to achieve competitive AM core efficiency. This paper demonstrates the workflow of laser additive manufacturing magnetic cores with superior magnetic properties to soft magnetic composites (at 50 Hz excitation): describing the workflow, parameter tuning for both printing and annealing, and shape optimization. Process optimization yielded the optimal energy density of 77 J/mm3 and annealing temperature of 1200 °C, applied to prepare the samples with the highest relative density (99.86%), lowest surface roughness Rz (0.041 mm), minimal hysteresis losses (0.8 W/kg at 1.0 T, 50 Hz), and ultimate yield strength of 420 MPa. For Eddy current suppression, the sample (5 × 5 × 60 mm toroid) with bi-directional grading reached specific core losses as low as 1.8 W/kg (W10,50). Based on the findings, the advantages and disadvantages of AM graded cores are discussed in detail.

1. Introduction

1.1. Additive Manufacturing of Electrical Machines

Metal additive manufacturing (AM) of electromagnetic materials is a developing research field. AM of electrical machines (EMs) has its roots in the beginning of the last decade, in 2013–2015, with the first experimentations and discussions in AM electro-mechanical systems [1,2]. A few years later, in 2018–2019, the first overviews on the feasibility of additively manufactured electrical machines started appearing [3,4,5]. The reviews proposed two main advantages of 3D-printed EMs. Firstly, it was suggested that the three-dimensional fabrication freedom of AM coupled with the topological optimization capacity of digital systems would open a new epoch in the design of electrical machines. The relatively inert EM industry could benefit from fully three-dimensional complex machine shapes, facilitated by the AMs near free-form production capacity. Some novel EM design features, such as optimized magnetic circuits, weight reduction, coil shaping, or enhanced heat extraction, have been outlined in [6,7,8,9]. Secondly, AM is considered an integral part of the next industrial revolution. Undoubtedly, for printed end-use use products to be profoundly meaningful, additional features to just complex structural shaping parts, such as embedded electric, magnetic, or electro-mechanical components are vital. This would translate to streamlined printing of mass-customized goods with integrated moving parts (motors, gearboxes, and actuators) and electrical circuits in industry 4.0 smart factories, without extensive manual post-processing and assembling.
In the current state-of-the-art, additive manufacturing of a complete electrical machine has not yet been completed. Three-dimensional printing of an EM is a technically demanding procedure due to the tight tolerances involved in its moving parts (the smaller the air gap, the larger the power density) and their construction from several vastly different materials. In electrical motors, electrically insulated conductors of magnetic flux and electric current are used. The materials involved, however, exhibit incompatible thermal, chemical, and optical (absorptivity) behaviors, and require the development of advanced hybrid multi-material printing methods for parallel printing. Because of this, prototyping of AM electrical machines has focused on printing individual optimized single-material parts (e.g., copper coils, soft-magnetic rotors, alumina heat-guides etc.) and investigating their impact if inserted within a motorette assembly or a conventional electrical machine.
From the perspective of AM soft magnetic iron cores, considerable steps have been accomplished [10,11,12]. High core saturation magnetization and permeability values have been achieved. Nevertheless, the process of obtaining structurally optimal AM cores with the lowest core losses is largely uncharted. This paper aims to provide the reader with the optimal process flow (before, after, and during printing) for preparing high-performance soft magnetic cores with laser additive manufacturing. Optimal energy density and parameters are determined for preparing the samples with maximum relative density and minimal surface roughness. Annealing parameters are investigated to obtain the highest sample permeability and lowest quasi-static (also DC or hysteresis) losses. Topological refinement effects (introduction of insulating voids or air gaps) are investigated for eddy current loss purposes. Finally, the obtained material properties are compared with conventional soft magnetic materials in terms of magnetic polarization and total core losses to evaluate the maturity of soft magnetic materials for commercial applications.

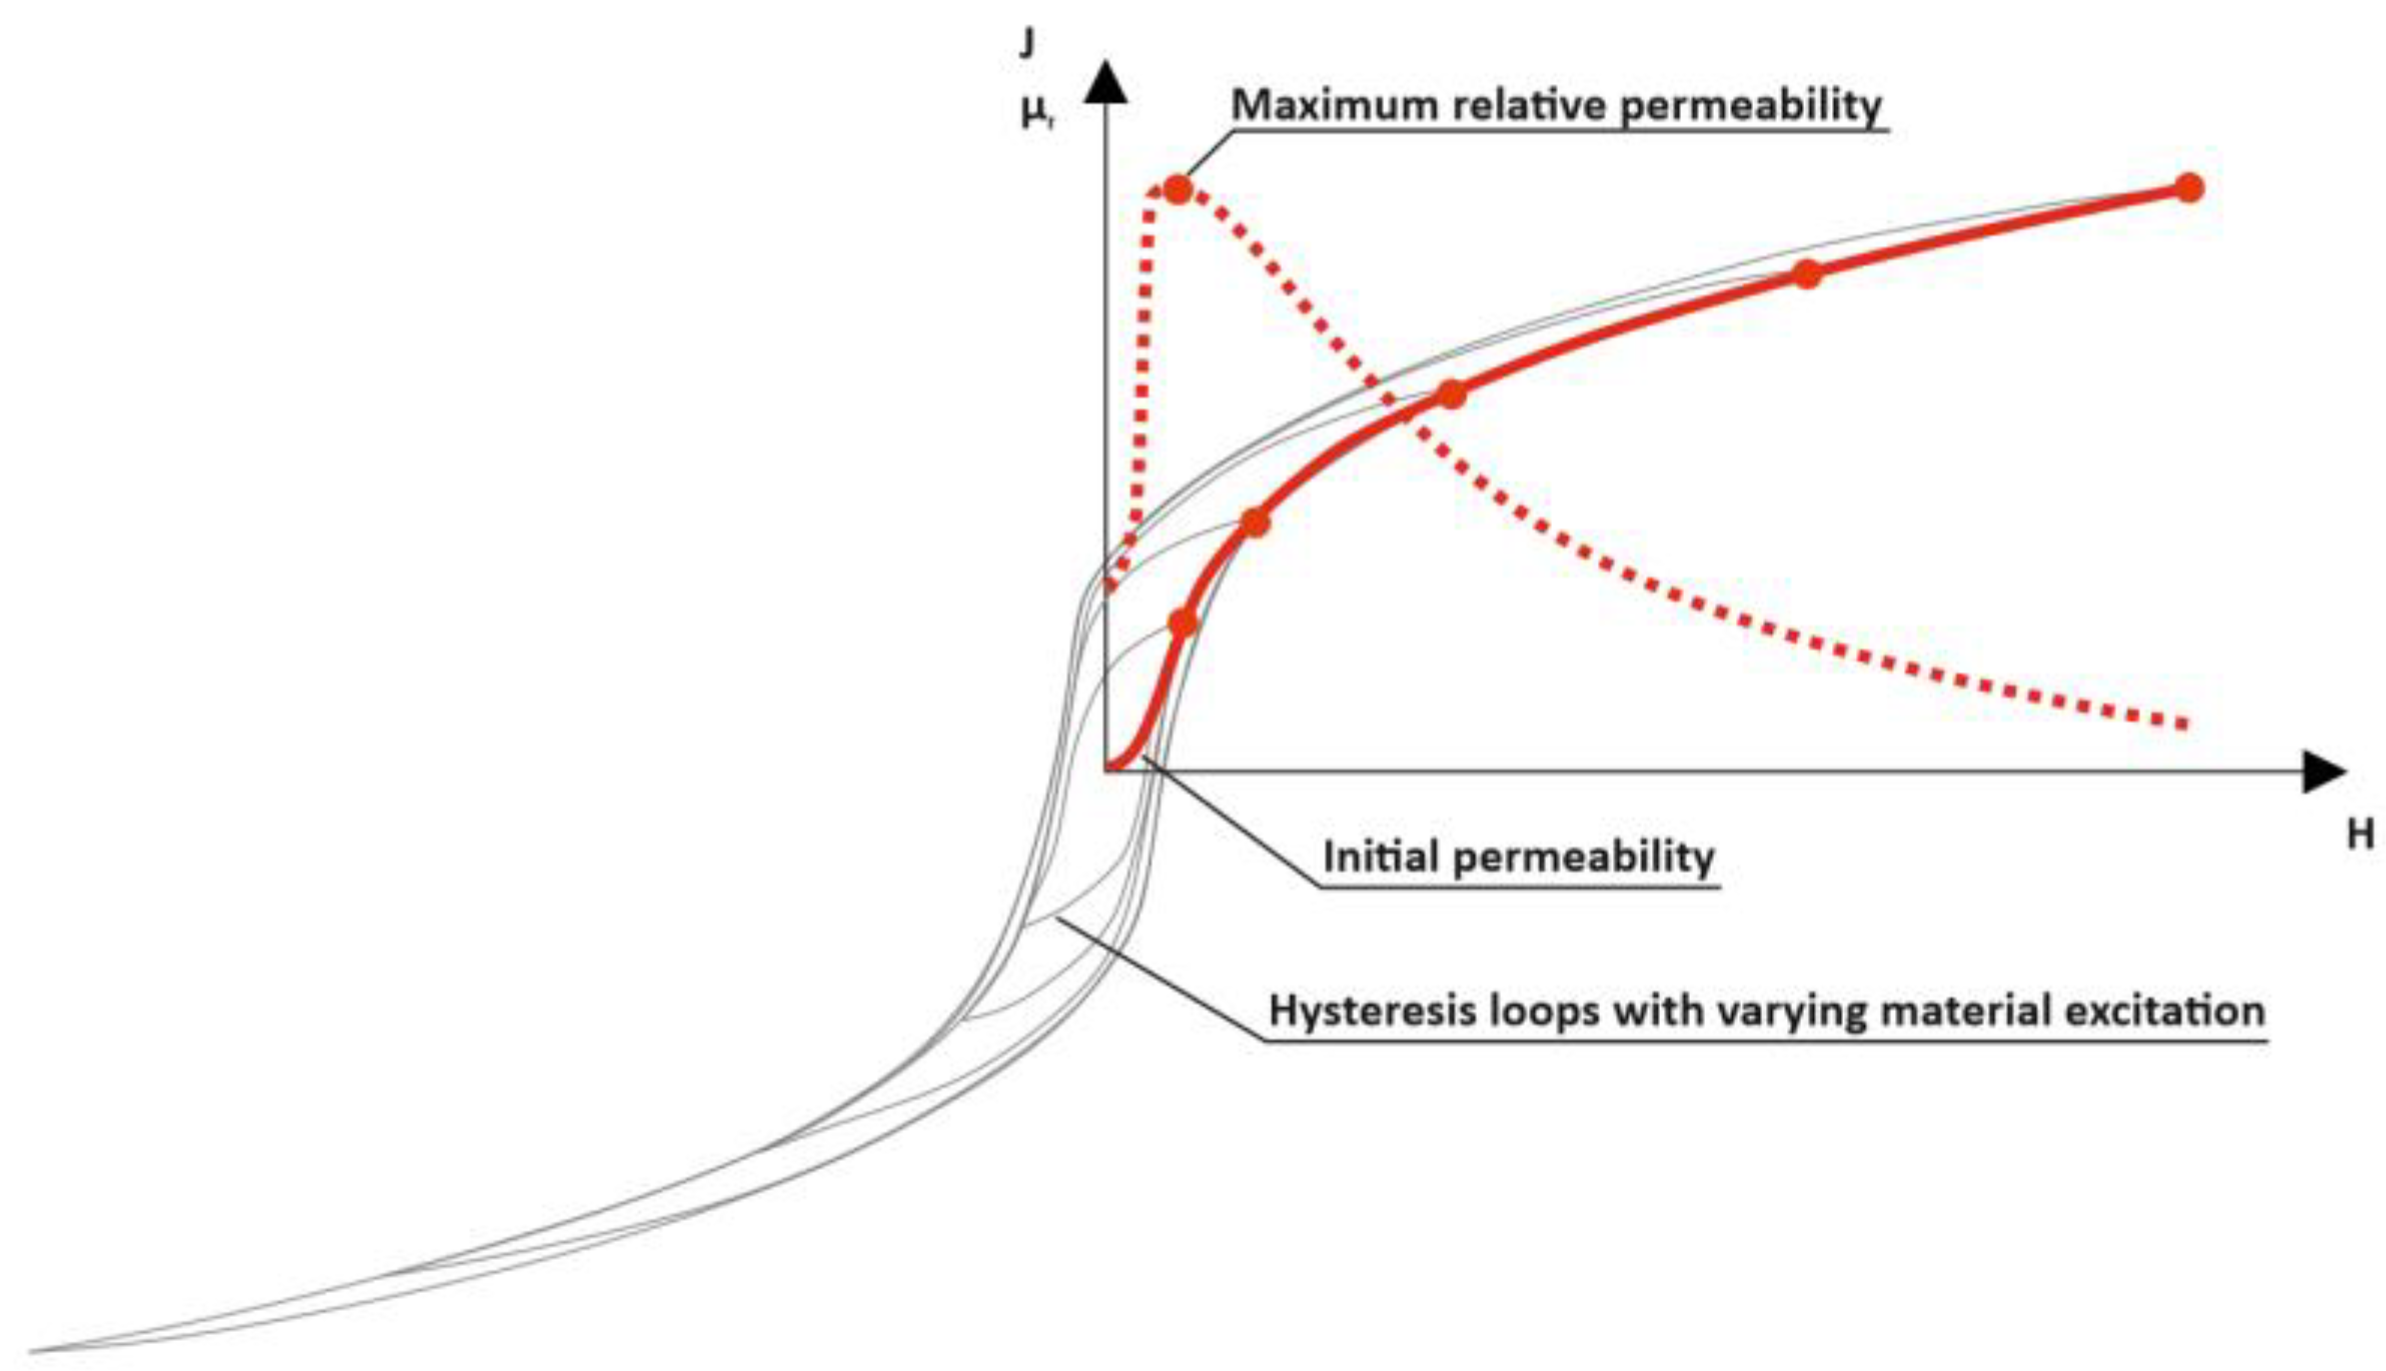
1.2. Soft Magnetic Material Properties

AM components can achieve superior characteristics over their commercial counterparts through optimized topologies. If the AM material properties are subpar to conventional materials, however, there is little room to optimize. Therefore, to justify the commercial adaptation of AM components, the intrinsic material properties involved must exhibit at least roughly equivalent characteristics to their commercial counterparts. The industrial standard for electrical motor core construction material is crystalline silicon steel. It offers both low energy losses from cyclic material magnetization (high efficiency) and high flux densities within the core (high power density) at a competitive price point. Whether produced through subtractive or additive means, the realization of high-performance silicon steels is technically challenging. This is because they are iron-based metallic alloys—complicating their casting/machining/printing due to their high melting point and hardness. Secondly, their properties heavily depend on crystallographic texture. Drawing on previous work, it is well established that the five most impactful material characteristics determining the properties of electrical steel alloys are impurity content, granular size, internal residual stress, alloying silicon content, and lamination sheet thickness. The effect of these characteristics on the properties of crystalline steels is summarized in Figure 1. Within, the figure, core losses Pc are further subdivided into hysteresis losses Physt, classical eddy current losses Pce, and anomalous eddy current losses Pan with regards to the different physical phenomena involved. Additionally, Ms denotes the maximum magnetic saturation (material polarization at μr = 1), Hc—coercivity, σy—ultimate tensile strength, σ—material electrical conductivity, and λ—thermal conductivity. The table is color-coded to correlate better the most impactful physical phenomena associated with each material property. As a rule of thumb, eliminating impurities and internal stresses in crystalline [13,14,15,16,17,18,19,20,21,22,23,24] soft magnetic materials leads to more useful magnetic properties. This is why annealing is critical in the magnetic steel preparation process, enabling decarburization (in a specific process environment), stress relaxation/grain structure recovery (at low temperature), and recrystallization/grain growth (at high temperature). While indispensable in lowering the material’s hysteresis losses and increasing its magnetic responsiveness, annealing is ineffective in decreasing Joule heating losses—the classical and excess eddy current losses. These losses can most effectively be suppressed through silicon additives, optimized material grain size, and segregated/laminated internal structure to limit the flow of electrical charge through the magnetically exciting material. Before the emergence of AM, EM material-focused research groups were focused mainly on investigating the post-processing effects of commercially available mass-produced lamination sheets produced through thoroughly optimized methods. For example, this included the investigation of cutting [25] or coating [26] effects on the individual stampings to optimize the process even further. With the advent of additive manufacturing of electromagnetic materials and components, significantly more diverse challenges are encountered, as with AM: the full production cycle of an electromagnetic component is completable in-house. Based on the academic literature and our experience with laser AM, we outlined the most impactful steps in Figure 2 for obtaining desirable soft magnetic material physical characteristics with laser powder bed fusion (L-PBF). The considerations are subdivided based on their timing window: i.e., considerations or actions that are applicable before, during, or after printing.
We propose a five-step workflow for optimizing and mapping AM-prepared soft magnetic materials, as outlined in Figure 3. The utilization of the workflow is demonstrated in the experimental section of the paper. Starting with the pre-printing process, the most critical pre-L-PBF printing step is undoubtedly raw powder preparation. First, only high purity powders should be used, as compositional enhancements of complex parts are most likely unattainable post-printing. Based on our experience, it is imperative to verify the properties of the supplied powder in-house before printing, as it can deviate significantly from the manufacturer’s declaration. Secondly, it is recommended to dry the raw powder before the process [27], as humid powders have been linked to both lower powder flowability and increased hydrogen porosity formation. Thirdly, PBF processes require specific particle shape and size distribution to ensure as uniform and dense powder bed packing as possible [28,29] in order to fuse homogeneous layers. In L-PBF, these powder layers are fused with a laser source in a fashion similar to micro-welding, with a risk of cracking or voids remaining within the substrate. Excessive laser energy input during this process is related to deformed printed parts (warpage, uneven growth due to balling, delaminations, and thermal cracking), whereas too low energy input—with insufficient inter-layers/track fusion and subsequent high porosity content. With the powder and printing process optimized to the degree to prepare near fully dense parts, the next critical step is the annealing of the material. Annealing is indispensable in preparing L-PBF soft magnetic components, as rapid cooling rates associated with the micro-welding process result in the formation of a refined granular structure (printed grains are typically in the range of 1 µm or less), well known for its suboptimal soft magnetic characteristics.
The focus of this paper is on obtaining magnetic cores that exhibit useful DC and AC magnetic properties. With the exception of ultimate tensile strength, non-magnetic material properties are not investigated in this paper; they are planned for future work. With the confirmation of desirable powder composition, morphology, and size distribution, the process can advance towards the optimization of printing melting parameters. In this paper, this process aims to obtain a near-fully dense material structure that is above 99.5% relative density. In parallel, the surface roughness of the printed samples is evaluated, as fully dense parts can also be achieved with excessive energy input, which can result in reduced spatial accuracy of the printed parts. This is due to the more intense spattering of droplets at higher input, which can be embedded into the part surface and deteriorate its surface finish [30]. The goals for the magnetic characterization steps are to obtain comparable results to commercial materials. For the DC study—similar magnetization behavior to crystalline silicon steel; for the AC study—superior core losses to soft magnetic composite (SMC) cores. Obtaining equivalent AC losses to high-grade silicon steel laminations is considered unfeasible due to challenges in segregating the core topology in L-PBF systems (forming laminations). Total core losses at 50 Hz comparable to SMC magnetic cores should be within reach with printed air gaps into the material.

2. Experimental Methods

2.1. Printing Materials and Equipment

The material used in this investigation was commercially available Fe-Si pre-alloyed powder provided by Sandvik Osprey LTD. The powders were manufactured via the gas (nitrogen) atomization process, with a target chemical composition of Bal Fe, 2.0–4.0% Si, 0.05% max C, 0.2% max Mn, 0.2% max Cr, and 0.2% max Ni. Spherical powder particle morphology was targeted in 2% of the powder particles over 45 μm and 5% of those below 10 μm in size. These powder characteristics were ascertained in-house prior to printing.
The chemical composition of powders was determined with two methods: AES (atomic emissions spectrography) using Spectrolab M system and EDX (energy dispersive X-ray analysis) using a HR-SEM (high resolution scanning electron microscope) with an integrated Bruker Esprit 1.8 EDX detector. The SEM facility utilized for imaging was HR-SEM ZEISS FEG-SEM ULTRA-55. For powder particle size analysis, Horiba LA-950V2 laser scattering analyzer was employed. The measurements were conducted in a water dispersive environment. Flowability of the powder was determined with Hall Flowmeter measurements according to the EVS-EN ISO 4490:2018 standard. It comprised flow time measurements of 50 g of raw powder through a Ø2.5 mm hole in the Hall funnel. The powder chemical composition was in a good agreement with the manufacturer’s declaration, with the main constituting elements outlined in Table 1. The powder constituted of roughly spherical particles with the size of 29–58 μm, with a median diameter of 38 μm (d50) as shown in Figure 4a,b. The majority of the particles exhibited smaller attached satellites alongside some elongated elliptical particles. Despite the powder artifacts, the flow rate of the powder was acceptable; it was measured as 19.7 ± 0.24 s/50 g in the Hall funnel.
All the samples were prepared with an SLM Solutions GmbH Realizer SLM-280 laser powder bed fusion system. The system exhibited a 280 × 280 × 350 maximum build envelope and a single scanning 1070 nm yttrium scanning laser (1 × 400 W). To streamline research projects, a custom smaller build platform (D100 mm), re-coater, and feeder system were added to the printer. These additions reduced both the overall powder quantity required for printing (the full-sized platform requires 220 kg of 316 L powder to fill the full build envelope) and faster powder swapping between different research projects. The powder reservoir was 3D printed with the same printer on the full-size platform from stainless steel 316 L (wall thickness 1 mm). Initial testing of the re-coater prototype suggested the need to separate the powder reservoir from the substrate through a feeder tube, as the weight of the powder column above the substrate affected powder flowability and its deposition quality. Without the feeder tube, uneven accumulation of powder was observed on printed parts, which quickly evolved into balling-related print failure. The printing system and its custom addons are shown in Figure 5.

2.2. Thermal Treatments

Post-printing thermal treatment processes were performed in a graphite chamber Webb-107 vacuum furnace, which enabled the annealing of parts with dimensions not exceeding D100 × 60 mm. The annealing setup is shown in Figure 6. The investigated temperature range for printed solid toroids was 1200–1350 °C, with a 50° incremental increase. The samples were heated in a ~0.1 mBar vacuum environment, with a heating rate of 300°/h up to the target temperature, held for one hour, followed by slow furnace cooling. The duration of each annealing process was roughly 24 h. The optimal annealing temperature in the investigated range was determined from the DC magnetic measurements and was used for the treatment of three segregated cores in the next study step.

2.3. Density and Surface Roughness Optimization Study

A study of the printing parameters was conducted to determine the optimal parameters for preparing samples with the highest relative density and lowest surface roughness. A total of 36 pcs 5 × 5 × 5 mm cubical samples were printed, each with a different set of parameters. The finished printed cubes on the substrate and their respective melting parameters are outlined in Figure 7. The initial values for the parametric sweep were adopted from the manufacturer’s recommendation for 316 L stainless steel for SLM 280 L-PBF system. The sweep was performed for both laser power (250–400 W) and scanning velocity (0.25–2 m/s), with a constant hatch distance (120 μm) and layer thickness (50 μm). The volumetric energy input of each layer was calculated using Equation (1), where E denotes the energy density (J/mm3), h—the hatch spacing (mm), t—layer thickness, and v—scan speed (mm/s).
E = P v     h   t
The printing was performed in a nitrogen environment, with oxygen purged from the chamber below 0.1% content. A stripe scan pattern with 15° rotation between the layers was used for core hatching. The borders of each cube were printed with identical parameters: contour scanning with 100 W laser power at 0.5 m/s. Two-way recoating was considered unsuitable due to the construction of the custom re-coater; the rubber wiper blades could not be aligned perfectly to ensure even layer thickness on both recoating ways. This is why the hatch melting of the cubes was conducted every two layers (every 50 μm) with only the re-coater moving from front to back, whereas the border melting was conducted every layer (every 25 μm) with both recoating directions.
The sample density analysis was conducted on a YXLON FF35 CT computed metal tomography system with a 195 kV transmission tube (Y.FXT 225.48) configuration using a continuous cone beam scan method. The analysis was performed on VGSTUDIO MAX 3.2.2.152742 commercial software using the VGEasyPore algorithm with a low cutoff filter limit of 8 voxels for porosity size. This translated to an axial resolution of approximately 12 μm—with the scan detecting internal defects as small as 1.75 × 10⁻⁶ mm−3 in volume. This resolution was deemed appropriate as the irregular lack-of-fusion pores are typically above 100 μm in diameter [31]. Each cube was scanned thrice: once from each of the orthogonal directions for the construction of the CT image. The defect content was calculated from the cube internal core volume; skin volumes 0.5 mm around the lateral faces and 1 mm from the cube base were excluded. This volume was chosen to minimize the effect of any core-skin fusion defects on the core density parameter optimization results. The measurement and assessment of average defect shape, density, and total volume within the cube tomography results enabled the identification of the defect formation phenomena and average relative density.
A Mahr Perthometer Concept Stylus Profilometer was used for surface roughness measurements. The samples were evaluated across all three non-numbered side faces. On each face, both diagonals were measured using a profilometer over a distance of 4 mm and cut-off values of 0.8 mm. The values for arithmetical mean roughness (Ra, µm) and mean roughness depth (Rz, µm) of the profile were calculated as a mean of the three sides of the cubes. The results are presented in the form of Rz, to better evaluate surface roughness-related potential for short circuits within air-gap segregated cores. In contrast, arithmetical mean roughness Ra characterizes the mean value of the whole profile and is less informative regarding the individual peaks or valleys within the profile. Evaluated areas for both porosity and surface roughness of the sample cubes are outlined in Figure 8.

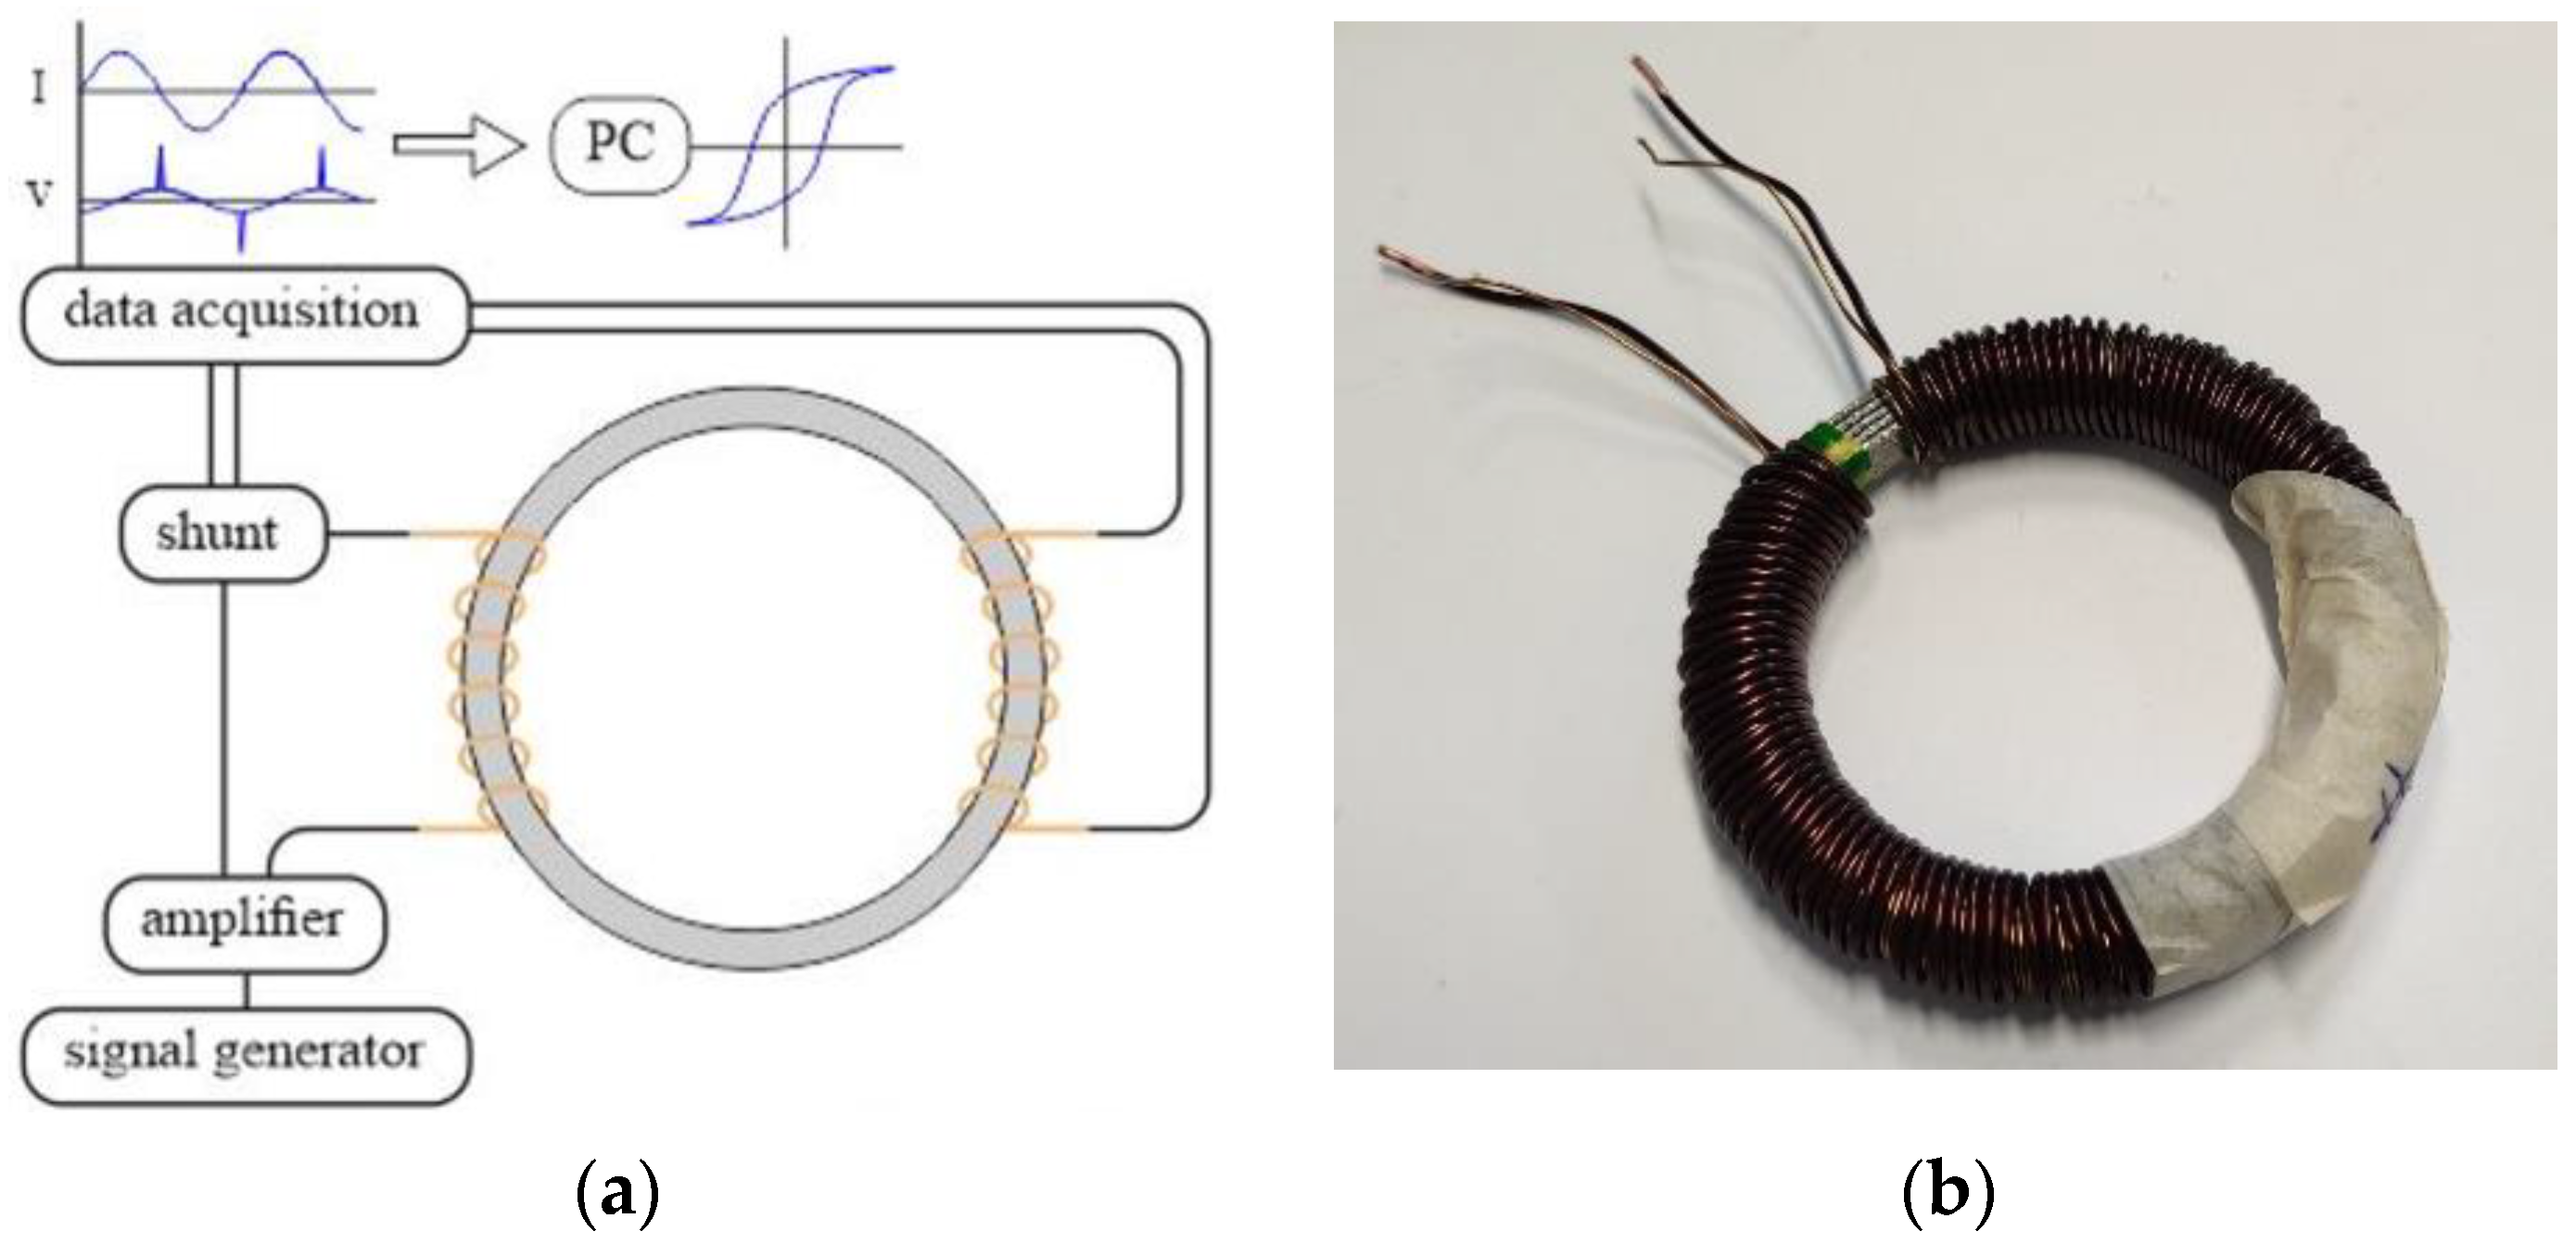
2.4. Magnetic Properties Study

Ring method measurements were used for the mapping of AM material magnetic properties. Two types of samples were prepared: fully dense toroids and toroids with graded (air-gapped) cross-sections. In both cases, the overall shape and outer dimensions of the samples were identical—with a 60 mm outer diameter (OD), a 50 mm inner diameter (ID), and a rectangular 5 × 5 mm cross-section. With an outer to inner diameter ratio of 1 to 2, the samples exhibit mostly homogeneous flux distribution [32]. In graded sample designs, horizontal, vertical, and combined air-gaps were printed into the material for eddy current suppression. A detailed description of the aimed core cross-section designs is outlined in Figure 9.
Horizontally air-gapped cores required dense support structures to prevent part deformation during printing. These support structures consisted of thick border elements to prevent part warpage and delamination and thin lattice structures supporting the inner part to promote powder fusion between the layers. In the vertically air-gapped design, scattered bridge-like structures were used between the laminations to consolidate the printed laminations into a single part. The connecting bridges were displaced over the sample volume in an attempt to increase core inter-lamination resistance. The bridges were printed every 18 degrees, with the cycle of two alternating bridge designs repeating every 36 degrees. The discussed design enhancements are outlined in Figure 10a,b.
The magnetic properties of the printed cores were measured on an in-house ring measurement setup in accordance with the European standards EN 60404-6 [32] and EN 60404-4 [33]. The measurements were conducted at a near quasi-static frequency of 25 mHz and at 1 and 50 Hz for the investigation of the AC loss component. The magnetic measurements setup schematic is shown in Figure 11a, alongside a wound sample under investigation in Figure 11b. The core excitation was performed by supplying a sinusoidal signal from a waveform generator through a signal amplifier to the primary winding. For that purpose, a Rigol DG1022Z arbitrary function generator and an Omicron CMS 356 voltage and current amplifier were used. Up to 20 A RMS current was applied on the windings. Additionally, the amplification system ensured the uniform sinusoidal waveform shape of the excitation current throughout the experiments. Once exiting the core, a Dewetron DEWE2-M data acquisition system with equipped TRION-2402-HV and TRION-2402-dACC measurement modules was employed for recording the toroidal transformer input and output. These included the current in the primary coil (measured through a voltage drop over a 15 A/75 mv high precision shunt resistor) and the induced flux linked voltage on the secondary coil. The sampling frequency of the acquisitioned data was 10 kHz, with the maximum accuracy of ±0.02% and range ±200 μV. The recorded empirical data was further processed in a Matlab environment, where the magnetic field strength H on the core was calculated by (2) and the obtained average flux density B within the core by (3):
H = N 1 i l t
B = 1 N 2 · S · F t   e ( t ) d t
where N1 is the number of turns of the primary winding, N2—the number of turns of the secondary winding, i—the instantaneous current on the primary winding, e—the instantaneous induced emf on the secondary winding, lt—the mean magnetic path length, S—core cross-section area, and F its fill factor. The fill factor of the cores was included to provide an accurate comparison per weight of the samples. If the full cross-sections were used for material characterization, the flux densities of the material would be lower by a margin of non-magnetic volumes introduced to it. Prior to calculations, the physical toroid measurements were taken with a digital scale and a caliper. Density of the samples was calculated from the weight and volume of the investigated toroids. The constructed hysteresis loops were divided into two datasets, each corresponding to the magnetizing direction. Both of the loop halves were then fitted with cubic splines, which enabled them to reduce noise and data points to simplify the numerical integration of the curves. By subtracting the calculated areas below both curves, the loss density of the investigated material was obtained in J/mm3. The specific core losses (Ps) were then calculated by taking into account the average density of the material (ρ) and time period (T) of each hysteresis cycle, as expressed in (4).
Material permeability was evaluated from the magnetization curves constructed from the measured hysteresis curves at increasing excitation levels. The process is illustrated in Figure 12. Permeability of each loop is calculated through its definition: by dividing the corresponding peak Bmax with the Hmax of each loop and μ0. At low magnetic field strength values, the corresponding permeabilities are low; the field is insufficient to induce significant magnetic domain alignment within the material.
P s = 1 T · ρ ( 0 T H 1 d B 1 0 T H 2 d B 2 )

2.5. XRD Microstructural Analysis

X-ray diffraction patterns were recorded with a Rigaku Ultima IV diffractometer. A silicon strip detector D/teX Ultra with CuKα radiation (λ = 1.5406 Å, 40 kV at 40 mA) was used. XRD reference files from the International Centre for Diffraction Data (ICDD, Delaware County, PA, USA) for crystalline phase identification.

2.6. Mechanical Properties

The tensile strength of the materials was measured on an Instron 8516 servo-hydraulic controlled fatigue system with a 100 kN load cell and a 25 mm extensometer, according to the EVS-EN ISO 6892-1 standard. Six test samples were printed with their design based on the E8/E8M—16a ASTM standard [34]: small size specimens proportional to standard (specimen 4). The type-I (conventional round) specimens exhibited a gauge length of 20 mm, a diameter of 4 mm, a radius of fillet of 4 mm, and a length of the reduced parallel section of 24 mm.

3. Results

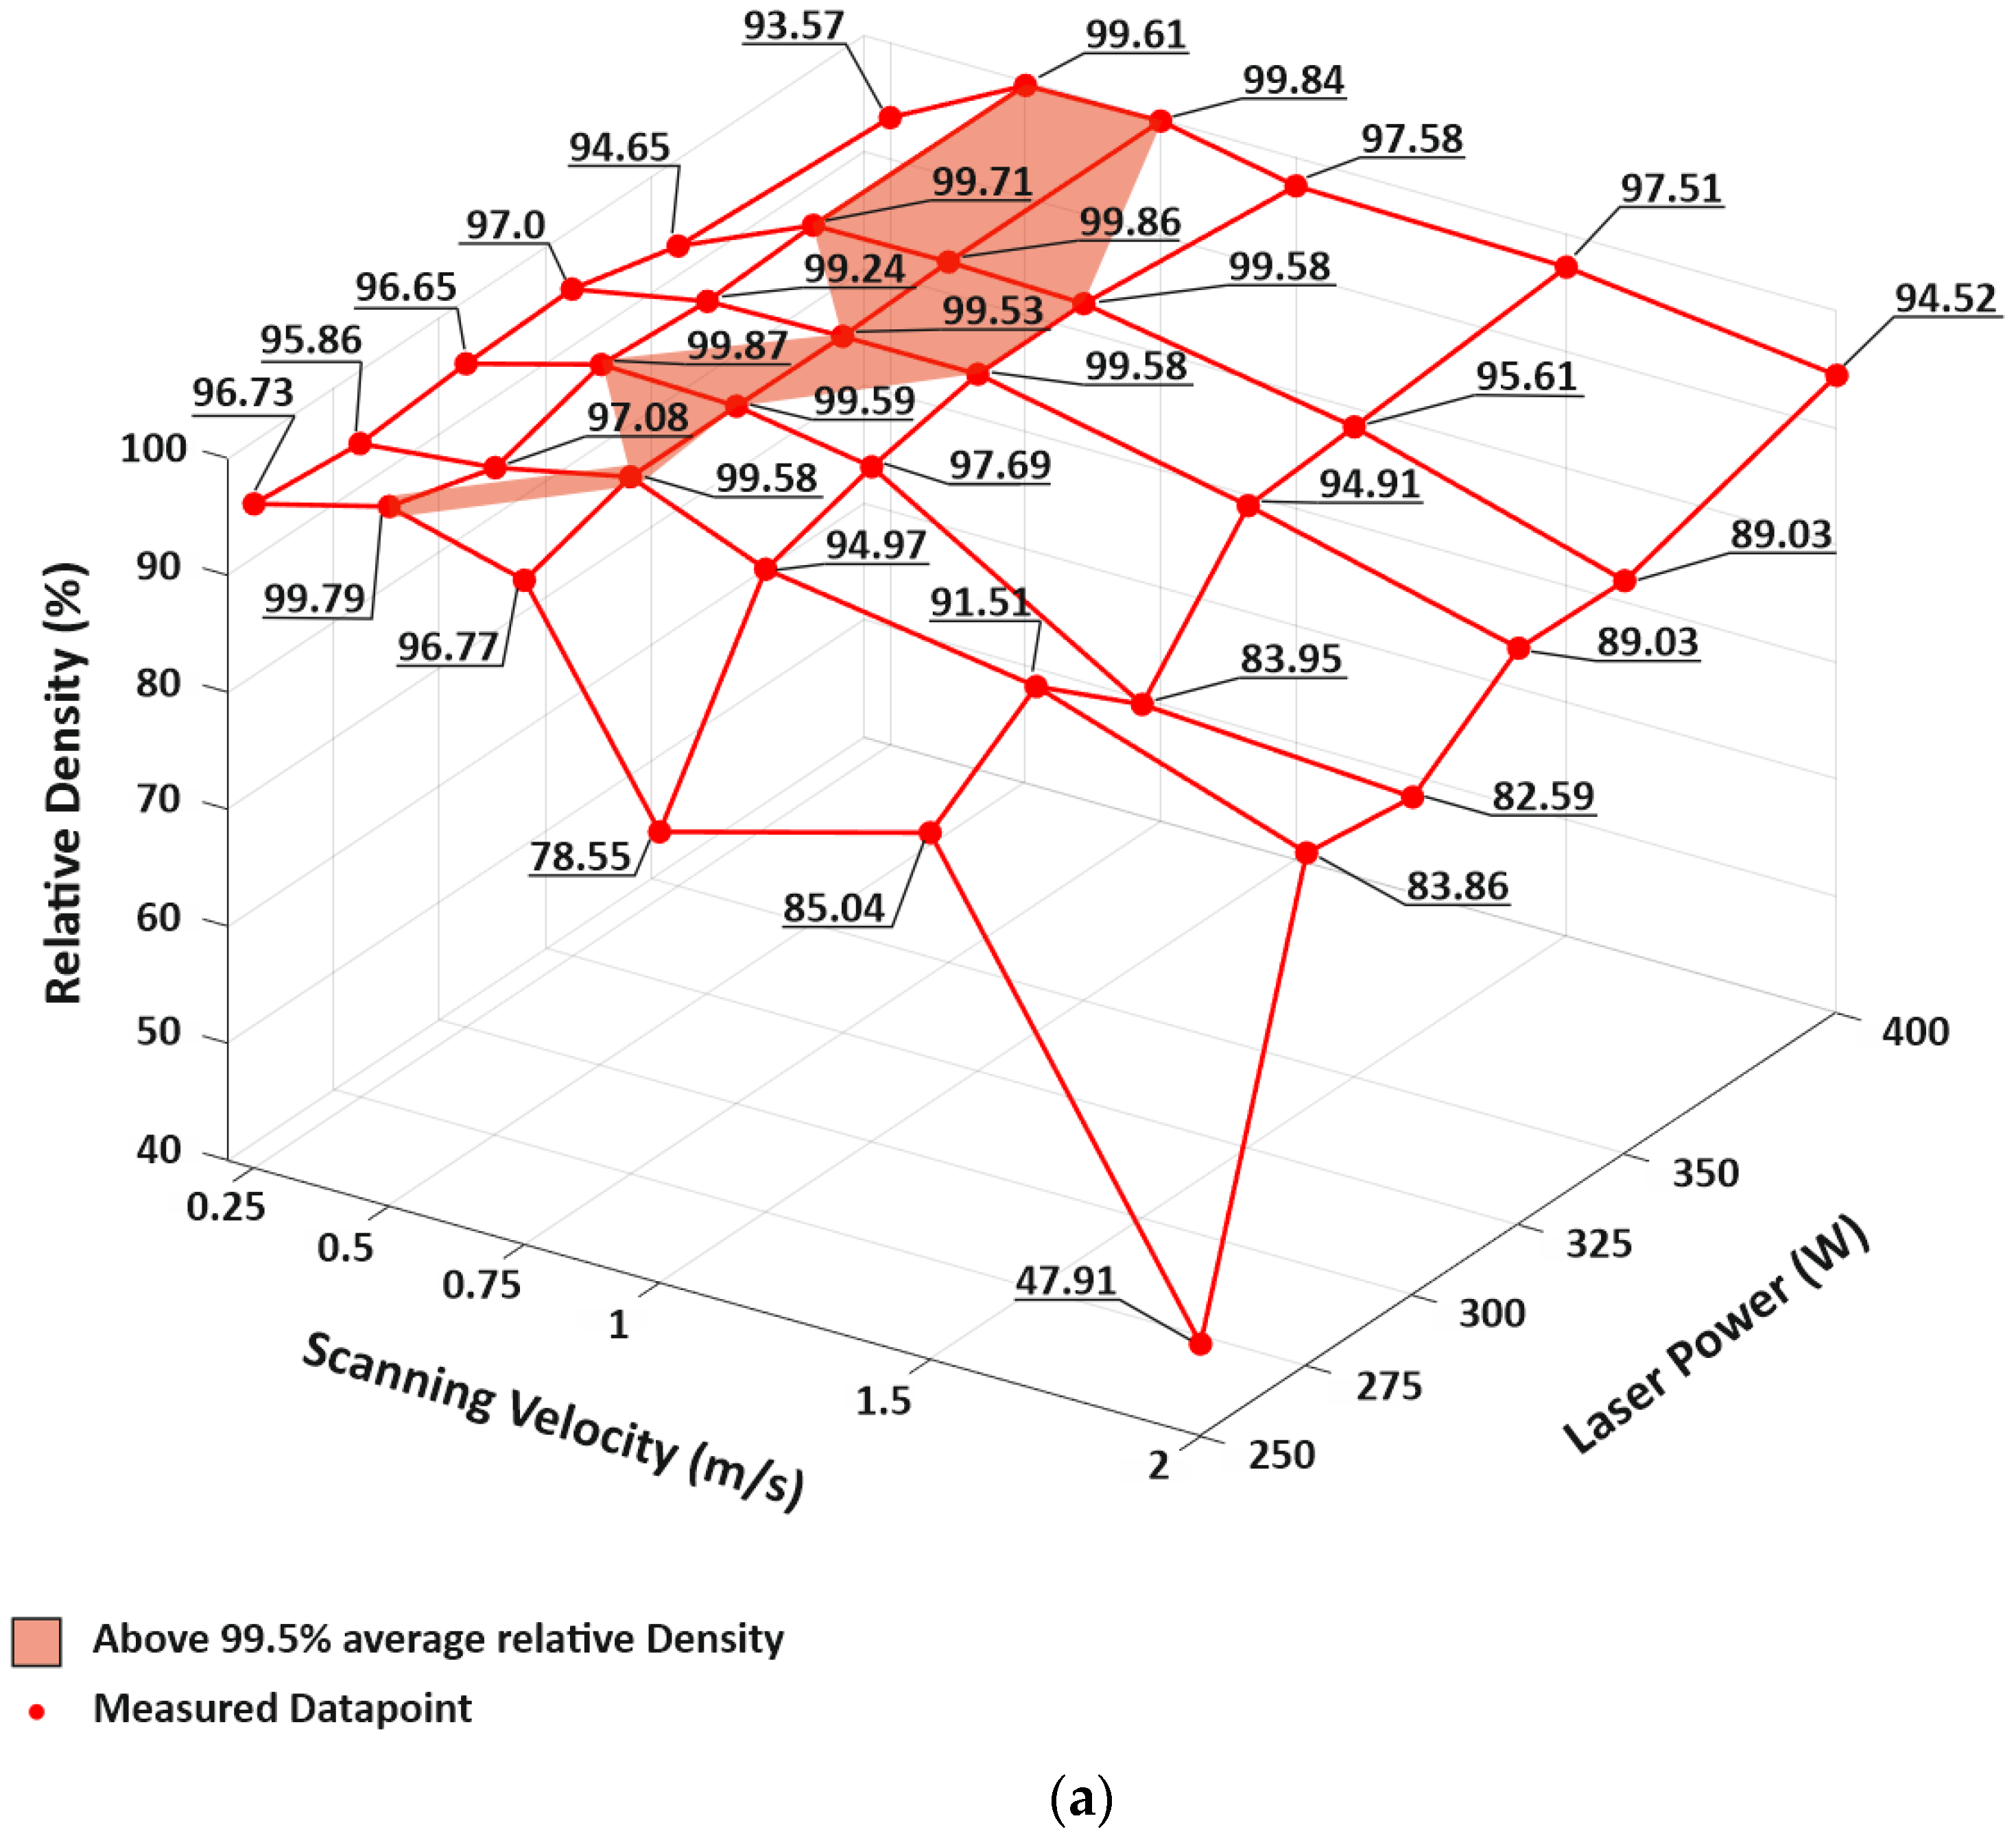
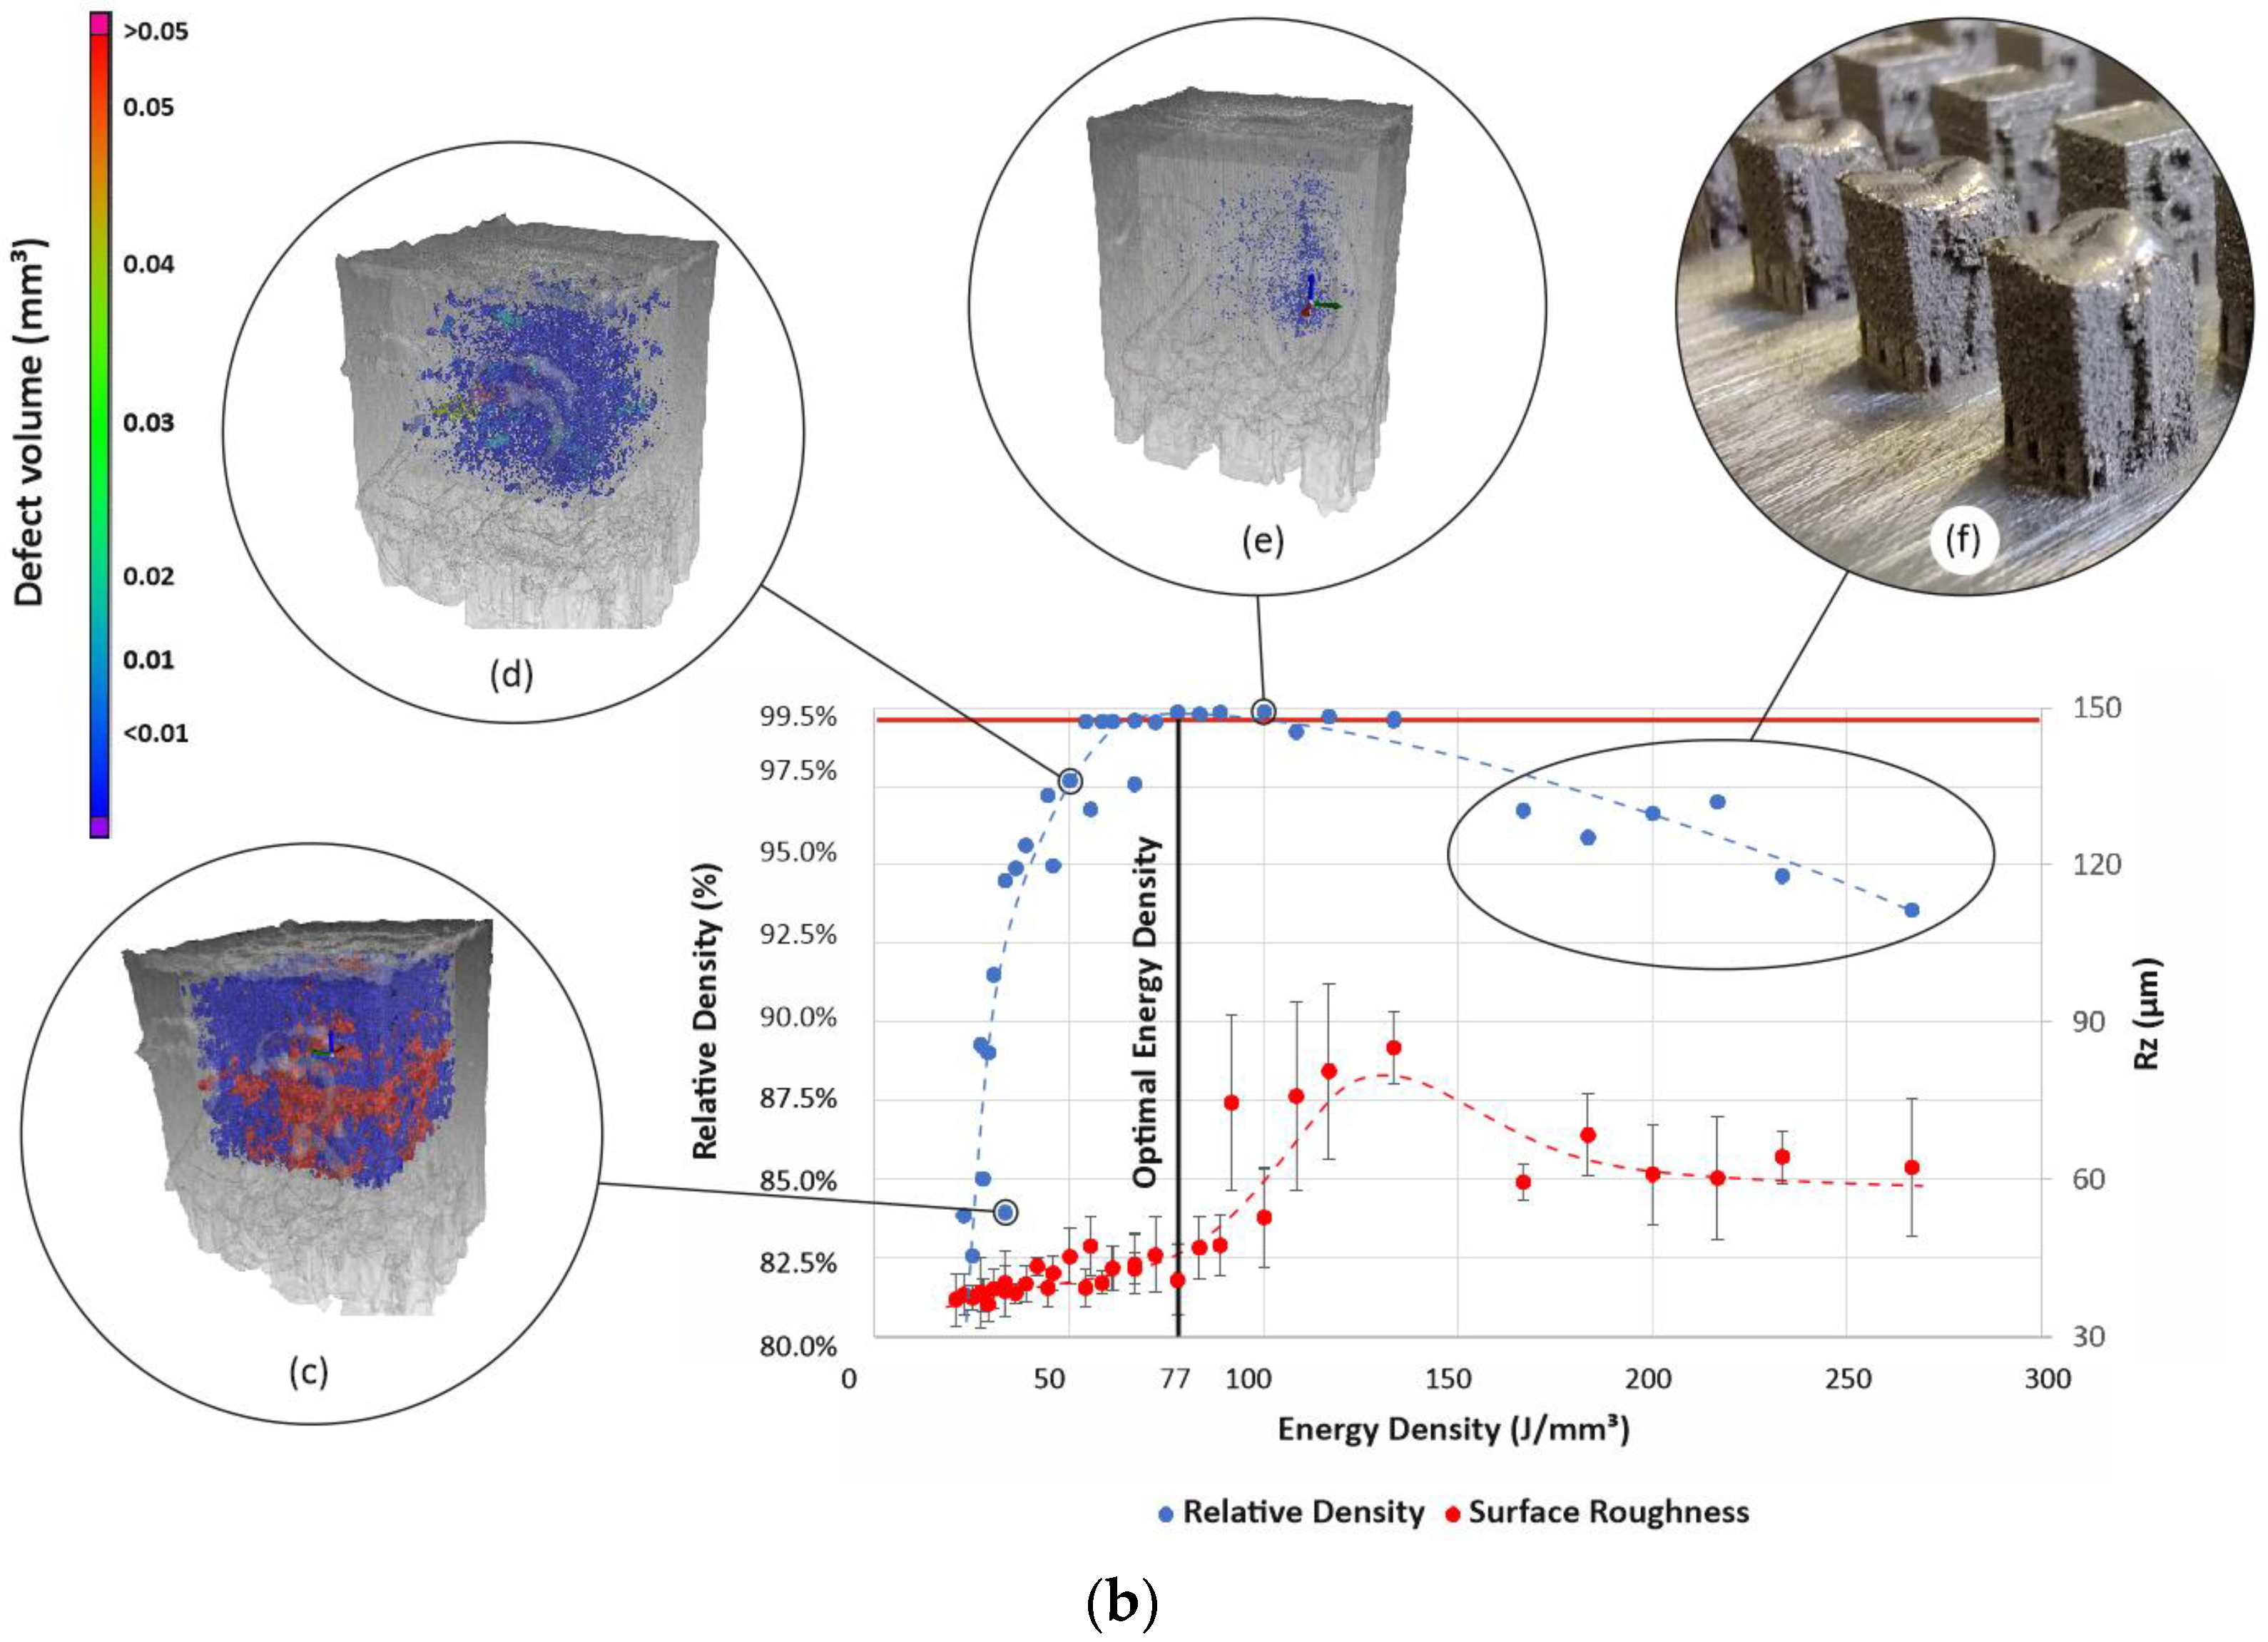
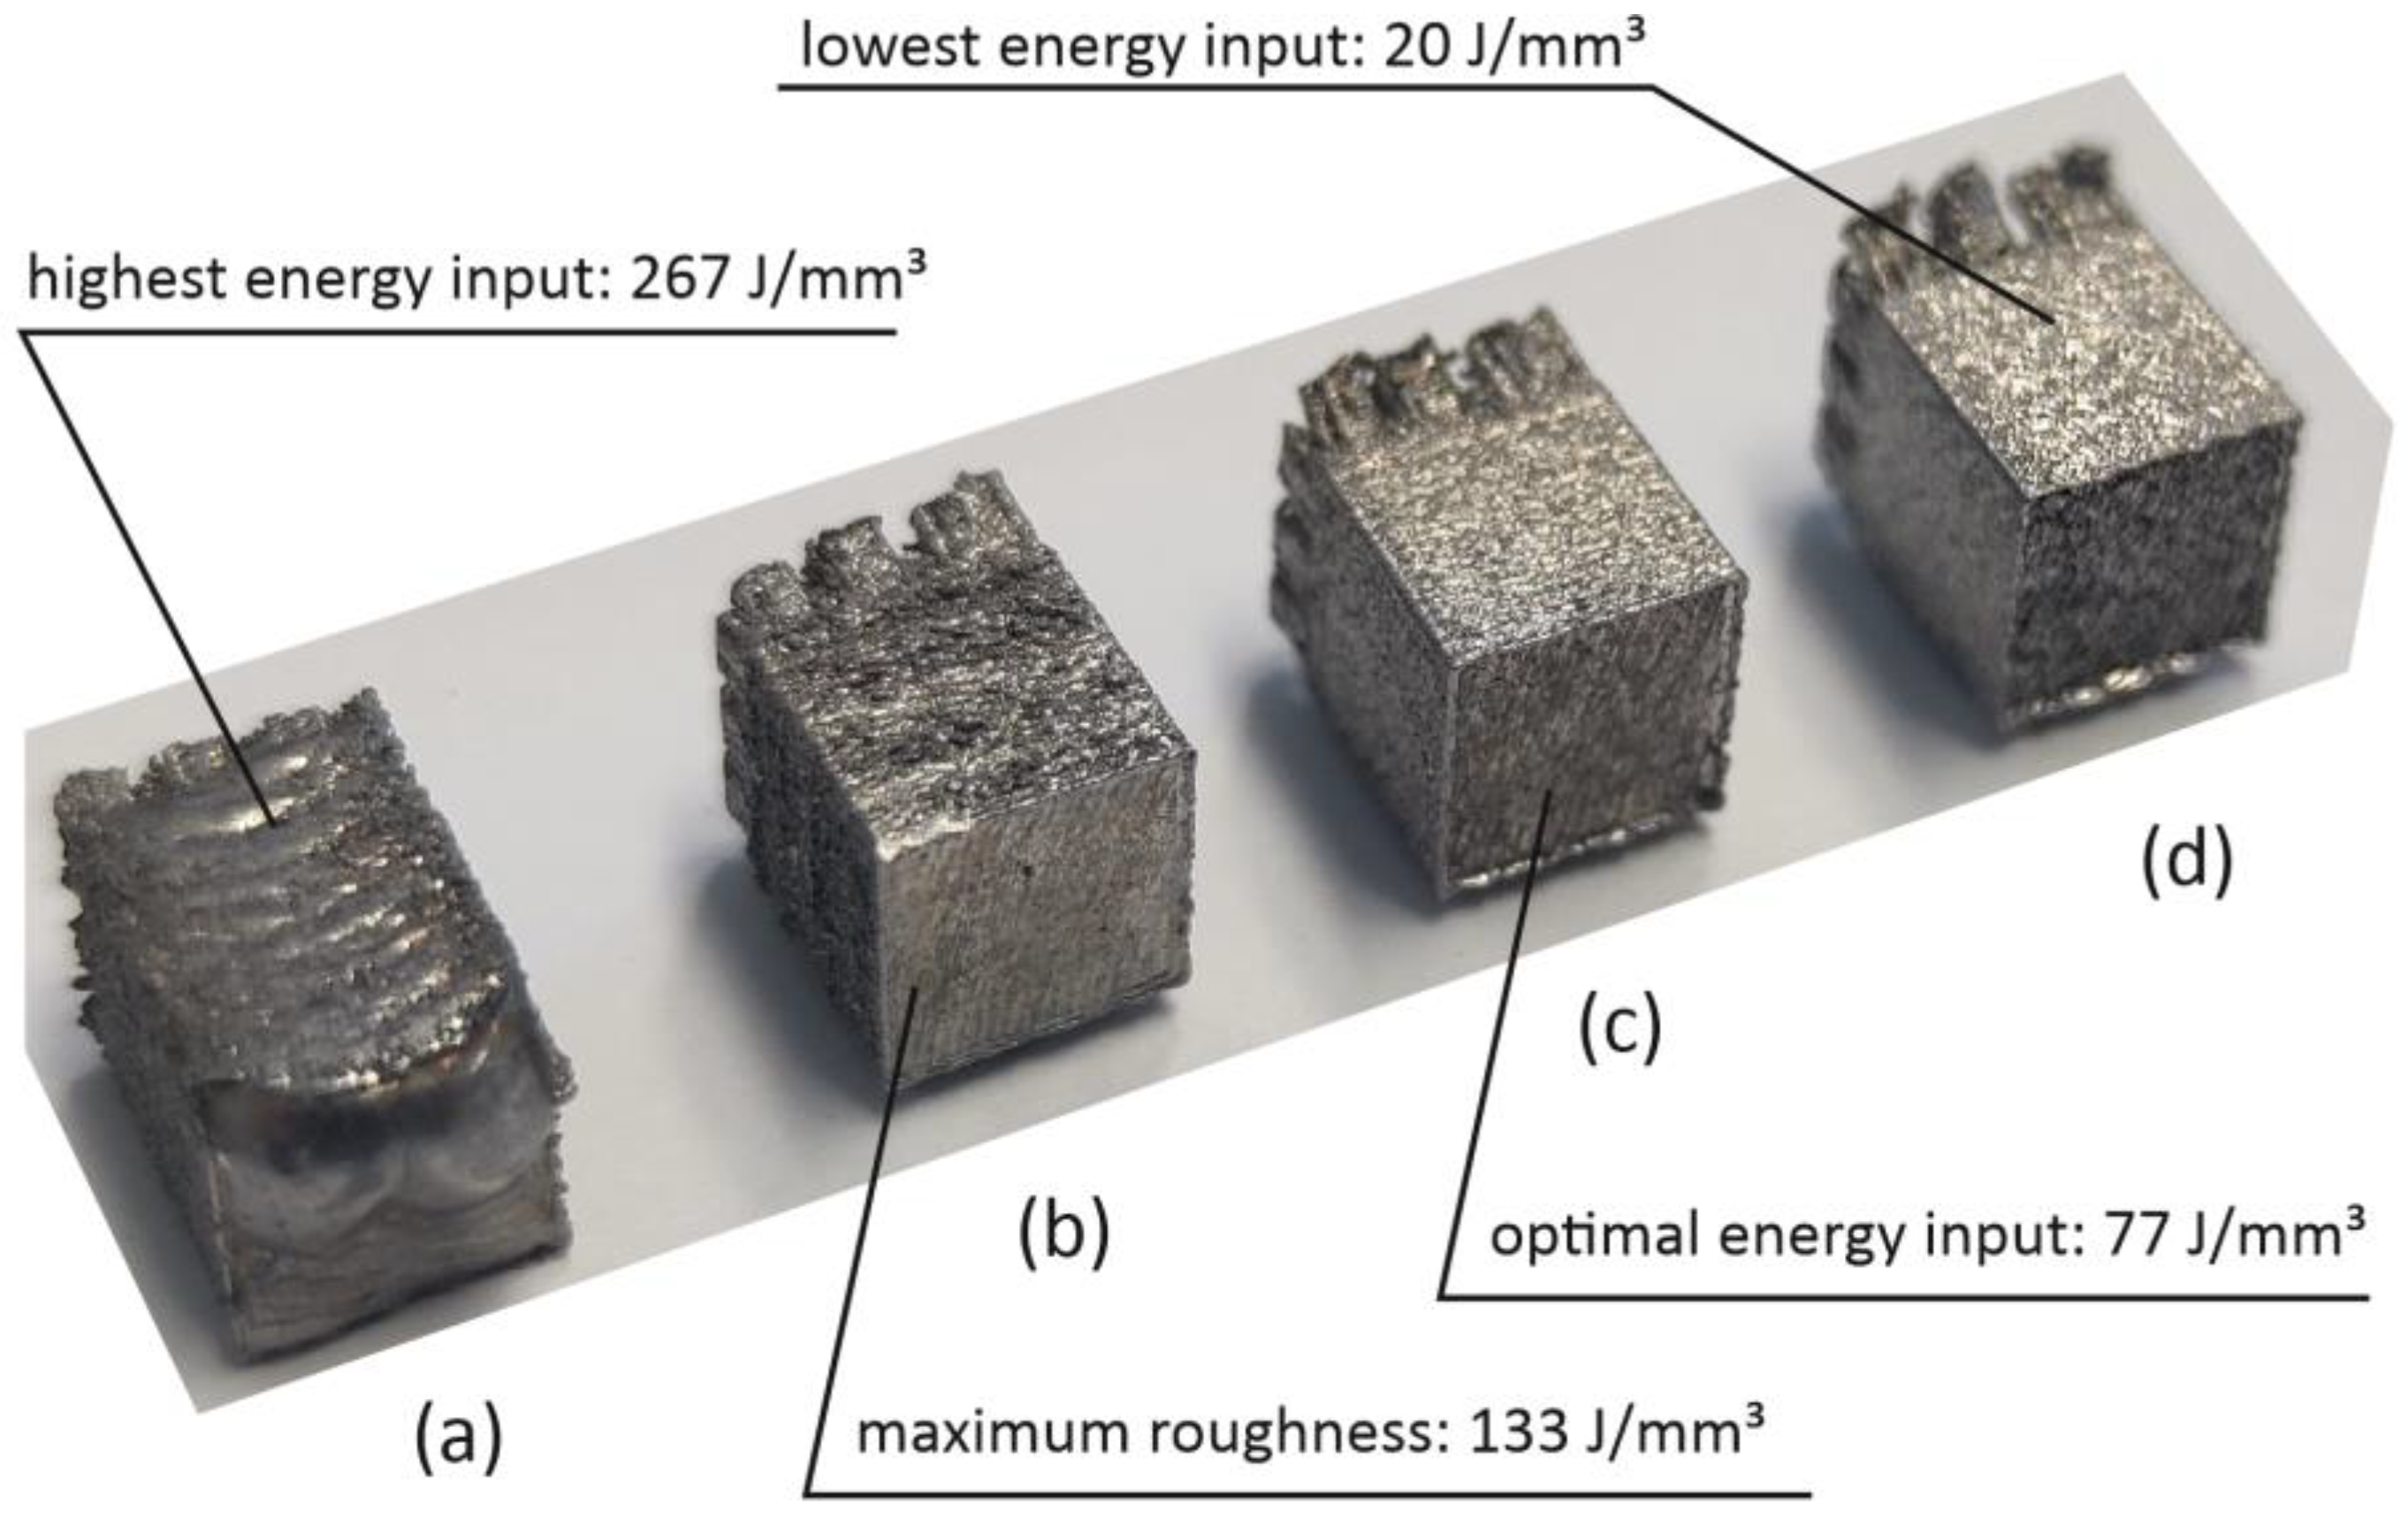
3.1. Density and Surface Roughness

The summary of the investigated effect of laser energy input on the relative density and surface roughness of the printed 35 samples is outlined in Figure 13a,b. One sample (nr. 26, 275 W, 0.5 m/s) was excluded from the results due to internal delamination caused by unknown, possibly re-coating-related reasons. Three clear areas of interest can be identified from the figure. First, in the range of 20–50 J/mm3, energy input was insufficient for homogeneous melting of the powder—as irregular lack-of-fusion porosities are abundant in the material. The lowest relative density identified in this study was only 47.91% dense, printed at the lowest settings of this study—20.8 J/mm3 (250 W, 2 m/s).
Secondly, in the region with a volumetric energy density of 66–130 J/mm3, the optimal melting region was identified, with near fully dense net-shaped parts fused, peaking at 100 J/mm3 with a 99.87% dense sample (300 W, 0.5 m/s). Thirdly, with higher input energy, at 166–233 J/mm3, over-melting of the samples was observed, resulting in the monotonous decrease of sample density.
Fully dense parts could be prepared over the entire investigated laser power range (250–400 W), but only within the scanning velocity rate of 0.5–1 m/s. The optimal laser power setting in this study is considered 350 W, 0.75 m/s (77 J/mm3). It offers the highest likelihood of obtaining near fully-dense parts, evaluated through the setting robustness; small deviations in both power and velocity would still result in over 99.5% relative density. The setting also correlated to near-lowest sample surface roughness—a critical requirement for obtaining useful printed structurally graded (air-gapped) magnetic cores. The values for surface roughness ranged from 6.8–18.2 μm for Ra and 36.1–85.2 μm for Rz. The average surface roughness of the printed parts did not increase monotonously with an increase in input energy density. Below 88 J/mm3 input power, all of the characterized sides of the samples were alike. Above it, the three different sides started exhibiting different melting patterns, resulting in an increased measurement dispersion. The samples melted at the highest power settings showed smoother surfaces overall than those melted at 91–133 J/mm3. The four most distinctive samples for illustrating the effect of melting parameters on printed part quality are presented in Figure 14.

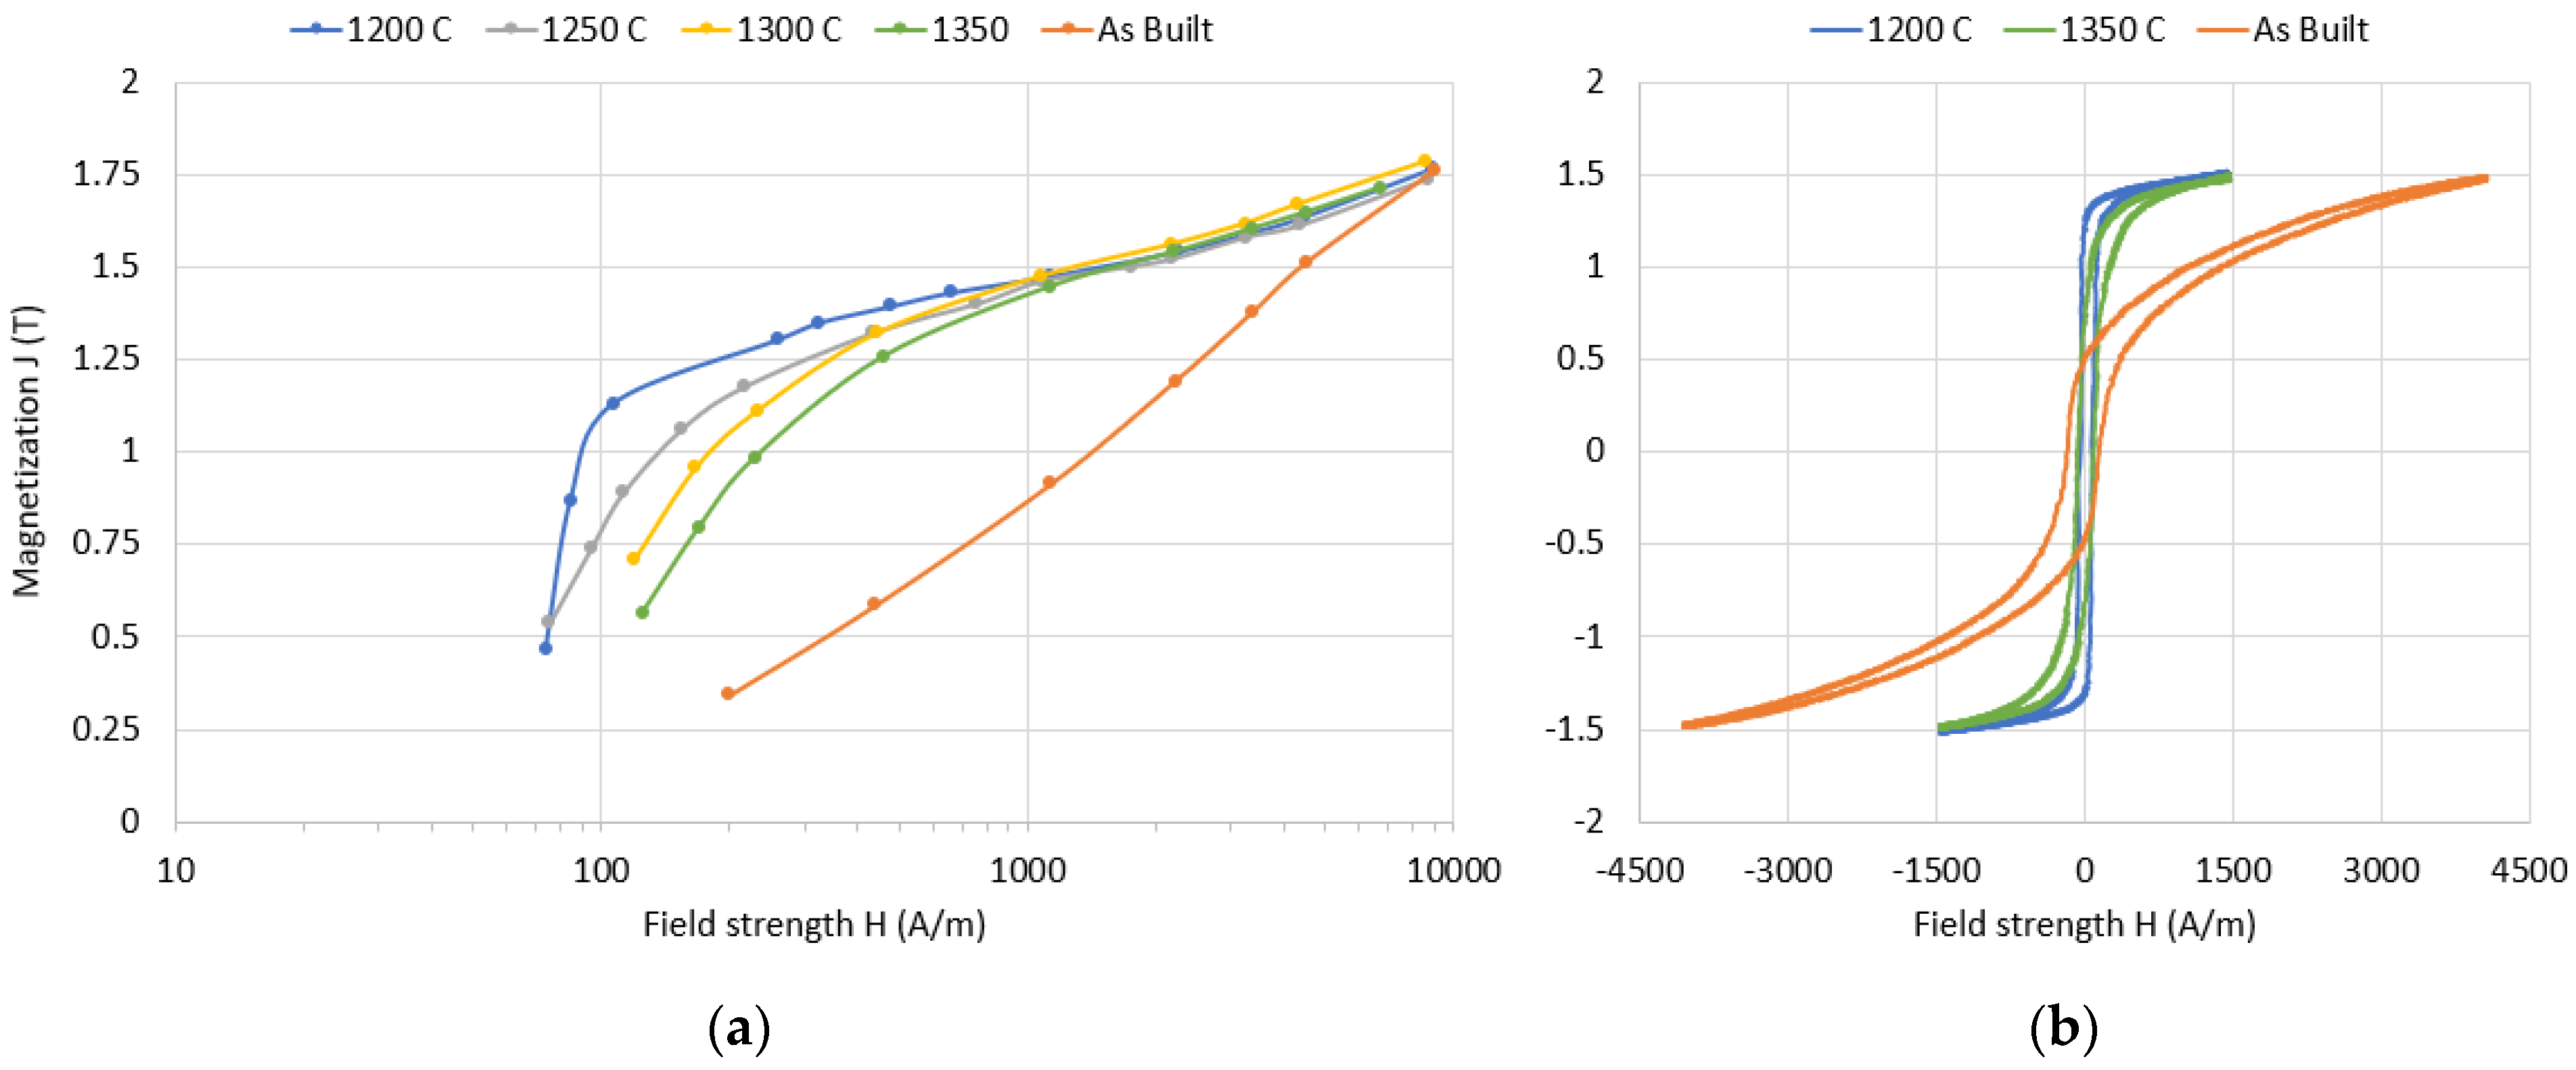
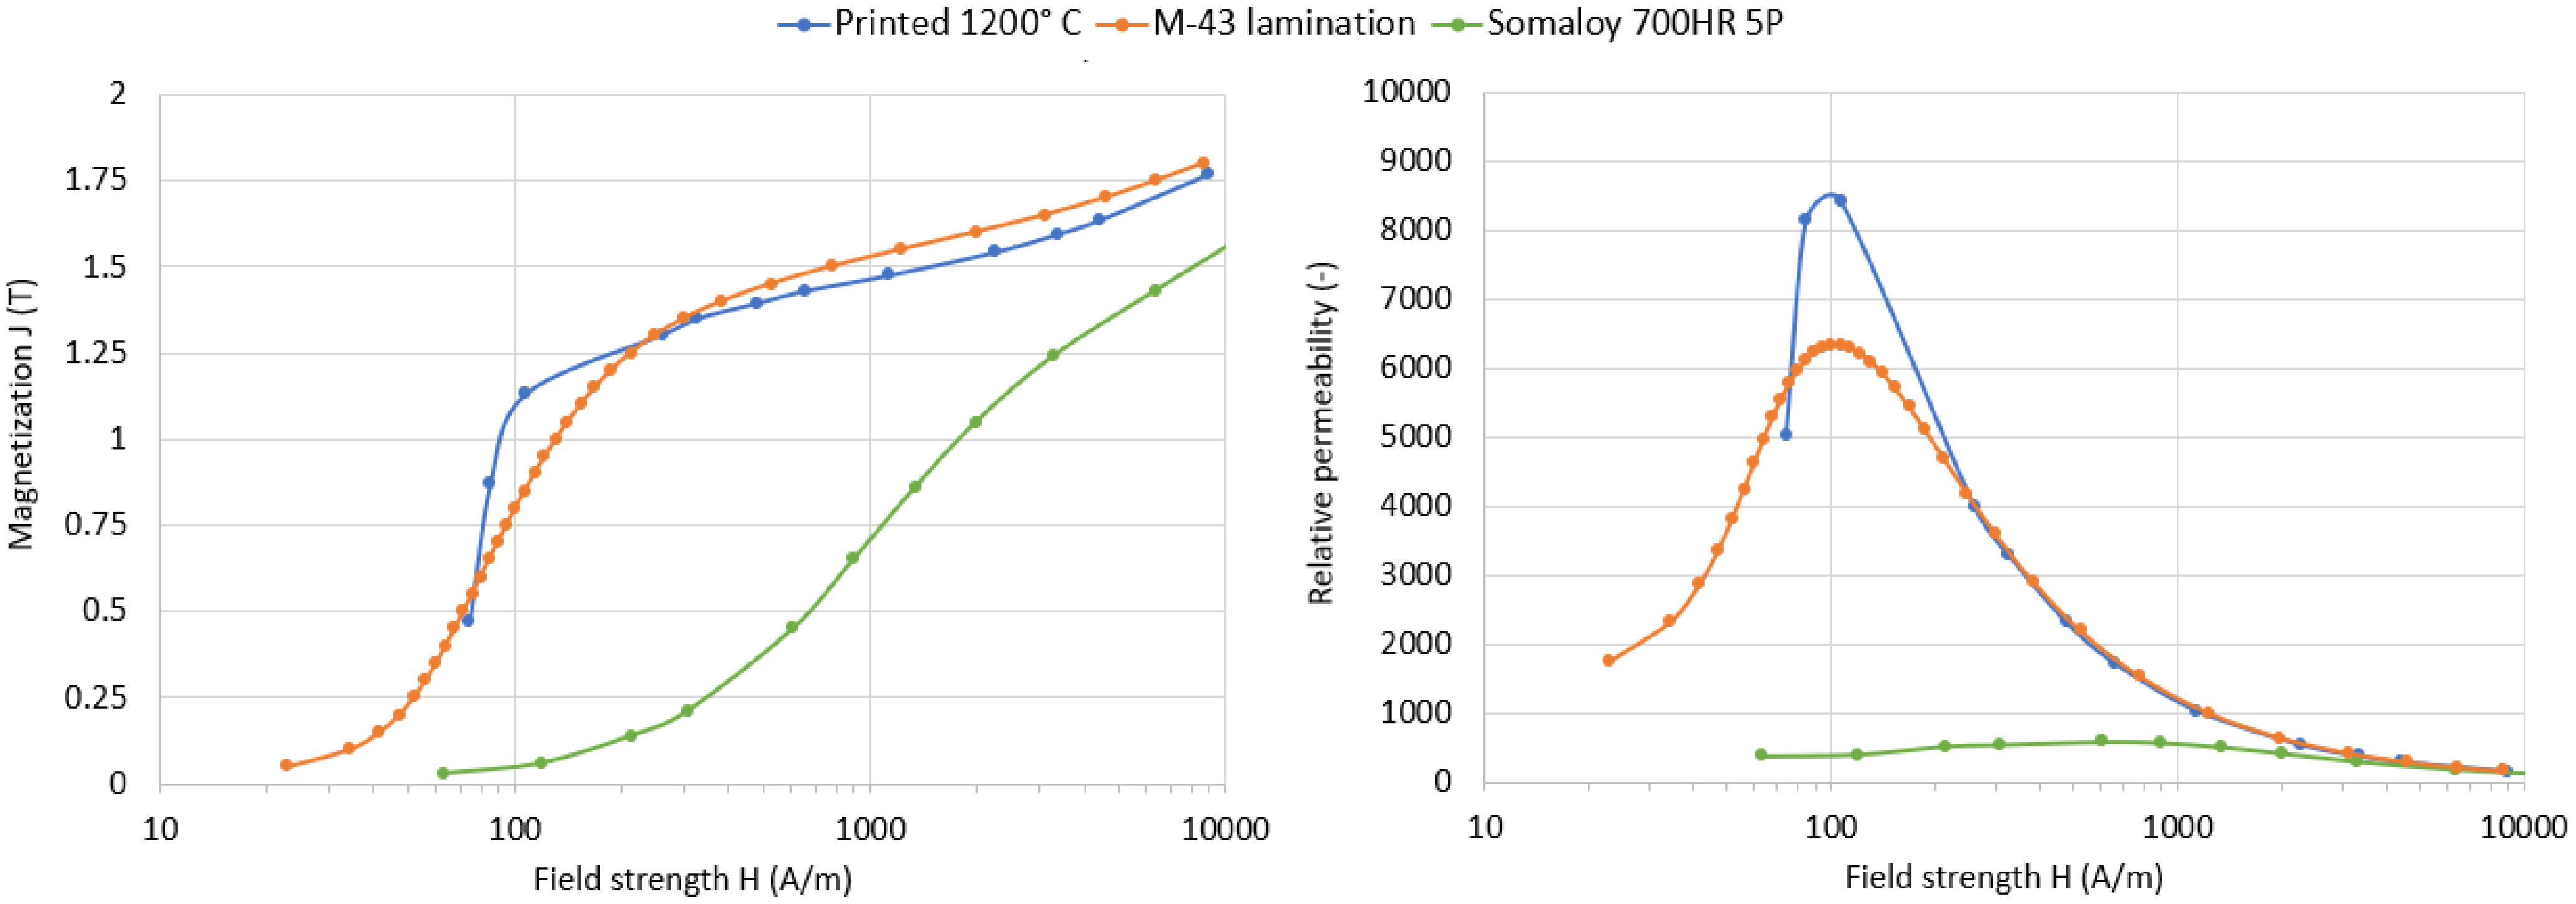
3.2. DC Magnetic Properties

The obtained magnetization curves of the characterized toroids, printed with the previously determined optimal parameters and subjected to varying heat treatments, are presented in Figure 15a. Post heat treatment, the magnetization of 1.5 T was achieved at approximately 1500 A/m on average. The as-built sample reached the same level of magnetization at 4000 A/m. The coercivity of the samples varied from 52 A/m (1200 °C) up to 203 A/m (as-built). Hysteresis curves of the material annealed beyond 1200 °C showed a slight deterioration of magnetic properties. This is apparent from the decreasing slope magnetization curves: annealing the samples over 1200 °C resulted in reduced permeability. The measurement noise of the method did not allow for the characterization of the annealed samples below ~0.5 T. Calculated maximum permeabilities decreased from 8900 (1200 °C) to 3700 (1350 °C) and reached as low as 1400 for the as-built sample. Full hysteresis curves for as-built and annealed material at 1200° and 1350 °C at 1.5 T magnetization are illustrated in Figure 15b.
Hysteresis losses of the samples were obtained from the integrated areas of the quasi-static hysteresis loops. The results are outlined in Figure 16. The non-annealed sample exhibited the highest losses, reaching 0.075 J/kg and 0.14 J/kg at 1 T and 1.5 T, respectively. The annealed samples again exhibited a slight deterioration in magnetic characteristics with an increase in annealing temperature. The lowest hysteresis losses were measured for the 1200 °C annealed sample, with losses as low as 0.016 J/kg (at 1 T) and 0.043 J/kg (at 1.5 T). At a 50 Hz excitation frequency, this translates to a 0.8 W/kg hysteresis loss at 1 T and 2.15 W/kg loss at 1.5 T material magnetization. A slight increase in core losses was observed for samples annealed at higher temperatures, increasing up to 30% at the highest temperature. The comparison of the prepared material with typical commercial materials is presented in Figure 17.

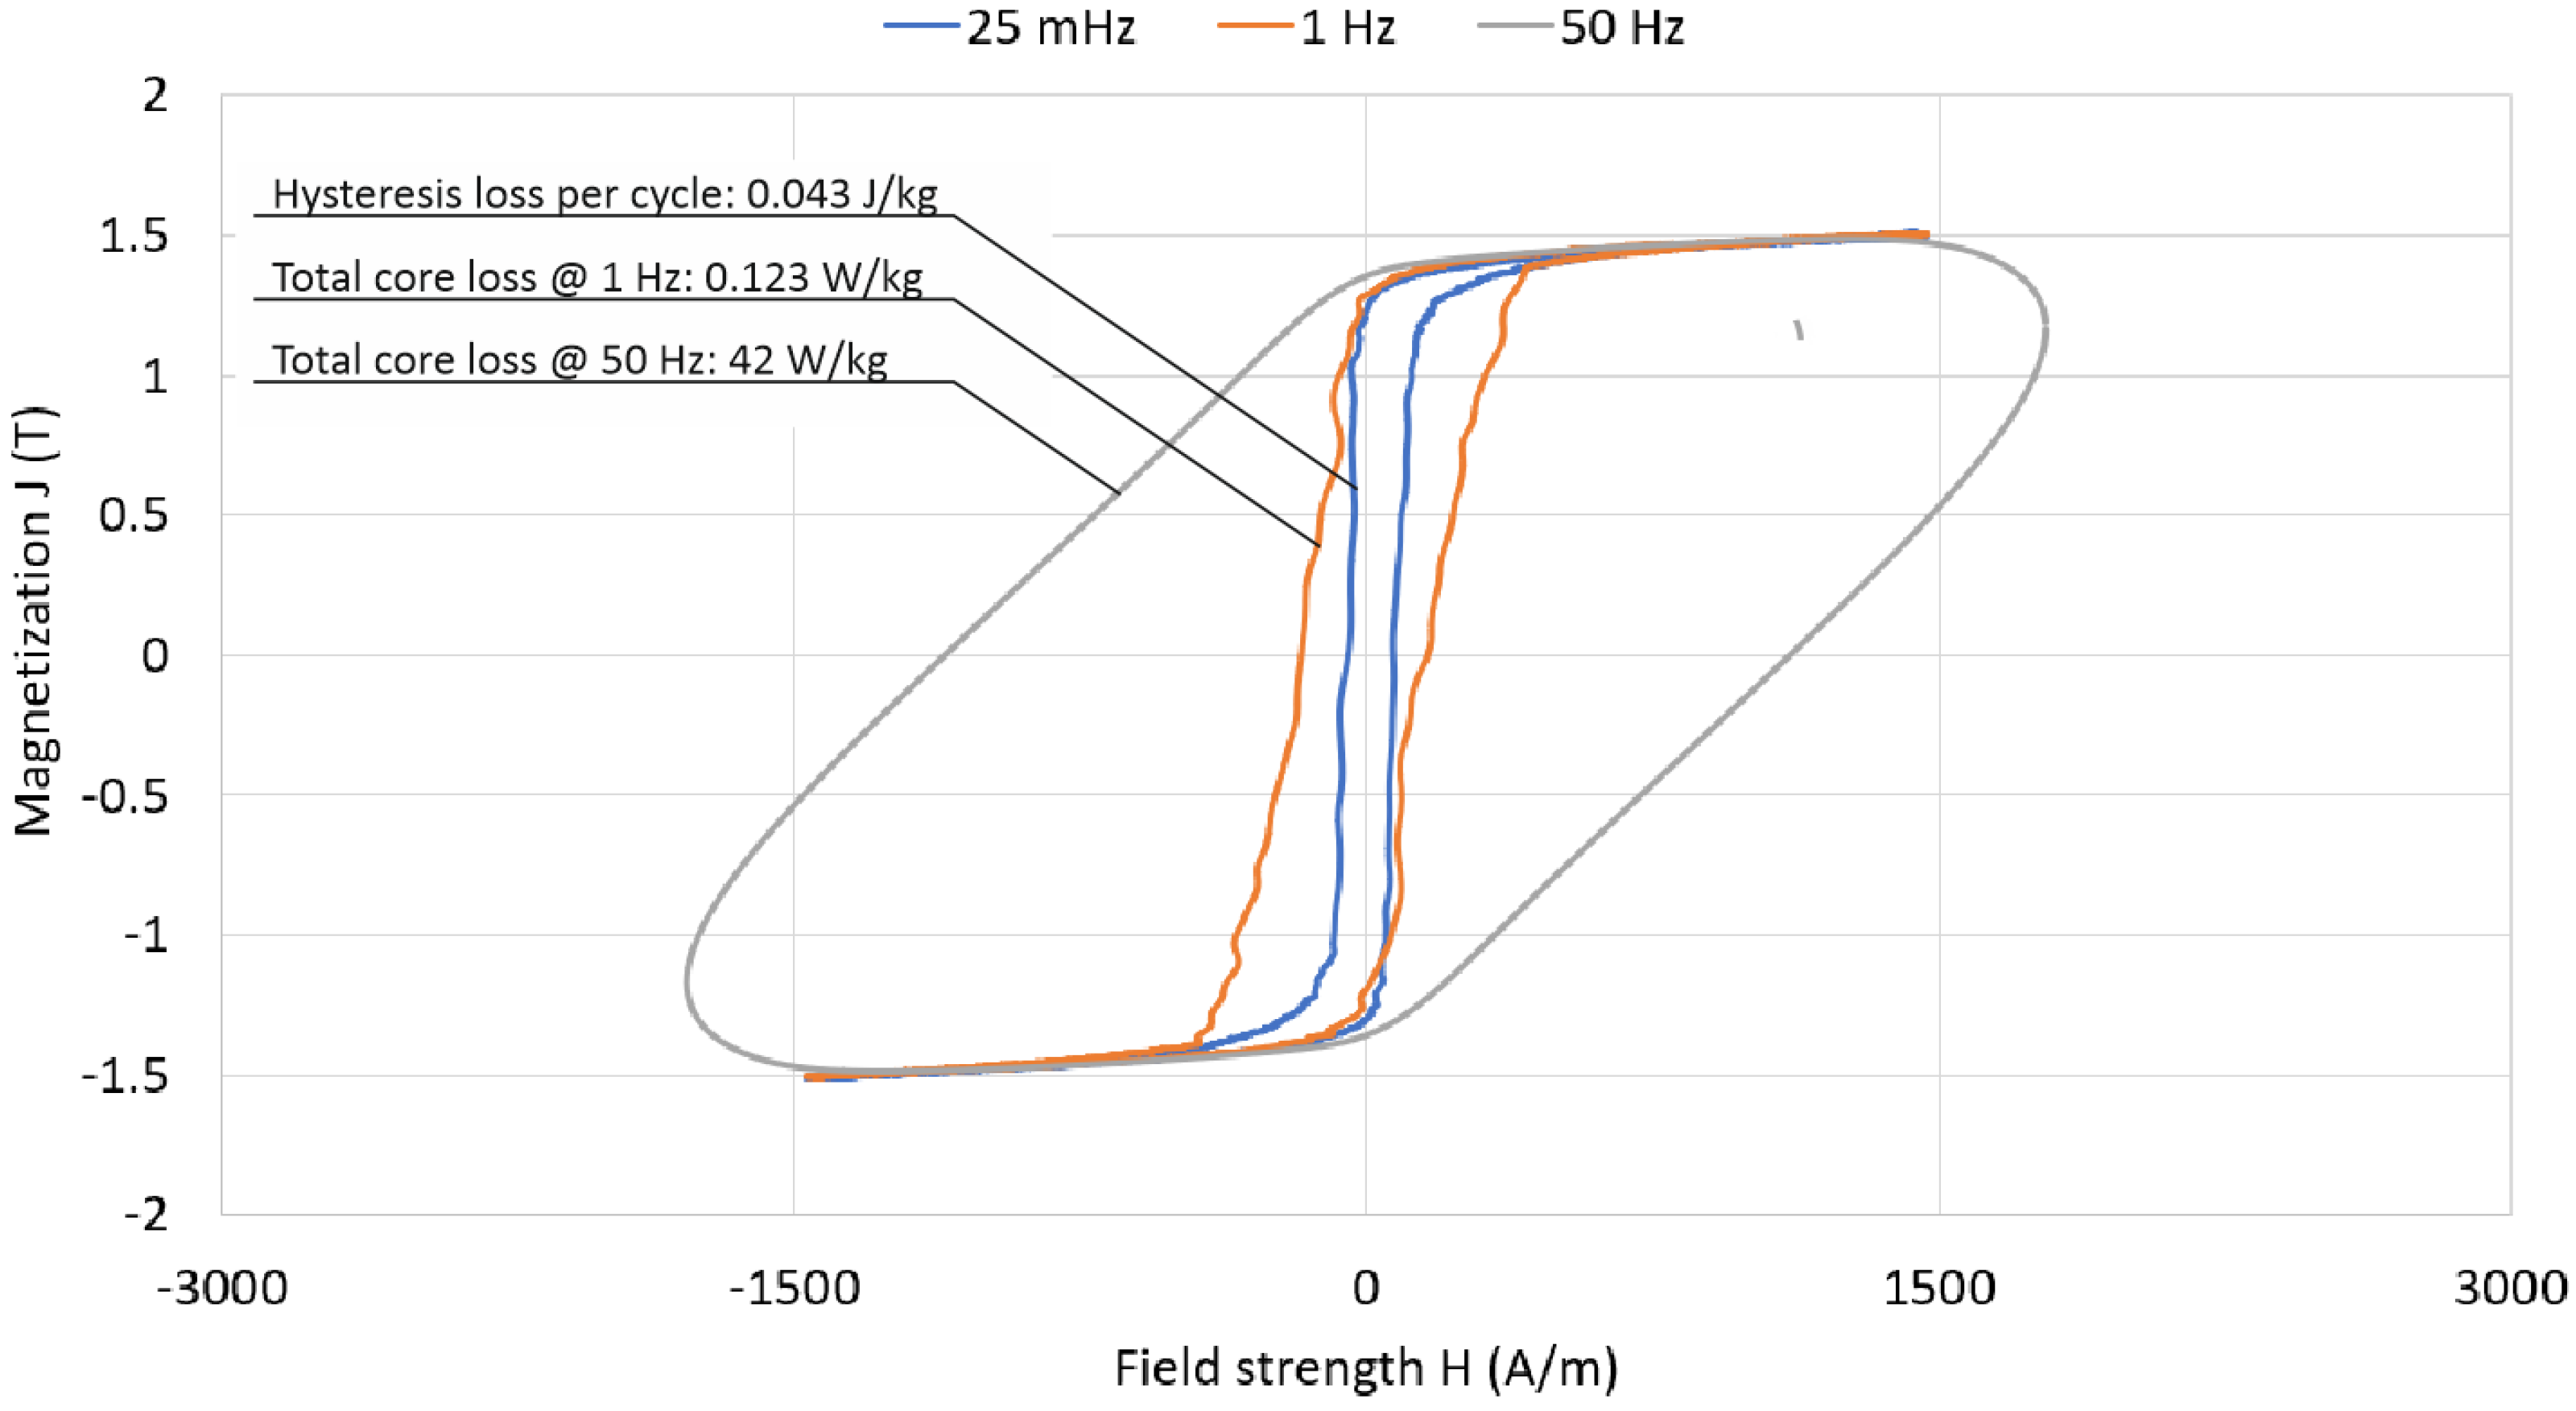
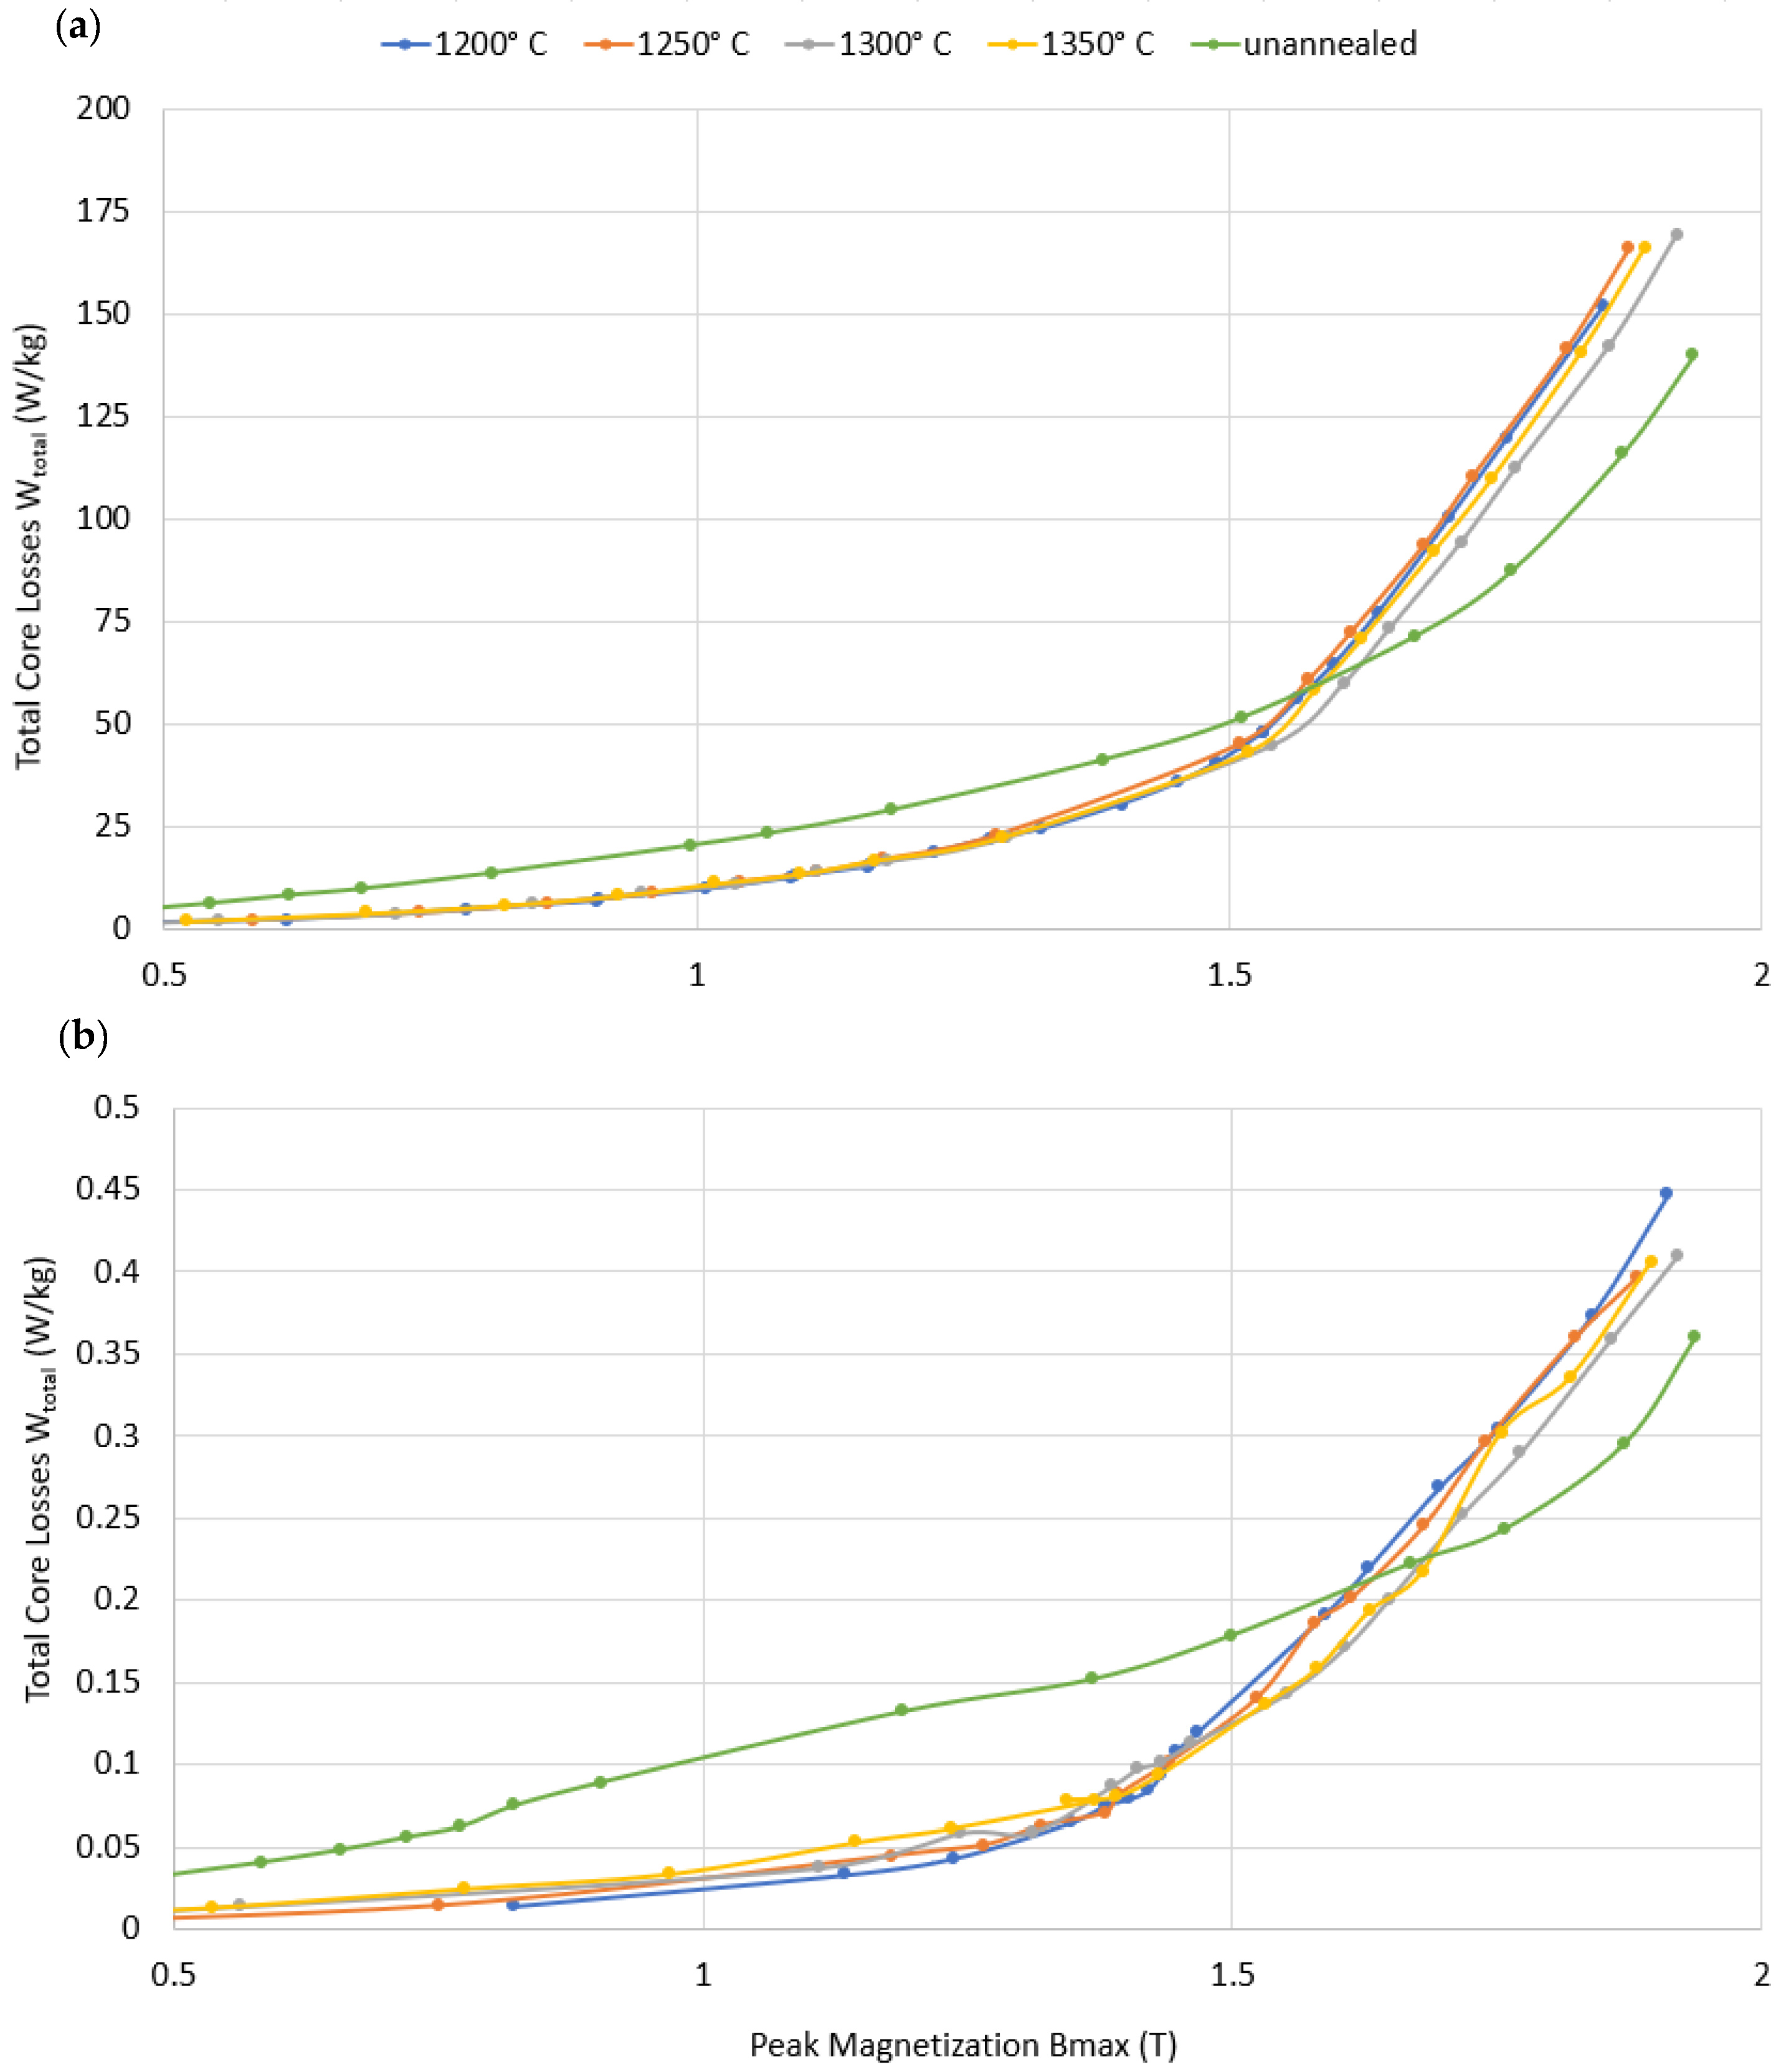
3.3. Eddy Current Losses

Next, the same toroidal samples were investigated at higher frequencies, increasing from 0.025 Hz to 1 and 50 Hz. Considerably higher iron losses were observed as expected, as eddy current losses are known to be proportional to the square of field switching frequency. This effect is illustrated in Figure 18, showing the widening of the hysteresis loops at elevated frequencies. The previously obtained hysteresis loss of 0.043 J/kg (at 1.5 T) equates to a 2.15 W/kg loss at 50 Hz. This is only 5% of the total core loss measured at 50 Hz, with 95% of the loss constituting classical and excess eddy current loss. At 1 Hz, compared to the DC hysteresis loss, the loss increased threefold. When comparing the iron losses over a wider range, ~0.5–1.9 T, as presented in Figure 19, two observations can be made. First, a sharp increase in loss was observed when magnetizing the samples beyond the knee. This increase was observed to be proportional to the maximum permeability of the material, i.e., materials with “hard saturation” behavior exhibited a sharper increase in core losses beyond the knee point than materials characterized by soft magnetic behavior. Similar behavior was observed in [37]. Secondly, the distinction between unannealed and annealed core loss was more prominent at 1 Hz. This is likely due to the low magnitude of eddy currents at 1 Hz and the significant hysteresis loss of the untreated material: at both 1.5 T and 1 T, 1 Hz, the hysteresis loss constituted 75% of the total measured core loss. Nevertheless, similar to the behavior at 50 Hz, in deeper saturation, despite the substantially lower DC losses, the losses of the annealed samples exceeded those of the untreated sample. All four of the annealed samples exhibited similar loss behavior: roughly 170 W/kg at 1.9 T, 45 W/kg at 1.5 T, 11 W/kg at 1 T, and 2 W/kg at 0.5 T.
Three additional cores with graded cross-sections were prepared to investigate eddy current suppression possibilities in printed cores. These samples were prepared with the previously determined optimal parameters for printing (350 W, 0.75 m/s, and 77 J/mm3) and thermal treatment (1200 °C 1 h). The initial design of the graded samples is described in Figure 9 and Figure 10. The structure of the finalized prototype cores is presented in Figure 20, illustrating both the voids within the core (obtained through metal tomography) and the joining support structure. The structural study verified the sample fill factors: for the horizontally graded sample—94.05%, for the vertically graded—78.07%, and for the hybrid core—72.98%. Secondly, the structural study revealed slight dimensional deviations from the initial models, exhibiting 0.32 mm vertical air gaps separating 0.75 mm thick magnetic guides (instead of 0.19/0.85 mm). These gaps were sufficient for removing all the unmelted powder from within the core. Realization of the horizontal air gaps was less successful, however, with the resultant air gap relatively uneven.
For the construction of hysteresis curves, the core fill factor was included in the calculations to provide an accurate comparison per weight of the samples (Equation (4)). Without it, flux densities within the material would be lower by a margin of non-magnetic air introduced to it. An amount of 1.5 T magnetization in the iron volume of the samples would translate to 1.1 T in the total volume of the 72.98% dense samples, 1.17 T in the 78.07%, etc. This would, however, give a false perception of the core behavior due to its nonlinearity, especially when considering losses per kilogram of the material (which, unlike W/m3, is invariant of air content within the core).
Magnetic measurements confirmed the higher efficiency of vertical to horizontal air gaps for eddy current suppression. Magnetic losses at 50 Hz, in the range of 0.5–1.8 T, are outlined in Figure 21a. At 1.5 T magnetization, total iron losses decreased from 42 W/kg (solid) to 35 W/kg with horizontal grading, 15.5 W/kg with vertical grading, to as low as 11.7 W/kg with hybrid grading. At 1 T, the topological enhancements led to the decrease of total core losses by 81%: from 9.6 W/kg (solid) to 1.8 W/kg (hybrid). The other two graded samples exhibited losses in between: 2.1 W/kg (vertical) and 7.3 W/kg (horizontal). These results are further expanded upon in the Section 4 of the paper.

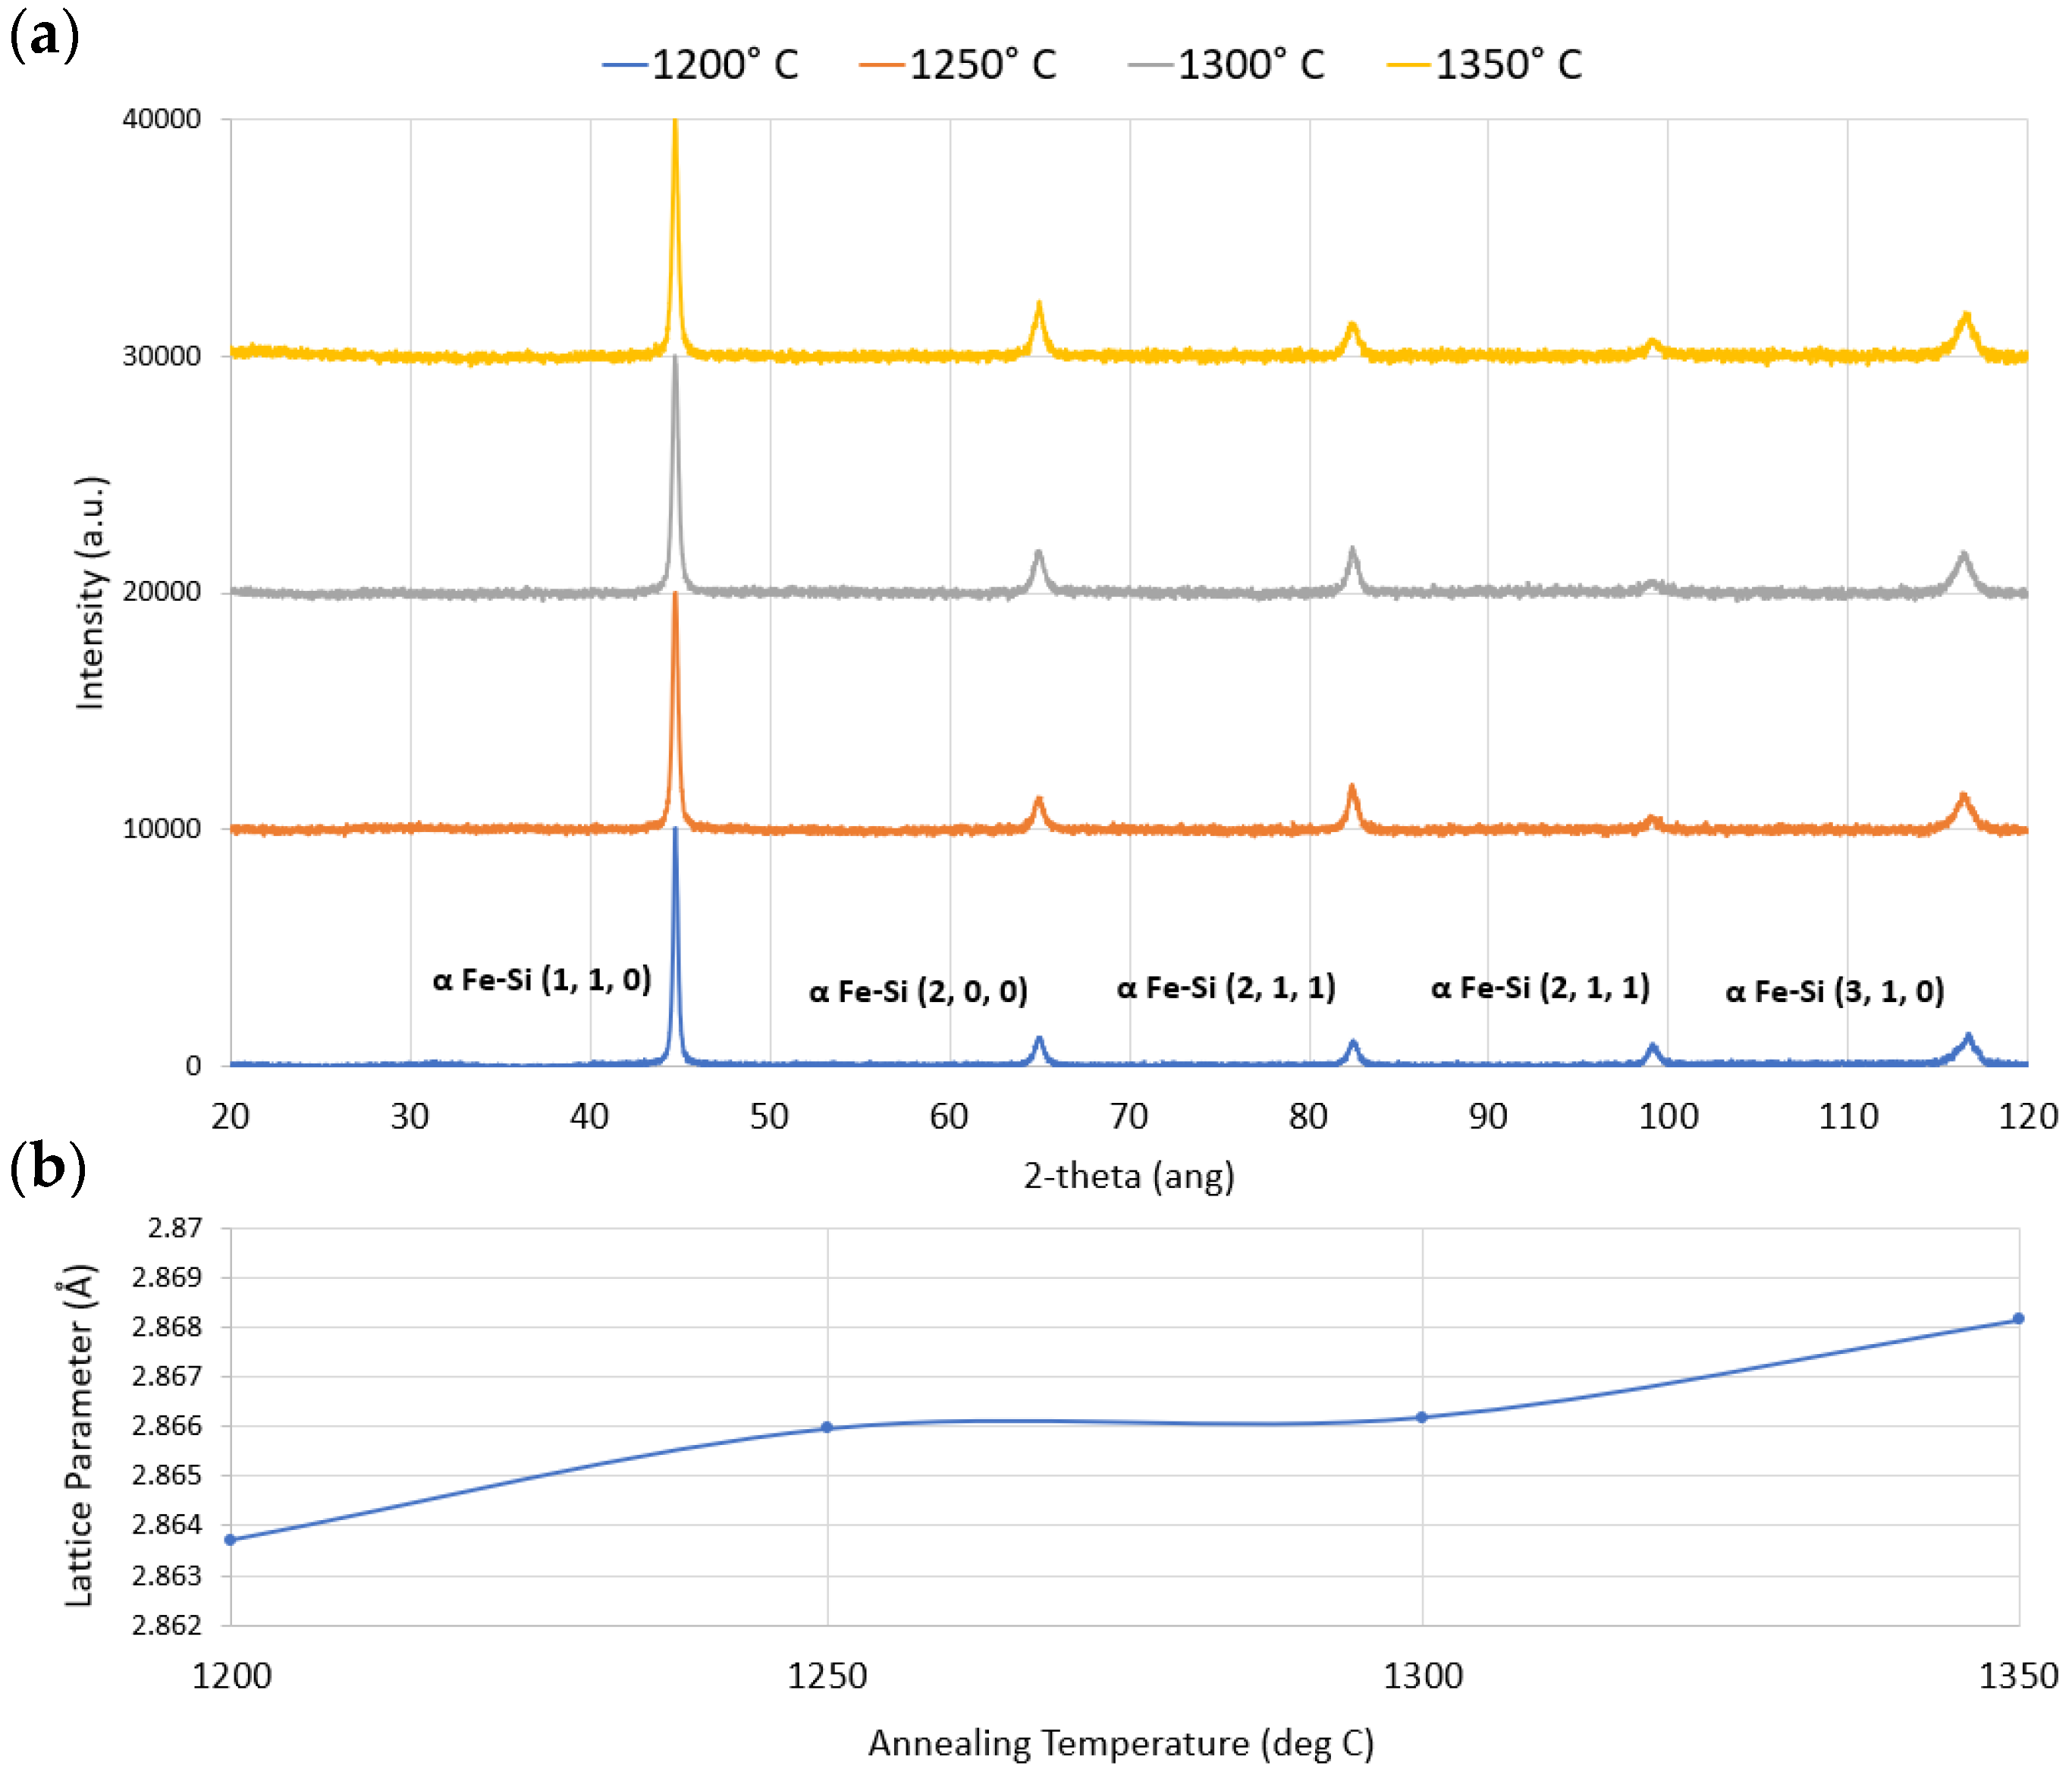
3.4. XRD Microstructural Study Results

XRD measurements confirmed the formation of a single α-ferrite BCC (body-centered cubic) phase within the samples. High silicon content (3.7%) suppressed the γ-phase formation [38] during solidification. Five peaks from the ferrite phase were obtained between 44 and 116°, without any impurity-related peaks (nitrification, carburization, and oxidation from printing annealing), as presented in Figure 22a for the normalized diffraction patterns. Significant differences between the patterns of samples annealed at different temperatures were not observed. Similar to the work in [39], no superstructural lines were observed, which also suggested that coarse areas of ordered B2 and DO3 phases were not present in the microstructure. Lattice parameters calculated from the d-spacing of each peak increased slightly with elevated annealing temperatures: from 2.864 to 2.868 Å, but remained roughly within the range of typical data for the alloy [40]. In every sample, the largest crystallite size corresponded to the α Fe-Si (1,1,0) peak: ranging between 236–361 nm, with the 1200 °C heat treatment sample exhibiting the largest values.

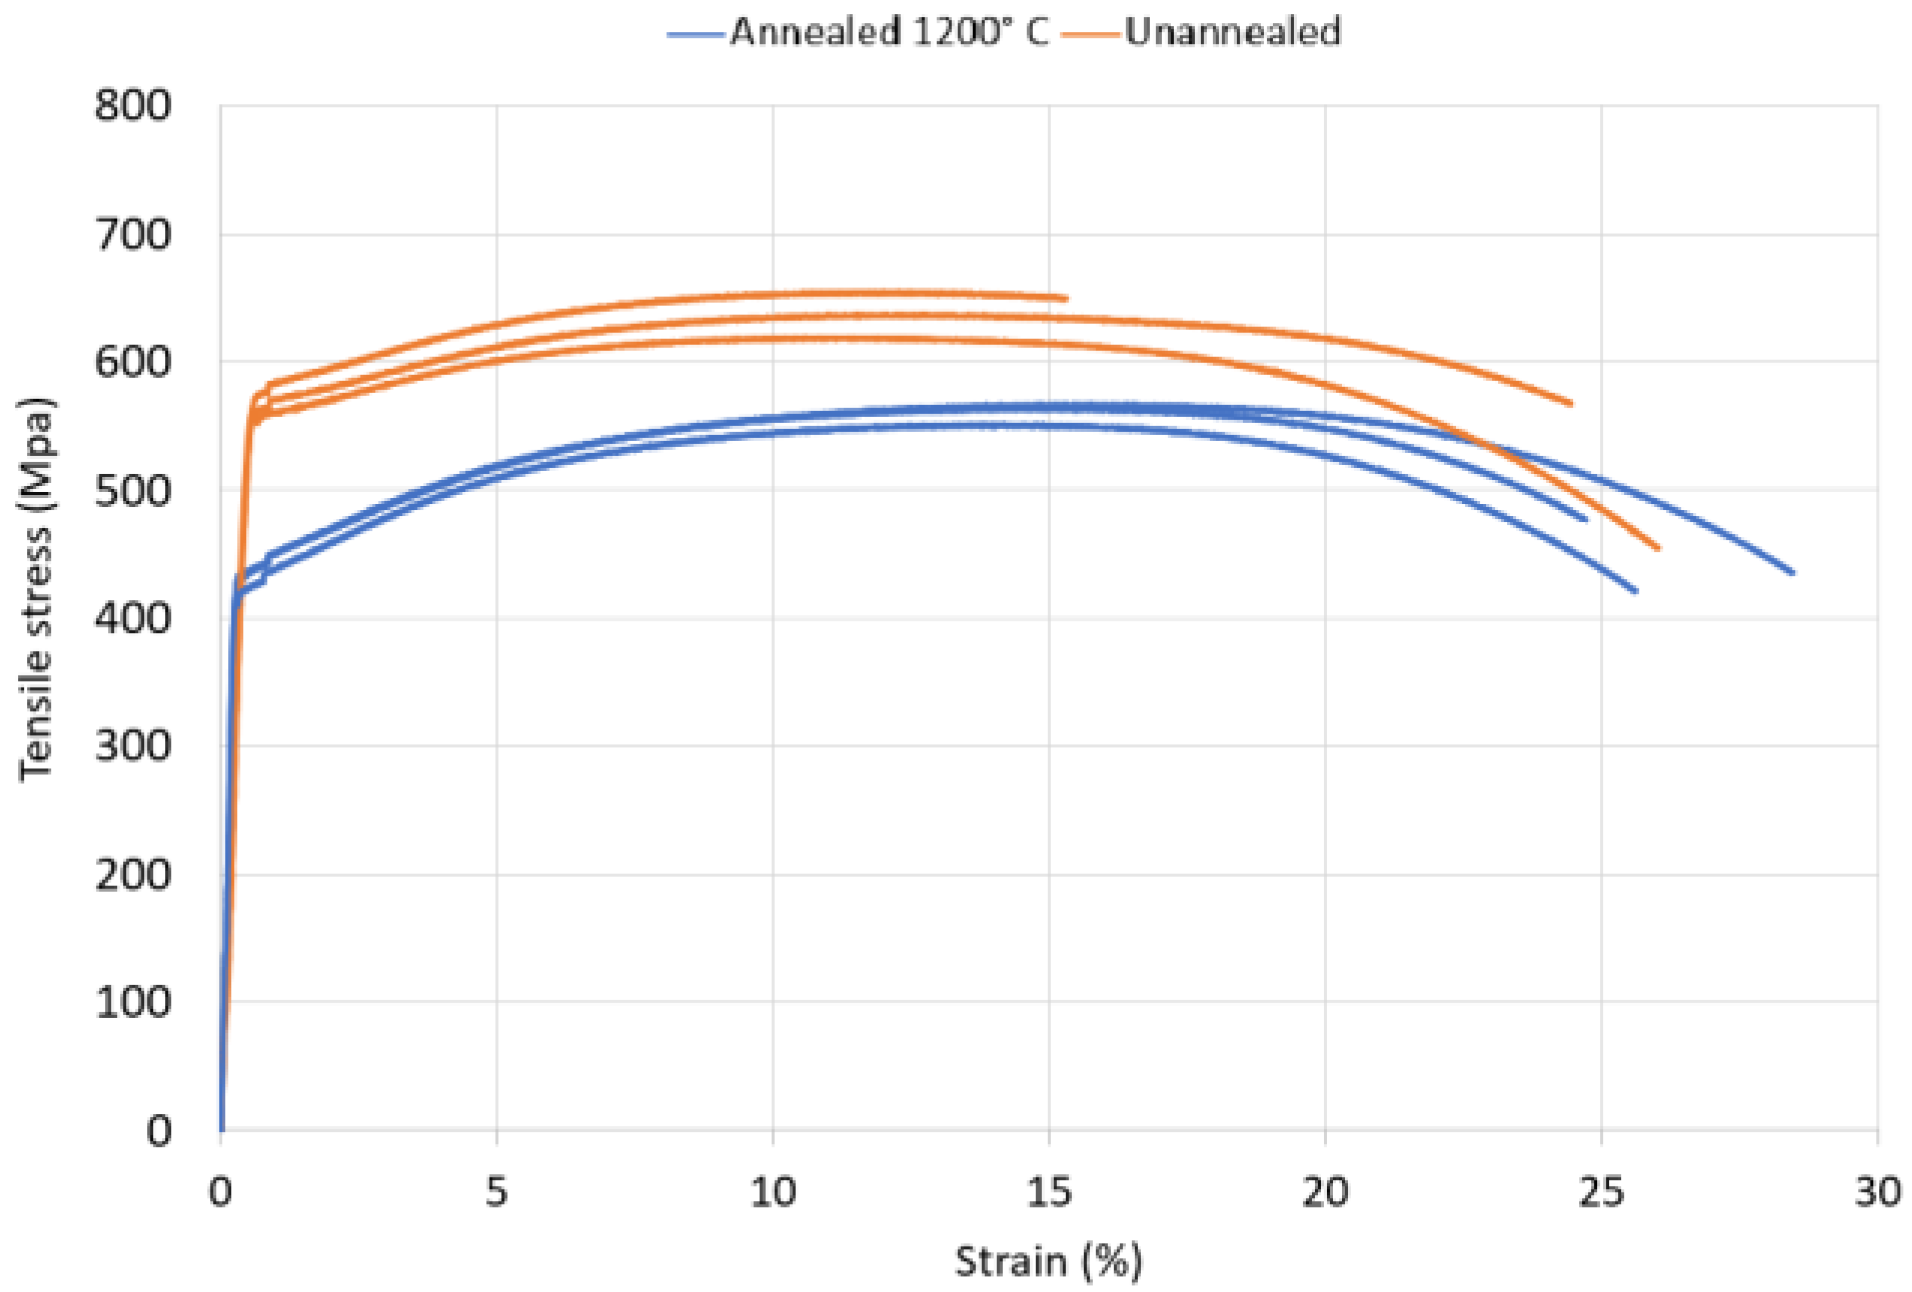
3.5. Material Tensile Strength

The material’s tensile strength was verified with vertically printed round tension test samples for both 1200 °C annealed and non-annealed (as-built) conditions. The measured stress-strain curves of the six prepared samples (thee annealed + three untreated) are outlined in Figure 23. A drop in material yield strength was observed post-annealing: from ~570 Mpa to ~420 Mpa. The elongations at break of the samples were similar for both the untreated and treated material, reaching approximately 25% strain (elongation). These results are further expanded upon in the Section 4 of the paper.

4. Discussion

Relatively large variations in the laser processing parameters of silicon steel are available in the literature. The energy density verified as optimal in this study—77 J/mm3 (laser power: 350 W; scan speed: 750 mm/s; hatch spacing: 120 μm; layer thickness: 50 μm)—is somewhere between the maximum and minimum values applied in the literature. In [41], 59 J/mm3 (200 W; 680 mm/s; 100 μm; 50 μm) was used to fuse parts with unknown density (the samples were hot isostatic pressed to remove residual porosity before measurements). In [42], Stornelli et. al. determined the optimal energy density to be 138 J/mm3 (250 W; 1000 mm/s; 60 μm; 30 μm) for 3% silicon steel samples, with likely overestimated values of relative density. Garibaldi et. al. applied 93 J/mm3 (70 W; 500 mm/s; 60 μm; 25 μm) to fuse 98.5% dense parts from 6.9% silicon steel. In [43], a considerably higher energy density of 225 J/mm3 (90 W; 200 mm/s; 80 μm; 25 μm) was applied to fuse 6.5% silicon content parts with above 98% relative density. Similarly, Goll et. al. obtained the lowest hysteresis losses in near fully-dense samples when melting the powder with a 200 J/mm3 energy density (300 W; 500 mm/s; 60 μm; 50 μm) [44].
Similarly, regarding the maximum relative permeabilities of the characterized AM silicon steel cores in the literature, large variations can be found. For high silicon steel, printed and treated with similar parameters, they have been shown to range from 8000 [43]–31,000 [44]. In this paper, the maximum relative permeability of 8400 was obtained, showing superior values to typical silicon steels (M-43 with 6500 [35]), but considerably lower values when compared to high silicon steel due to larger magnetostriction. These values are relatively low compared to grain-oriented silicon steels, which can reach relative permeabilities of ~100,000, but are only suitable for applications with a unidirectional magnetization (such as transformers) [45]. Even higher values could be obtained with soft magnetic amorphous glasses, which can reach relative permeabilities in the range of ~500,000 [46], but require additional research for implementation with additive technologies. In this study, the elevated annealing temperatures resulted in a slight reduction of DC magnetic properties, decreasing both the relative permeability and increasing the material hysteresis losses. As generally larger grain sizes have been linked to improved magnetic properties, this phenomenon is challenging to explain. On one side, it is possible that at elevated temperatures, the sample surface was contaminated more intensely in the annealing furnace with evaporated carbon within the chamber. This might have resulted in the whole carbonized surface of the sample pinning the large recrystallized grains. On the other hand, the recrystallized grains annealed at 1350 °C are uncommonly large. Judging by a fracture surface of a test sample (Figure 24), the macroscopic grains are as large as ~2500 μm. Effects of this grain size on the magnetic properties are largely unexplored, with the majority of the studies focusing more on the range 50–210 μm [47]. In comparison, in {Formatting Citation}, a coarse-grained microstructure with D50 = 720 μm was obtained at an 1150 °C annealing temperature.
The obtained total core losses were lower than initially supposed; the goal of obtaining superior loss behavior to soft magnetic composites (SMCs) was fulfilled successfully. At W10,50, total core losses for the segregated topology sample were 1.8 W/kg: this is 2–3 times lower than typical SMCs under the same conditions [36] (of course SMCs are superior for high frequency applications). Moreover, the permeability of the printed material is far superior, exhibiting maximum μr values in the range of 8000 in contrast to 500–600 [37] of SMCs. The low losses suggest the capacity of L-PBF to fabricate useful novel electrical machine prototypes; as compared to SMCs, it can be used to fabricate cores with superior energy efficiency and even wider design freedom. Undoubtedly, the comparison only stands per mass of the sample; if compared per volume, similar core losses would be obtained. This is because of the relatively wide voids introduced into the material, reducing the effective cross-section and magnetic material content by 27% (with hybrid core topology). Nevertheless, this means that AM core components would be at a disadvantage only if the size of the component was a critical factor. For applications with weight as the main criterion, AM cores can be used effectively, and perhaps even with improved machine cooling capacity, with the insulating gaps doubling as cooling channels.
In comparison with the gold standard of electrical machine core materials, non-oriented silicon steel laminations, three major conclusions can be drawn. First, the permeabilities and material magnetic polarization obtainable at low field strengths are near equivalent (as presented in Figure 17). The printed material exhibited slightly higher permeability (at low polarization) and lower overall saturation polarization than M-43 commercial steel [36], which can be explained through the likely higher silicon content (exact silicon content in commercial laminations is not usually disclosed) alongside a larger grain size (lamination grain size is typically in the range of 100–200 μm [16]). It is important to note that larger grain size has been shown to be more advantageous at low field strengths, but disadvantageous at higher ones. Shiozaki et. al. showed that in laminations under weak magnetic fields of W14,50 or less, large grain diameter (220 to 230 μm) was optimal, offering minimum core loss and maximum permeability, whereas in strong magnetic fields of W15,50 or higher, better results were obtained with smaller grain diameters (190 to 110 μm) [47]. A parallel can be drawn between the observations in this paper: annealed samples exhibited lower core losses below the magnetization knee-point and higher losses above it (Figure 19) compared to the as-built sample. The effect seemed to be more profound with higher sample permeability and is likely related to either classical or excess eddy current loss—as it was not observed in DC hysteresis loss. Alternatively, Honma et al. [48] demonstrated the effect of precipitates such as oxides and nitrides on the annealed steel surface layer, which increased hysteresis loss at higher values of core magnetic induction because of difficulties in domain wall motion. This suggests that excessively coarsened grain structure can be suboptimal, due to the longer annealing times required and, consequently, the thicker oxide layers formed on the core surface.
Secondly, the obtained iron loss of 1.8 W/kg at 1 T, 50 Hz of the hybrid AM core are almost competitive with regular non-oriented low-silicon steels. M400-50A (M-43), depending on the manufacturer, exhibits equivalent losses in the range of ~1.4–1.7 W/kg. The EVS-EN 10106 international standard requires M400-50A laminations to exhibit the maximum loss of 1.7 W/kg [49]. Low-grade steels, such as M600-50A or 1000-65A, exhibit higher losses with 2.6 W/kg and 4.11 W/kg, respectively (data obtained from different datasheets [50,51,52]). At higher flux densities, the same comparison does not stand, however. The 11.7 W/kg loss measured for the hybrid sample exceeds the loss of low-grade 1000-65A steel (8.90 W/kg) [51]. This can again be explained through the sub-optimal grain size associated with high flux density magnetization (excessive grain size) [47].
Thirdly, the tensile strength of the material was well within the requirements for electrical steels. On average, the yield strength of the material was 580 MPa before annealing and 420 MPa after it. These values are in good agreement with the literature. In [53], the typical yield strength of electrical steels was shown to range from 53,000 Psi (365 Mpa) for 3% silicon steel, 60,000 Psi (413 Mpa) for 3.7% silicon content, and 13,000 Psi (90 Mpa) for 6.5% silicon steel. In a commercial catalogue [50], the yield strength of 350 MPa was disclosed for Isovac 400-50A silicon steel sheets. Despite the relatively high yield strength of the prepared material, the structural stability of the air-gapped core requires additional optimization and testing due to the introduced air gaps. The determination of the optimal size of the connecting bridges between the individual insulated magnetic guides, which ensures mechanical integrity while not sacrificing excessively the core internal electrical resistivity, is necessary.
In regards to the topologies of the investigated prototype cores, several aspects can be improved. A comparison between the planned topology and the actual printed topology is outlined in Figure 25. The integration of horizontal air gaps into the material was relatively unsuccessful, as their efficiency in reducing core eddy currents was low. Undoubtedly, the density of the connecting lattice structure was too high (Figure 20a,c). This resulted in considerable electrical short-circuiting between the optimally fully insulated core volumes. In parallel, the height of the horizontal insulation layers should be increased to enhance both the insulation reliability and to improve powder removal from within the support structure post-printing. With the prototype cores, the overly dense and thin lattice layers prevented the removal of unmelted powder from the cores after printing. If this powder was sintered during the annealing process, it could have also resulted in further increased eddy current losses. In addition to the core printing parameters, the skin parameters also require further optimization to enhance planar printing accuracy—as the width of the printed laminations was lower than initially designed.

5. Conclusions

The paper describes the full optimization process for obtaining laser additively manufactured soft magnetic cores with useful properties. The findings of the paper are the following:
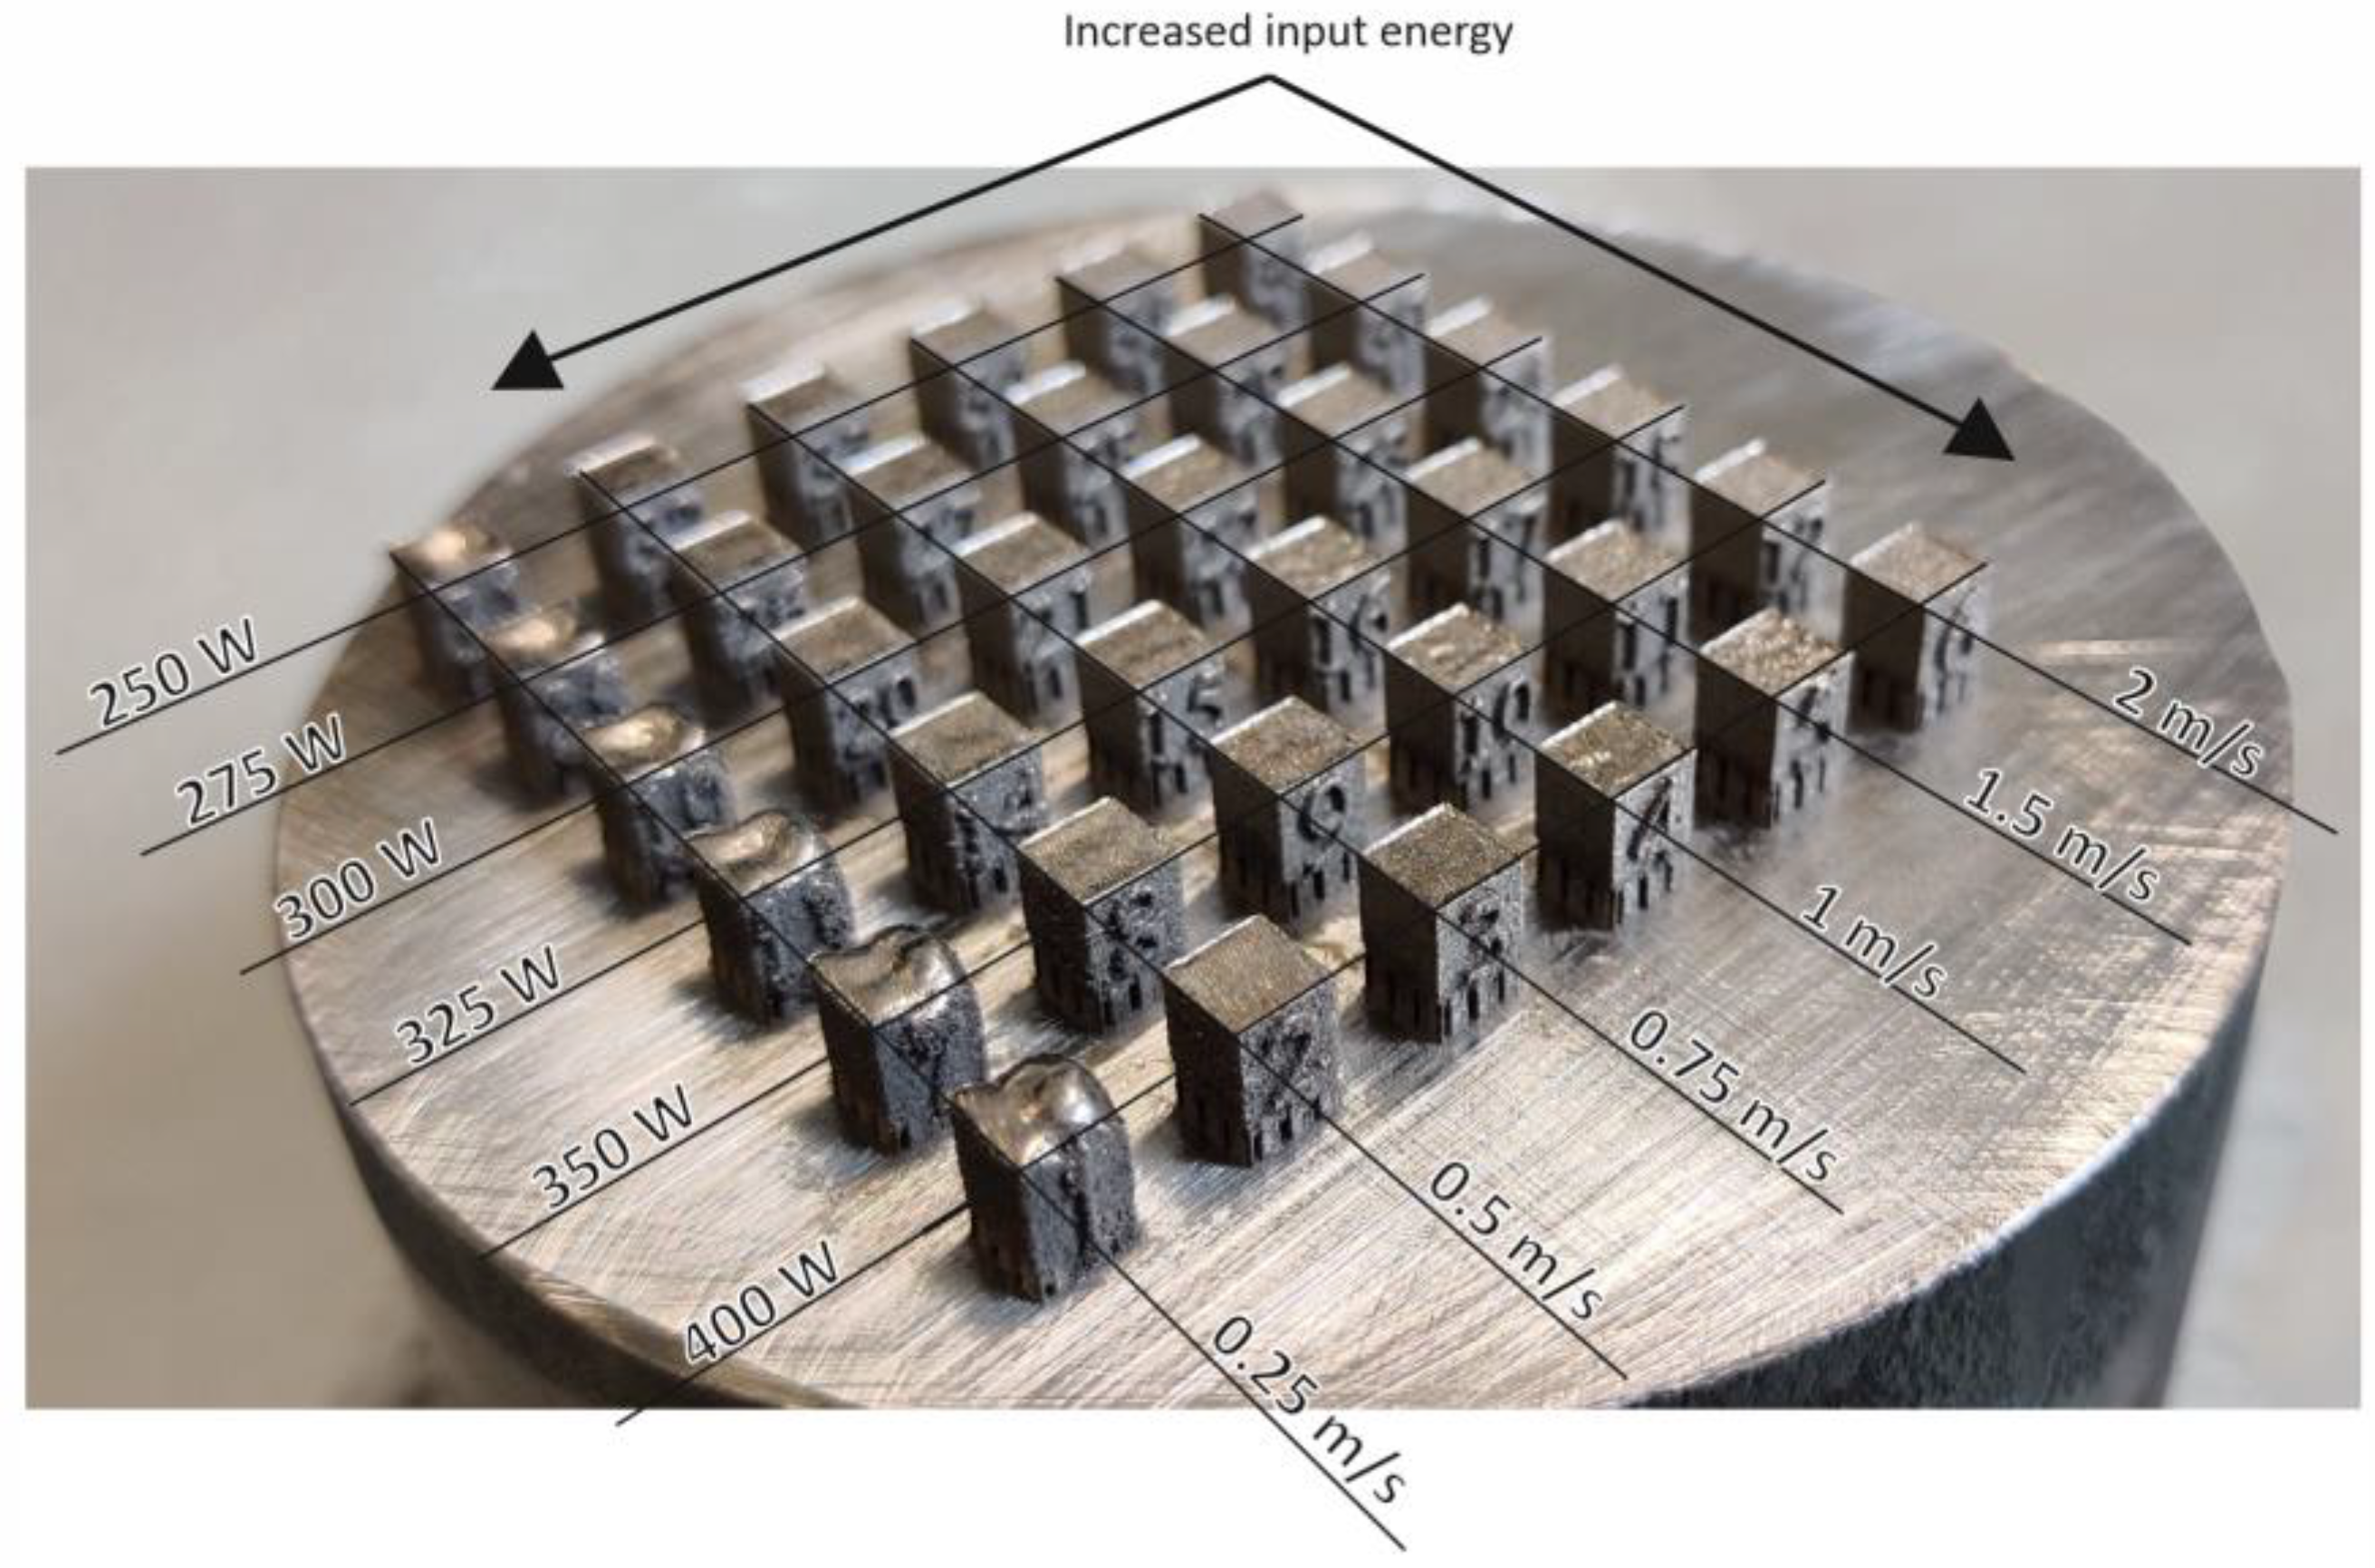
  • The optimal energy density for the melting process was 78 J/mm3 (in the investigated range of 20–216 J/mm3), resulting in the fusion of samples with 99.86% relative density and surface roughness values of 41 μm (Rz) and 8 μm (Ra). The individual main scanning parameters employed were: laser power—350 W; scanning speed—0.75 m/s; hatch spacing—120 μm; layer thickness—50 μm; environment—nitrogen.
  • The optimal heat treatment temperature in the range of 1200–1350 °C was 1200°, resulting in the highest relative permeability of the material and lowest quasi-static hysteresis losses.
  • DC measurements confirmed equivalent magnetic properties of the printed samples to conventional steels: hysteresis losses of 0.8 W/kg (W10,50) and maximum relative permeability of 8400. Magnetization of 1.5 T was reached at 1480 A/m, and 1 T was reached at 90 A/m.
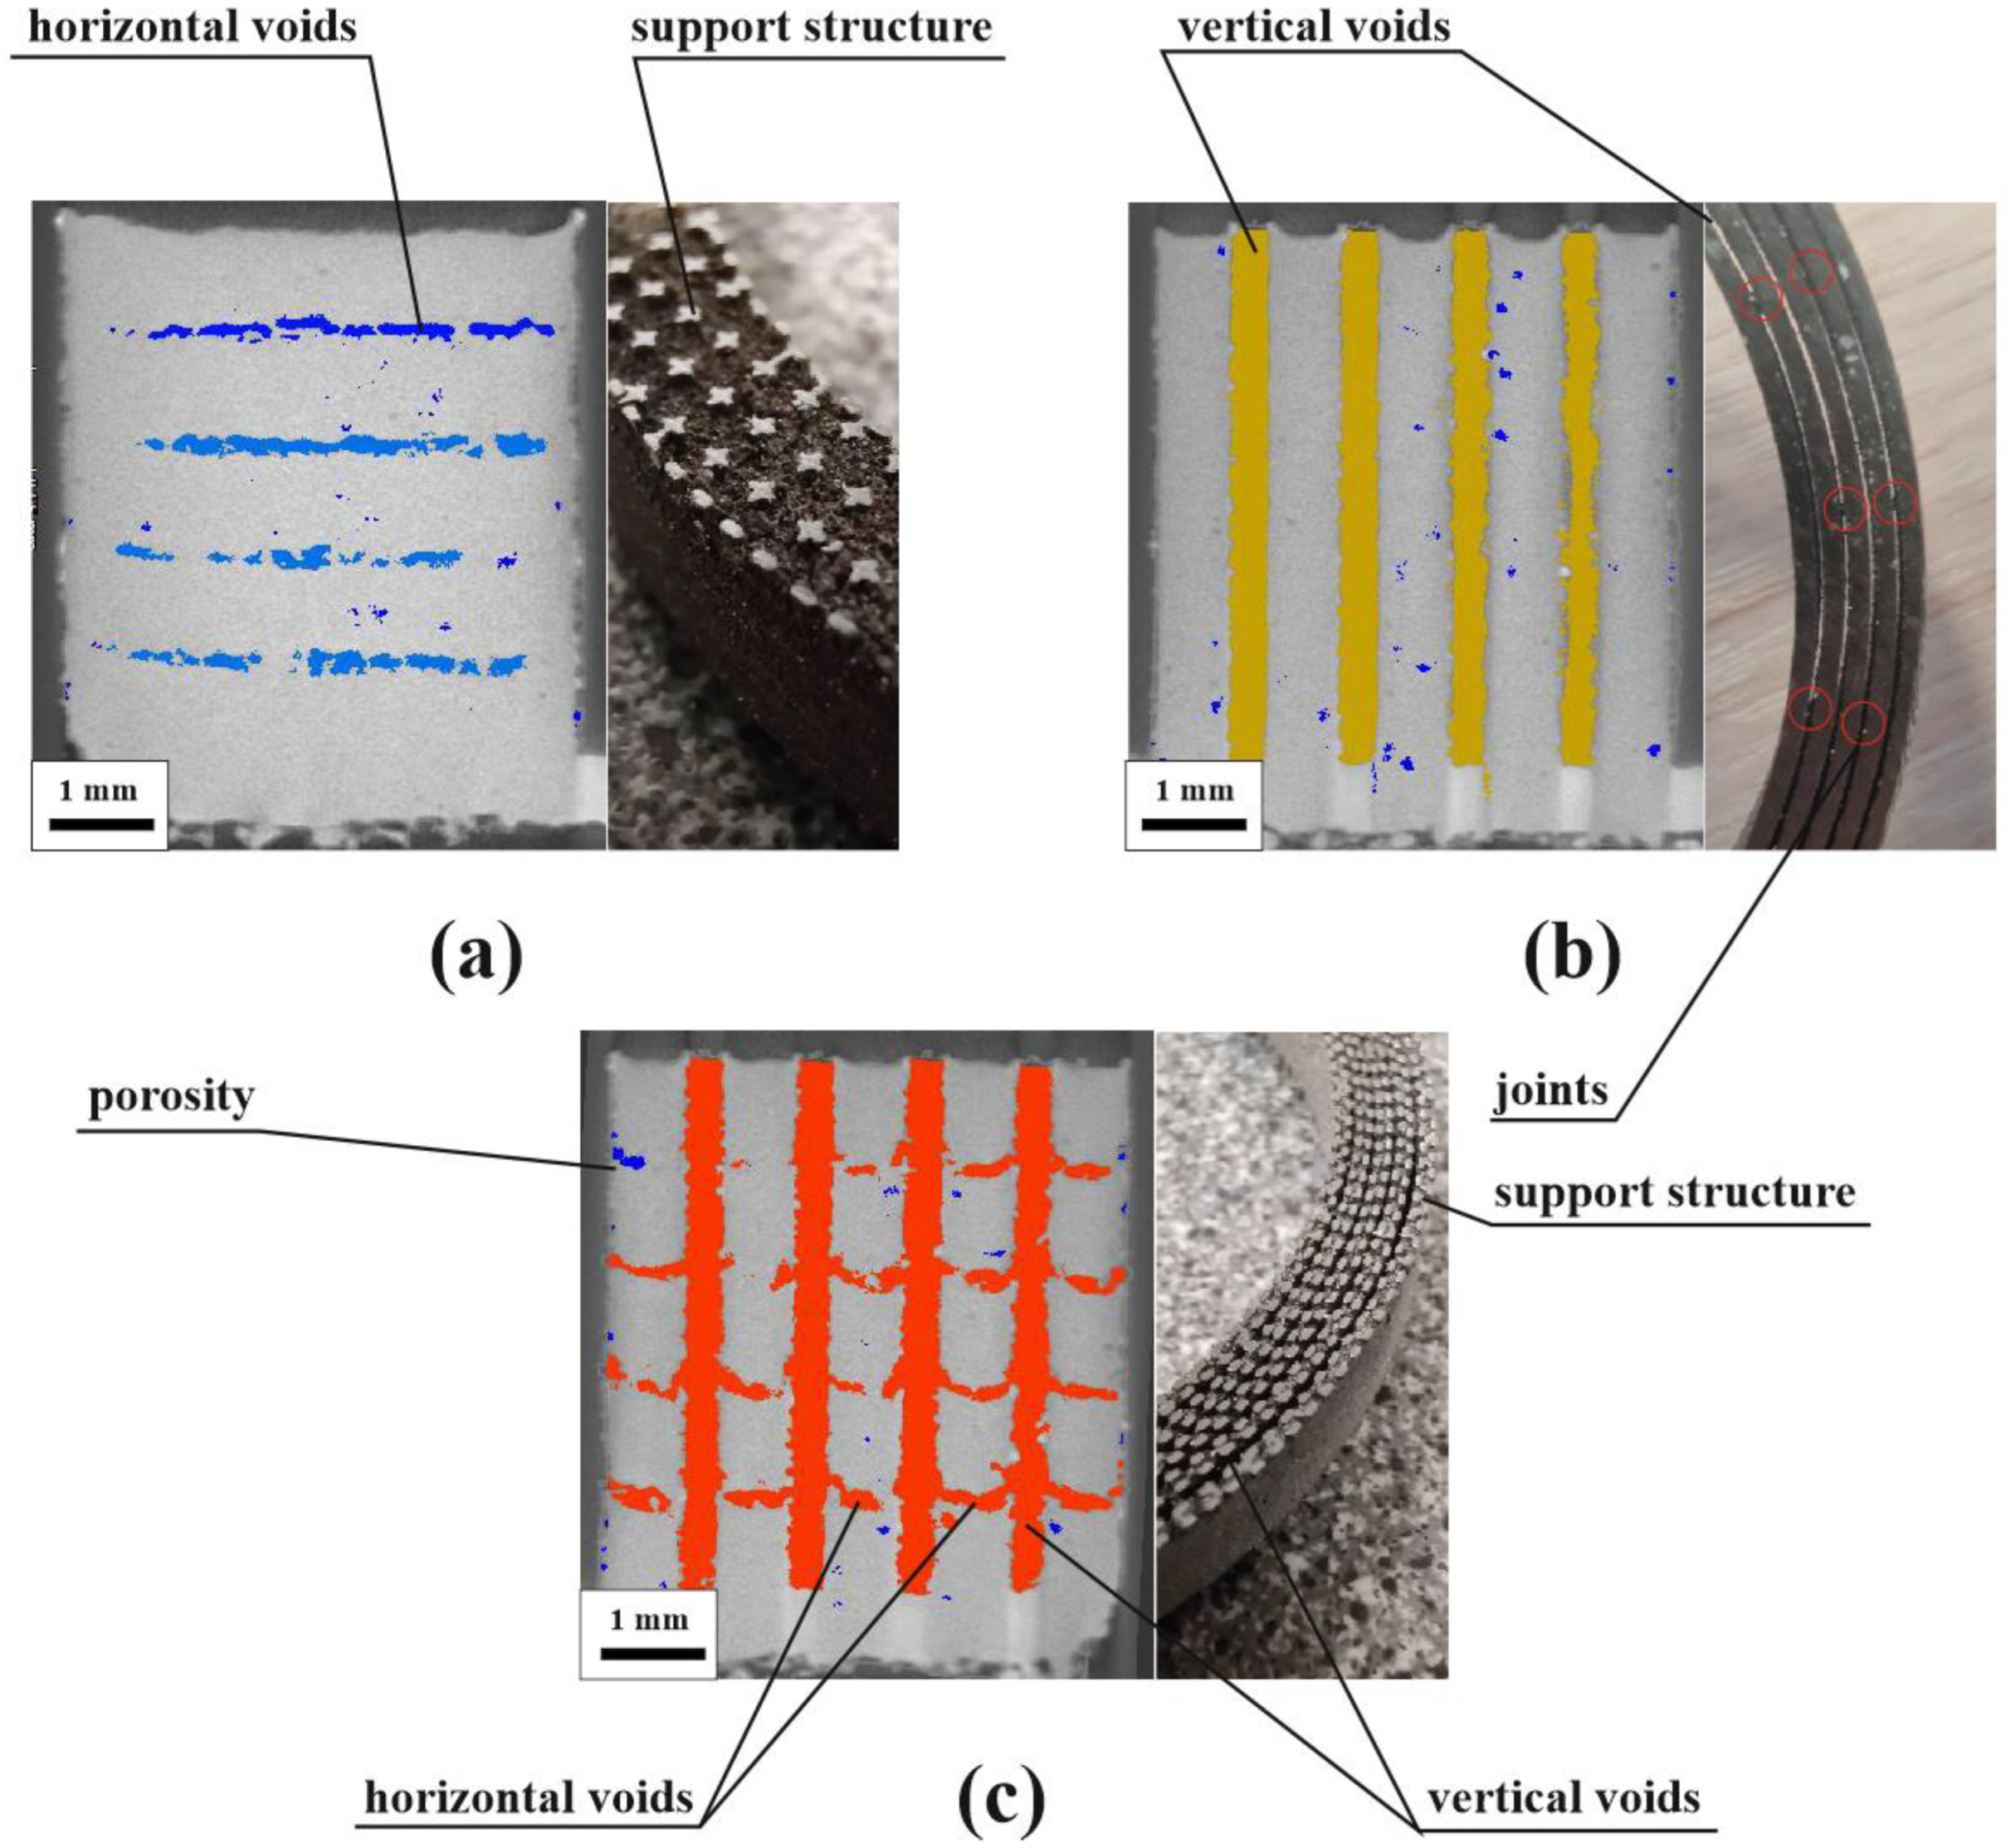
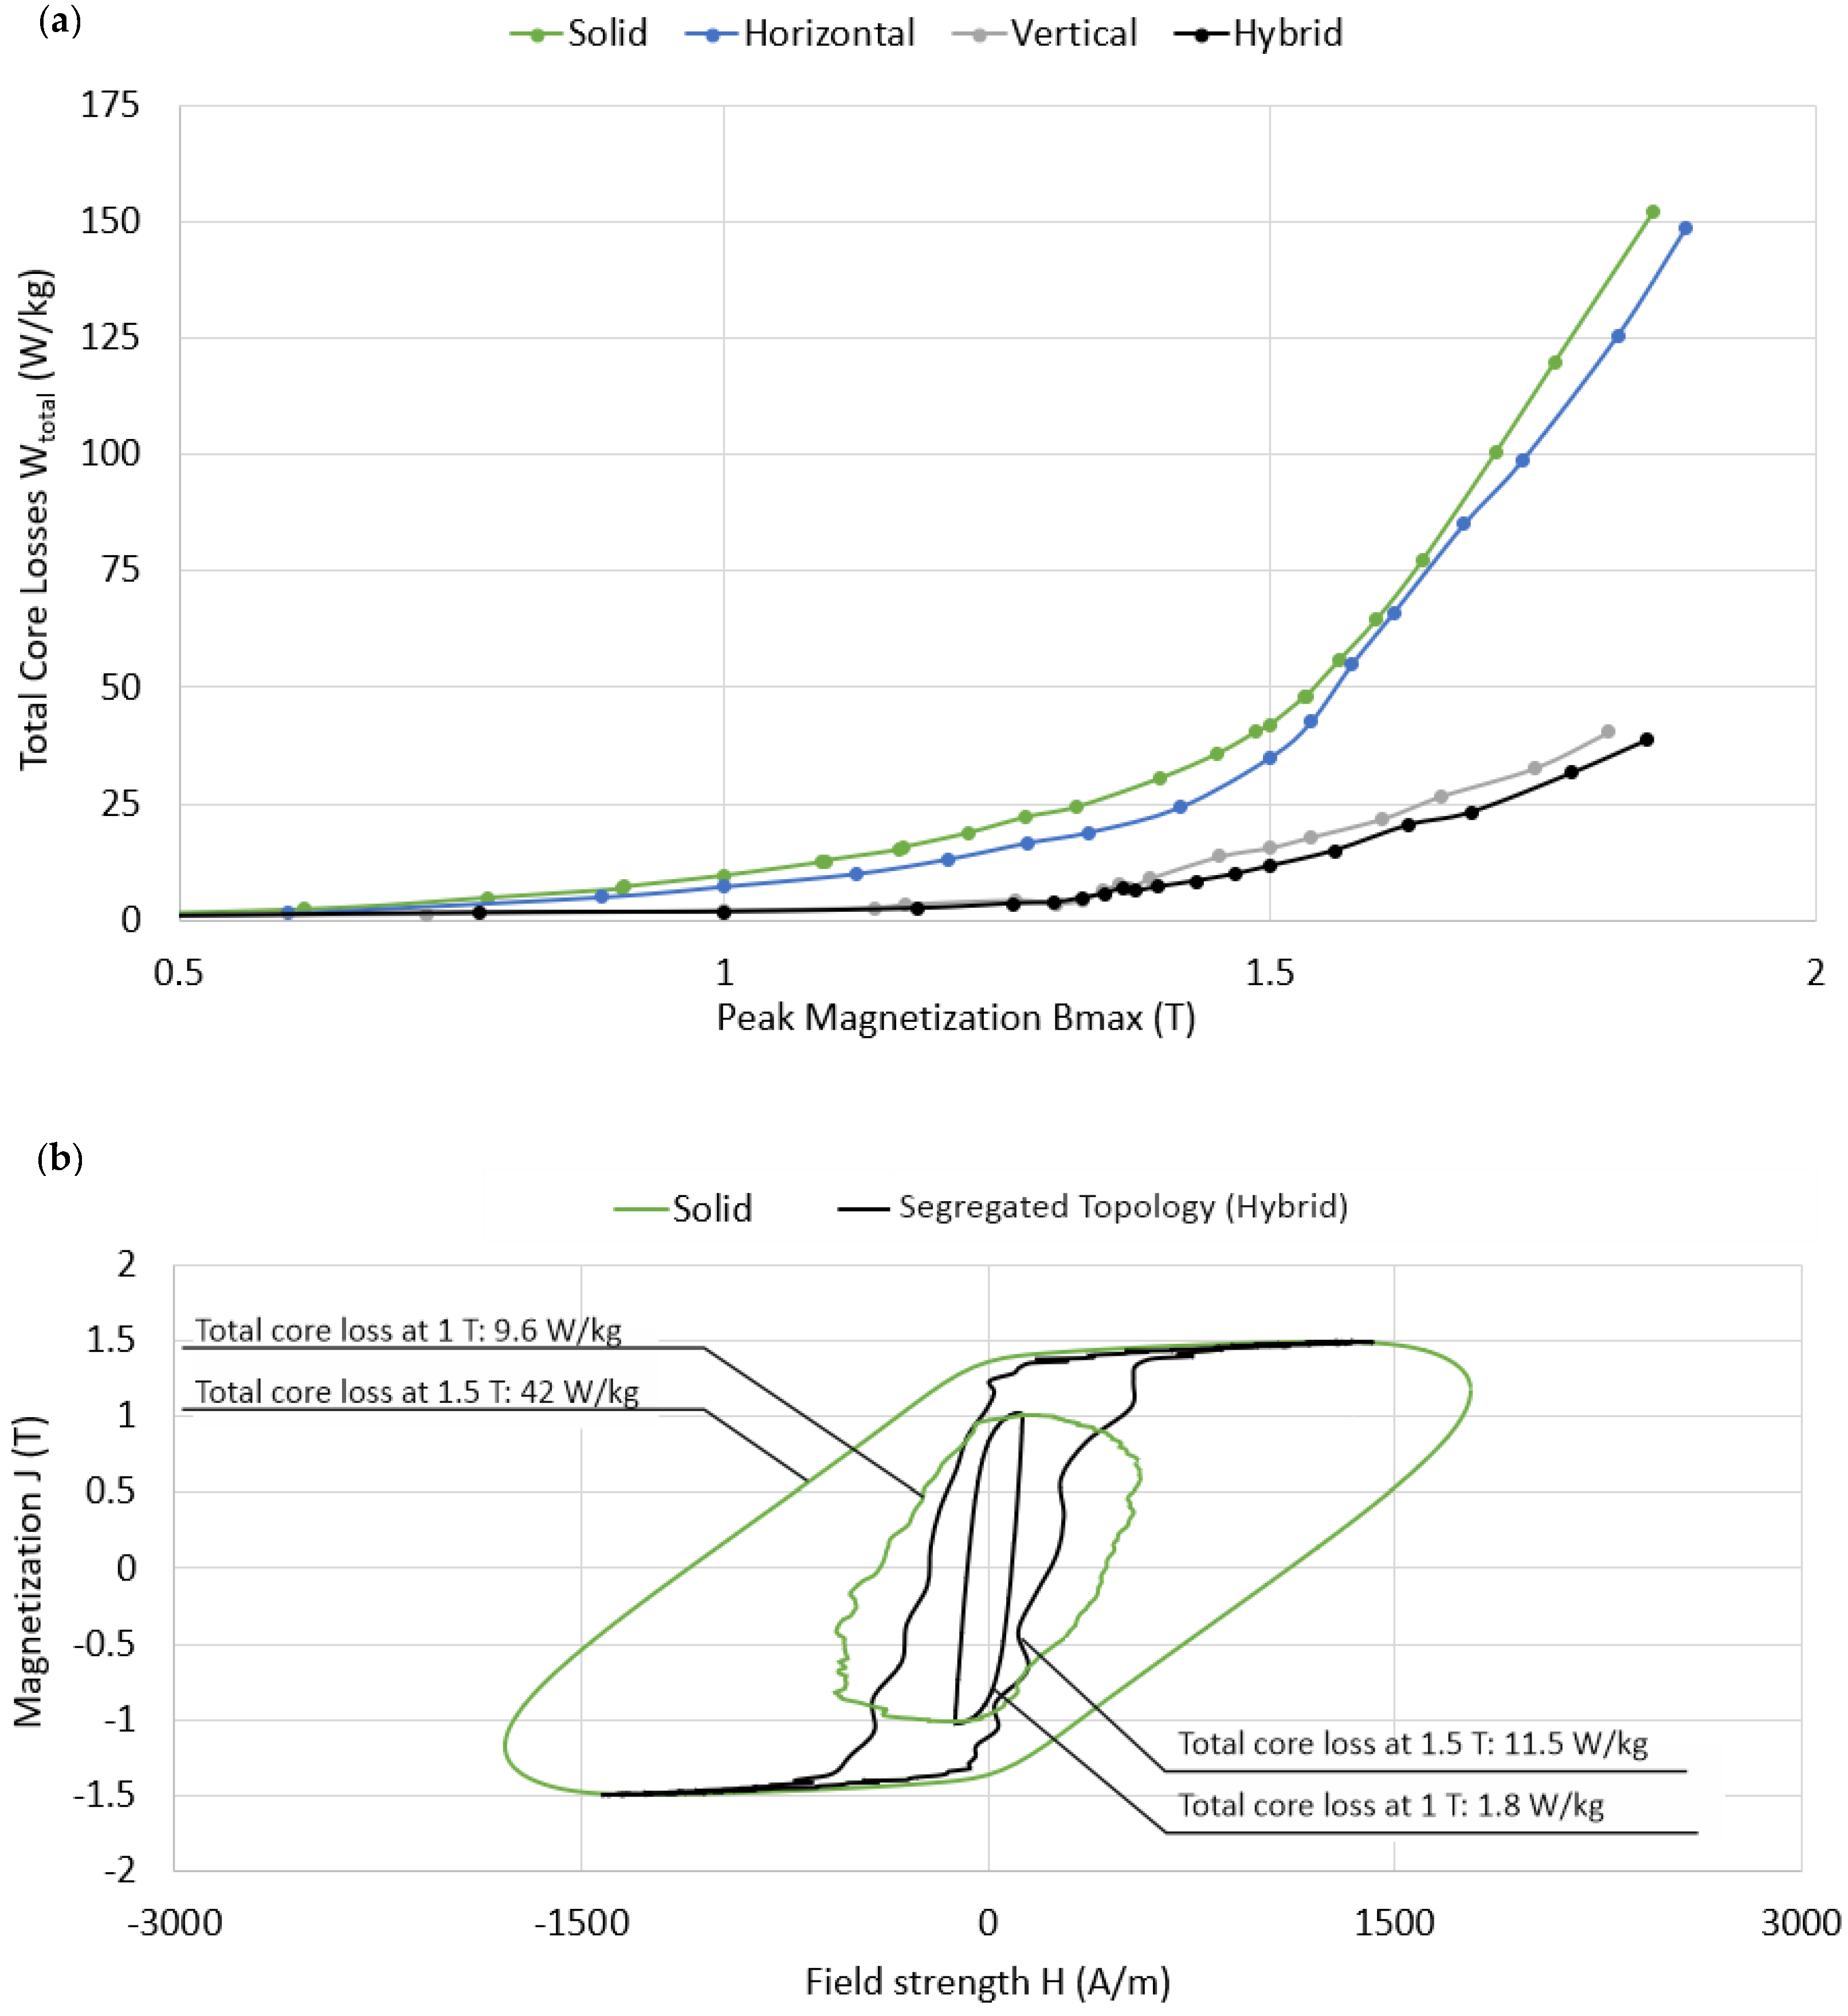
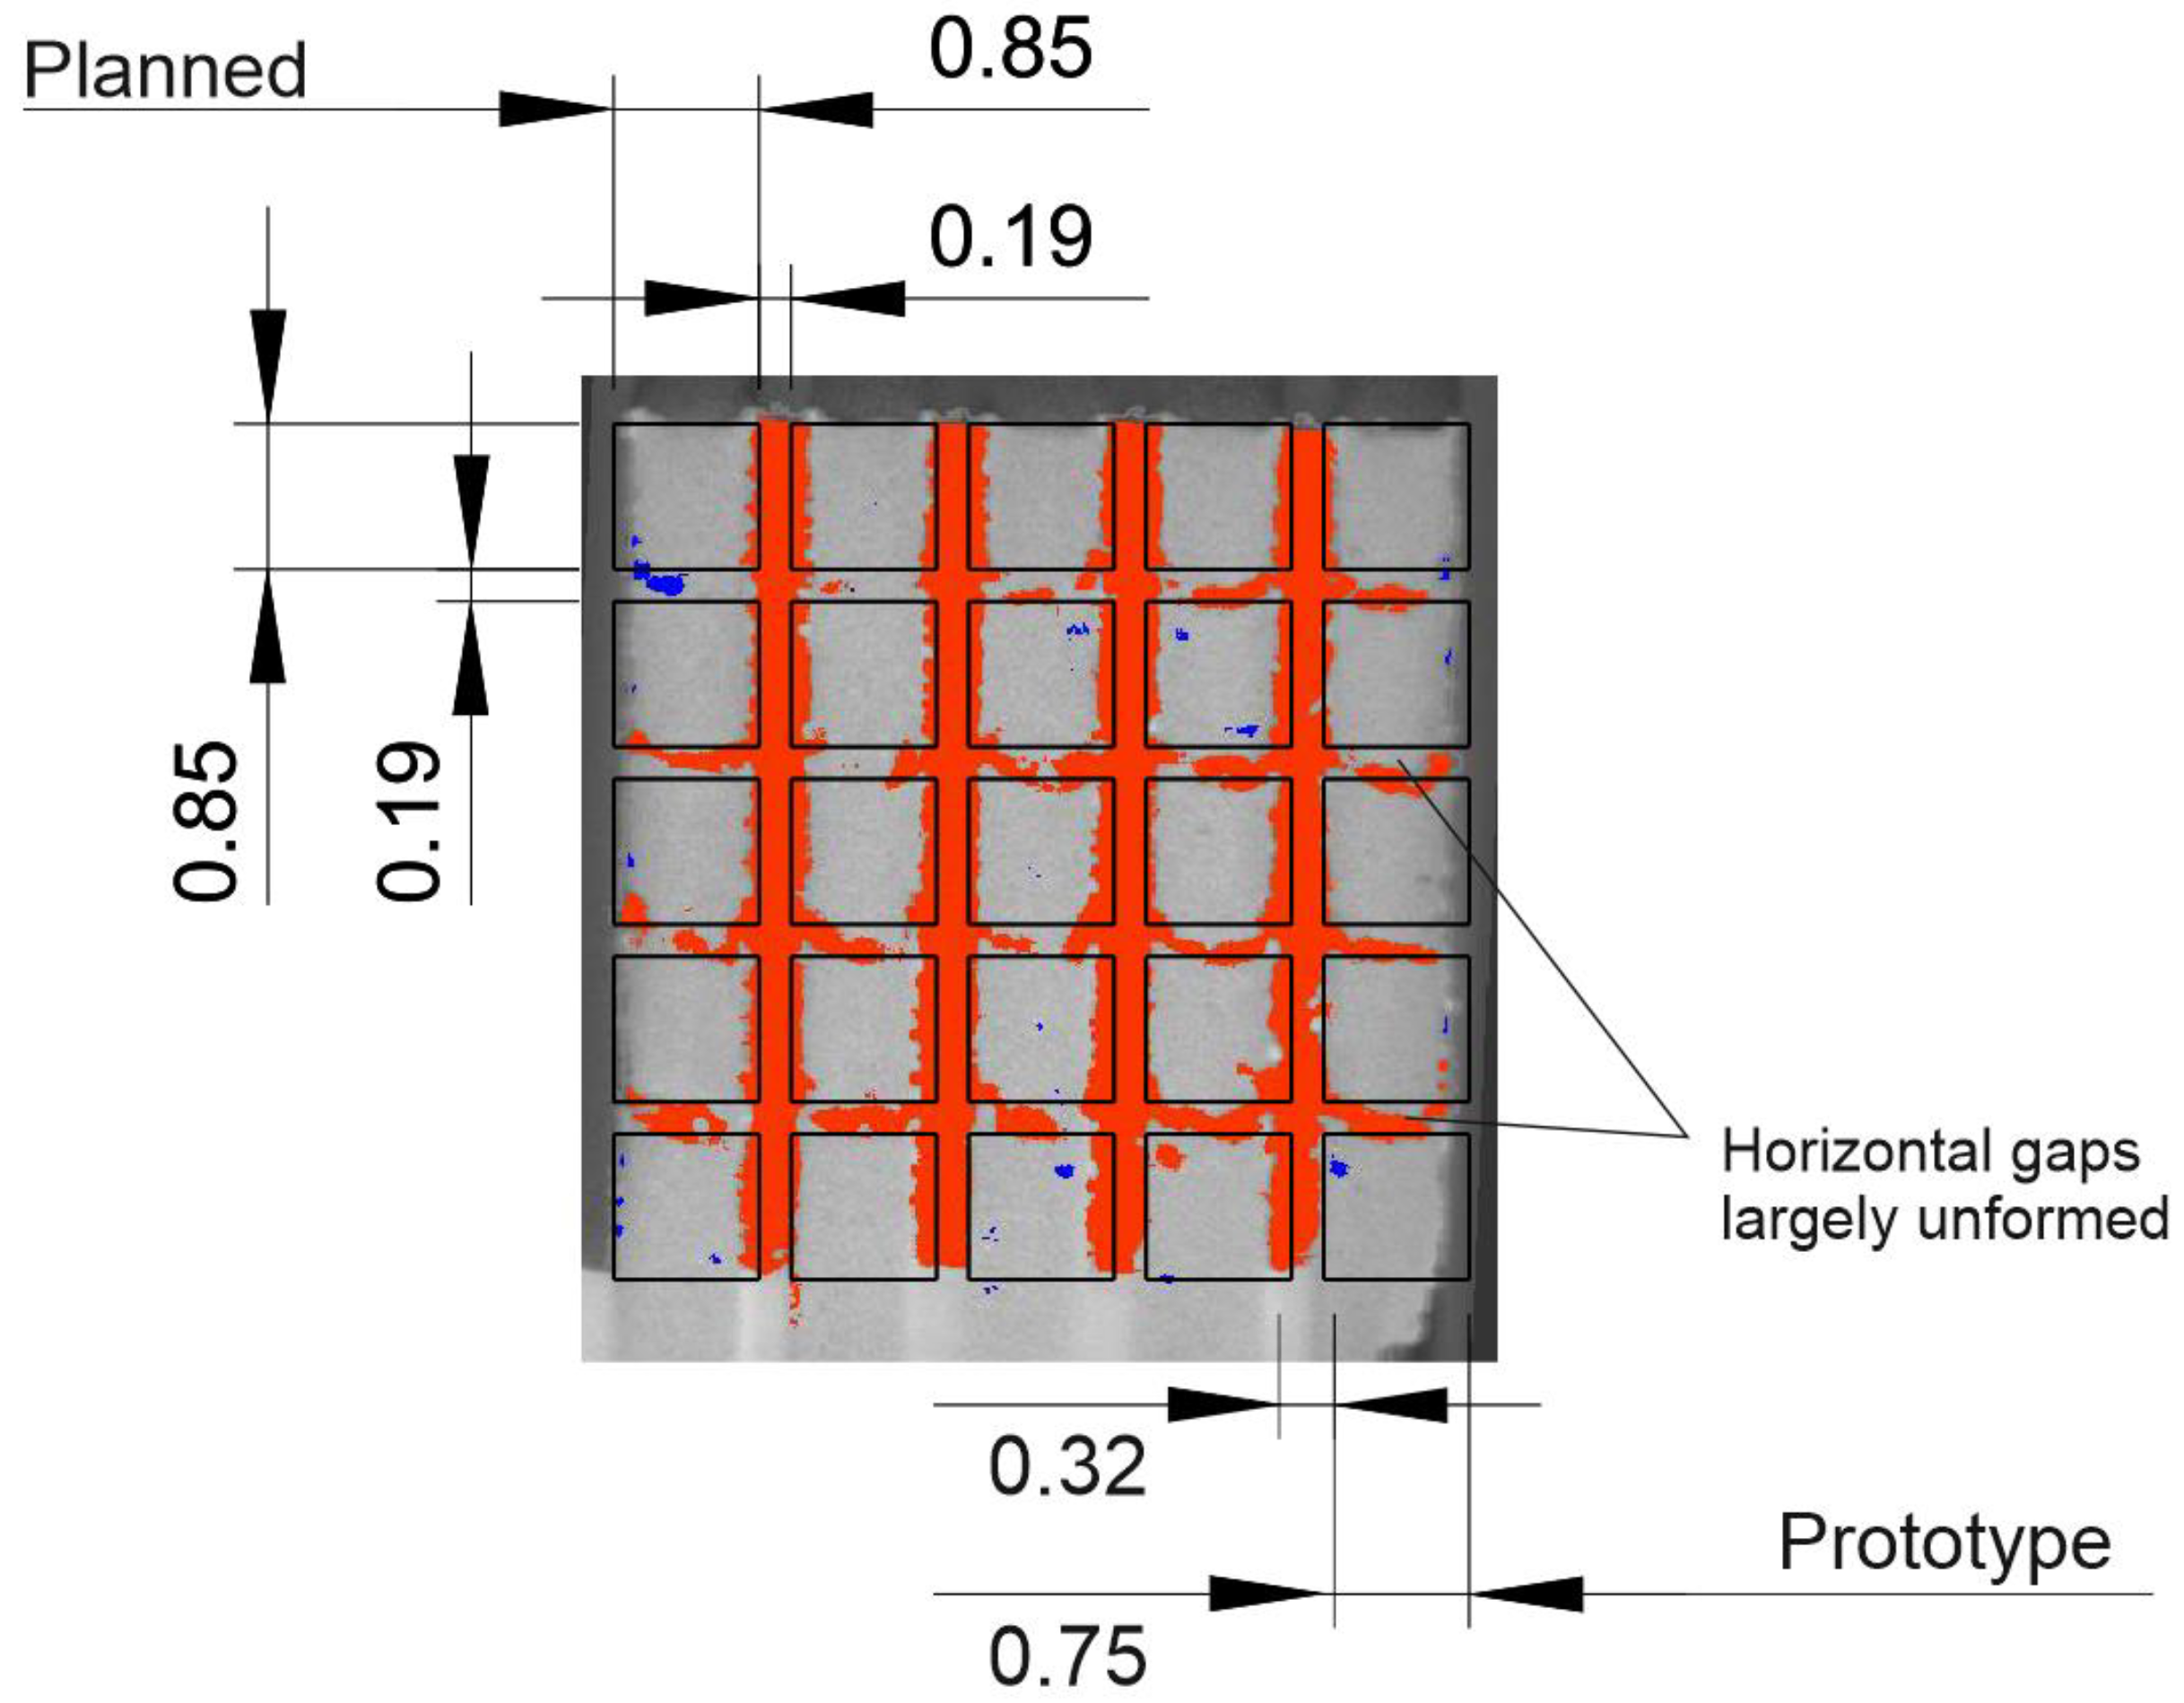
  • Shape enhanced printed cores were utilized successfully to limit the eddy current losses within the core to an acceptable level. With a bi-directionally segregated structure (with a fill factor of 72.98%), total iron losses as low as 1.8 W/kg (W10,50) were measured. These losses are vastly superior to SMC cores at 50 Hz (5–6 W/kg)—an industrial standard for constructing magnetic cores with unconventional topologies. At 1 T, the obtained total losses of the optimized core are close to the values for typical electrical steel. For M400-50A steel grade, the losses are required not to exceed 1.7 W/kg in the same conditions.
The findings of this paper suggest the applicability of L-PBF fused magnetic cores for the construction of electrical machines. In comparison with SMCs, AM cores are vastly superior for low-frequency applications, as they show superior material properties and a considerably larger geometrical freedom for core design. This would also suggest the usefulness of L-PBF in the preparation of novel transversal flux, multi-axial, and spherical or perhaps completely new machine designs—which can benefit from a wider range of topologies and more refined structures than SMC or lamination-constructed machines.

6. Future Work

Further work on the project will focus first on the extensive AM material microstructural characterization: e.g., granular size, orientation, and effect on material permeability and losses at high and low field strengths; and secondly, on further shape optimization of the segregated cores for enhanced eddy current loss.

Author Contributions

Conceptualization: A.K. and H.T.; methodology: H.T.; validation, A.K.; investigation, H.T., L.L., T.D. and I.V.; resources, A.K.; writing—original draft preparation, H.T.; writing—review and editing, H.T. and A.K.; supervision, A.K. and A.R.; project administration, T.V.; funding acquisition, A.K. All authors have read and agreed to the published version of the manuscript.

Funding

This research work was funded by the Estonian Ministry of Education (Grant PSG-137).

Institutional Review Board Statement

Not applicable.

Informed Consent Statement

Not applicable.

Data Availability Statement

Data is contained within the article.

Acknowledgments

XRD Measurements by the project TK141 (TAR16016EK): “Advanced materials and high-technology devices for energy recuperation systems”; SEM and EDX analyses were supported by the projects IUT-19-28: “New materials and technologies for solar energetics” and TK-141: “Advanced materials and high-technology devices for sustainable energetics, sensorics and nanoelectronics”.

Conflicts of Interest

The authors declare no conflict of interests.

References

  1. Aguilera, E.; Ramos, J.; Espalin, D.; Cedillos, F.; Muse, D.; Wicker, R.; MacDonald, E. 3D Printing of Electro Mechanical Systems. In International Solid Freeform Fabrication Symposium; University of Texas at Austin: Austin, TX, USA, 2013; pp. 950–961. [Google Scholar]
  2. Garibaldi, M.; Gerada, C.; Ashcroft, I.; Hague, R.; Morvan, H. The Impact of Additive Manufacturing on the Development of Electrical Machines for MEA Applications: A Feasibility Study. In MEA2015 More Electric Aircraft; University of Nottingham: Nottingham, UK, 2015; pp. 2–5. [Google Scholar]
  3. Garibaldi, M.; Gerada, C.; Hague, R. Laser Additive Manufacturing of Soft Magnetic Cores for Rotating Electrical Machinery: Materials Development and Part Design. Ph.D. Thesis, University of Nottingham, Nottingham, UK, 2018. [Google Scholar]
  4. Tiismus, H.; Kallaste, A.; Belahcen, A.; Rassolkin, A.; Vaimann, T. Challenges of Additive Manufacturing of Electrical Machines. In Proceedings of the 2019 IEEE 12th International Symposium on Diagnostics for Electrical Machines, Power Electronics and Drives (SDEMPED), Toulouse, France, 27–30 August 2019; Institute of Electrical and Electronics: Manhattan, NY, USA, 2019; pp. 44–48. [Google Scholar] [CrossRef]
  5. Wrobel, R.; Mecrow, B. A Comprehensive Review of Additive Manufacturing in Construction of Electrical Machines. In Proceedings of the IEEE Workshop on Electrical Machines Design, Control and Diagnosis (WEMDCD), Greece, Balkans, 22–23 April 2019; Institute of Electrical and Electronics: Manhattan, NY, USA, 2019; pp. 15–22. [Google Scholar] [CrossRef] [Green Version]
  6. Wrobel, R.; Mecrow, B.C. A Comprehensive Review of Additive Manufacturing in Construction of Electrical Machines. IEEE Trans. Energy Convers. 2020, 35, 1054–1064. [Google Scholar] [CrossRef] [Green Version]
  7. Naseer, M.; Kallaste, A.; Asad, B.; Vaimann, T.; Rassõlkin, A. A Review on Additive Manufacturing Possibilities for Electrical Machines. Energies 2021, 14, 1940. [Google Scholar] [CrossRef]
  8. Ghahfarokhi, P.S.; Podgornovs, A.; Kallaste, A.; Cardoso, A.J.M.; Belahcen, A.; Vaimann, T.; Tiismus, H.; Asad, B. Opportunities and Challenges of Utilizing Additive Manufacturing Approaches in Thermal Management of Electrical Machines. IEEE Access 2021, 9, 36368–36381. [Google Scholar] [CrossRef]
  9. Selema, A.; Ibrahim, M.N.; Sergeant, P. Metal Additive Manufacturing for Electrical Machines: Technology Review and Latest Advancements. Energies 2022, 15, 1076. [Google Scholar] [CrossRef]
  10. Pham, T.; Kwon, P.; Foster, S. Additive Manufacturing and Topology Optimization of Magnetic Materials for Electrical Machines—A Review. Energies 2021, 14, 283. [Google Scholar] [CrossRef]
  11. Chaudhary, V.; Mantri, S.A.; Ramanujan, R.V.; Banerjee, R. Additive manufacturing of magnetic materials. Prog. Mater. Sci. 2020, 114, 100688. [Google Scholar] [CrossRef]
  12. Tiismus, H.; Kallaste, A.; Vaimann, T.; Rassõlkin, A. State of the art of additively manufactured electromagnetic materials for topology optimized electrical machines. Addit. Manuf. 2022, 55, 102778. [Google Scholar] [CrossRef]
  13. Igarashi, H.; Okazaki, K. Effects of Porosity and Grain Size on the Magnetic Properties of NiZn Ferrite. J. Am. Ceram. Soc. 1977, 60, 51–54. [Google Scholar] [CrossRef]
  14. Goldman, A. Handbook of Modern Ferromagnetic Materials; Springer: Berlin/Heidelberg, Germany, 1999. [Google Scholar]
  15. Li, L. Stress Effects on Ferromagnetic Materials: Investigation of Stainless Steel and Nickel. Retrosp. Theses Diss. 2004. [Google Scholar] [CrossRef]
  16. Krings, A.; Cossale, M.; Tenconi, A.; Soulard, J.; Cavagnino, A.; Boglietti, A. Magnetic Materials Used in Electrical Machines: A Comparison and Selection Guide for Early Machine Design. IEEE Ind. Appl. Mag. 2017, 23, 21–28. [Google Scholar] [CrossRef] [Green Version]
  17. Ouyang, G.; Chen, X.; Liang, Y.; Macziewski, C.; Cui, J. Review of Fe-6.5 wt%Si high silicon steel—A promising soft magnetic material for sub-kHz application. J. Magn. Magn. Mater. 2019, 481, 234–250. [Google Scholar] [CrossRef]
  18. Galsin, J.S. Physical Effects of Impurities in Metals. In Impurity Scattering in Metallic Alloys; Springer: Berlin/Heidelberg, Germany, 2002; pp. 93–123. [Google Scholar] [CrossRef]
  19. Belahcen, A.; Rasilo, P.; Arkkio, A. Segregation of Iron Losses from Rotational Field Measurements and Application to Electrical Machine. IEEE Trans. Magn. 2014, 50, 893–896. [Google Scholar] [CrossRef] [Green Version]
  20. Hawezy, D. The influence of silicon content on physical properties of non-oriented silicon steel. Mater. Sci. Technol. 2017, 33, 1560–1569. [Google Scholar] [CrossRef]
  21. Wilson-Heid, A.E.; Novak, T.C.; Beese, A.M. Characterization of the Effects of Internal Pores on Tensile Properties of Additively Manufactured Austenitic Stainless Steel 316L. Exp. Mech. 2018, 59, 793–804. [Google Scholar] [CrossRef]
  22. Sames, W.J.; List, F.A.; Pannala, S.; Dehoff, R.R.; Babu, S.S. The metallurgy and processing science of metal additive manufacturing full critical review. Int. Mater. Rev. 2016, 61, 315–360. [Google Scholar] [CrossRef]
  23. Hansen, N. Hall–Petch relation and boundary strengthening. Scr. Mater. 2004, 51, 801–806. [Google Scholar] [CrossRef]
  24. Raabe, D. Recovery and Recrystallization: Phenomena, Physics, Models, Simulation. Phys. Metall. 2014, 2014, 2291–2397. [Google Scholar] [CrossRef]
  25. Alatawneh, N.; Saleem, A.; Rahman, T.; Lowther, D.A.; Chromik, R. Modelling and analysis of the effects of cutting of core laminations in electric machines. IET Electr. Power Appl. 2020, 14, 2355–2361. [Google Scholar] [CrossRef]
  26. Ding, Y.; Gallaugher, M.; Brodusch, N.; Gauvin, R.; Chromik, R.R. Coating induced residual stress in nonoriented electrical steel laminations. J. Mater. Res. 2014, 29, 1737–1746. [Google Scholar] [CrossRef]
  27. Cordova, L.; Bor, T.; de Smit, M.; Campos, M.; Tinga, T. Measuring the spreadability of pre-treated and moisturized powders for laser powder bed fusion. Addit. Manuf. 2020, 32, 101082. [Google Scholar] [CrossRef]
  28. Mussatto, A.; Groarke, R.; O’Neill, A.; Obeidi, M.A.; Delaure, Y.; Brabazon, D. Influences of powder morphology and spreading parameters on the powder bed topography uniformity in powder bed fusion metal additive manufacturing. Addit. Manuf. 2021, 38, 101807. [Google Scholar] [CrossRef]
  29. Kotadia, H.; Gibbons, G.; Das, A.; Howes, P. A review of Laser Powder Bed Fusion Additive Manufacturing of aluminium alloys: Microstructure and properties. Addit. Manuf. 2021, 46, 102155. [Google Scholar] [CrossRef]
  30. Wang, D.; Wu, S.; Fu, F.; Mai, S.; Yang, Y.; Liu, Y.; Song, C. Mechanisms and characteristics of spatter generation in SLM processing and its effect on the properties. Mater. Des. 2017, 117, 121–130. [Google Scholar] [CrossRef]
  31. Aboulkhair, N.T.; Everitt, N.; Ashcroft, I.; Tuck, C. Reducing porosity in AlSi10Mg parts processed by selective laser melting. Addit. Manuf. 2014, 1–4, 77–86. [Google Scholar] [CrossRef]
  32. European Standard EN 60404-6; Magnetic Materials—Part 6: Methods of Measurement of the Magnetic Properties of Magnetically Soft Metallic and Powder Materials at Frequencies in the Range 20 Hz to 100 kHz by the Use of Ring Specimens. European Comitee for Electrotechnical Standardization: Brussels, Belgium, 2004.
  33. European Standard EN 60404-4; Magnetic Materials—Part 4: Methods of Measurement of d.c. Magnetic Properties of Iron and Steel. European Comitee for Electrotechnical Standardization: Brussels, Belgium, 2002.
  34. American Society for Testing and Materials. Standard Test Methods for Tension Testing of Metallic Materials; ASTM International: West Conshohocken, PA, USA, 2010; Volume I, pp. 1–27. [Google Scholar] [CrossRef]
  35. DC Magnetization Curves of Soft Magnetic Materials: Finite Element Method Magnetics. Available online: https://www.femm.info/wiki/SoftMagneticMaterials (accessed on 28 March 2022).
  36. Hoganas. Material Data_Somaloy. Available online: www.hoganas.com/electromagnetic (accessed on 9 June 2020).
  37. Tiismus, H.; Kallaste, A.; Belahcen, A.; Vaimann, T.; Rassõlkin, A.; Lukichev, D. Hysteresis Measurements and Numerical Losses Segregation of Additively Manufactured Silicon Steel for 3D Printing Electrical Machines. Appl. Sci. 2020, 10, 6515. [Google Scholar] [CrossRef]
  38. Sonboli, A.; Toroghinejad, M.R.; Edris, H.; Szpunar, J.A. Effect of deformation route and intermediate annealing on magnetic anisotropy and magnetic properties of a 1 wt% Si non-oriented electrical steel. J. Magn. Magn. Mater. 2015, 385, 331–338. [Google Scholar] [CrossRef]
  39. Garibaldi, M.; Ashcroft, I.; Simonelli, M.; Hague, R. Metallurgy of high-silicon steel parts produced using Selective Laser Melting. Acta Mater. 2016, 110, 207–216. [Google Scholar] [CrossRef]
  40. Da Cunha, M.A.; Paolinelli, S.C. Effect of the Annealing Temperature on the Structure and Magnetic Properties of 2% Si Steel. Mater. Res. 2002, 5, 373–378. [Google Scholar] [CrossRef]
  41. Plotkowski, A.; Pries, J.; List, F.; Nandwana, P.; Stump, B.; Carver, K.; Dehoff, R. Influence of scan pattern and geometry on the microstructure and soft-magnetic performance of additively manufactured Fe-Si. Addit. Manuf. 2019, 29, 100781. [Google Scholar] [CrossRef]
  42. Stornelli, G.; Faba, A.; Di Schino, A.; Folgarait, P.; Ridolfi, M.; Cardelli, E.; Montanari, R. Properties of Additively Manufactured Electric Steel Powder Cores with Increased Si Content. Materials 2021, 14, 1489. [Google Scholar] [CrossRef]
  43. Koo, B.; Jang, M.-S.; Nam, Y.G.; Yang, S.; Yu, J.; Park, Y.H.; Jeong, J.W. Structurally-layered soft magnetic Fe-Si components with surface insulation prepared by shell-shaping selective laser melting. Appl. Surf. Sci. 2021, 553, 149510. [Google Scholar] [CrossRef]
  44. Goll, D.; Schuller, D.; Martinek, G.; Kunert, T.; Schurr, J.; Sinz, C.; Schubert, T.; Bernthaler, T.; Riegel, H.; Schneider, G. Additive manufacturing of soft magnetic materials and components. Addit. Manuf. 2019, 27, 428–439. [Google Scholar] [CrossRef]
  45. Super Core TM Electrical Steel Sheets for High-Frequency Application. Available online: https://www.jfe-steel.co.jp/en/products/electrical/catalog/f1e-002.pdf (accessed on 13 May 2021).
  46. Zhang, M.; Kong, F.; Wang, A.; Chang, C.; Shen, B. Soft magnetic properties of bulk FeCoMoPCBSi glassy core prepared by copper mold casting. J. Appl. Phys. 2012, 111, 07A312. [Google Scholar] [CrossRef]
  47. Shiozaki, M.; Kurosaki, Y. The effects of grain size on the magnetic properties of nonoriented electrical steel sheets. J. Mater. Eng. 1989, 11, 37–43. [Google Scholar] [CrossRef]
  48. Honma, K.; Nozawa, T.; Kobayashi, H.; Shimoyama, Y.; Tachino, I.; Miyoshi, K. Development of non-oriented and grain-oriented silicon steel. IEEE Trans. Magn. 1985, 21, 1903–1908. [Google Scholar] [CrossRef]
  49. EVS-EN 10106:2015—Cold Rolled Non-Oriented Electrical Steel Strip and Sheet Delivered in the fully Processed State. Available online: https://www.evs.ee/et/evs-en-10106-2015 (accessed on 25 April 2022).
  50. Data Sheet of Isovac 400-50A. Available online: https://www.voestalpine.com/stahl/content/download/4542/file/DB_isovac_400-50A_E_280715.pdf?inLanguage=eng-GB (accessed on 14 March 2021).
  51. Data Sheet of Isovac 1000-65A. Available online: https://www.voestalpine.com/stahl/content/download/4554/file/DB_isovac_1000-65A_E_280715.pdf?inLanguage=eng-GB (accessed on 14 March 2021).
  52. Non Grain Oriented Electrical Steel, Powdercore. Available online: https://www.thyssenkrupp-steel.com/media/content_1/publikationen/lieferprogramme/thyssenkrupp_product-range_no-electrical-steel_powercore_steel_en.pdf (accessed on 16 March 2021).
  53. Bozorth, R.M. Ferromagnetism; Wiley-IEEE Press: Hoboken, NJ, USA, 1993. [Google Scholar]
Figure 1. Effect of physical characteristics on soft magnetic material properties: (a) Maximum magnetic saturation (at µr = 1) is independent of grain size and proportional to the density of soft magnetic phase in material [13]. With lower sheet thickness and higher silicon content more nonmagnetic material is introduced to the core (varnish and silicon). (b) Imperfections within the crystallographic structure (including lattice dislocations, grain deformation (internal stress), foreign substituting and interstitial atoms, grain boundaries, pores, cracks) act as pinning sites for the magnetic domains [14,15]—requiring more energy for orientation. Thinner lamination layers generally result in higher hysteresis losses due to restricted grain size [16]. (c) High silicon steel content (optimal 6.5%) reduces material magnetostriction (increased permeability) [17], requireing less energy for domain orientation within a magnetic field. (d) Chemical impurities and macroscopic material defects (cracks, pores, delaminations) reduce the overall electron mobility in the metals—reducing both the thermal and electrical conductivity, and by association Joule heating losses [18]. (e) Internal electrical resistance of electrical steel components is best increased through laminated structure—effectively suppressing induced eddy current losses [16]. (f) Anomalous losses account for the microscopic eddy currents arising from the domain wall motion—with smaller grains; reduced microscopic eddy currents are generated [19]. (g) With silicon content above 3%, the brittleness of steels is increased substantially [20]. Ultimate yield strength of steel has been shown to be relatively insensitive to significant porosity content [21], but highly sensitive to any cracking/delamination [22]. (h) Material yield strength has been shown to be inversely proportional to the square root of its grain diameter [23]. The residual stresses from production processes or cold working (plastic deformation) increase a materials mechanical strength through dislocation accumulation [24].
Energies 15 03665 g001
Figure 2. Main considerations before, during, and after printing for improving L-PBF Fe-Si core characteristics.
Energies 15 03665 g002
Figure 3. Five step flowchart for L-PBF Fe-Si magnetic core properties optimization process.
Energies 15 03665 g003
Figure 4. 3.7% silicon content steel powder morphology: (a) SEM micrograph of the powder shape; (b) powder particle size analysis.
Energies 15 03665 g004
Figure 5. (a) SLM Solutions SLM 280 printing system in Taltech, (b) printer build chamber with custom re-coater, powder reservoir and reduced platform, and (c) cross-section of the custom re-coater system.
Energies 15 03665 g005
Figure 6. (a) Printed soft magnetic core in the annealing furnace; (b) full annealing setup of Webb-107 vacuum furnace.
Energies 15 03665 g006
Figure 7. Printed sample cubes on the substrate and the parametric plan of the individual cubes for density optimization.
Energies 15 03665 g007
Figure 8. Cubic characterization: (a) volume of each sample accounted for in metal tomography; (b) sample diagonals accounted for surface roughness evaluation.
Energies 15 03665 g008
Figure 9. Investigated core topologies: (a) solid, (b) horizontal air gaps, (c) vertical air gaps, and (d) both horizontal and vertical air gaps introduced into the material.
Energies 15 03665 g009
Figure 10. Segregated core design: (a) joining of printed vertical laminations with thin bridges; (b) support structures including border and lattice structures for printed horizontal laminations.
Energies 15 03665 g010
Figure 11. Setup of the magnetic measurements: (a) schematic; (b) wound toroidal core.
Energies 15 03665 g011
Figure 12. Normal magnetization curve constructed from the individual hysteresis curves measured at different field strengths and the corresponding relative permeability.
Energies 15 03665 g012
Figure 13. Parameter optimization results: (a) relationship between scanning parameters and relative density of the L-PBF specimens, (b) sample relative density and surface roughness as function of laser input energy density, (c) sample nr 23–300 W, 1.5 m/s, (d) sample nr 22–300 W, 1 m/s, (e) sample nr 20–300 W, 0.5 m/s, and (f) samples deformed from excessive laser input at 250–400 W, 0.25 m/s.
Energies 15 03665 g013aEnergies 15 03665 g013b
Figure 14. Distinctive surface roughness samples: (a) highest energy input (Rz = 62 μm, Ra = 12 μm), (b) maximum surface roughness (Rz = 85 μm, Ra = 18 μm), (c) optimal energy density (Rz = 41 μm, Ra = 8 μm), and (d) lowest energy input (Rz = 37 μm, Ra = 7 μm).
Energies 15 03665 g014
Figure 15. DC (25 mHz) magnetic material properties of the printed cores with varying thermal treatments: (a) magnetization curves; (b) hysteresis loops at 1.5 T.
Energies 15 03665 g015
Figure 16. Hysteresis losses (quasi-static) of the solid specimens with varying thermal treatments in the magnetization range ~0.5–1.8 T.
Energies 15 03665 g016
Figure 17. Comparison of the magnetization and permeability curves of commercial M-43 (equivalent to M400-50A) non-oriented silicon steel [35], Somaloy soft magnetic composite [36], and the characterized printed material annealed at 1200 °C.
Energies 15 03665 g017
Figure 18. Eddy current loss-related curve shearing: measured loops at 1.5 T magnetization (~1500 A/m field strength), at 0.025, 1, and 50 Hz excitation.
Energies 15 03665 g018
Figure 19. Total core losses of the printed solid toroidal specimens with varying thermal treatments in magnetization range of ~0.5–1.9 T at 50 Hz (a) and 1 Hz (b).
Energies 15 03665 g019
Figure 20. Topology of the segregated AM cores (metal tomography images + photographs): (a) horizontally graded, (b) vertically graded, and (c) horizontally and vertically graded (hybrid).
Energies 15 03665 g020
Figure 21. Total iron loss reduction with segregated printed core topology: (a) core losses with solid and investigated topologies over the magnetization range of 0.5–1.9 T; (b) comparison of the hysteresis loops of the solid and segregated topology results at 1 and 1.5 T magnetization.
Energies 15 03665 g021
Figure 22. XRD Analysis results of the printed, annealed material: (a) XRD spectra of the samples annealed at 1200–1350 °C; (b) measured lattice parameters at the same temperatures.
Energies 15 03665 g022
Figure 23. Tensile test results of the as-built and heat-treated material.
Energies 15 03665 g023
Figure 24. Shattered sample annealed at 1350 °C, exhibiting a large—up to ~2500 μm—grain structure on the fracture surface: (a) photograph, (b) SEM image.
Energies 15 03665 g024
Figure 25. Comparison of the planned 3D model topology with the resultant printed prototype.
Energies 15 03665 g025
Table 1. Summary of powder chemical composition.
ElementsFeSiMnCrNiC
Wt%Balance3.70.20.160.0200.01
Publisher’s Note: MDPI stays neutral with regard to jurisdictional claims in published maps and institutional affiliations.

