1. Introduction
In recent years, electrical power systems have grown into integrated systems considering design, administration, control, and operation. In these systems, consumers are connected to centralized power plants throughout several transmission and distribution networks. The current infrastructures of most power systems have been established based on longstanding technologies. Concerns about climate change and environmental concerns have also pushed numerous governments to establish new smart cities adopting innovative strategies to enhance the quality of life, illuminate environmental pollution, and thereby reduce carbon dioxide emissions [
1,
2]. Power systems have recently responded to these modern trends by implementing intelligent tools that rely on enhanced sensors and information and communication technologies (ICTs), besides advanced digital technology [
3,
4]. Power systems must adapt to changing generation profiles by developing intelligent tools that depend on modern sensors, ICTs, and digital control technologies [
5].
More recently, the development of smart grids has received much attention from both scientists and engineers. Digital smart meters, sensors, actuators, controllable charging, phasor measurement units, intelligent circuit interfaces, communication systems, cloud computing, local and wide-area controllers, home automation, and other innovative solutions are essential for smart grid establishment [
6]. Currently, the proliferation of smart grid technologies and their associated infrastructure necessitates new ideas and techniques for improving the performance and the efficiency of these systems, as well as rationalizing energy consumption [
7]. In this context, the demand response (DR) program is one of the most cost-effective and dependable smart energy system solutions [
8].
One of the key elements in a smart grid is the smart meter, which is an electronic system that measures electrical data such as voltage levels, current, power, power factor, and energy usage. Smart meters usually record energy in near real-time and report daily consumption at short intervals during the day. Those meters transmit data to consumers for providing a better understanding of their usage habits, as well as to energy providers for device control and customer billing [
9,
10]. Using time-of-use tariffs raises power bills during the summer by 42 to 57% as compared to the flat tariffs [
11,
12]. Households are expected to respond in a variety of ways by adjusting the temperature set-points of their thermostat to reduce air conditioning demand, or moving unurgent appliance operation to various times of the day away from peak periods.
The Internet of Things (IoT) is a fast-growing and a promising technology with a promoting potential to be widely integrated into the electrical industry [
13,
14]. By incorporating IoT components into power system nodes, the entire process of power generation, transmission, distribution, management, and consumption becomes more intelligent and highly efficient. This is accomplished by creating autonomous decisions and dependable processes based on the continuous and the precise real-time monitoring of power flow in the smart grid. Therefore, the performance of these smart nodes is significantly improved [
14].
In the architecture of smart grids, communication system infrastructure is critical. Control signals and collected sensor data are the two forms of information that must be transported over smart grids. Each form should be handled with a certain level of information security in addition to low latency and an acceptable quality of service (QoS) [
15].
Transmission distances, frequency of data transmission, and cost of transferring messages are all important factors to be considered when selecting a proper communication protocol in the smart grid [
16]. An IoT communication network is commonly made up of the application, security, transport, network, and connection layers. In this aspect, the IoT communication protocols are categorized into three groups at the connection layer: short-range protocols comprise Bluetooth and ZigBee; medium-range protocols contain Wi-Fi, 4G/LTE, and 5G; and long-range protocols include LoRa (Long Range) and Narrowband-IoT (NB-IoT) [
16,
17].
Short-, medium-, and long-term forecasting of electric load demand profiles and trends in addition to their anticipated prices are quite helpful for effective energy management. Owing to the existence of multiple distinct levels to be considered, the decision-making process in the electrical business is complicated. For example, it includes facility design and the efficient day-to-day operation processes of power plants. These judgments incorporate a wide range of time-spans and system features. Finding acceptable models is thus at the heart of the decision-making process [
18]. Load forecasting has become increasingly more important as energy markets have become more deregulated, determining how weather, equipment failure, legislation, and other related factors affect service costs [
19]. In a smart grid, microgrid, and smart building supervision, it is critical to establish accurate load demand forecasting of residential areas [
20]. This is critical for maintaining power system dependability, boosting the integration of distributed renewable energy resources, and establishing efficient demand response systems.
A distribution panelboard (DPB) is one of the key components of an electrical distribution system. It connects electrical power feeders to its follower branch circuits while providing each sub-circuit with all of the necessary protective circuit breakers (CBs) to mandate the safety of humans and equipment. The branching circuits are typically protected by DPB from overloads and short circuit faults. Owing to the great progress in ICTs and electronics engineering, the traditional electromechanical DPBs are expected to be greatly developed by integrating many electronic-based intelligent features and protections [
21]. With the help of current advances in embedded systems, artificial intelligence, cloud computing, and IoT technologies, next-generation low-cost DPBs are designed to effectively handle different electrical problems in real-time. Therefore, integrating smart features into DPBs to enhance electrical energy management through real-time controlling, monitoring, and predictive modeling is quite interesting.
In this paper, we present the design and the implementation details of a low-cost embedded system that provides smart features to the conventional low-voltage distribution panelboards. These features include real-time monitoring, controlling, and forecasting of residential loads. Moreover, the system offers periodical reporting of the collected and predicted load data. Using IoT connectivity, the consumer receives these reports and data visualization on a smartphone or a personal computer.
The rest of the paper is arranged as follows.
Section 2 explores the related work.
Section 3 describes the proposed DPB architecture and the embedded system that was formulated and implemented. This offers a detailed description of each system component including sensors, breakers, switches, microcontrollers, IoT platforms, and their communication protocols and security issues.
Section 4 demonstrates the results and the discussion, followed by the conclusions and the future work sections.
2. Related Work
Recently, many research contributions proposed different designs of smart energy meters for home automation and smart building management [
9,
22]. Sayed et al., in reference [
22], suggested a smart meter prototype design based on knowledge of integration of university-level educational courses. With its IoT bidirectional communication capabilities, the designed smart meter showed considerable influence on energy management and control systems aimed at lowering energy usage and benefiting both the utility and the customers. Satapathy et al. [
23] demonstrated a microcontroller-based smart plug system. The plug functions as a data logger, recording the appliance’s power use. The connector communicates to the server through wired Ethernet and uses a non-invasive sensor to measure load current. An Android-based GUI displays the power utilization in real-time. It’s also possible to utilize the smart plug to detect the presence of an electric appliance. This approach is known as intrusive load monitoring. The authors made use of a low-cost commercial smart plug. Future features of the plug system include monitoring RMS current value, real power, phase angle between current and voltage, in addition to the reactive power. The ZigBee and LoRa communication protocols are used to interact with the smart meter devices in a partially grid-connected photovoltaic microgrid, as presented in our previous works [
24,
25]. Olakanmi et al. [
26] introduced an autonomous residential smart distribution system for low-cost energy management in industries, educational institutions, and other utilities in conventional electrical networks. The model they proposed is based on a probability approach using historical consumption records to generate a priority schedule for the connected loads. Aghenta et al. [
27] presented an IoT-enabled supervisory control and data acquisition (SCADA) system design to achieve field instrumentation of a PV system. A low-cost esp32 microcontroller with WiFi was employed to transmit measurement data to an open-source IoT platform.
For many years, experts and scientists have been attempting to find the most efficient and optimal state-of-the-art methods for forecasting future power demand, as reviewed by Al-Mamun et al. in [
28]. Several activities and choices are controlled by load forecasting, including dispatch, unit commitment, fuel allocation, and off-line grid analysis. In the power system, it is very crucial to attain generation and demand balancing criteria. load forecasting using machine learning (ML)-based algorithms is one of the most promising methods to forecast the amount of power or energy required for attaining the generation/demand power balance [
19,
28,
29,
30,
31]. In the work presented by Ruiz et al. [
29], the authors compared several ML algorithms to estimate electrical energy use in a hospital building, using collected real datasets. Several weather conditions features were used to formulate the best load forecasting model of the energy usage for the studied building. Bayılmış et al. [
32] focused on using ML methods in the cloud to perform short-term small power scale forecasting. Time series analysis commonly utilizes autoregressive integrated moving average (ARIMA) models. Moreover, seasonal autoregressive integrated moving average (SARIMA), regression analysis, fuzzy logic, support vector machine (SVM), convolutional neural networks (CNN), deep neural networks (DNN), genetic algorithms, and hybrid approaches are examples among many models and algorithms used for load forecasting [
33].
In this work, we propose a prototype design and the implementation of a smart low-voltage DPB integrated with a residential load forecasting feature in addition to smart control and real-time monitoring and analysis of the connected loads. The main contribution and practical aspects of this work are briefly highlighted as follows:
A proposed design of an IoT-enabled low-voltage distribution panelboard is presented;
An implementation of an embedded system that integrates intelligent capacities to the DPB including load demand predictive model using ML techniques;
The model was deployed using an IoT-platform with online could computation capability.
3. Panelboard Design and Implementation
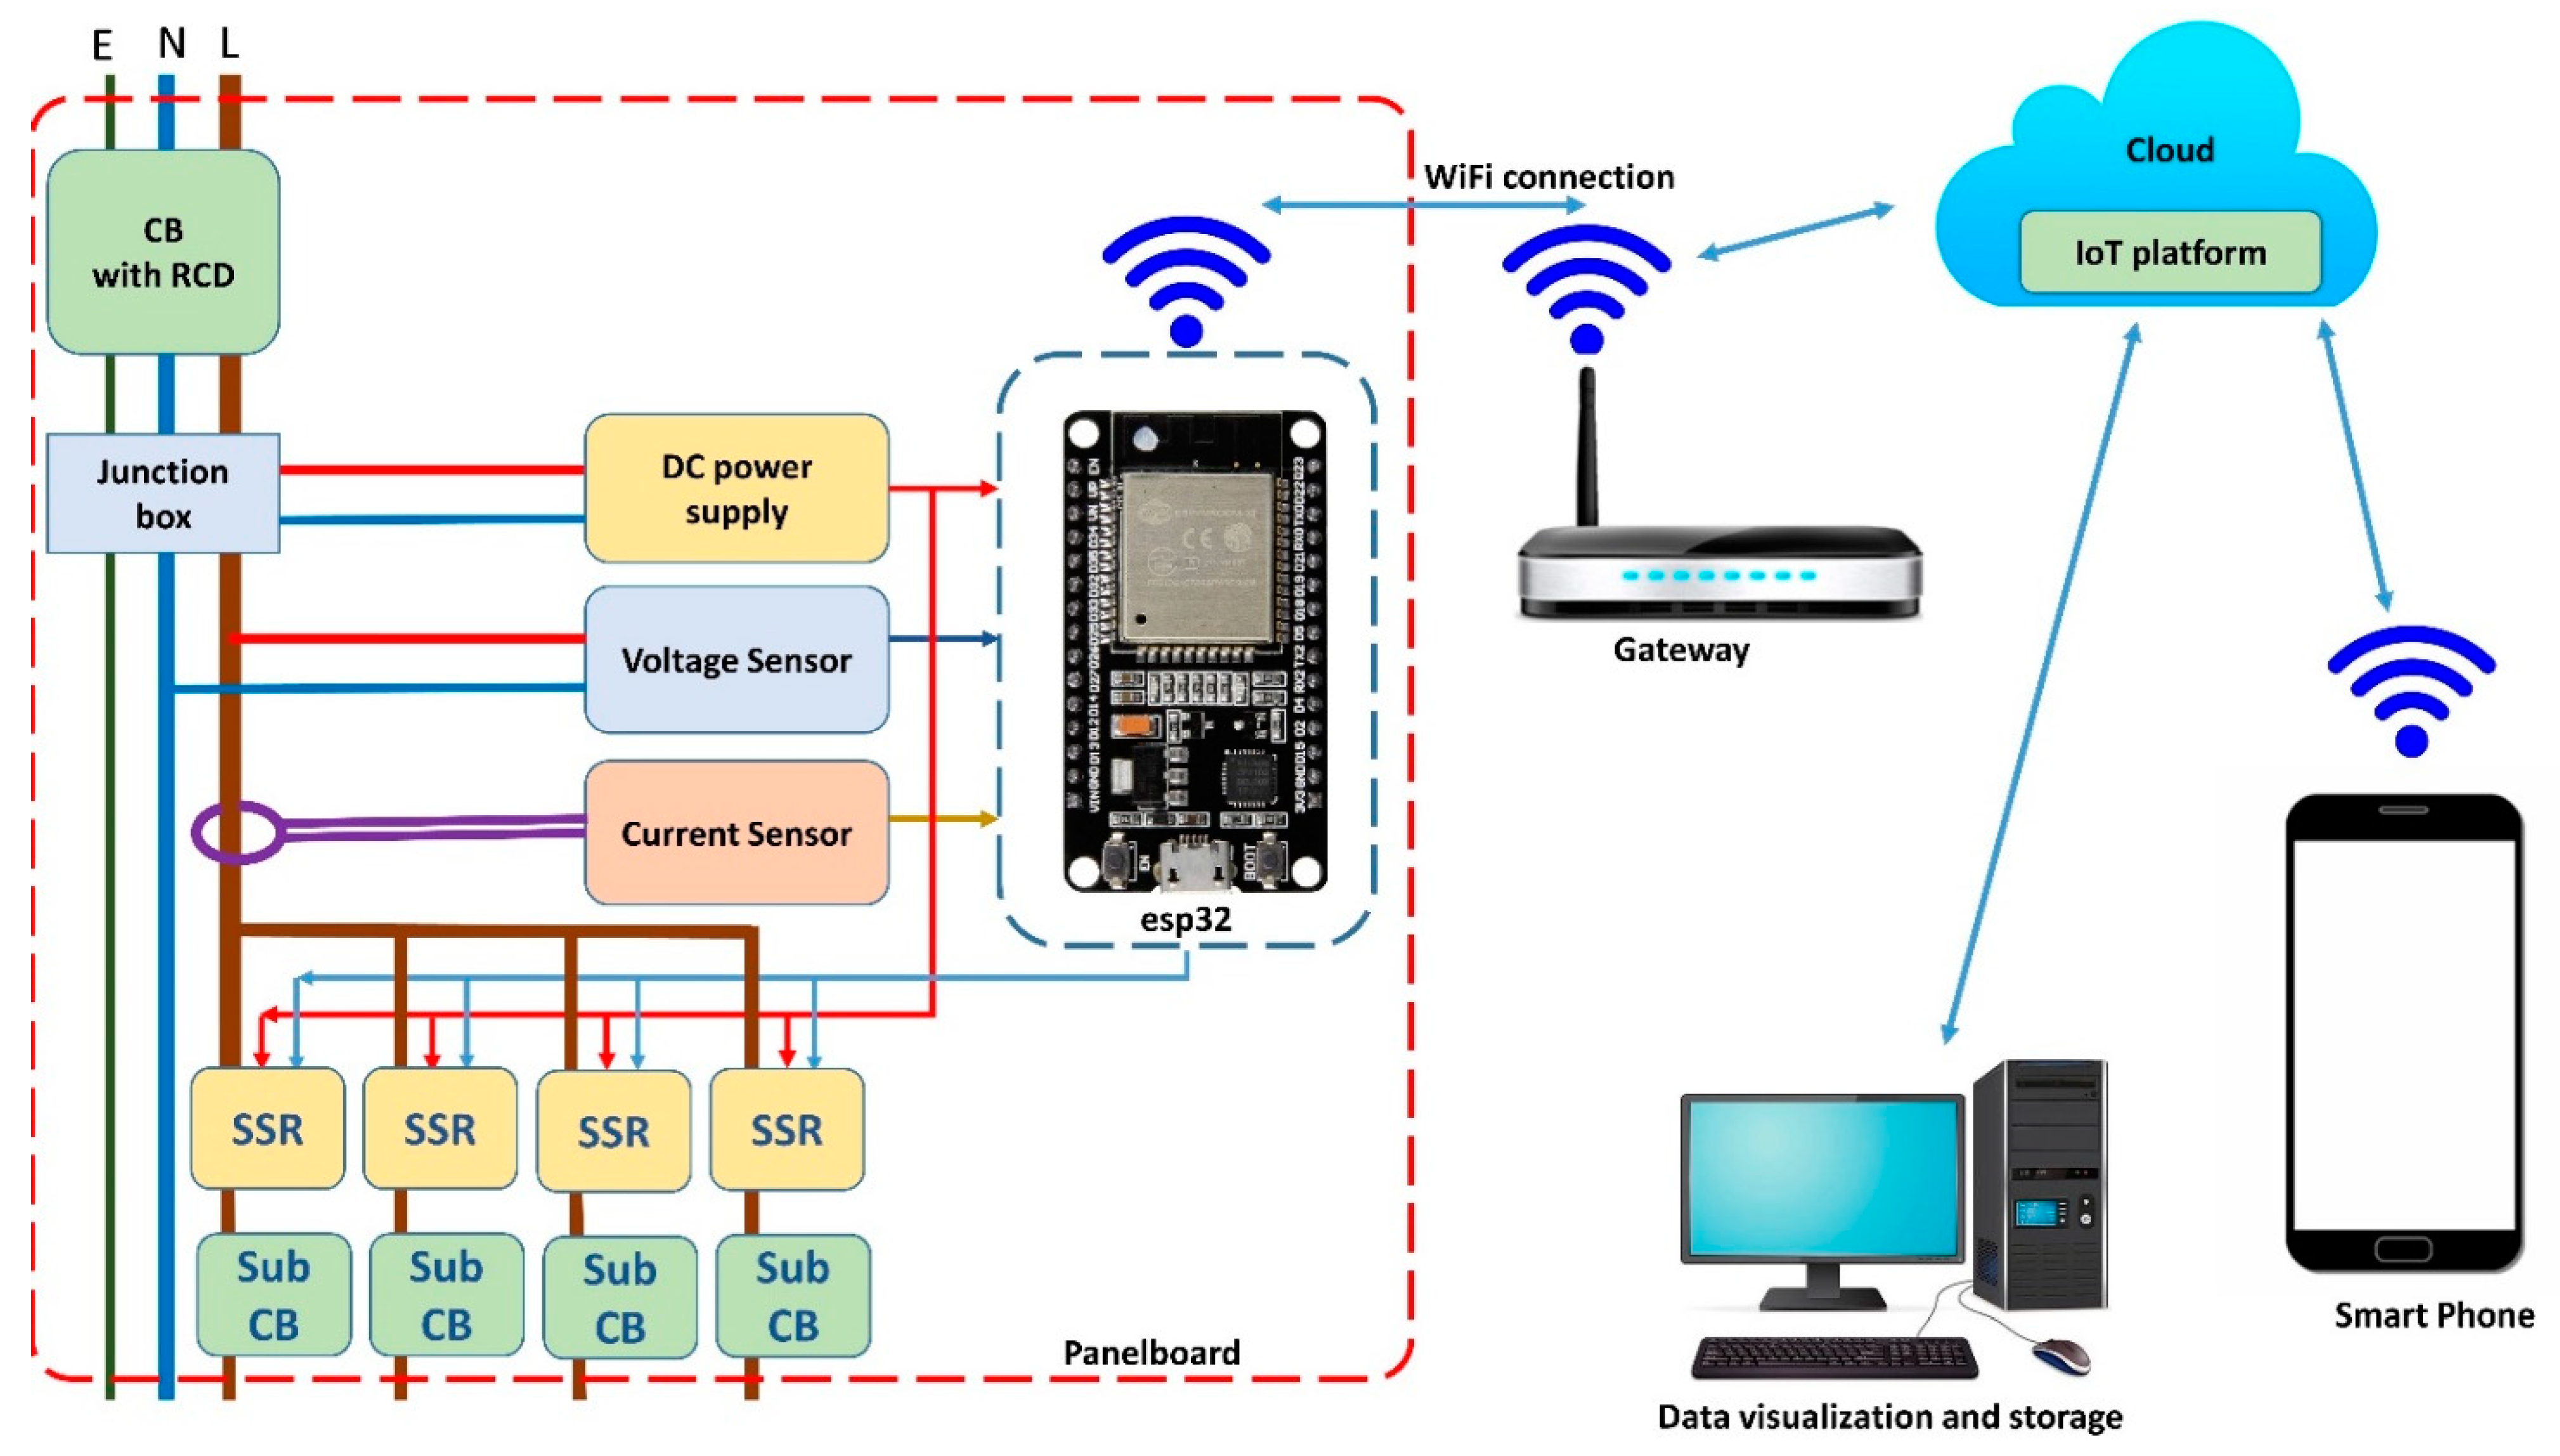
The proposed DPB architecture includes circuit breakers (CBs), solid-state relays (SSRs), a junction box, voltage, current sensors, DC power supply, and a microcontroller equipped with a WiFi module, as illustrated in
Figure 1. To measure the power and the energy consumption, the voltage and current signals are collected by the attached end-node sensors. The microcontroller offers an edge-computing of several electrical quantities such as values of the line voltage and current in root mean square (RMS) values. The collected measurements and calculated data are sent to the IoT platform via a gateway or access point using the WiFi communication link and the IoT protocols. In addition to the interactive display of the transmitted data, the used IoT platform offers cloud computing ability to analyze the received data and facilities taking the required actions.
Figure 2 displays the implemented DPB prototype that incorporates many components such as conventional circuit breakers, sensors, solid-state relays, a power supply, and a microcontroller placed on a control printed circuit board (PCB). The following sub-sections explore the description of each component in the system.
3.1. Power Components
3.1.1. Circuit Breakers
Industrial DPBs are necessarily including circuit breakers that work automatically to safeguard an electrical circuit from damage caused by excessive current. After an overcurrent problem is sensed, the breaker’s primary task is to interrupt the current flow. Main circuit breakers are commonly comprised of or followed by a residual-current device (RCD), which is a device that is designed for human safety, and it may frequently save lives from electrical hazards as it reduces or eliminates the chance of harmful electrical shock. The RCD operates by detecting a circuit imbalance and immediately turning off the power before an accident or electrocution may occur. Additionally, to provide further protection of the connected loads, a sub-circuit breaker (sub-CB) with a different current rating is commonly incorporated for each load. The selection of the appropriate sub-CB type depends on the type and the rating of the residential loads. In this DPB implementation, typical 63 A miniature circuit breakers (MCB) with 30 mA RCD are used in addition to the appropriate sub-circuit breakers with current rating of 32, 25, and 6 A.
3.1.2. Voltage Sensor
A single-phase ZMPT101B voltage sensor was used to measure the DPB line-to-neutral AC voltage. The device comprises a mutual inductance module with a series high-precision voltage transformer (ZMPT101B) and a high-precision operational amplifier (op-amp) integrated circuit for the convenient acquisition of AC voltage signals up to 250 volts. The onboard op-amp circuit performs additional duties such as precise signal sampling and compensation.
3.1.3. Current Sensor
An SCT-013-000 non-invasive current sensor, incorporating a current transformer (CT) with an input current rating of 100 A, was adopted to measure the input current of the DPB. The sensor comprises a split-core current transformer with an output current of 50 mA for the 100 A input. The secondary terminal of the transformer is connected to a burden resistance to convert the output current to a voltage signal. In addition, a simple voltage divider circuit was used to add a DC voltage level of 1.65 V (VCC/2) before entering the input pin of the analog-to-digital converter (ADC) of a microcontroller.
3.1.4. Solid-State Relays
A solid-state relay is an electrical switching device that turns on or off when a small external voltage is supplied to its control terminals. Unlike electromechanical relays (EMRs), which function and switch a supply using coils, magnetic fields, springs, and mechanical contacts, the SSR does not incorporate any coils or moving parts. As an EMR, the SSR offers complete electrical isolation between its input and output contacts. Additionally, DC, single-phase, and three-phase AC currents are easily switched using appropriate SSRs. Generally, the SSR employed Triac or switching transistors in addition to a low voltage control circuit [
34]. Depending on the mode of operation, there are two common types of SSR: zero-crossing and random turn on SSRs. A zero-crossing detection (ZCD) circuit is predominantly included in the zero-crossing SSR. As a result, the ZCD SSR is activated when the current waveform passes through zero current. On the other hand, the random turn on SSR works at any random point in the current waveform. A zero-crossing SSR is utilized for switching resistive loads, while the random turn on SSR is used in the case of the inductive loads. In this prototype, to enable switching control of the connected loads, SSRs with a rating load current of 40 A, voltage rating of 24 to 380 VAC, and control signal level ranging from 3 to 32 VDC were employed.
Table 1 summarized the types and the ratings of sensors and actuators used in the panel implementation.
3.2. Power and Energy Measurement
Smart metering aims to provide effective and continuous monitoring of resource usage. This process commonly uses IoT technology to transmit the collected data to local or internet servers. The devices attaining this function are regularly recognized as smart meters. While there are many devices on the market today, integrating them into a functional smart metering solution for a given application is the most challenging task. In addition to ensure two-way communication, with a sample rate of approximately 1 s, the IoT-based smart meter should be able to handle all smart metering capabilities in near real-time. Linear and non-linear loads are the two most common forms of electric loads, which are mainly used in home load demand. The present smart meter design is primarily intended for monitoring household linear loads such as air-conditioners, refrigerators, fans, heaters, and lighting. To realize a smart metering task in the proposed design, we adopted the following basis. In the AC time domain, sinusoidal voltage and current signals are expressed by:
and
where
Vm and
ω indicate the voltage amplitude and angular frequency, respectively.
Im and
θ denote the current amplitude and phase angle between the measured voltage and the current signals. The RMS values of these analog signals are computed after their instantaneous values have been collected, sampled, and digitalized using discretization techniques:
and
where
vn and
in denote the discrete voltage and the current sample readings, and
N is the sample size. Using the corresponding voltage and the current RMS values, the apparent power (
S) is evaluated:
The real power (
P) is defined as the average of the multiplied voltage-current discrete values; thus, it is computed by:
Consequently, the power factor (
PF) is obtained by:
The reactive power (
Q) is calculated by:
The energy consumption is computed by accumulating the power-time product during a time interval
using the equation:
3.3. Microcontroller and IoT connectivity
In this implementation, the sensors collect the required data from the DPB, then an esp32 microcontroller-based module receives, processes, and transmits that data to the server IoT platform for data storage, remote control, and real-time monitoring through a Wi-Fi network.
The esp32 microcontroller was chosen for this application because of its compact size, low cost, high speed, low power consumption, and ease of configuration. These features make it suitable for a variety of industrial IoT applications and prototyping. More recently, the esp32 microcontroller became completely integrated into industrial automation, primarily in embedded systems deployment and numerous IoT activities [
35]. Considering exchanging messages with the surroundings, the esp32 chip is configured to be fully integrated as a web server, employing wireless WiFi or Bluetooth connectivity. The architecture of the esp32 chip includes a dual-core processor (Harvard Architecture, Tensilica Xtensa LX6, 32-bit CPU clocked at 160/240 MHz). One core is devoted to processing the data collected from the attached sensors, while the other is responsible for resolving communication issues with the neighboring devices. The data and the instruction buses each have a 4 GB address space, along with 512 kB peripheral address space. The integrated memories also include two 8 kB RTC, 448 kB ROM, and 520 kB SRAM memories. Up to four 16 MB flash memory are to be used as external memory. The ESP-WROOM-32 module, equipped with 802.11 b/g/n WiFi and 4.2 BR/EDR + BLE Bluetooth modules, operates at a voltage range of 2.2 V to 3.6 V with an average current of 80 mA. Therefore, it is simply powered with either a 5 V USB adaptor, a separate input DC power supply, or a single-cell lithium-polymer (LiPo) battery. Additionally, it comprises 18 analog-to-digital converters (ADC), each 12-bit and two (8-bit) digital-to-analog converters (DAC) [
36]. In the present work, metering data was temporally stored and pre-processed at the edge before being transmitted to an application operating on a cloud platform. The procedure followed for data collection, processing, and transmission is listed in Algorithm 1.
| Algorithm 1 The procedure of data collection, processing, and transmission |
| 1: Initialize: ADC settings, ADC pins wherein the sensors are attached, calibration parameters, number of samples/window, and WiFi settings. |
| 2: Record the starting time of the program |
| 3: Read voltage and current signals from the attached sensors |
| 4: Calculate RMS values of V, I, and P for the samples window |
| 5: Calculate S, Q, PF |
| 6: Calculate elapsed time and E |
| 7: Start communication with the IoT server |
| 8: Send data packets using the assigned IoT protocol |
| 9: Repeat steps 3 to 8 |
3.4. IoT Platforms and Protocols
Many capabilities for remotely controlling IoT devices are offered on the platforms, including provisioning, secure data storage, over-the-air firmware upgrading, data visualization, and analytics. In this implementation, real-time load monitoring and controlling were performed throughout the Blynk IoT platform [
37]. Blynk is a powerful industrial IoT platform that supports over 400 hardware devices including the esp32 modules [
37]. Regarding its service security, Blynk mostly relies on the industry standards known as transport layer security (TLS) protocol. A Blynk server, by default, uses the latest available protocol TLSv1.3 [
37]. As displayed in
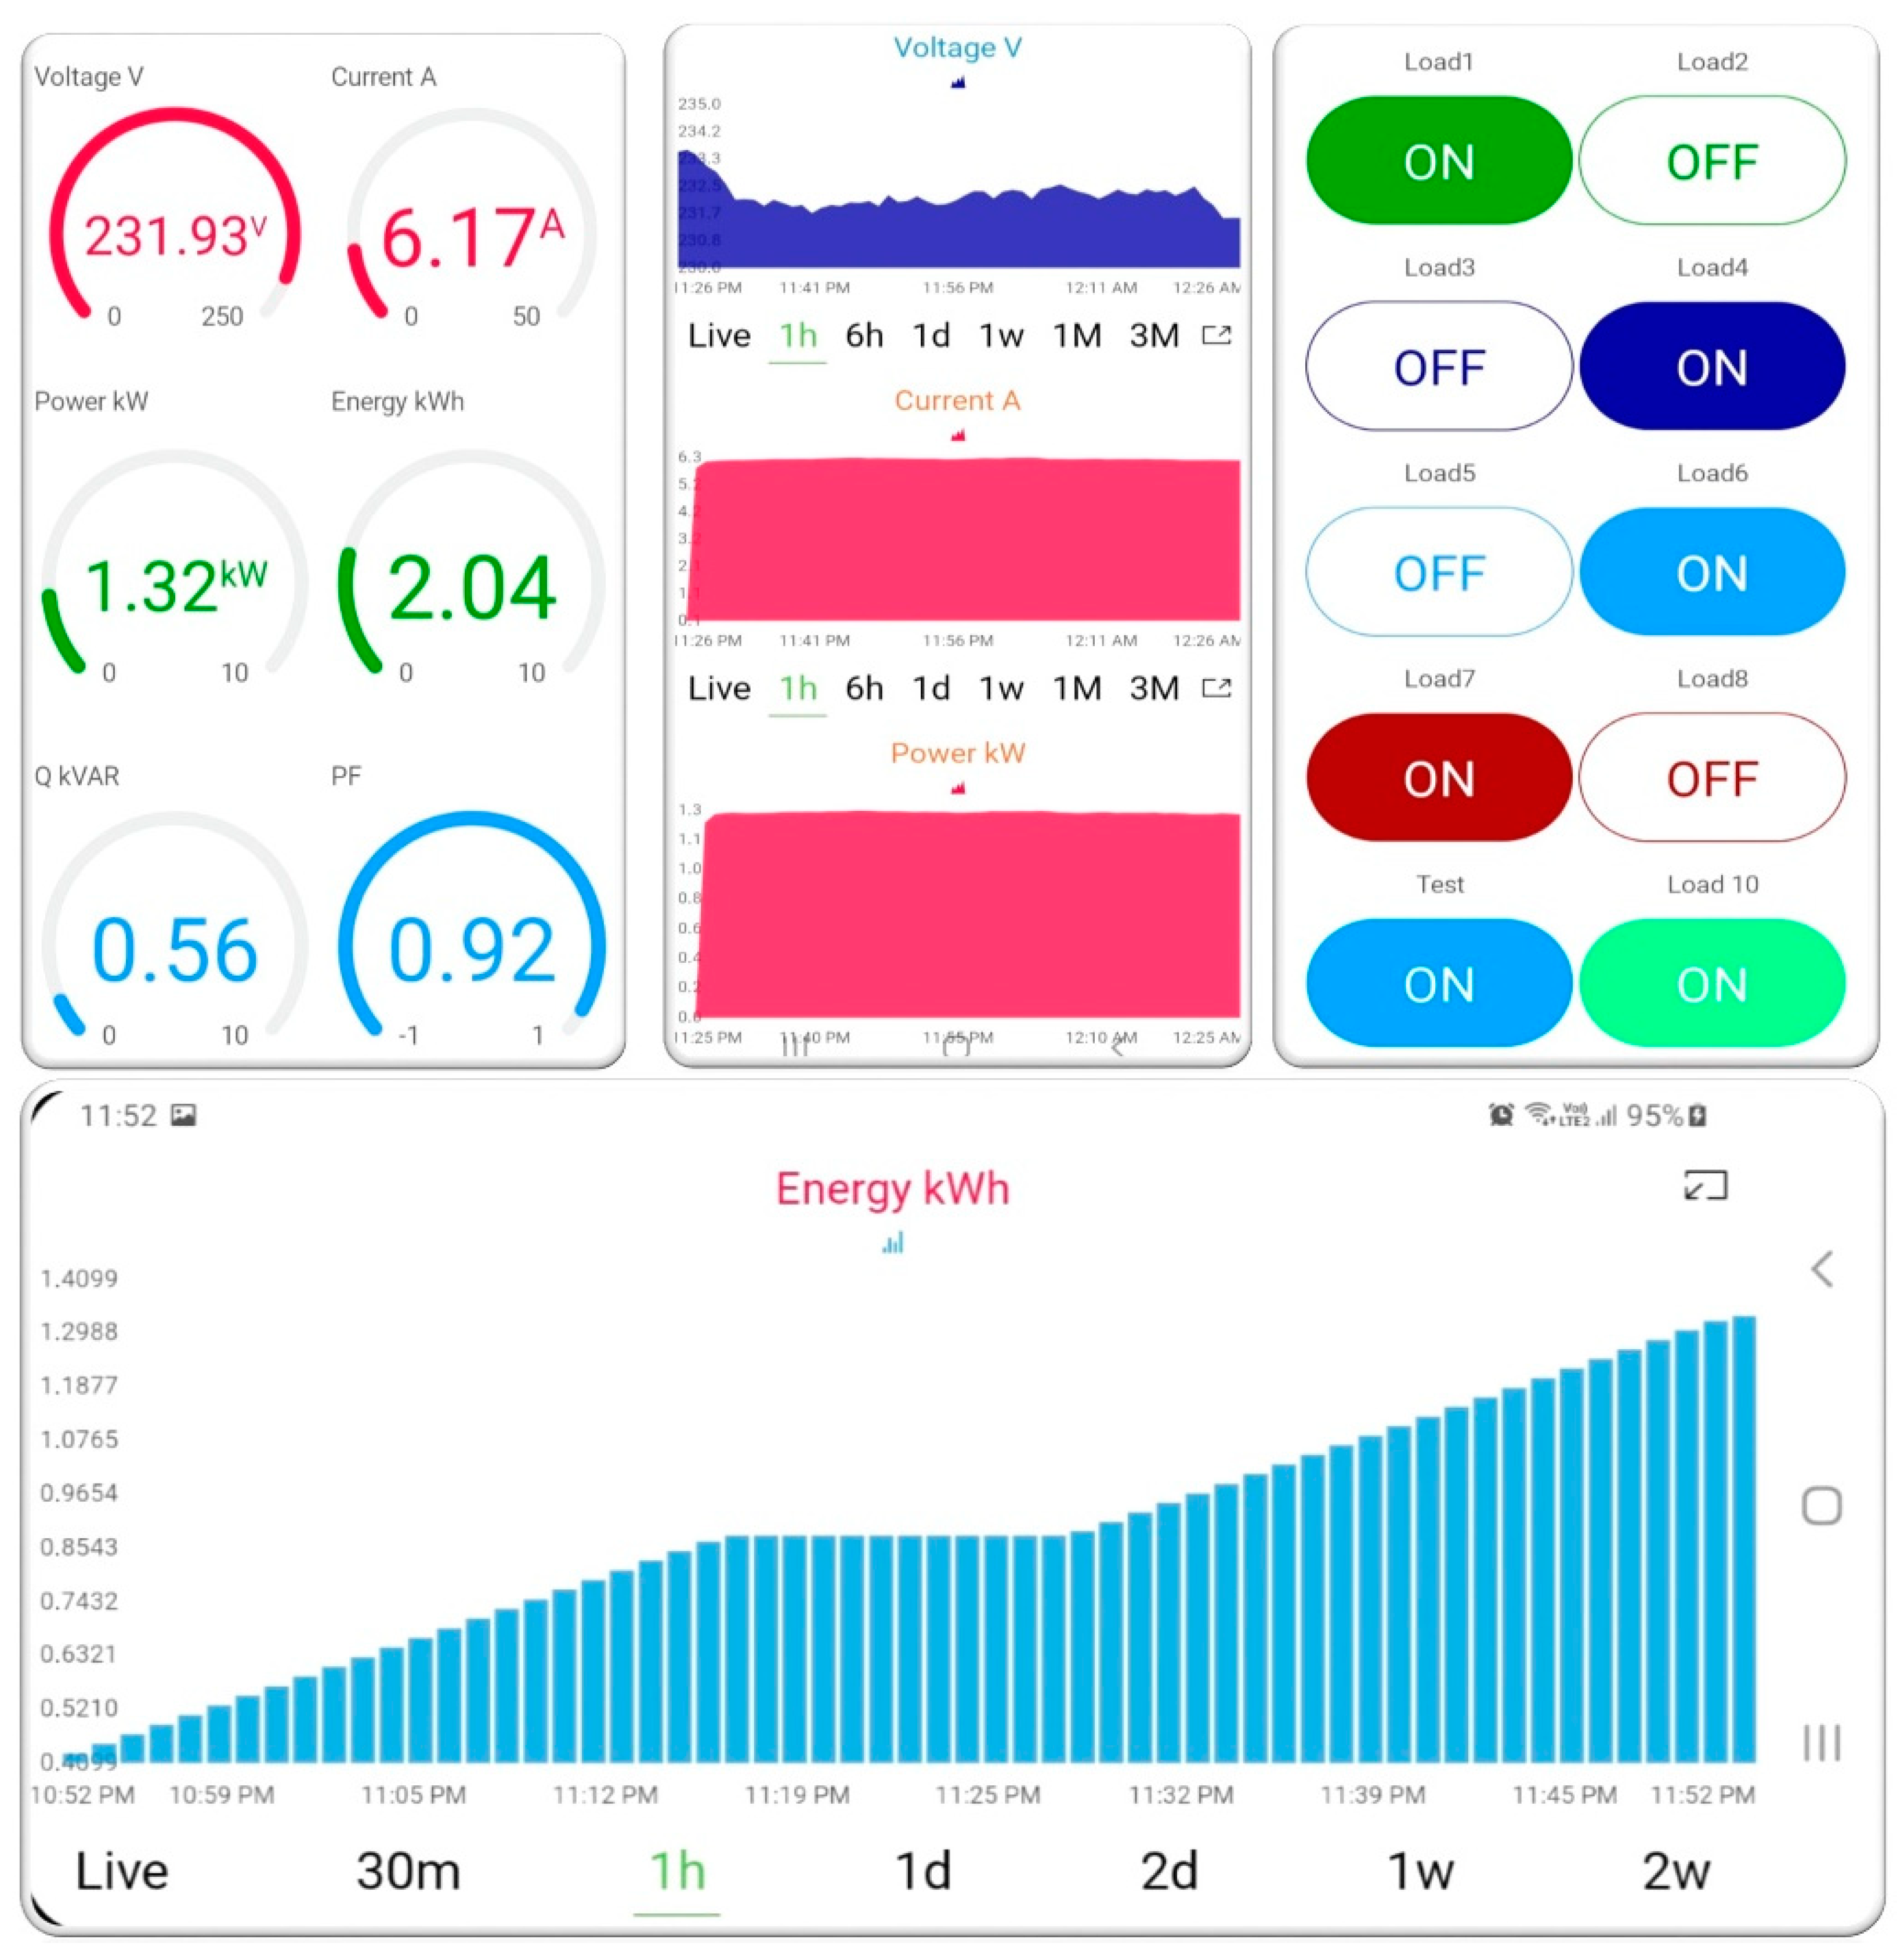
Figure 3, we used the Blynk mobile application to display the collected data for customer load profiles, energy consumption, and appliance remote controlling using interactive dashboards. The data processed by the esp32 module is represented in 12-bit accuracy, and every 1 s a reading is sent to the IoT Blynk server. The Blynk server receives the transmitted data sent by the esp32 including the sensed voltage, and current signals in addition to the other edge-computed electric power quantities. A designed dashboard, on the Blynk platform, was allocated to display the DPB collected data of voltage (V), current (A), real power (in kW), apparent power (in kVA), reactive power (in kVAR), power factor, and the consumed energy (in kWh). Additionally, the user can simply identify the recent status of each connected load of the DPB, and they can remotely control them (on-off switching) by clicking on the dedicated icons on the dashboard.
The ThingSpeak IoT platform is a cloud-based IoT analytics tool that facilities gathering, visualizing, and analyzing data streams in real-time [
38]. Moreover, it provides the capability to run MATLAB code to analyze and to handle data in real time. More recently, ThingSpeak is frequently used for IoT system prototypes and proof of concept that needs further cloud computing and analytics. Using third-party services, it automates acting on data processing and communication through different ways of actions, notifications, and alerts using an application programming interface (API). ThingSpeak is adopting a lightweight and efficient IoT protocol known as message queueing telemetry transport (MQTT) [
39]. This IoT messaging is a machine-to-machine communication protocol that is adequately suitable when the clients’ numbers are small with low resources, making it appropriate to be used on microcontrollers. Therefore, to save network traffic, MQTT message headers are minimal. The MQTT protocol is based on a publisher/subscriber configuration. In this protocol, the publisher publishes data to a server (commonly known as a broker), and the subscriber subscribes to the server and gets data (of a certain topic) from the server. The MQTT broker is in-charge of message distribution, and it is found somewhere in the cloud. The publish/subscribe architecture allows the linking of limited bandwidth devices across wireless networks. The publish/subscribe design allows messages to be delivered to client devices without the requirement for the device to query the server regularly. A secure sockets layer (SSL) is used to secure the MQTT communications over TCP/IP or WebSockets.
Regarding QoS, the MQTT protocol offers three levels, namely QoS-0, QoS-1, and QoS-2 [
40]. In the first level, only the payload is delivered or received in QoS-0, and neither the receiver nor the sender acknowledges or saves and sends the message. This level is the very bare minimum that provides the best possible delivery effort. Under QoS-1, the acknowledgment is guaranteed, however, there is a possibility that exchanged messages will be lost. At the very least, after the delivery has been acknowledged. The client resends the published packet and sets a duplicate flag if the published acknowledgment isn’t returned after a particular duration of time. In QoS-2, data transmission is guaranteed and delivery will take place on a schedule. When the broker receives a QoS-2 published packet, it processes it and then provides the publishing client with a publish-received message, which verifies to the client that the broker has successfully received the message. After that, the client discards the previously-stored published packet and replies to the server with a publish-release packet. Depending on the application, the MQTT can handle a message size up to 256 MB with a 2-byte packet header [
41].
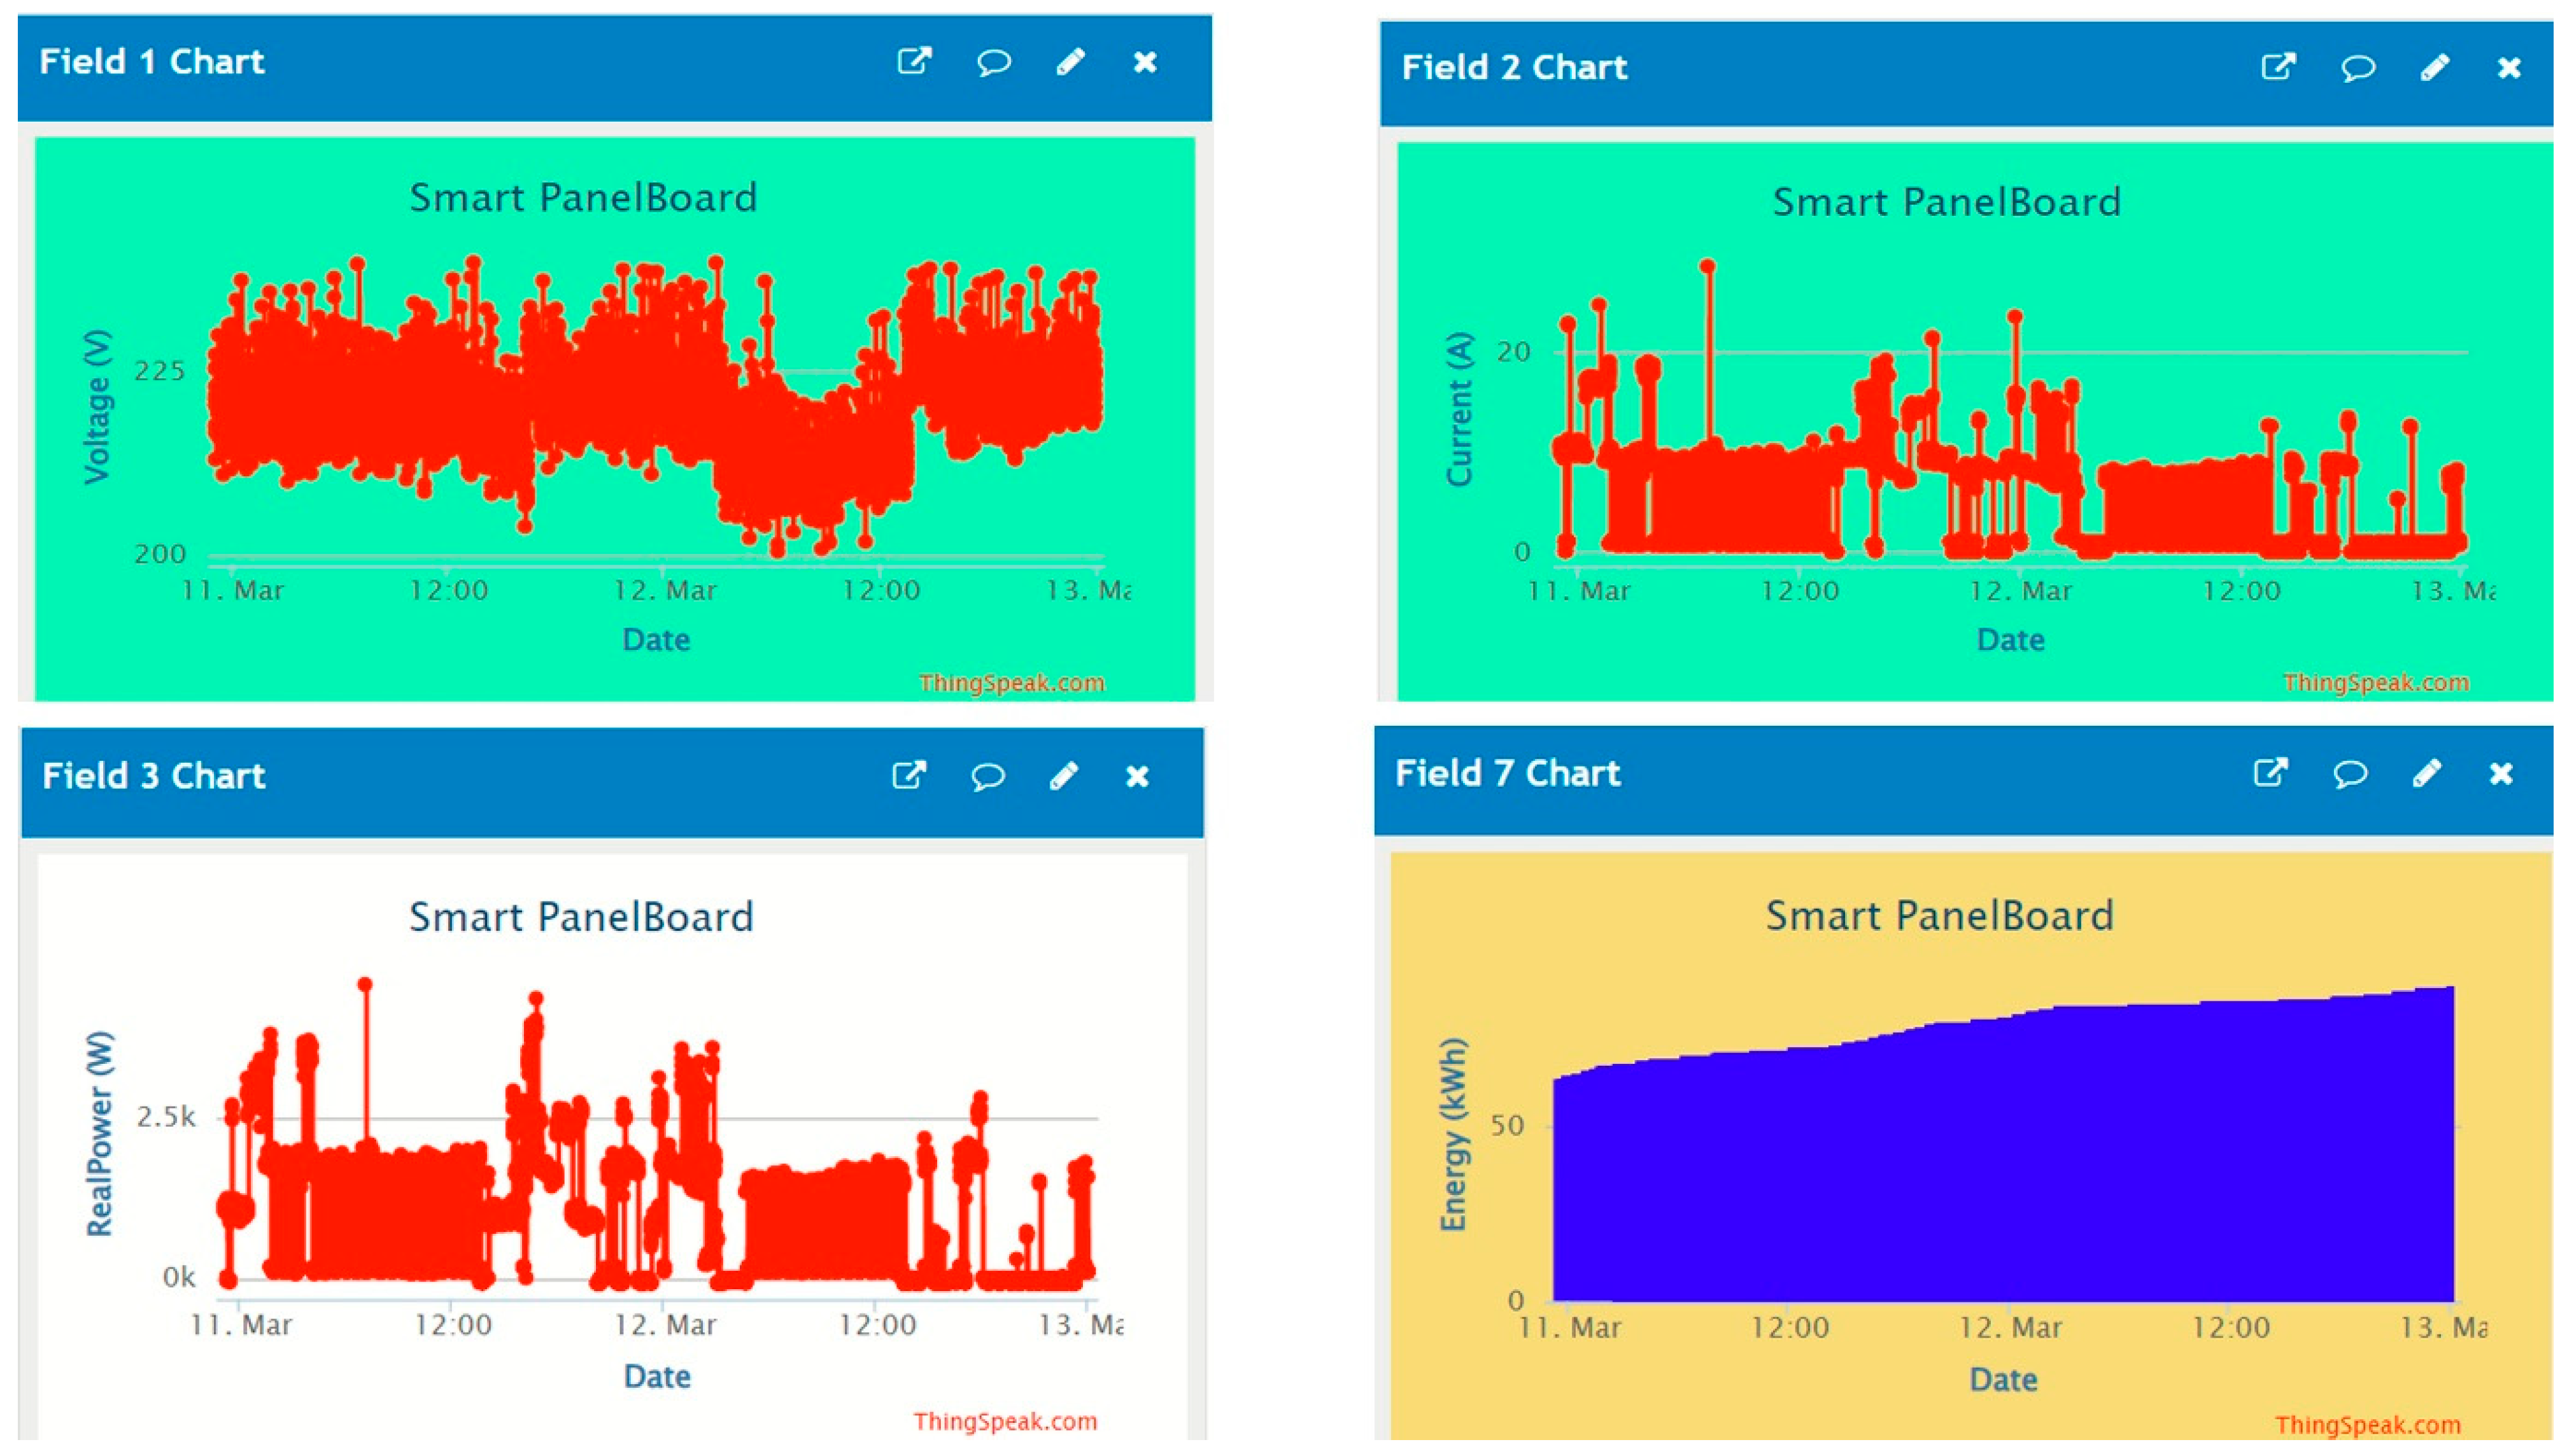
In this application, we used the ThingSpeak IoT platform to collect the electrical quantities of the DPB and to provide an abundance of accommodating data visualization, action, and processing. We performed the deployment of an optimized online ML model to predicate monthly load demand profiles.
Figure 4 illustrates samples of interactive data visualization of the DPB transmitted data. Data packets were collected every 15 s; however, they are collected every 1 s in a commercial license of the platform.
3.5. Load Forecasting Model
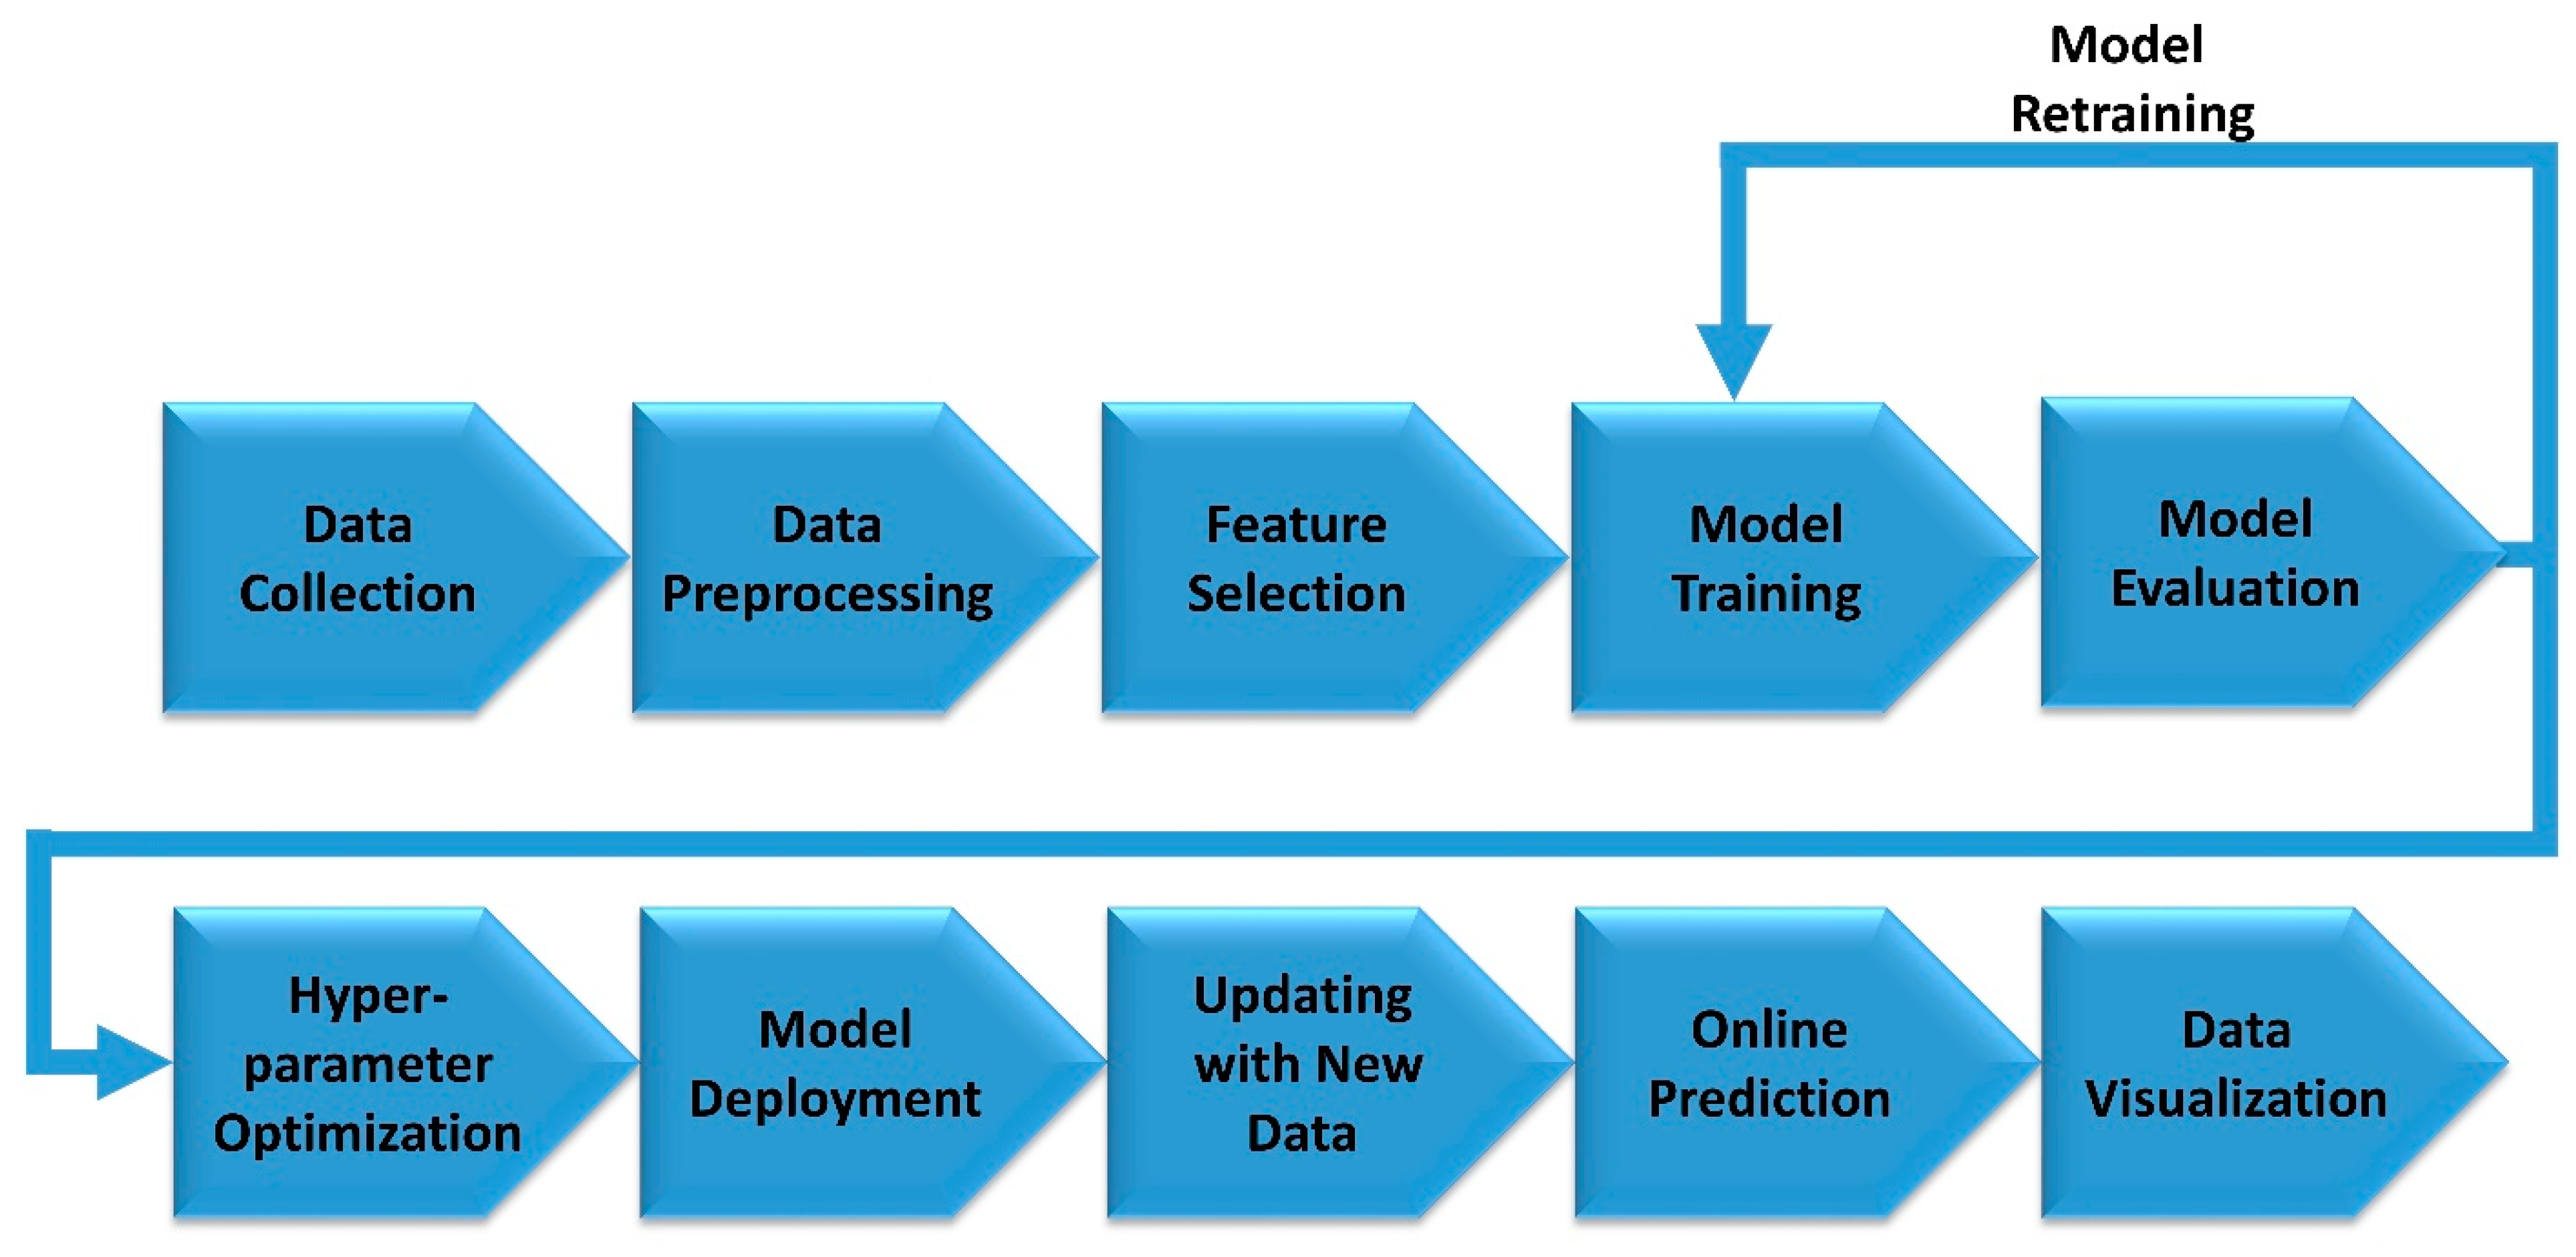
It is well known that human activities and weather conditions greatly affect energy consumption. Therefore, several historical weather parameters were used as input predictors of the load forecasting model. The timestamp monthly reported data of the energy consumption along with historical weather condition observations such as minimum temperature (
Tmin), maximum temperature (
Tmax), average temperature (
Tav), relative humidity (Hum), and wind speed (Wind) were used as inputs to train several ML models according to the framework displayed in
Figure 5. Initially, the datasets were collected and preprocessed to remove any observed outliers. To make the computations easier and to prevent the impact of unmatched data scales on model conversion and its training time, the power load data, as well as its corresponding weather condition observations, were normalized using the equation:
where
xn denotes the normalized data,
x denotes the original data,
xmin, and
xmax denote the minimum and the maximum values observed in the dataset, respectively. After the model training, the manipulated output data was recovered in its original form using the equation:
To discover the most essential factors that greatly affect the forecasting model, we employed a correlation matrix (CM) along with a principal component analysis (PCA) in statistical processes known as feature selection. To obtain an accrete ML model suitable for load forecasting, several datasets of electric residential loads were collected over the previous years. Then, different supervised ML algorithms were trained and tested for each dataset. These models were linear regression, Gaussian process regression, regression trees, ensembles of regression trees, and SVM models [
42]. Several assessment indices are commonly used to evaluate and validate ML models. In this study, the predicting performance was evaluated using the following measures:
- (1)
Residuals,
ri, which represents the model’s error for each data point. All regression metrics are a summary of these values which are given by:
where
refers to the actual, or measured, response values of the model, while
refers to the predicted values;
- (2)
Root mean square error (
RMSE), which is calculated by:
- (3)
In addition, the coefficient of determination,
R2, is commonly used to evaluate and compare various regression models, and it is evaluated by:
where
refers to the mean of the predicted values.
After selecting the best-fit regression model, its hyperparameters were tuned using extra optimization choices. Therefore, the objective function, recognized here as the loss function, is minimized for optimally tuned model hyperparameters. This function returns the mean squared error (
MSE) values for each training iteration. The
MSE is calculated as follows:
After optimizing the model, it is deployed into the cloud and linked to the data collected from the DPB. The model is updated with future values of predictors to predict and to visualize the future load demand.
4. Results and Discussion
In this study, we describe a prototype design and the implementation of a smart DPB with an electric load forecasting model, in addition to smart control, real-time monitoring, and analysis of residential loads. The trained model, produced by a supervised ML algorithm, has been deployed into IoT-Platform with cloud computing capacity. In this section, we explore the most important results of the system implementation.
After constructing the DPB, it was connected to the IoT platforms and the collected data were calibrated using accurate laboratory equipment and instruments. Samples of voltage, current, power, power factor, and energy collected readings, in addition to loads control dashboards are displayed above in
Figure 3 and
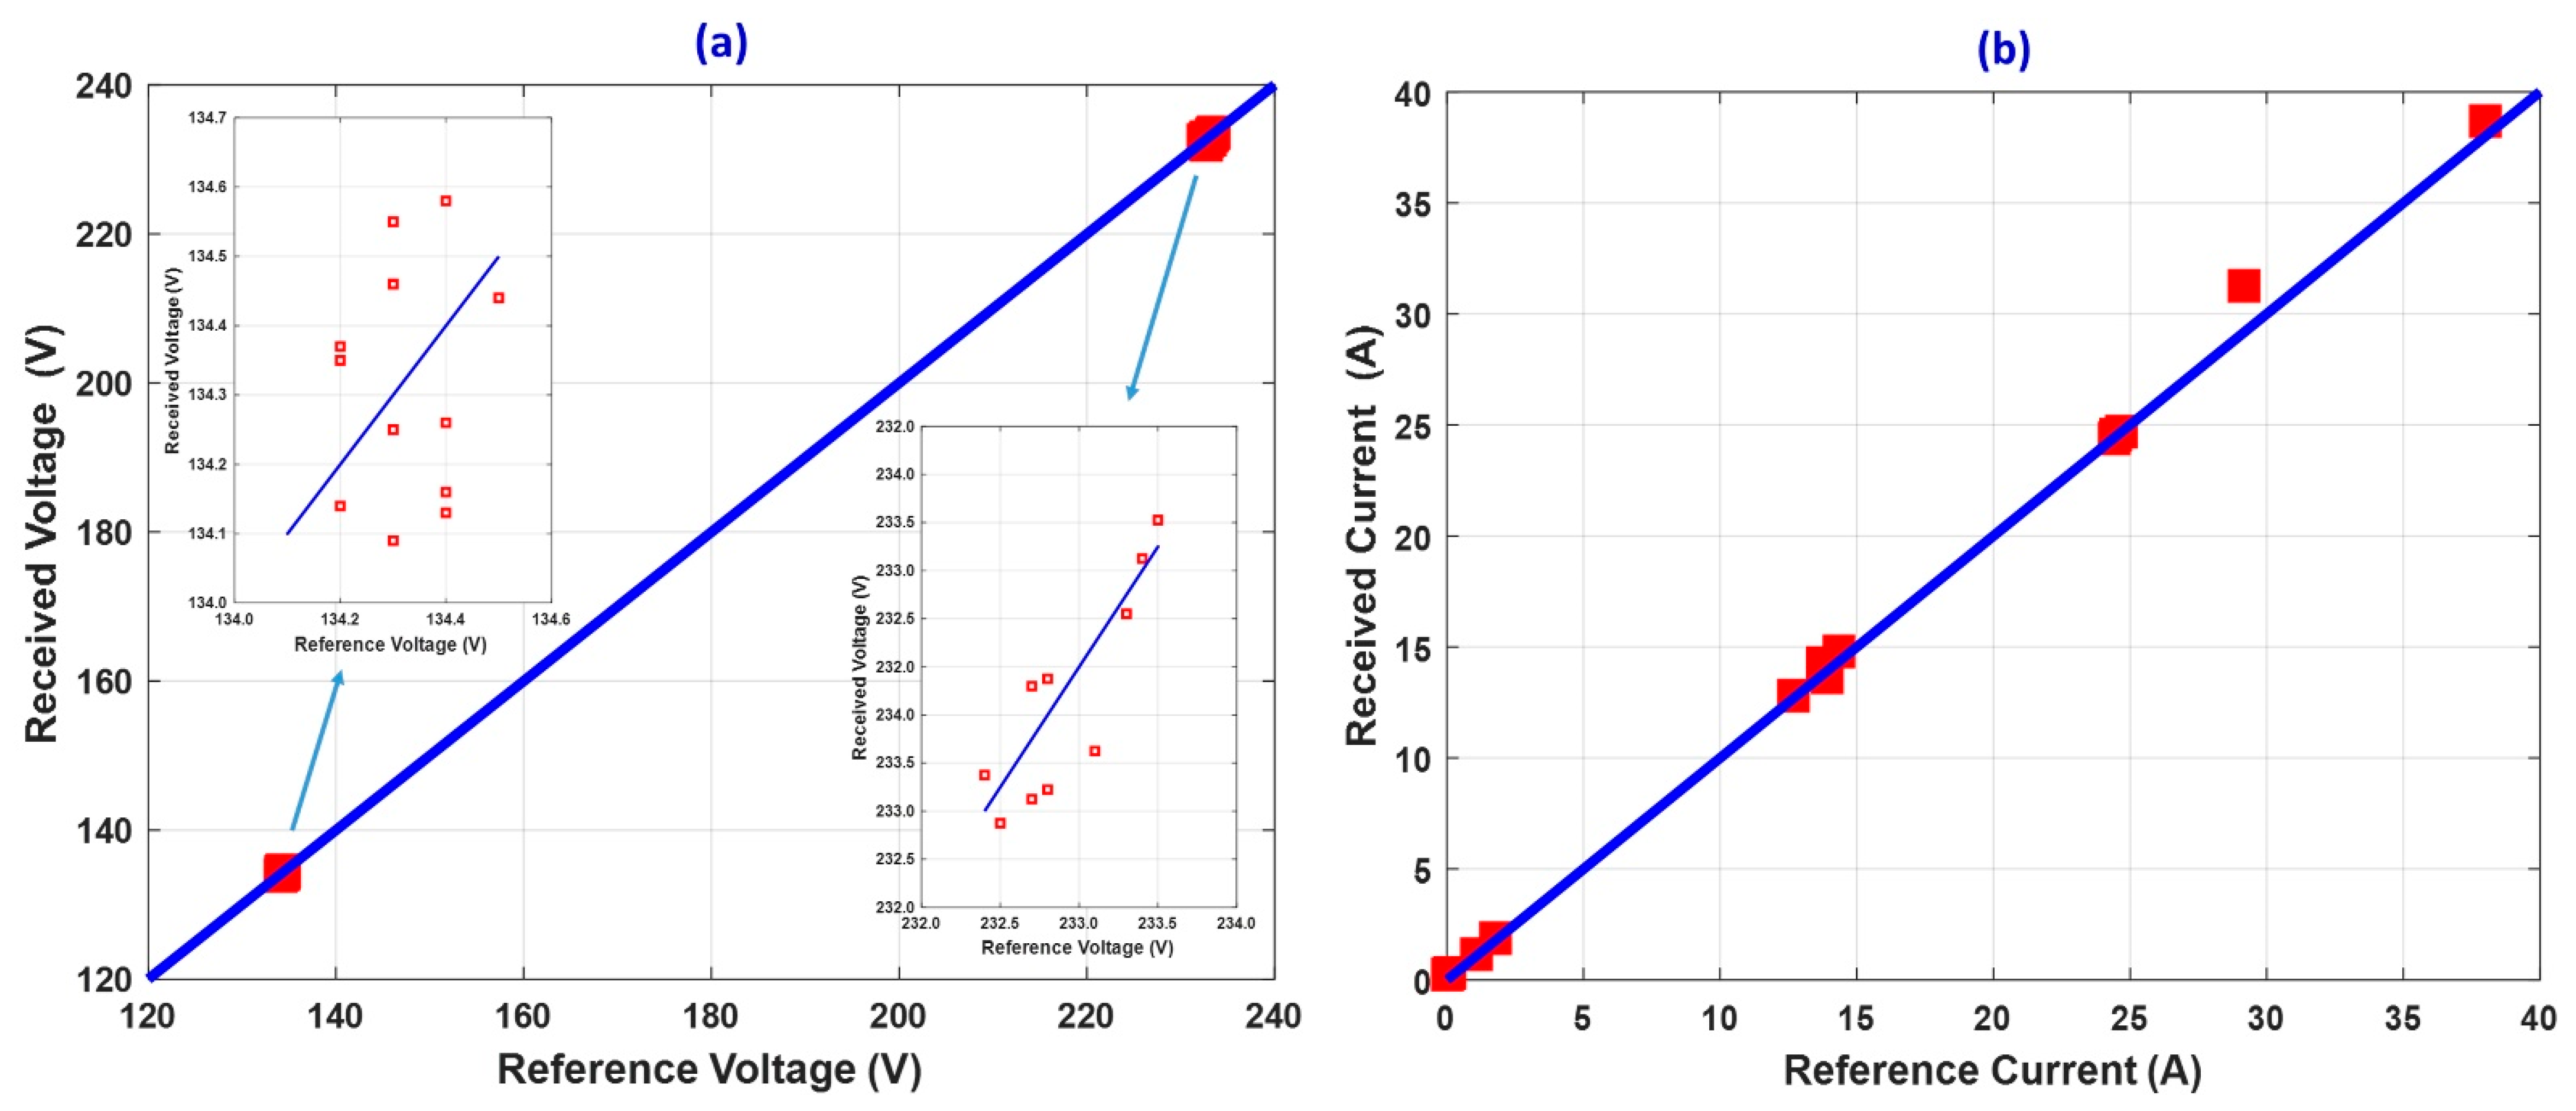
Figure 4. The calibration results in which the received data by the IoT platforms were plotted versus those of reference readings measured by the laboratory instruments are illustrated in
Figure 6. Using multiple compared readings of the voltage and the current measurement, the
RMSE was evaluated to be 0.98 V and 0.65 A, respectively. The metering accuracy was estimated to be ±1.6% in the voltage range of 0 to 250 V, and ±3.5% in the current range of 0 to 60 A. Hence the voltage and the current sensors comprising transformers in their internal structures may result in a phase-shift error. Therefore, these phase errors must be corrected or compensated. In this regard, the phase errors were carefully measured and calibrated using a digital oscilloscope and a laboratory phase meter along with multiple resistive and inductive loads.
To implement the ML model, multiple historical datasets including weather and energy consumption were collected for average residential loads located in the Qassim area, KSA.
Figure 7a shows the monthly energy consumption (in kWh) of four residential buildings (H1 to H4), which were collected during a period of three years (from November 2019 to October 2021).
Figure 7b shows more recent data (from April 2019 to February 2022), collected for the fifth building (H5) in the same area. The data exhibits seasonal fluctuations in the household load demand showing minimums in winter times and peaks in summer times. This depicts a strong relation of the demand with weather conditions, especially the temperature. As mentioned earlier, many weather parameters were used as load demand predictors such as
Tmin,
Tmax,
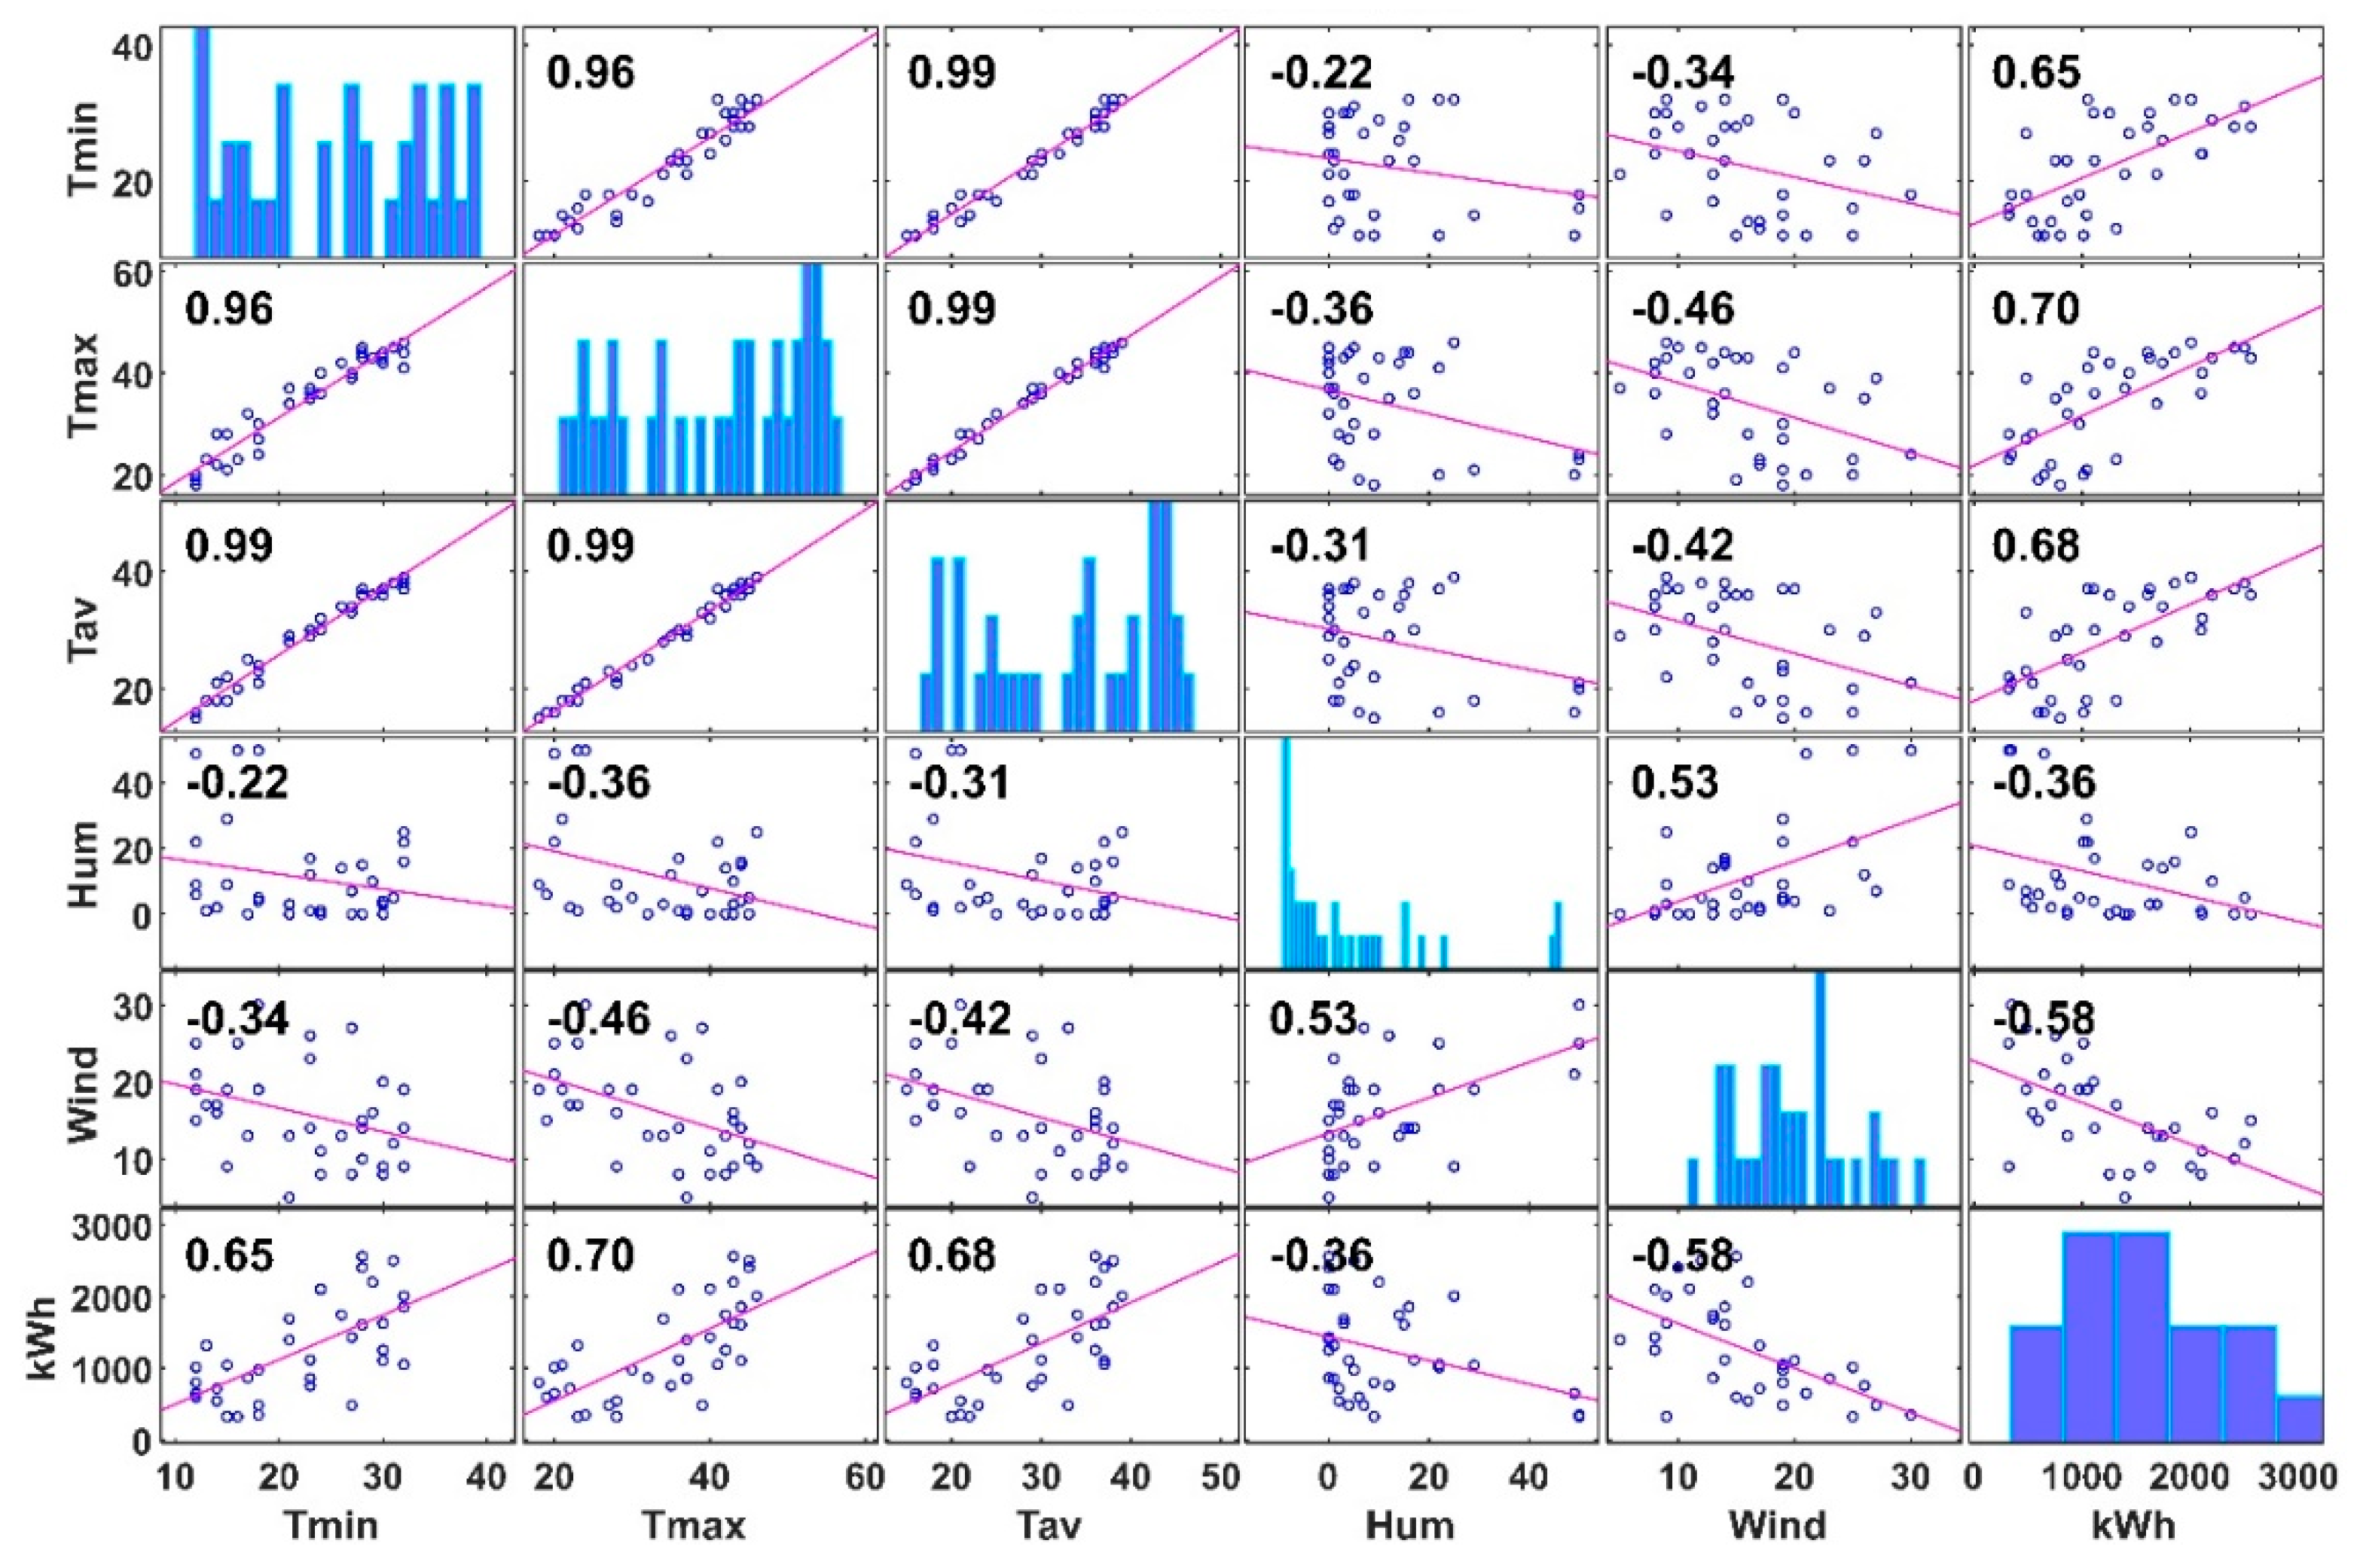
Tav, humidity, and wind speed. We used CM along with PCA to determine the most important features that affect the forecasting model.
Figure 8 demonstrates the CM plot of relations and statistical distribution of the predictors and response (demand in kWh). The correlation coefficients between all pairs of variables in the input time series data matrix are plotted. Each off-diagonal subplot has a scatterplot of two variables with a least-squares reference line whose slope equals the reported correlation coefficient. The distribution of each variable is shown as a histogram in each diagonal subplot. It is concluded from the plot that there is a strong correlation between the demand and the temperatures. Among the three representations of recorded temperatures, the maximum temperature possesses the strongest correlation. Therefore, the three temperature predictors
(Tmin,
Tmax, and
Tav) are possible to be merged into only one predictor,
Tmax. The second strong correlation is for the wind speed, in which a negative strong correlation is observed. Increased wind speed somehow plays a significant role in the natural cooling of the buildings. On the other hand, it seems that the relative humidity weakly affects the demand, as it shows the weakest correlation. This might be referred to as the humidity commonly showing slight fluctuations in the local area where the data was collected.
Cross-validation (CV) data partitioning is essential to acquiring accurate ML models. In this step, the data were randomly partitioned into two groups, the training set, and the validation or testing set. CV aids in the partitioning of data into a set of folds (k) in the training of the model and also in calculating the average test error over all of the folds. This approach protects against overfitting better than other methods; however, it necessitates several fits, therefore it is best for small and medium-sized datasets. In this model, we set the CV partitioning into k = 5 folds for all datasets. As listed in
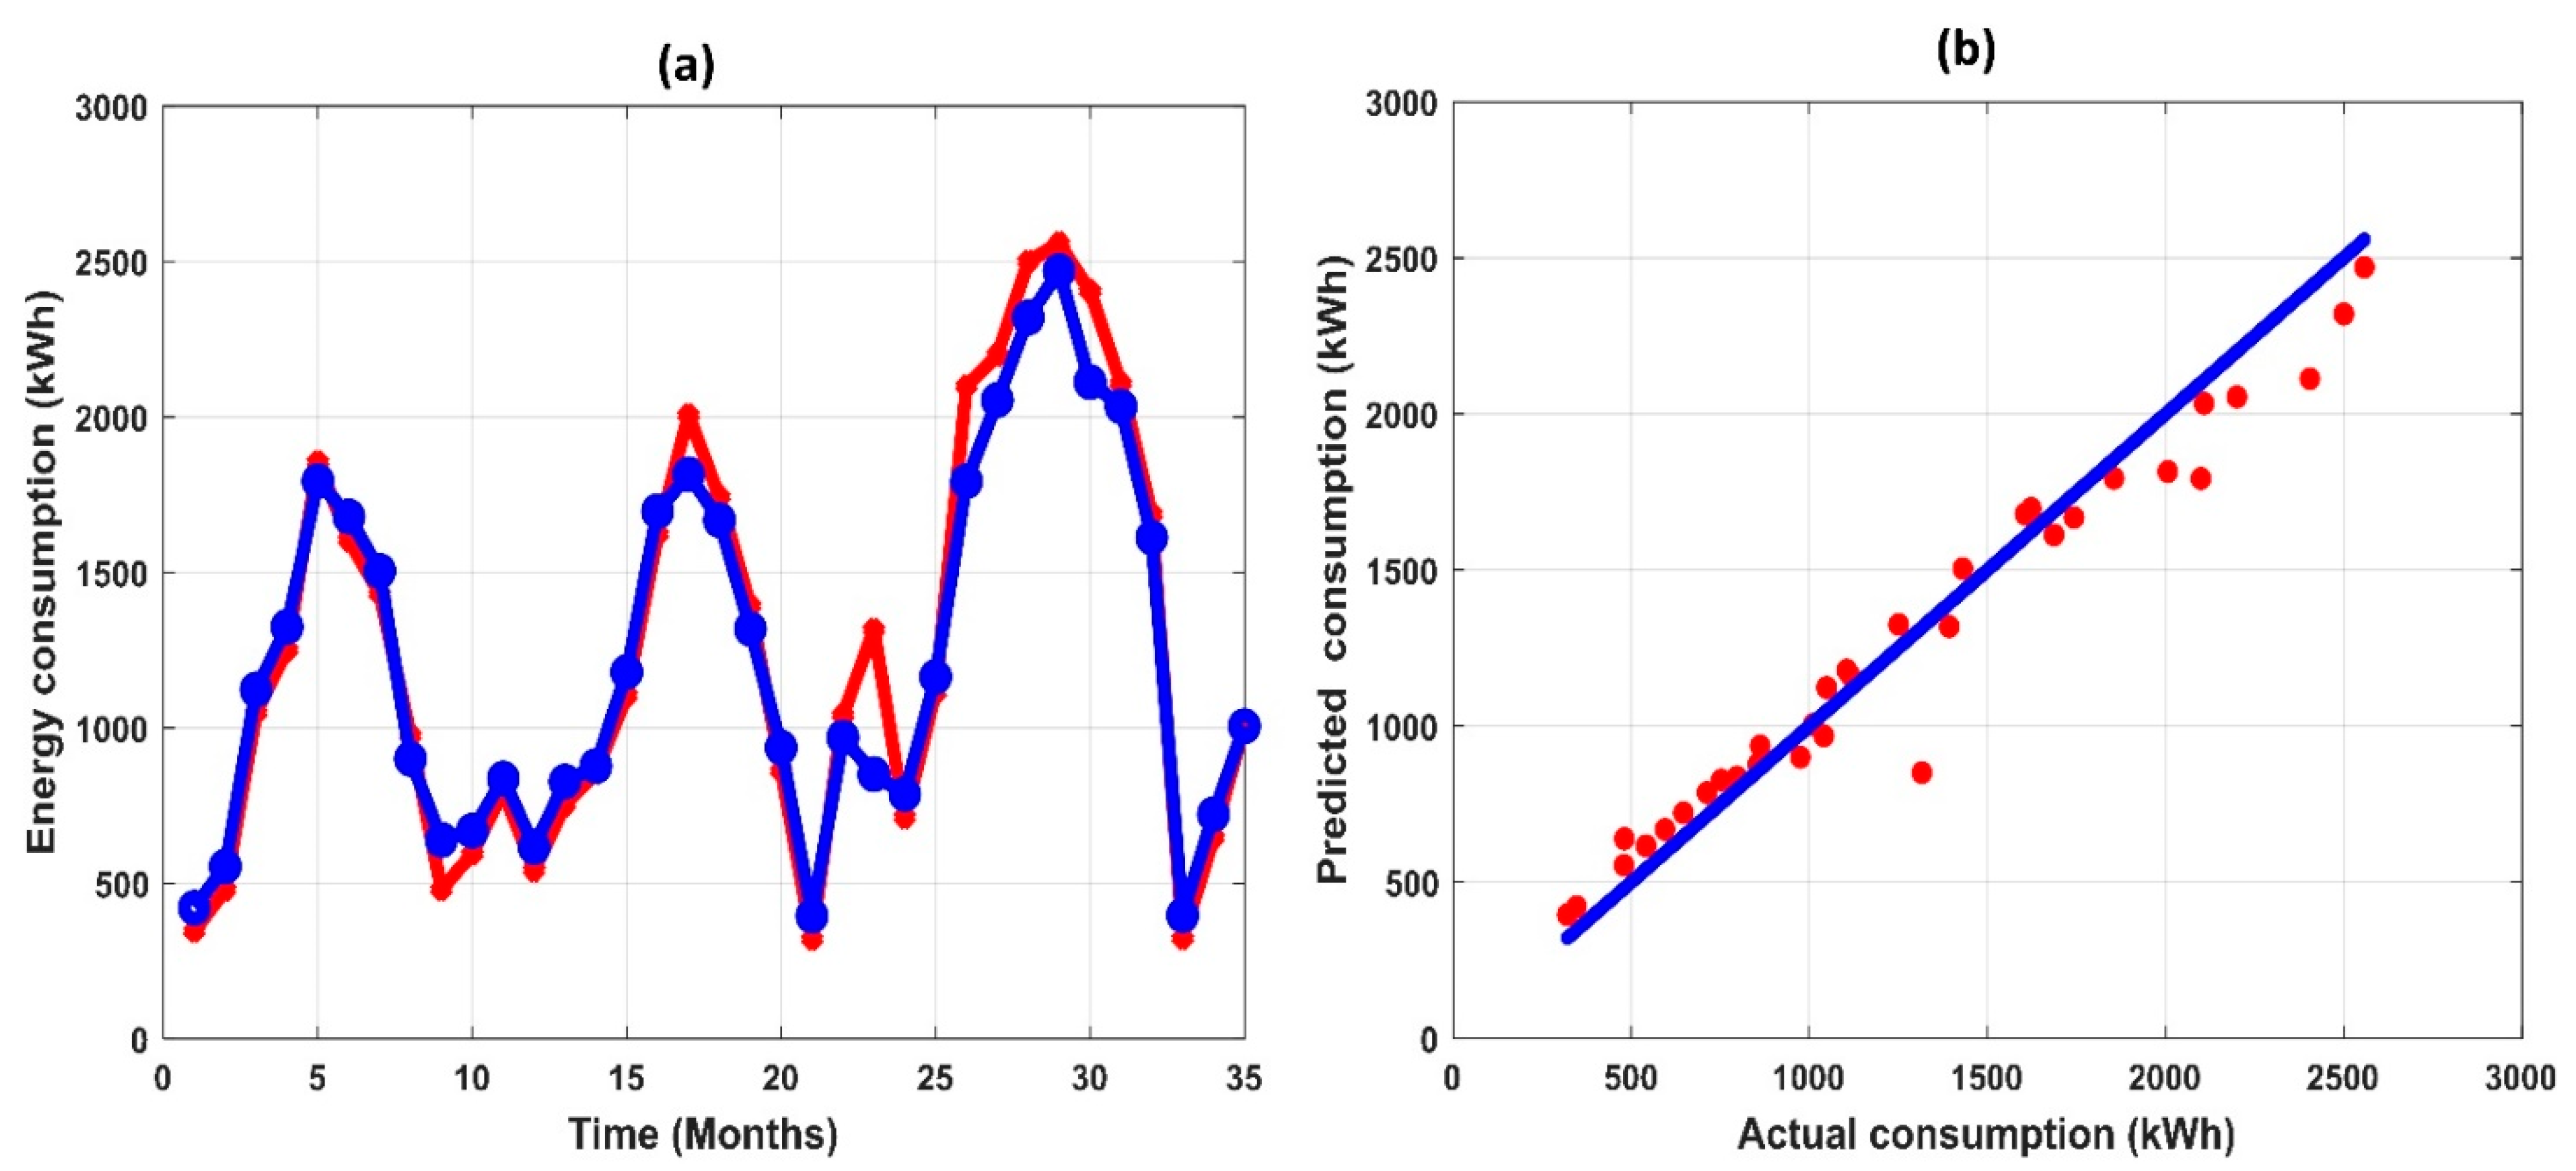
Table 2, several ML algorithms were trained and evaluated for the H5 dataset. Among those, the fine Gaussian SVM algorithm gave the best-fit results. Similarly, for all of the datasets, the best-fit results were achieved by the SVM algorithm, with a training
RMSE of 136 kWh and an
R2 value of 0.96, as listed in
Table 3.
Figure 9 shows comparison plots of the predicated consumption versus the actual for the H5 dataset.
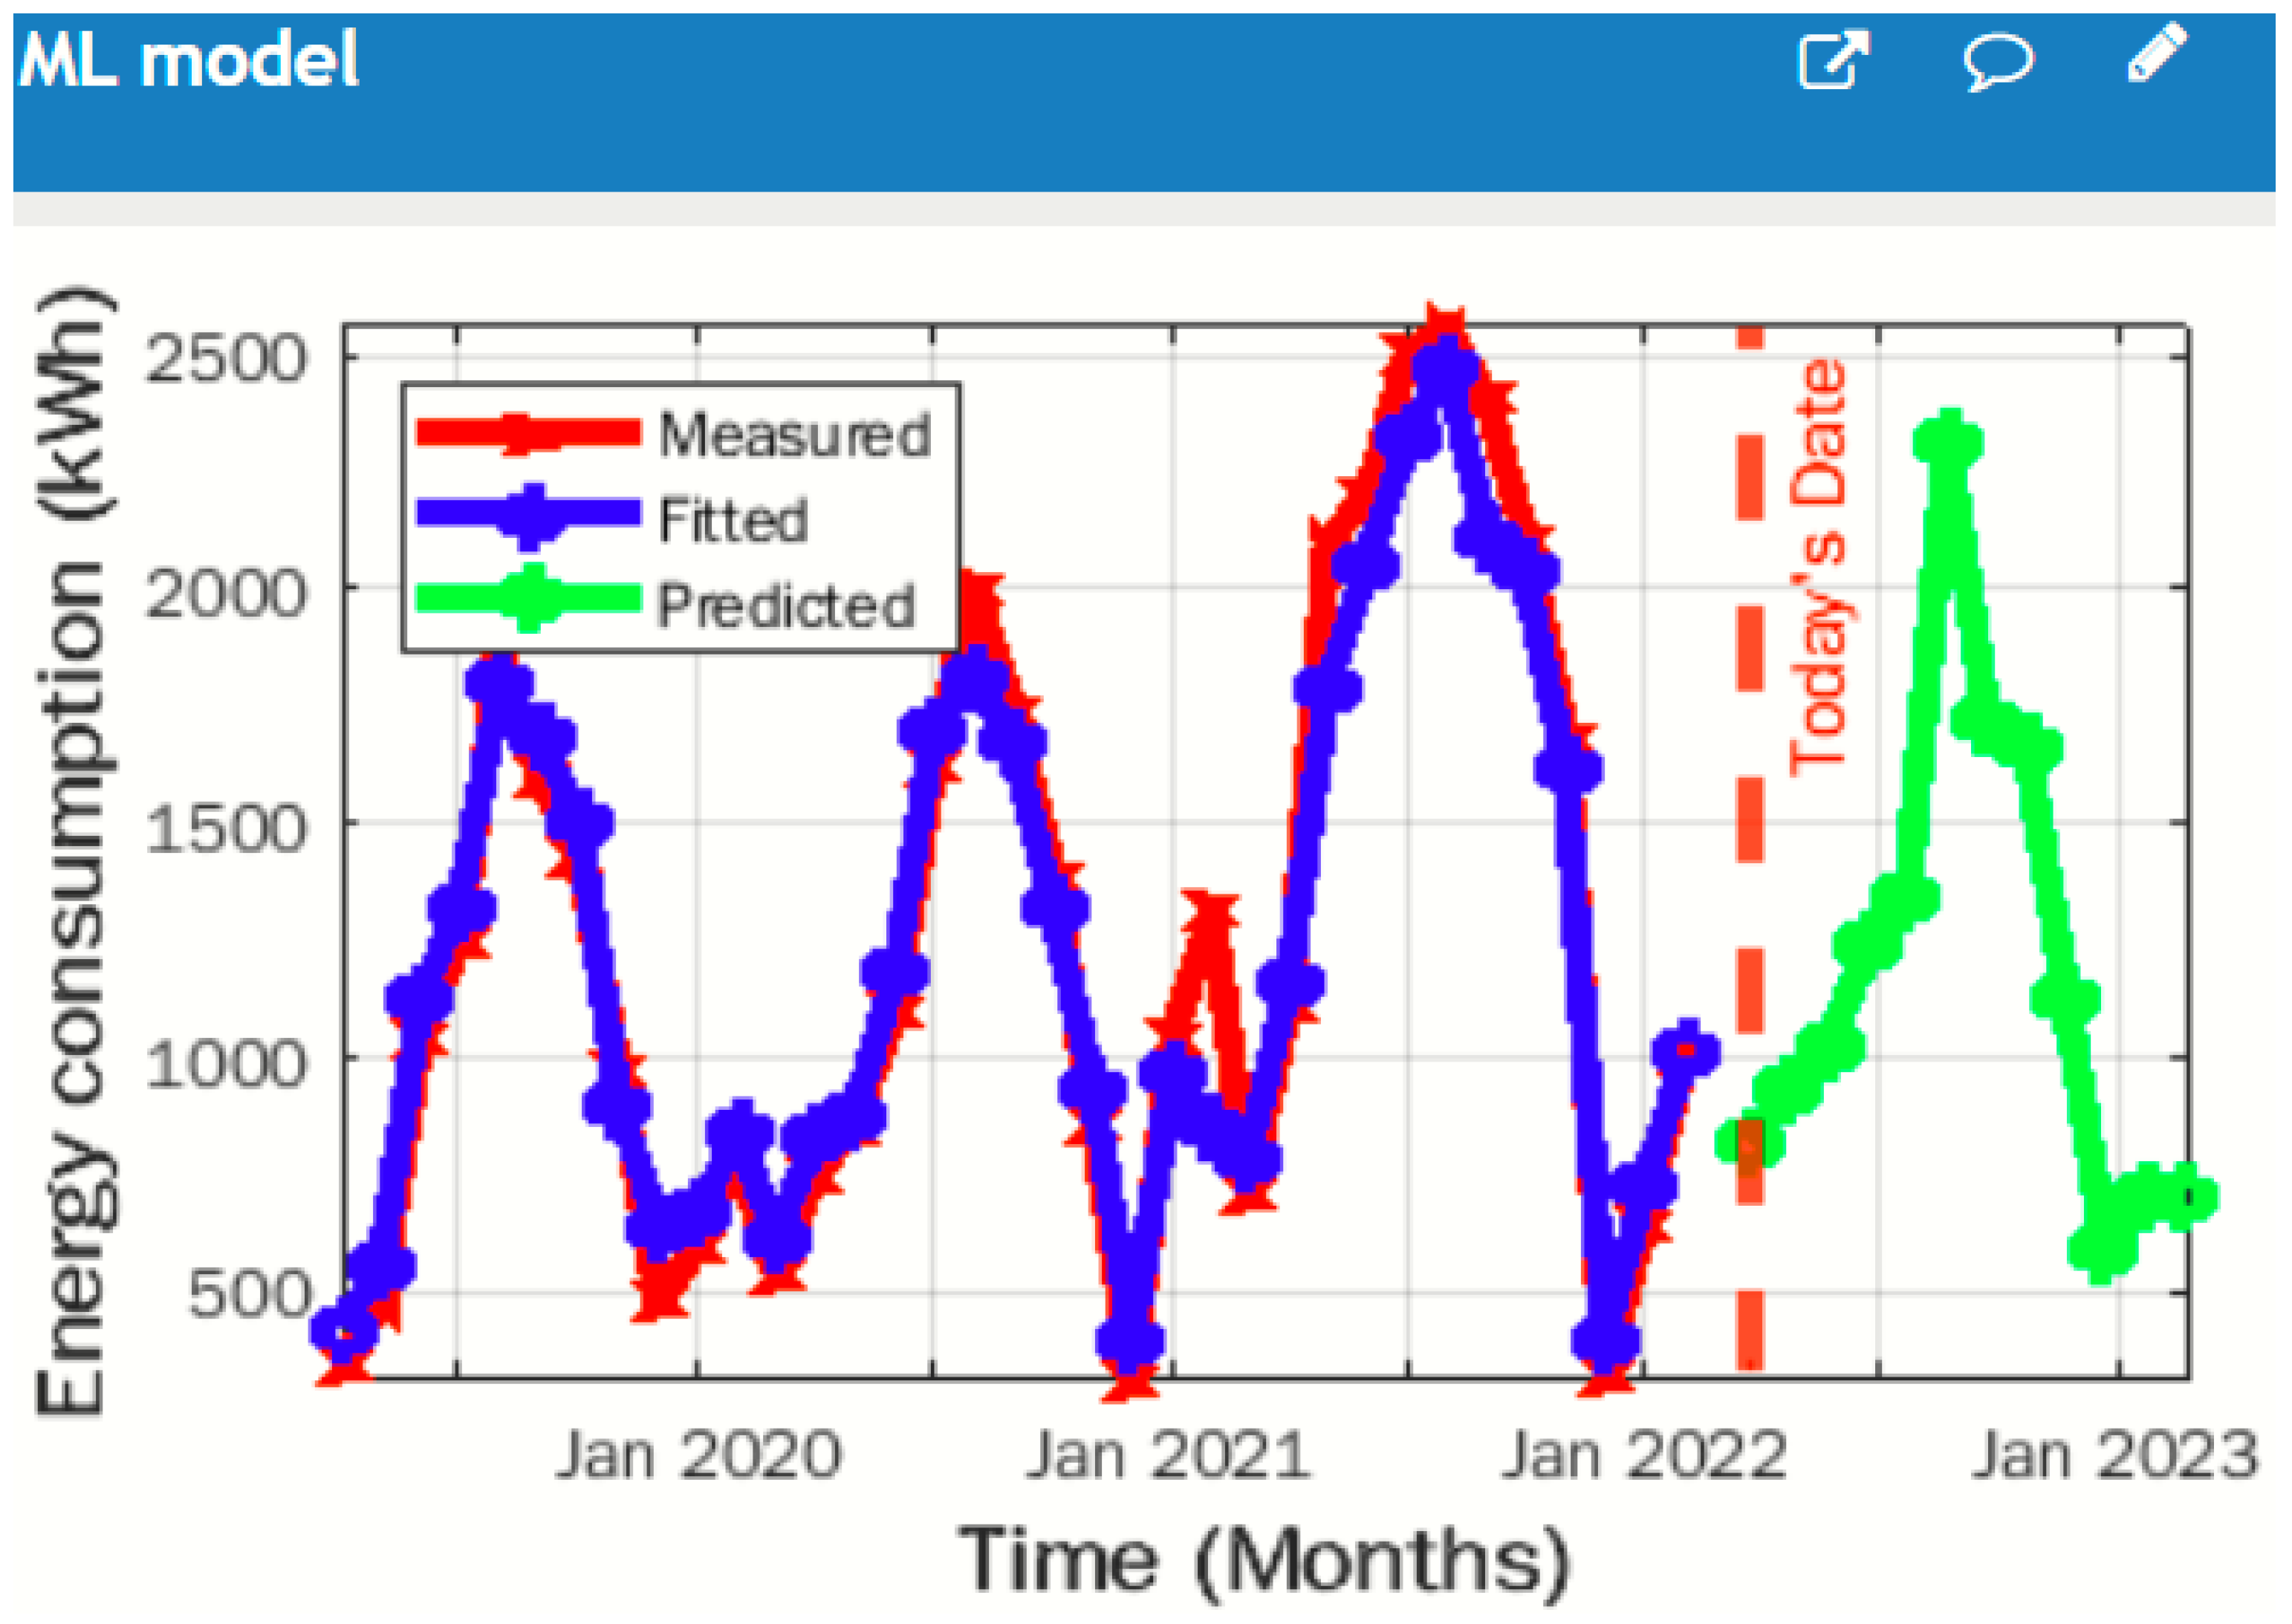
After validating the model, it was deployed into the cloud using the ThingSpeak platform. The training process was then carried out online and frequently updated with new data collected by the DPB. To display the forecasted results, future data of the weather predictors should be fed into the deployed model as inputs. This is achieved through importing forecasted weather data from specialized websites using the API feature in JSON, XML, and HTML formats [
43]. Another way is to build an online forecasting model to generate these data. The latter method was incorporated in this work using a simplified autoregressive model for each highly-correlated weather feature.
Figure 10 displays a visualization of deployed DPB load forecasting model on ThingSpeak. The forecasted data is displayed here for the whole coming year starting from today’s date. It is then easy to relate the predicted monthly consumption to the corresponding local energy prices and report them to the user.


